“Amazingly, as of tonight,” new host Tucker Carlson declared in hopes to build anticipation for a Twitter broadcast, “there aren’t many platforms left that allow free speech.” While Fox News took Carlson’s show off the airwaves, he promised to return quickly on the social media platform owned by Elon Musk. Having worked for networks across the political spectrum, from CNN to MSNBC to FOX, Tucker Carlson seems to know what he was talking about. Musk seems to have promised the very sort of guarantees of free speech–a lifting of all monitors or warnings about misinformation or the content of posts that were adopted in the 2016 election–by deciding to remake Twitter a site of “free speech” without any restraints–indeed the very safe haven for “free speech” that right wing pundits and partisans had long demanded. In rescinding any bans on political ads on social media sites, by which social media sites sought to dissociate themselves from political messaging, Musk set the basis for rolling back misinformation set a new standard that opened the gateways to racist, antisemitic, and homophobic tweets. The new notion of normative “free speech” led to the “unbanning” of accounts of high-profile polarizers with a limited relation to truth-claims–as “free speech” become more woolly and capacious as a form of entitlement.
But when he called his own de-platforming as a suppression of his right to speak his thoughts he claimed a constitutional liberty, invoking his freedom of speech, he raised the stakes to a boiling point to appeal to his viewers, inviting them to feel that they had an ability to preserve their one sense of “free speech” by moving, with him, from mainstream media and network news to the social network formerly known as Twitter. In parallel to the truly terrifying and unprecedented loosening of all restraints or gatekeepers on increasing hate speech and an efflourescence of antisemitic content on the social media platform per the University of Southern California’s Information Sciences Institute dating from Musk’s aggressive takeover,

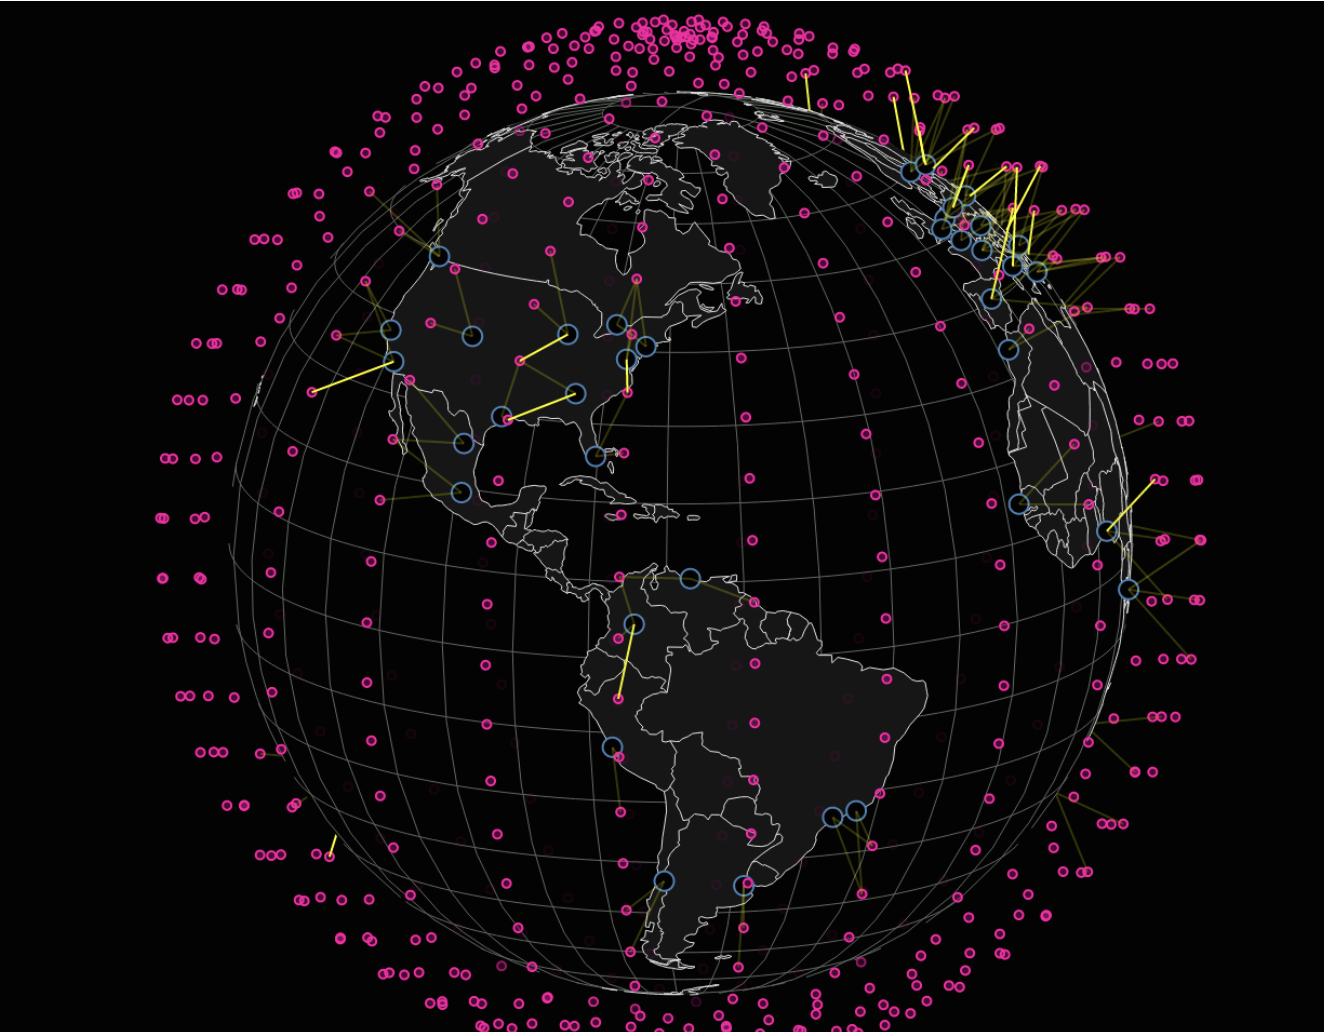
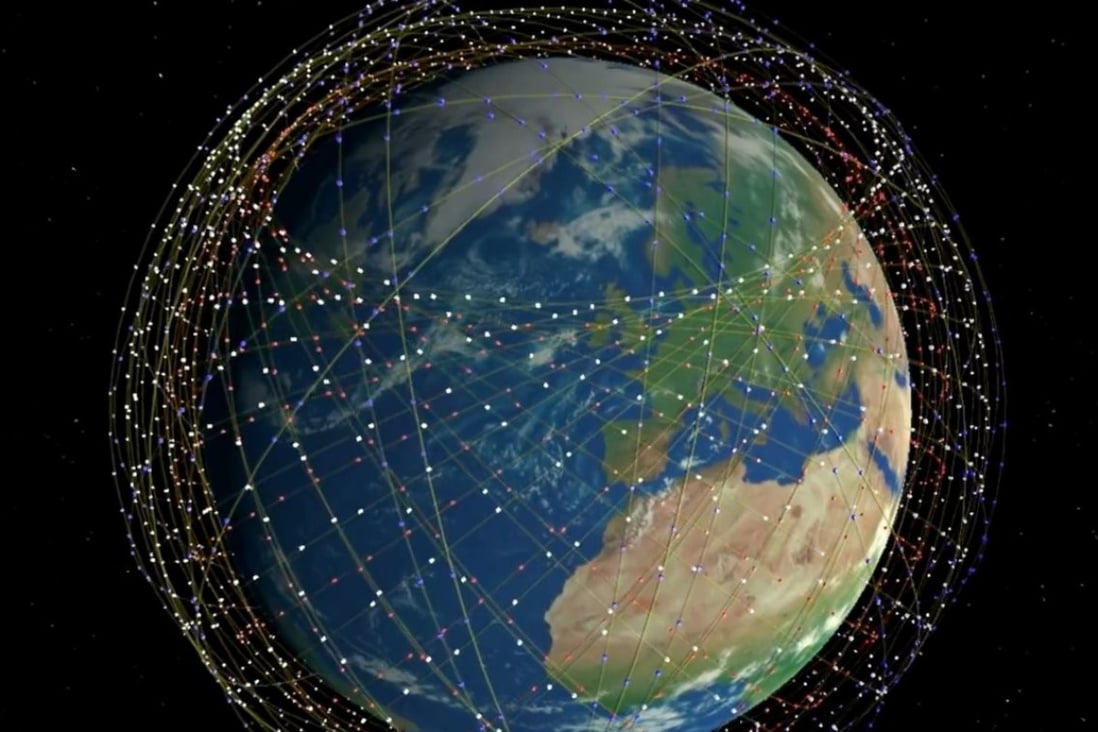
the same man who holds a disturbing dominance of global satellites via Starlink, Musk seems to have invited Carlson–and Trump–to help him enter a new space of media dominance. Already, state sovereign governments accused the owner of the network once known as Twitter of steering public discourse into a sovereign-free space by a Global Internet Satellite Network in dangerous ways. The network is perhaps designed to enable and feed off of, a new model for unrestrained public discourse, the likes of which we have never known, but will be augmented by 7, 518 low-earth orbit (VLEO) beyond 4,425 existing satellites, functioning as a cross-linked satellite system. If the social critic Roland Barthes prophecied with something akin to ecstasy that when labor-saving devices of the very sort that Musk’s self-driving cars promote would replace any need for work and “when progress will have rid men of every manual task, they will then to do nothing but discourse and kiss!” perhaps all they will actually do is follow. social media with bated breath.
Musk’s stated goals to make the social media platform X into the central staging ground and media feeding ground for the 2024 United States Presidential Election would be making use of Carlson–and of Trump, if in a quite mutually beneficial ways, suggests something like an alternate reality, surrounding earth with so much space junk to cause many astronomers to complain it is poised to compromise observation of far-off galaxies and nearby asteroids alike, weaving a web cocooning the earth’s atmosphere with the new litter of space junk: if geographer-artist Trevor Paglen warned geographers in 2016 to retool the focus of their disciplinary lenses on the immediate extraterrestrial pathways of satellite space, Musk forces Paglen’s cautionary argument.
Yet this business plan is far more than a conceptual art. It seems to strike at the heart of the news media system, and approach the predictive algorithms of psychographic profiling that Cambridge Analytica allegedly launched back in 2016, by opening up a free-for-all of communicative pathways.
Is this planned chaos? If Tucker Carlson’s decision may break his contract, it was a way of sticking it to his former employer. Many were surprised Carlson has continued to act as a center of gravity on “X,” posting interviews not affiliated with any broadcaster as if they offered uncompromising and unclouded evidence of “free speech” on the sole platform where it existed–X, as in SpaceX, a floating signifier able to carry any informational content. While the notion of a global lock on the news by a media elite is hopelessly outdated in an era of the fragmentation of monopolies by corporate news behemoths of a previous generation, the new libertarian owner of X has studiously tried to lead rapt listeners by a drip drip drip of insider news and heightened expectations for unvarnished honesty unavailable outside respected news channels–“More interesting than you think,” promoting the platform as “humanity’s collective consciousness,” deleting the ability to block other users, and hijacking other platforms. In rejecting formats of debate sanctioned by political parties or authoritative streaming service, Carlson was almost perfecting a cult of personality, more than the respect for the U.S. Constitution, that would of course appeal to the indicted former President, seeking to convince the nation he did not violate the U.S. Constitution, Donald Trump. (Trump pre-recorded an interview with Tucker Carlson to broadcast the first debate of Republican candidates for President on X, thumbing his nose at FOX executives by announcing he will miss the debate of a race for which he is front-runner, in a clever bit of strategic counter-programming designed to depress FOX revenues after they had let him go.) Although Carlson claimed to hate Trump “passionately” and “couldn’t wait” until the television network was able to ignore him, after a last-minute deal led Fox to cease broadcasting Tucker Carlson Tonight, Musk’s network fed the former President into Carlson’s new platform.
But if Carlson believes that he is entitled to continue to broadcast in Tucker on Twitter, claiming his continued “rights” to speak his mind to his base, having lost his broadcast platform, the lack of understanding individual liberty–and indeed rights–tell us more about his misunderstanding of rights–and the individual’s relation to the state in a democracy, even if he was talking about broadcasting more than “speech.” Carlson claimed that he had been ‘cancelled’ as if it were an honor and his destiny. “Tucker will not by silenced by anyone,” boasted Carlson’s lawyer assertively, as if going on the offense to guard the rights of a man whose “singularly important voice on matters of public interest” should be acknowledged to play a major role in the past as well as coming elections. Carlson’s lawyer claimed his client was in danger of being forced “be silent until after the 2024 election,” insisting that the broadcaster had every right to bond with the nation as effectively as that 2020 election map that froze ed and blue states into the logo of his NewsHour. The blurred luminous map that was the televised subconscious of the Republican Party was suddenly no more.

From decrying of “cancel culture” nightly, is it possible that Carlson “won the cancel culture lottery” by being able to port audiences to Twitter and outfox Fox? For Tucker Carlson, the dismissal from Fox was a slight that led the often over-confident anchor to be utterly confused: “I was first confused, and then shocked,” he claimed. “It was just, ‘We’re taking you off the air.’ No explanation why, and they’ve let me guess ever since. That’s literally all I know. I asked if I violated my contract. They said, no, I’m not fired, I’m still under contract.” The cancelling of Tucker’s airtime, he would argue in his defense, would cause damage to the nation, against the very constitutional freedoms that have defined the republic, might not be that absurd. While he suspected the “cancellation” was due to his strong opinions about the Ukraine War, rather bombastically linking himself to geopolitics with characteristic sense of disproportionate self- importance, noting that even if Rupert and Lachlan Murdoch “definitely didn’t like my views,” Lachlan, News Corp’s co-chair, was fine they disagreed. “The Murdochs were fine about Ukraine,” even if Tucker had mapped the conflict in curious ways that denied Ukraine’s sovereignty so blatantly they were rebroadcast on Russian state-owned news.
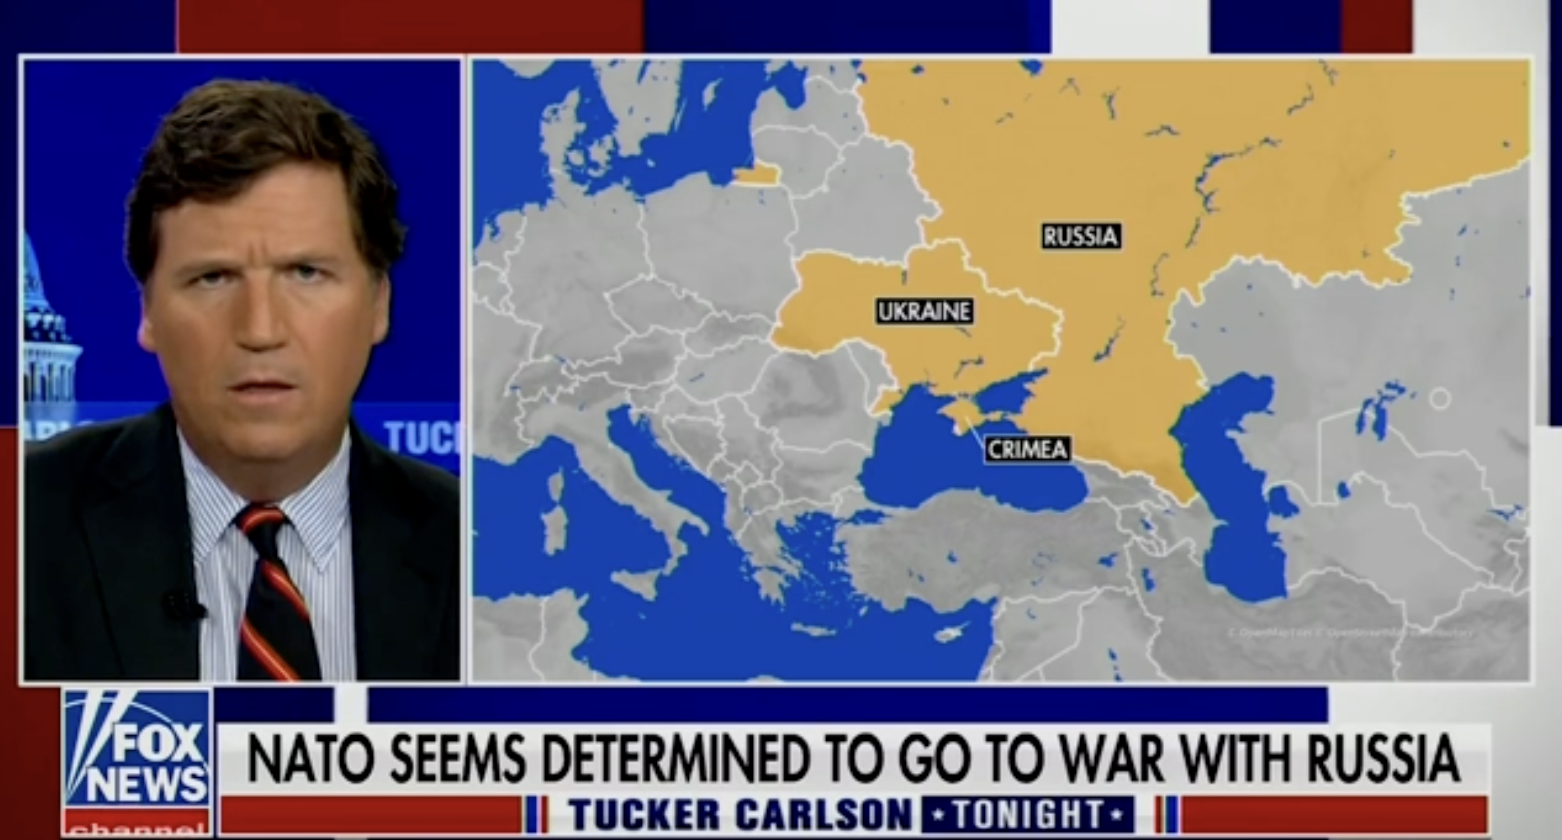
Intentionally sewing a cunning cartographic deception in coloring “Ukraine” and Russia by the same color–and not only Crimea–as if to dupe listeners into thinking the war a mater of secession, confusing the question of Ukraine’s pre-2014 and pre-February,2022 borders by arguing that Ukraine was unreasonably demanding “taking Russian Crimea from Russia” as a hostile act. In asking if NATO was “determined to go to war with Russia,” Carlson may have been exercising free speech, but was rather deviously and dangerously questioning Ukraine’s sovereign status. (Yes, Carlson had insisted, invading Ukraine would lead, as Russia said “many times, . . . would lead to nuclear war” and likened its Prime Minister to the “manager of a strip club” but was entitled to his free speech by his constitutional rights.)
In Carlson’s Fox Newshour, he had long decried how “fear of being ‘canceled’ due to unpopular political and cultural opinions or unsubstantiated allegations, often amplified with viral Facebook, Twitter, or Instagram posts, has become a serious issue in America.” Against the spectre of cancellation haunting North America, Carlson promised to tell audiences the stories of the victims most affected by it, presenting himself as the defender of a toxic cancel culture, found himself the most recently wronged star of the epidemic afflicting America, mutatis mutandi, rather than admitting past lies or apologizing. Rather than being a fractured shifting the newsmedia landscape in America, Carlson’s departure from FOX after six years was recast as typical of what was wrong with America, not the systemic lies about election fraud helped keep Trump’s cause alive.
This was now about his personal survival. Tucker Carlson long championed his role at Fox News as mediating the relation of individual to the state in a new electoral map. But his rhetoric reflected a disproportionate sense of self that seemed inflated by the podium Fox News had offered to address the entire nation, and to do so with the aim to magnify partisan divides. So much was suggested by retaining as an electoral map as the logo for the news show, which saw its survival as beyond any one person, and tied to nourishing and maintaining the new sense of national identity that 2016 had created with Carlson’s own help. With Carlson leaving the network, FOX seemed to have lost faith in the election map as an icon of the future, or the foundation of broadcasting, even if they had long promoted the Big Lie he had won the 2020 election. In getting rid of Carlson, they were cashing out of that long-iconi 2016 electoral map.
Carlson had become a global figure, far beyond the nation. He had relished this role as an icon of a movement beyond national borders, wishing “Godspeed” to all the Americans in Hungary as he bonded with the Conservative Political Action Conference that met overseas as promoting a fight that had begun at home as if he were a bystander in a conference that served as a platform for containing the “virus” of recognizing civil rights of migrants, LGBTQ, or the content of educational curriculum and, indeed, the press. The CPAC meeting of May, 2023 for which Carlson broadcast a prerecorded segment from his old FOX studios seemed a lovefest of sorts, as the Hungarian Prime Minister exlaimed “programs like his should be broadcasted day and night” in ways that only suggested Viktor Órban’s own tight control over broadcast journalism, as much as it recalled Soviet-style Cold War press beneath the blustery banner of questionable humor, “This Is No Country for Woke Men.” Cormack McCarthy, RIP.

Tucker Carlson Addresses Budapest CPAC Remotely in Pre-Recorded Statement, May 2023
The future conditional Carlson used to imagine his future firing in the segment he pre-recorded in the Fox Studios eerily anticipated his own actual dismissal from Fox News–Dominion Voting Systems already had filed its case by March, 2023, two months before Carlson spoke via video link at CPAC; it had perhaps already hinted–if this was never recognized as a demand of the legal settlement–that Carlson be released from the network. Tucker Carlson had already entered some legal hot water after parroting false claims of “massive electoral fraud” that seemed filtered straight from QANON screeds, in ways that had raised questions of how much Free Speech a broadcast journalist, if Carlson can be called that, enjoyed, even for Rupert Murdoch.
The global reach that Carlson’s news show had attained–despite its focus on American politics–suggested a pivot from the fomenting of electoral divisions that were made manifest in 2016 to a crusade of sorts that might continue unmoored from his old employer and old studio. The “pivot” was from a map of red versus blue states to anti-globalism, an agenda that’s been central to Carlson’s Twitter monologues on Ukraine, the truth of 9/11, and questioning the legitimacy of mainstream media. Tucker on Twitter became rebranded as a sort of Lone Ranger against globalism, as he had always been, to be sure, but was now holed up in his Maine house without the accoutrements that FOX had refitted in an old Grange Hall near his Bryant, Maine country house, as an improvised if convenient studio, but continued to tilt, a Sancho Panza for the new millennium, against globalist windmills–immigration; NATO; LGBTQ+ rights–snug in his own house in Maine seemingly from his own iPhone, where the Bill of Rights was pinned behind him on a rustic pine wall. There was something of a new mantra he seemed to have prepared for the new “show,” as much as the electoral map before which he had pontificated as he delivered the newshour in past weeks: “Free speech is the main right that you have. Without it, you have no others.” But this was not really a broadcast, or a news show, as much as the invectives of infotainment of another era.
Twitter was in a sense “outside the law”–or it least, this is what made it so welcoming in Carlson’s mind, as a terrain in which he might reasonably claim First Amendment rights–and Tucker indeed concluded his first monologue with a rousing pitch for Twitter as a platform to which all were entitled to spew lies. “Twitter has long served as the place where our national conversation incubates and develops. Twitter is not a partisan site. Everybody’s allowed here, and we think that’s a good thing,” Carlson wound up his monologue as the all-new Tucker on Twitter, reminding viewers that even as he remained under contract to FOX News, that Tucker on Twitter was a guarantee of their own rights: “Free speech is the main right that you have. Without it, you have no others.” Twitter isn’t mentioned in Carlson’s FOX News contract–as Brian Stelter, the latest chronicler of the struggle between Fox News Network and American democracy, has suggested might inform Carlson’s own legal strategy. Carlson may imagine that his Twitter monologues are a form of Free Speech, tied to his public persona beyond any network, rather than an expansion of the invective-spewing persona of the character he cultivated on Fox News for alt right constituents. The fiction is that Twitter exists beyond the nation-state, as would please Elon Musk, and beyond legal enforcement of his contract.
For his part, Carlson groused on Twitter few platforms allowed free speech anymore, in quite strikingly globalizing terms,–Twitter was “the last big one remaining in the world,” he seemed to seek to embarrass his old employers, and maintain his bond to viewers by portraying the news network as yet another curtailment of American rights. Carlson celebrated his presence on Twitter–whose owner Elon Musk had already hoped would be center stage in all future elections–to play defense on his de-platforming, but boast that his appearance on social media would be a defense of his personal rights, as well as a protection of the nation. It is as if Musk had advised Carlson’s grousing as a way to invalidate a contract by which he was “prohibited from rendering services of any type whatsoever, whether ‘over the internet via streaming or similar distribution, or other digital distribution whether now known or hereafter devised.'” He felt he had a deeper bond with his audience, or to American voters, to be silenced in the political arena til 2025.
While Fox was forced to let go of Carlson’s highly rated show as an agreement in the recent Dominion case, in which his sustained denial of the 2020 election results and defamation of their voting machines was so central, leaving a $20 million salary was only part of the network’s $787.5 million settlement with the voting systems company–Musk must have been more than happy to scoop up the highly ranked news show was appealing to one of the few billionaire with a powerful hold on news information that reaches what is left of the public sphere. While Carlson accepted a severance package from Fox News, he seemed to continue to speak from an old place on the map–as a defender of specious rights, inexistent privileges, and imagined protections, more akin to the notion that January 6’ers were exercising their freedoms by entering the U.S. Capitol, or that former President Trump had a privileged relation to the law. While Carlson believes his Twitter account is protected Free Speech, he confuses his media presence and his right to public speech.
Fox News and Dominion Voting Systems deny they demanded the removal of Carlson from the cable network in their legal settlement. But Carlson is portraying his dismissal as a denial of his rights to free speech in ways Musk must deeply enjoy. After being kicked off of Fox News’ platform. The map before which his divisive news hour had long aired as the highest rated on air suggest the dedication of his show to the sharpening of the nation’s political divide, however, as much as Carlson grandiosely claimed his rights to Free Speech as a reaction to his sudden and surprising de-platforming. The logo of the 2016 electoral map might be seen as a sign of the relative provincialism of his successful news hour: far more significantly, it was a sign of his opposition. to “mainstream” news media. If the CBS evening news had refurbished the Mercator projection of the world before which Walter Cronkite had presented the news from 1962-81 as an image of moral probity, which the station would refurbish in 2018, after having in 2016 swapped it out for video panels, the world map that had long been an emblem of trustworthiness and impartiality–

–was quite quickly recast as informed by bias, in an American political landscape defined by division, rather retreated from claims of objectivity. By 2015, CBS News featured not the flat wall map before which Walter Cronkite had delivered the nightly news with some probity, modernizing it as an extruded map colored bright gold, to keep in line with the times of HDTV, the post-election package designed for the news was thrown out by Carlson’s Newshour, which flattened the world to red and blue states. The smirk with which Carlson was ready to gloss the map, often blurred as it receded into the background, became glossed every night for 2.7 prime time television viewers in 2017, in what might indeed be called a nation within a nation, and a significant voting bloc.

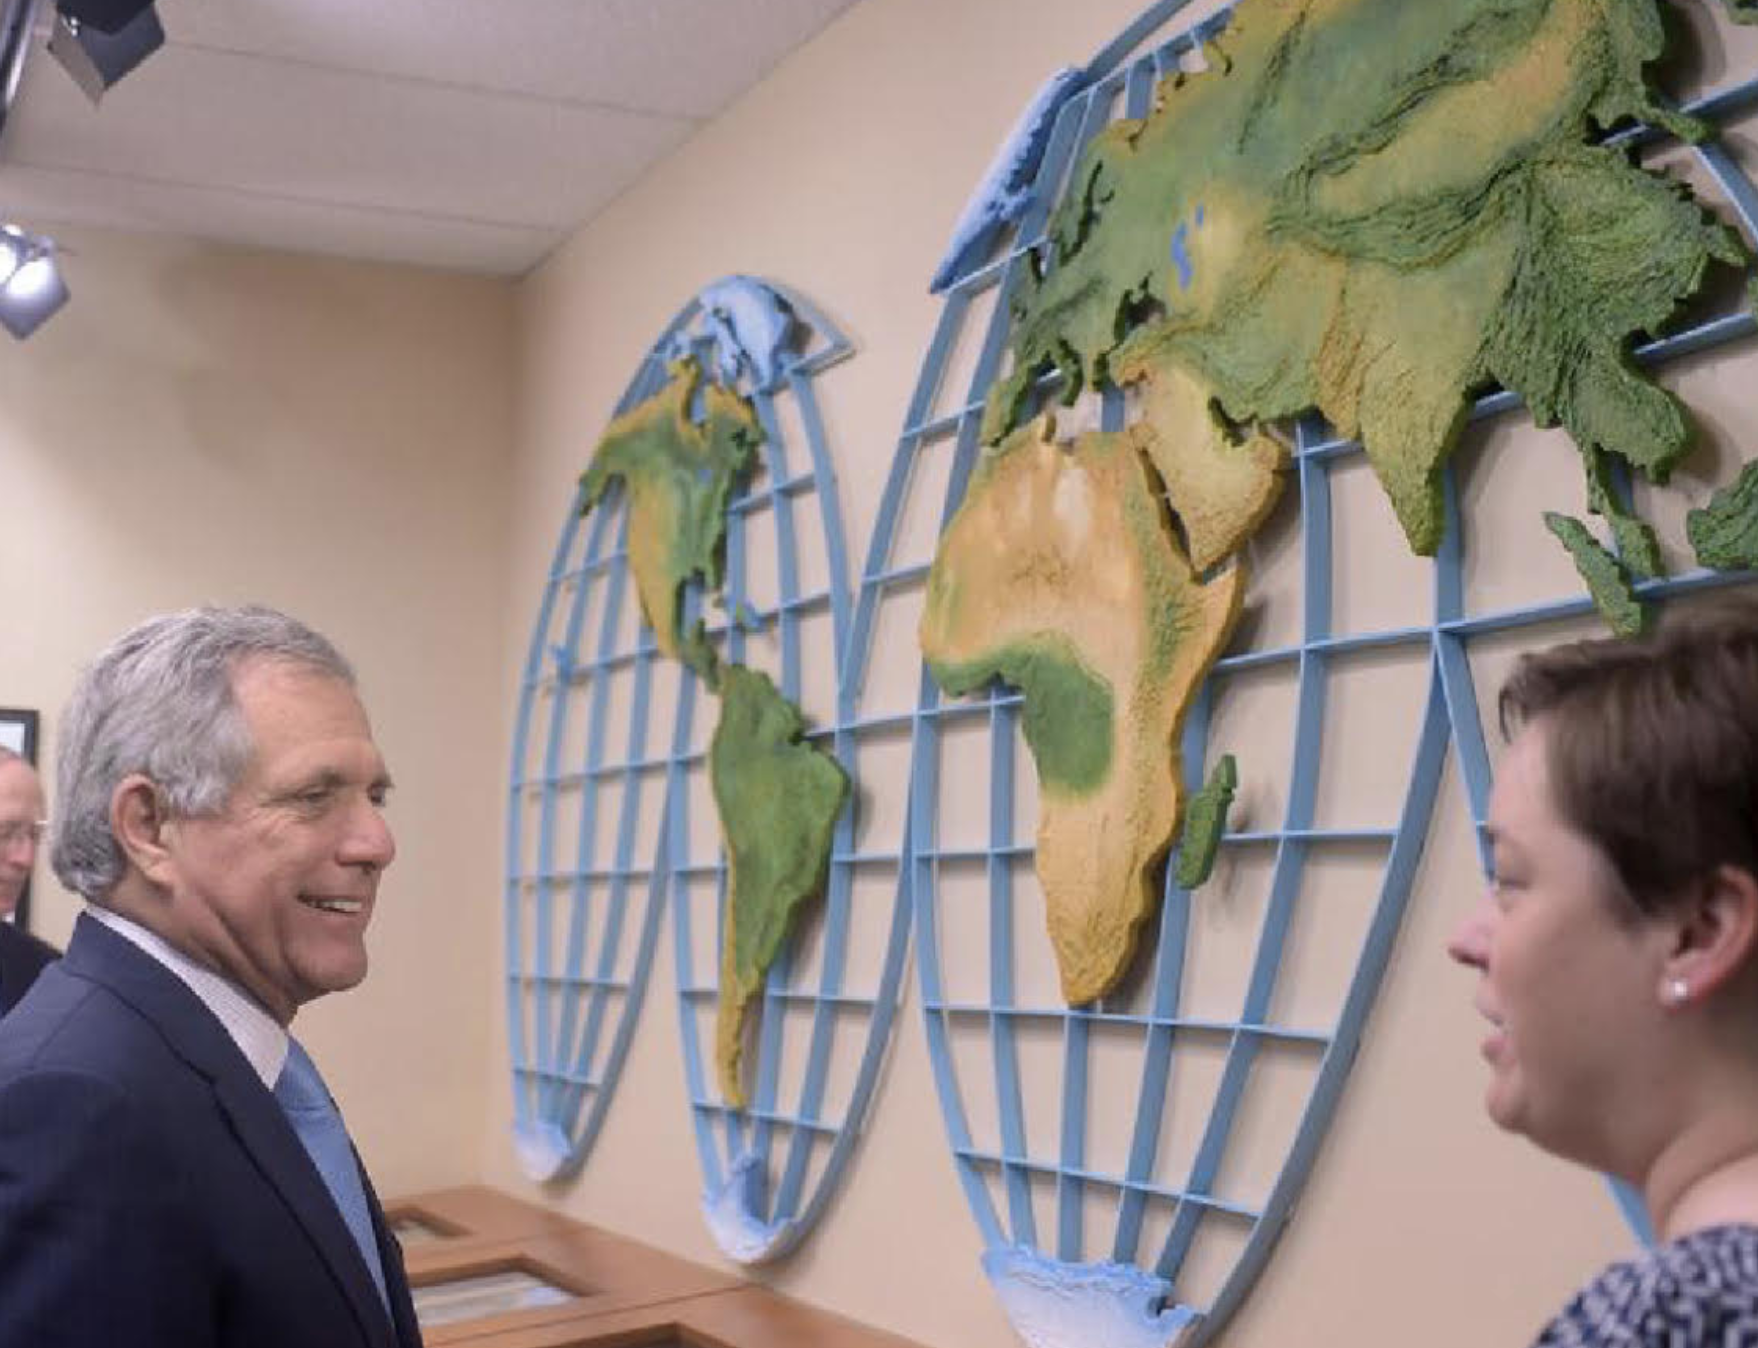
Never mind that CBS had started to use the revolving globe as its new icon of global news by 2009; Carlson’s map was a rebuttal of globalism, and global elites, cast against mainstream media and committed to revel the insidious interests by which the actual news in America was now defined. Tucker used an idea of Free Speech to deliver the unvarnished news, political beliefs born proudly on his sleeve, as Les Moonves of CBS celebrated a refurbished replica of the dimensional world map in a model TV studio in the Cronkite Memorial of Missouri Western State University in 2015.
This was not, of course, anything like what Free Speech meant, for the Founders. But Carlson cast his “deplatforming” as a violation of a foundation liberty. Carlson had of course recently re-aligned himself with “free speech absolutist” Elon Musk’s proclamation that Twitter was the new public town square of democracy. Tucker Carlson Tonight was dedicated to championing the freedoms Carlson championed on his long-lived show, whose life tracks neatly against the Trump Presidency, prolonged a bit by election denial into 2023, promoting freedoms that were portrayed as “under attack” from the left, while he assured his audiences that all other media “have succumbed to Trump hatred so obsessively . . . so much that they’ve begun to dislike the country that’s elected him,” rather than his open attacks on immigrants, civil liberties, racism and religious “freedoms,” and courting of the alt right. (The popular election of 2016 had of course tilted to Hillary Clinton: but, as seen in the header to this post, Carlson obscured that nightly, commenting on ‘news’ before a 2016 electoral map as if it revealed an actual national status quo.) The text messages admitting he “absolutely can’t stand” a former President who “could easily destroy us” may have seemed to destroy his longtime brand and public trust, declaring he long “hate[d] him passionately.” But Tucker Carlson flamed out in the light of the Dominion lawsuit.
Yet Carlson has continued to promote and his election denialism, calling 2020 a “grave betrayal of American democracy.” But he had undermined trust and credibility for the right, and as the attack dog on civil liberties that Fox News had birthed. Fox News sought to restrain his appearances on Twitter, Carlson announced he would never “be silenced by anyone,” as a lawyer leading the Center for American Liberty sought to defend his continued broadcasting on social media platform as protected by his First Amendment rights, and promoting it as a venue for his “response to the indictment of Donald Trump. The complicated story of how the Dominion suit involved the departure of Carlson from Fox News platforms led him to claim higher legal precedent, bizarrely claiming the infringement of his own personal constitutional rights of free expression, going it alone on Twitter as a confidence man of his own, even building a news room of his own in a work vest, plaid shirt, and axe, as if he were defining a new media frontier.

Gillian Laub, Time
The ‘freedoms’ with which Carlson long aligned his News show did not only reflect his own opinions: Fox News promoted many of the causes promoted by non-profits of the right, as the Center for American Liberty, that promotes religious freedom, targets protests of Black Lives Matter, Covid restrictions, or gender-affirming healthcare, as a sort of ACLU in reverse, founded in 2019, in response to “anti-free speech” and “anti-civil liberties” trends, dedicated to “holding those who destroy our civil liberties accountable through the courts” and promoting “traditional Judeo-Christian values,” by pursuing suits against school boards, Kaiser Permanent, parental rights, alleged victims of Antifa violence, the vaccine mandate by suits intended to keep schools open, and indeed “Big Tech Censorship” that included both Twitter and PayPal as “oligarchs who threaten American values.” Carlson now elevated Twitter as a bastion of Free Speech in its new owner’s vision. (Tucker Carlson has incidentally elevated Twitter from ephemeral media to a repository of apparently considerable historical significance: his alma mater Trinity College features in Fall, 2023 a co-taught course in Writing, Rhetoric, and Media Studies departments, for which Carlson and Jesse Waters assign reading all of Trump’s tweets as a corpus, beside the post-Civil War inaugural of Andrew Jackson and Adolf Hitler’s Mein Kampf.)
While it was hardly new that Carlson acted aggrieved, as if his own rights to free speech had been denied, by recasting his own abusive behavior as a preservation of rights he seemed to tailor a new sense of free speech familiar to his demographic. The “denial” of free speech rights was a relatively recent bête-noire of the alt right. From calls to speak out “against the numerous attempts by college administrators to limit and attack students’ free-speech right” as “free speech zones” that were argued to restrict “a culture of free expression and develop in students a robust ability to reason” began a narrative of repressive left Carlson seemed to parrot. The multiplication of “free speech zones” at political conventions, areas of protest, or during the war on terror made the mapping of areas guaranteeing freedom of expression protected by the first amendment a contested concept of civil rights–isn’t the entire country a free speech zone?–and the emergence of “free speech zones” on universities have created real limitation of public protest and had restricted freedom of speech at over three-quarters of universities–even as judges have questioned the limitation of “free of speech zones” on campus, and legislatures in multiple states passed prohibitions that outlawed the establishment at campuses of “free speech zones” in conservative states suggesting the different natures of “free speech” in a starkly divided partisan map: Kentucky, Missouri, and Virginia became sites championing “free expression” and “individual rights in education” from 2014-17, as claims to “free speech” preventing restrictions on political or hate speech grew in the aftermath college protests of the election of President Trump. Legislatures restrictions on the curtailing of free speech zone polices, as a ballast to academic freedom,–

–in ways that alt right media like Breitbart embraced as a the rewriting of claims to free speech, claiming censorship by universities, as if to protect free political expression–even if such expression embraced incendiary anti-immigrant rhetoric–that challenged boundaries of “free speech” in unexpected and unprecedented ways that Carlson seemed to invoke more than the Bill of Rights had ever intended. While he cast his intentions as an echoe of the First Ammendment, Carlson’s own pursuit of polemics pleasing the alt right white supremacists was long known–it seemed he had targeted the demographic in attacking mainstream news–to provide alternative news able to unite an increasingly intolerant partisan political constituency that was as rooted in anti-intellectualism as it fetishized the freedom to hold hateful positions. Free speech was expanded as a megaphone of public address on social media, as the logo of “Campus Reform,” a news organization backed by the funders of Breitbart, dedicated to exposing liberal “bias and abuse” in American universities and colleges to delegitimize higher education around issues of free speech.
As the new terrain of “free speech” expanded from civil liberties to anti-immigrant rhetoric to Black Lives Matter to anti-vaxxers to mask-wearing, it embraced shelter-in-place policies in the COVID-19 pandemic, school closures, and public health responses before election denialism. Ever broader and broadened concepts of “free speech” became a surrogate for perpetuating persistently deep fissures in the body politic, boosted in no small part by Tucker Carlson’s news show on FOX. Tucker Carlson Tonight embraced an algorithm oriented to the distortion of free speech, and created a demographic that distorted free speech from the freedom of parents to protest school curriculum, as learning institutions were attacked as restricting abilities of open inquiry and “debate” by mandating reading lists. “Restore Free Speech Acts” had earlier emerged in local state legislatures to push back against such perceived restrictions. Carlson reached back in his recent relaunch on Twitter–his first appearance on airwaves after leaving or being let go from Fox News–to echo the image of a restrictive environment of free speech by those who sought to push the envelope of foundational freedoms and the Bill of Rights as protecting the open circulation of ideas online, and the end of “free speech zones” at universities that legislators had introduced back in 2017–more than the Bill of Rights that was framed in 1789. The partisan legislatures tied to red states, from Texas to Louisiana to Kentucky, vacated the “free speech zones” on university campuses, long before Donald Trump.

States Where Bills Preventing Campus Restrictions on Free Speech Were Introduced, 2017/Campus Reform
Maps of free speech seem to have broadened to free speech zones in the media, often adopting notions of free speech not based on expression but social media platforms and the fears of a restriction of political speech in a specter of de-platforming. Broadened claims for the protection of free speech was condensed to an electoral map every night on Tucker Carlson’s popular news hour. As Free Speech was rooted in the algorithm that brought his messages to millions and reached the right audiences, invoked against deplatforming, as if his sprinkling of volatile statements designed to open a greater cleave in the electoral divide was rooted in a freedom to collapse complicated and considered political debate into an ongoing strategic battle between two parties and ways of life. To be sure, this was “free speech” as understood in terms of a search for ever-higher ratings, a “free speech” that was in a sense modeled after alt right journalism, coopted by @realDonaldTrump, “liberties” easily seen as shaping a battleground for electoral votes.


The understanding of “fundamental freedoms” that expanded the electoral footprint for partisan ends was a great feature of his Fox Newshour that was embraced by Lachlan Murdoch and Rupert Murdoch, until the Dominion case. As much as due to unethical improprieties, the settlement with Dominion seems to have stipulated that Carlson cease to appear on Fox News, who curtly if promptly decided to “thank him for his service to the network as a host and prior to that as a contributor.”
Tucker Carlson sought to stake out somewhat familiar higher ground. Carlson’s post may have channeled Musk, who cast his social media network at the center of a “battle of civilization” in promoting Twitter-without-monitors as a vanguard of free speech, tweeting out, “if free speech is lost even in America, tyranny is all that lies ahead”! As Musk tried to represent or rebrand social media without constraints on hate speech or disinformation as American, issuing the latest iteration of his Messiah complex on his private social media platform, gaslighting the nation has long been Tucker Carlson’s principle trade. Branding of the social media platform as a venue for free speech may have been suggested by Musk in an invitation of Carlson–the most offensive of pundits–to the social media platform. Carlson waxed elegaic on free speech as the rarest commodity, affirming dedication to protecting speech though he lost the platform of Tucker Carlson Tonight, the highest-rated show on Fox, as if his departure his new venue was his free choice, or a changing media landscape, not how his own alienating comments and actions left him damaged goods.
The global scale of Carlson’s claim about Twitter was absolutely self-serving, to be sure, as much as an illustration of Musk’s uniquely deceitful brand of “free speech absolutism.” He sought to flatter Musk, his new platform’s host and sole proprietor, and to offer a powerful dig at Fox News, by upsetting the algorithm in his own favor, as if he were able to wrest it back from the Murdochs by becoming his own media figure, so much as Twitter offered him the chance. He claimed to have thrown his lot the last remaining safe space in media, and turning his back on television in disgust. Carlson was long habituated to rail against the media, and offer the alternative story of the disaffected and aggrieved. But this time, aligning himself with a “free speech absolutist” eager to attack Twitter for “failing to adhere to free speech principles” as a platform before purchasing it, and doing so only to make it a “public town square” of democratic value. Yet he fired all objecting to his corporate policies and politics, if he felt censorship of a social media platform was unethical. The two-faced nature of Musk firing employees he disagreed modeled ‘free speech’ as a fundamental freedom born of a social media ecosystem.
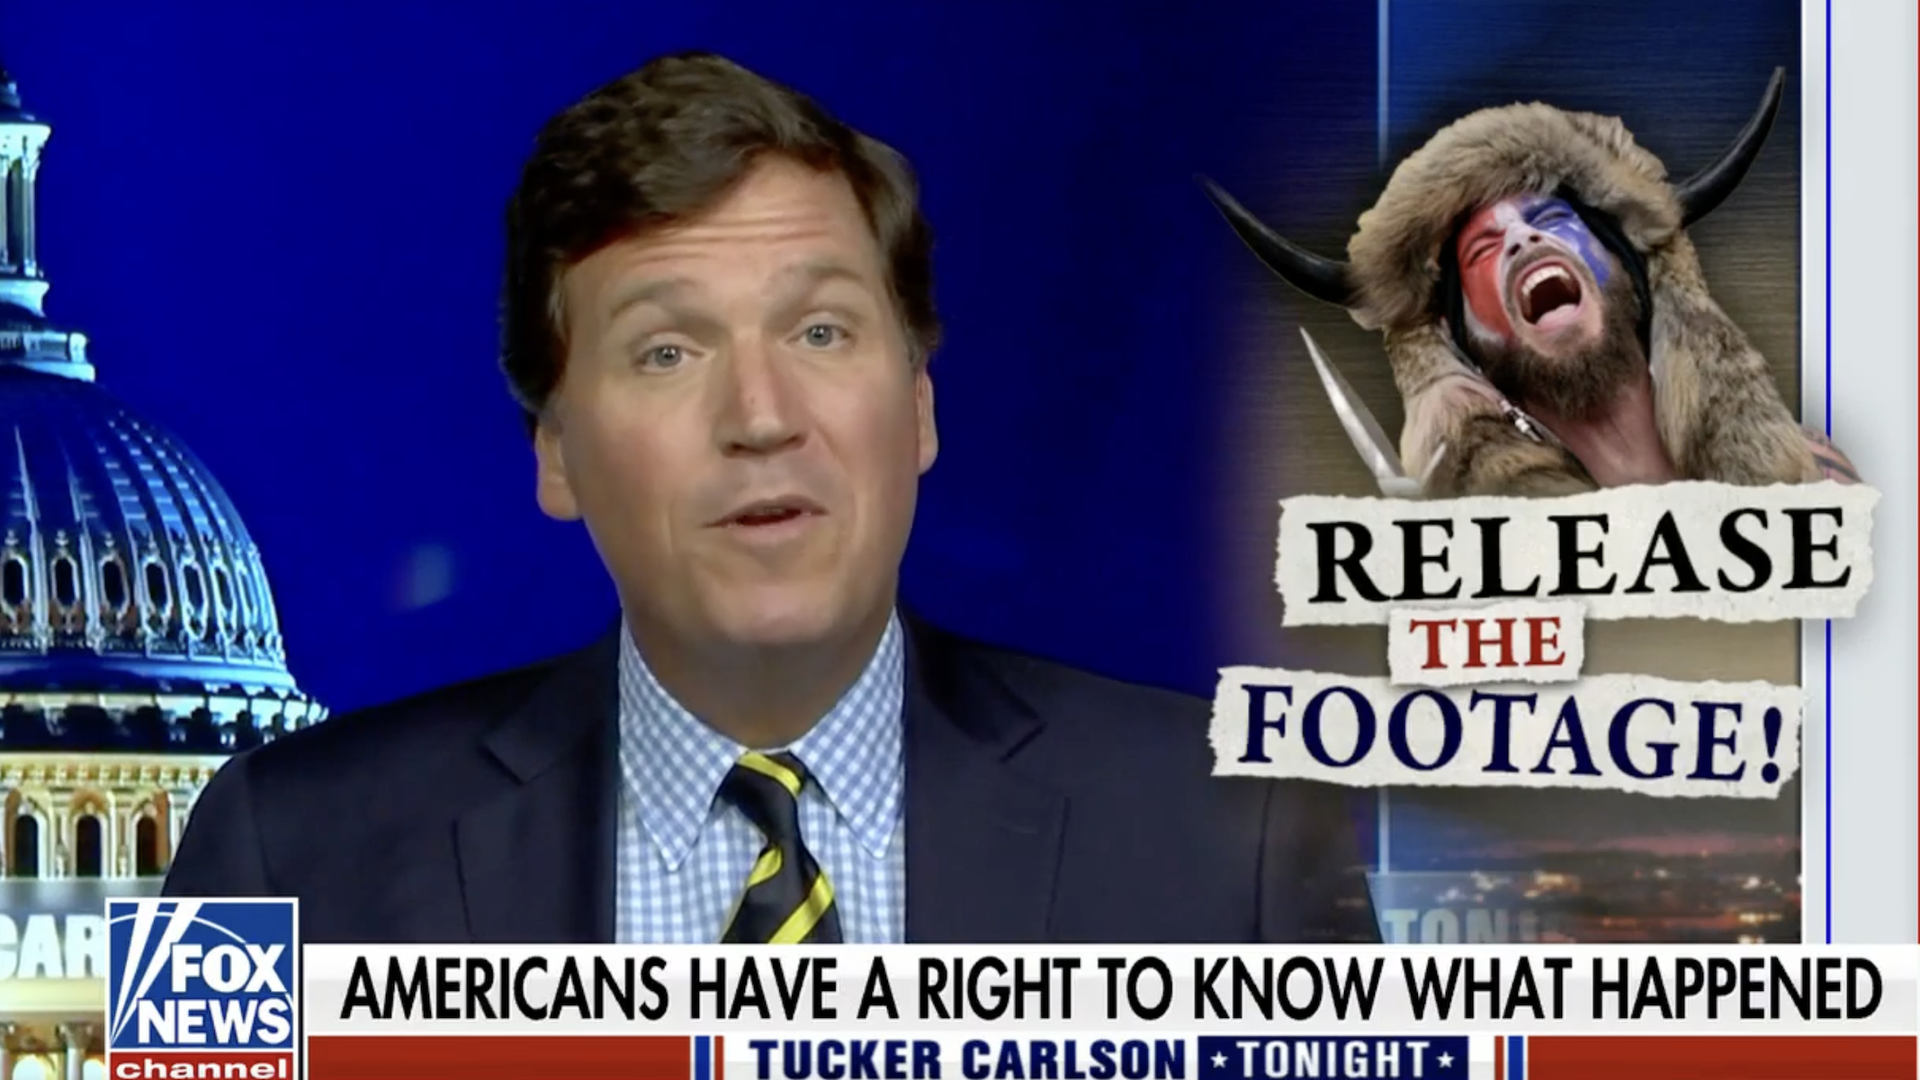
Long before Carlson’s revisionism of the January 6 Capitol riots, calling “mostly peaceful” the violence begun as President Trump dramatically enjoined crowds assembled before the Capitol building to “fight like hell” to contest 2020 election results then being tabulated by Congress, Carlson forged the combative nature of “free speech” as a pragmatics of perpetuating hyper-partisan social divisions of a sharply polarized nation in alt right media as the Daily Stormer. He perpetuated divides displayed in a dated electoral map of 2016 as a battlefield map on the new show premiering after Trump’s inauguration in 2017, as a realpolitik of broadcasting. When Kevin McCarthy gave Carlson secret footage of the Capitol Riots to allow viewers “to see the truth” of “exactly what transpired that day” in a “media exclusive,” he perpetuated claims of election fraud he claimed protected by a freedom of speech. And if the riots were dedicated to the resetting of a historical narrative and apparent shift of legitimacy–a shift of the historical understanding of the nation, oriented not to 1619 but to 1776 or 1492, the historical recreationism of January 6 was not cosplay but a rectification of revolutionary time,–a restoration of white men in Washington, and a right to bear arms, and to restore racial supremacy, all of that was embodied by Tucker Carlson.
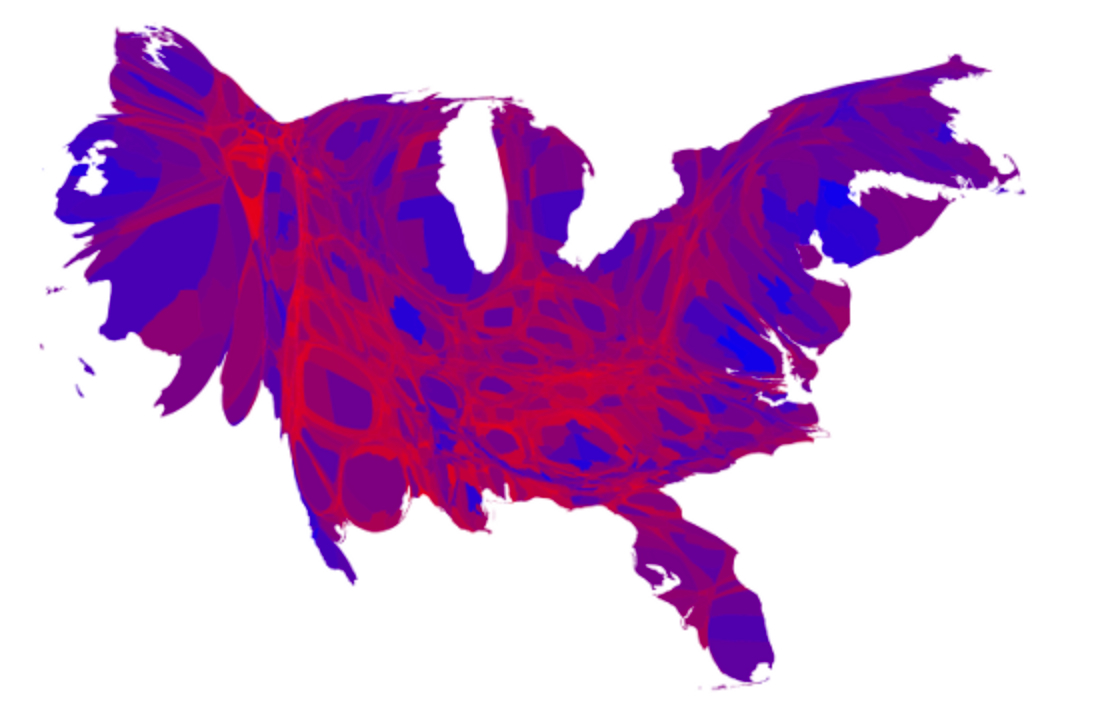
Although he had hosted a news show for six and a half years since Trump’s election, before a map of the fragmented nation polarized by partisan divides; free speech, he suggested, no longer existed on mainstream media. However, he was without the tell-tale map that was a longtime logo for his news show–a news graphic of 2016 that had become the permanent illustration of the status quo he sought to address, and to filter all “current” events, as if in a time warp from the 2016 Presidential election, that showed the country divided, or nation split, into two sharply divided nations, hued red and blue, that formed the perspective to which his commentary was addressed. Immediately after Trump’s inauguration, Carlson was broadcasting live from Washington DC, promising to guide the nation on “a live hour of spirited debate and powerful reporting each night, as America gets set for the administration of President Donald Trump,” while only addressing half the nation. While preparing perspectives on news able to “bring you to every corner of America to hear from you and tackle the issues you care about” engagning “what the other outlets are missing and what the media isn’t telling you,” Carlson’s brand was to supplement the mainstream media by dedicating himself to “calling out the status quo in his signature style,” using his status as founder of The Daily Caller to reach a large 2.8 million since starting to air, and gaining viewers across demographics by speaking to a divided United States electorate by presenting issues through the fierce urgency of now.
Or was this an image, a counter map of the traditional newsman that showed the planet since the studio of Walter Cronkite, a representation of the new limits of the expansiveness of free speech? The visualization of the continental United States–the lower 48, and the continuous heartland at its center–offered an image of belonging that was talismanic for the TV audience, and a powerful image of belonging in an increasingly atomized United States, bowling alone and with few ties in its neighborhoods. Carlson was its prophet and its oracle, and effectively ventriloquized the divides with such success that he had become a channel for Donald Trump himself. Despite his affirmation of the stolen election, and the credence he gave to January 6 protestors, without that map Carlson was suddenly weaker, suddenly punctured by the actual news.
Carlson’s celebration of his relation to the partisan position of the former occupant of the Oval Office and to the Trumpian talisman of his news show was far less powerful, even after January 6.
The map of the Lower 48 was a nice means to deny global warming, to ignore weather maps, or international politics, and even the real pressure migrants face. It was an image of the New Isolationism, America First for the twenty-first century, an image without rising temperatures, sea-level rise, or global economic forces beyond Americans’ or America’s control. Yet in a few weeks, Carlson was deemed a social liability by Rupert Murdoch, after winning unprecedented ratings as Lachlan Murdoch’s darling, as the Dominion lawsuit unwound and his own indefensible offensiveness was revealed. In a departing dig at Fox News, as well as an encomium to the social media platform he was about to join. Yet without the map of a permanently divided landscape of politics, promoting a polarized landscape split by partisan hues as a different reality, the values that Carlson was suddenly so desperate to fall back on–the Bill of Rights–as a language of the aggrieved was all too inappropriate and far less credible or effective. A trademark of he tried to remind his most loyal viewers that “Speech is the fundamental prerequisite for democracy”–as if speech were the same for the Founding Fathers as in an age of de-platforming, claiming a right of redress as an aggrieved media pundit, hailing Twitter as a unique preserve of republican liberty. (This much must have come as music to Elon Musk’s ears, who convinced Ron De Santis to declare his own candidacy on the medium–even if that didn’t go so well. But it didn’t break Twitter.)
Tucker Carlson may have had few grounds to claim free speech was violated, but there was of course a clear precedent for claiming such rights of free speech. For this formed the grounds by which Fox News lawyers had quite successfully defended him in a recent defamation case brought by Karen McDougal, who Calrson had treated as a punching bag while at Fox News with something like barely concealed glee. Fox News lawyers had successfully argued Carlson was in his rights to speak derivatively of McDougal, the 2020 verdict of a federal judge agreed, as no “reasonable viewer” could be expected take his show literally–he was, it ruled, “not ‘stating actual facts’ about the topics he discusses and instead only engaging in ‘exaggeration’ and ‘non-literal commentary.'” The successful dismissal of claims of slander was made on the grounds that “Mr. Carlson’s statements were not statements of fact,” and could not be interpreted as defamatory as such. The indefensible on-air statement that McDougal had “approached Donald Trump and threatened to ruin his career and humiliate his family if he doesn’t give them money,” as if she were an extortionist. (The court ruled Carlson’s words could not be interpreted as slander, or containing “malice” as but, as FOX lawyers argued, “delivering opinion using hyperbole for effect,” in an odd echo of how Donald Trump advocated “truthful hyperbole” to negotiate good deals in his 1987 Art of the Deal.)
Carlson seems to have accepted the verdict as a sort of license of his defensible rights to issue slanderous broadsides by converting political debates or even personal actions into the crisp colors of a partisan divide, a divide that was embodied as it had never before been by the very electoral map he used as a backdrop if not leitmotif for his show since its 2017 premier on Fox. He had staged a nightly news show to gloss the partisan divisions of a polarized landscape as the new status quo, harping on cultural resentments that divided the nation by district and county, as they existed as his show began, as an electoral landscape he would perpetuate and perhaps expand, and reinstate beyond the divisions of 2017 as a permanent map by which to understand the news–and the place of the nation in the world. Keeping open the sharp divides of a seemingly “continuous” red block and fractured blue in place was the grounds for his daily show, and the work of perpetuating the map had become glossed as a form of free speech.
Having left the highest rated show on cable news for huffing it on his own, he invoked his rights to free speech again, as he attacked mainstream television itself. This time, his status as an outspoken commentator was infringed by his former employer, it appeared. He sought to invite his audience to follow him onto the new Twitter platform, as if it was a preserve of free speech. He had discussed the infringement of rights–from the rioters of January 6, whose peaceful invasion of the Capitol he culled from exclusive footage of the thousands of hours Kevin McCarthy granted of “secret” footage that day, to Donald Trump himself–in recent shows, using free speech as a sacred cow. The protection of freedom of speech that Carlson had conspicuously denied Black Lives Matters protesters–who he disparagingly cast as a mob whose violence that threatened the nation–clothed both January 6 protestors and his own show. Never mind that Representative Zoe Lofgren, D-CAL, who had served as a member of the January 6 Committee, felt that Carlson’s broadcasting of the footage “a road map to people who might want to attack the Capitol again.”
In presenting himself as a champion of Free Speech, Carlson claimed the higher ground, as if his constitutional rights had been infringed, in ways that were not only aggrieved. Of course, his rights to speech were quite from curtailed–he was an evangelist of the right whose outspoken claims made him a darling of liberty at the Turning Point USA’s AmericaFest,–

–and he had become an international figure of jet set global conferencing with national leaders outside the United States, at the first meeting of the Conservative Political Action Committee outside of the country. Carlson had delivered speeches at the invitation of right wing anti-immigration strongman Viktor Orbán, whose cry to “take back the institutions in Washington and Brussels” led him to summon Tucker Carlson to Hungary as he sought to remake it as a bastion of conservative Christian values long before 2021, quenching the opposition media and openly urging audiences to stand up against the “rule of the liberal media” as a form of “Conservative resistance to the woke revolution.” Of Orbán dressed outrageous ethnic nationalism as a form of libertarianism, he seemed to have ripped a page from Carlson’s rhetoric, taking him on a helicopter tour of his own “border fence” that led a perhaps mystified Carlson to return the favor by calling Hungary “a little country with a lot of lessons for the rest of us,” terrifyingly gestured to the media monopoly that Orbán created in his illiberal democracy that silenced all opposition in the nation.
Carlson suddenly found himself suddenly an international media star, basking in the attention he won overseas from a man who was an icon of conservative demagoguery. Orbán’s extreme hard-line policy of rejecting asylum- seekers was an outlier of liberal democracies indeed–which Carlson eagerly promoted as a model for American immigration system he calls far too lenient and argues was poised to weaken the power of native-born citizens in ways that aped White Supremacists. Was this a watershed in his defense of what he called free speech, or a new height of self-deception? Carlson’s 2021 visit to Budapest followed a range of anti-LGBTQI laws by the Hungarian parliament, issued to help Orbán cling to power in ways that rested on a profound rewriting of the mediascape of the nation: the refusal of legal recognition of transgender people in Hungary, and enshrining birth sex in Hungarian law, ws normalized transgender discrimination that culminated in bans on any application for change in gender recognition by 2023–legal barriers to gender recognition that became widespread in much of the United States (more alter). When Carlson was forced to participate remotely In the 2022 meeting of CPAC in Budapest, he vouched “I wish I was there in Budapest,” adding in terms that now seem irenic that “If I ever get fired and have some time and can leave, I will be there with you.” (Carlson had found virtues in Hungary’s limited free speech–Orbán has clamped down on media coverage of the Ukraine critical of Russia, as if Trump could end the conflict–“Come back, Mr. President, make America great again, and bring us peace!”–that he blamed on the United States as CPAC imitated Hungary in allowing only alt right journalists to cover the event, rather than the Associated Press.)

Fox News’ Tucker Carlson visits Prime Minister Orbán in 2021/Office of the Hungarian Prime Minister
Prime Minister Viktor Orbán’s policies in Hungary against trans people and gender reassignment has made him a hero on the alt right, a weird affirmation from afar of a charge against “global progressive elites” who promote immigration, transgender and LGBTQ+ rights, bundling them as a “virus” in need of being defeated by a “Christian conservative turn” that offered a model for how right-wing culture might defeated and dispatch “woke” agendas in its defense as a bulwark of Christian democracy, conjuring Hungary’s historical role as a buffer-state of the Austro-Hungarian Empire against Islam. The ban on public depictions of homosexuality in Hungary or any promotion of sex education became a way to for Orbán to emphasize his protection of Christian values: “No Country For Woke Men,” read banners at the CPAC conference he hosted in 2023, proclaiming his nation an “incubator” of “the future of conservative policies” world-wide to energetic applause. (His censorship of the media were elevated as a model for American CPAC leadership who vowed to “go Hungarian,” deciding “who is a journalist and who is not a journalist” for entry to their events, as universities were transferred to being run by Orbán cronies to silence free speech.

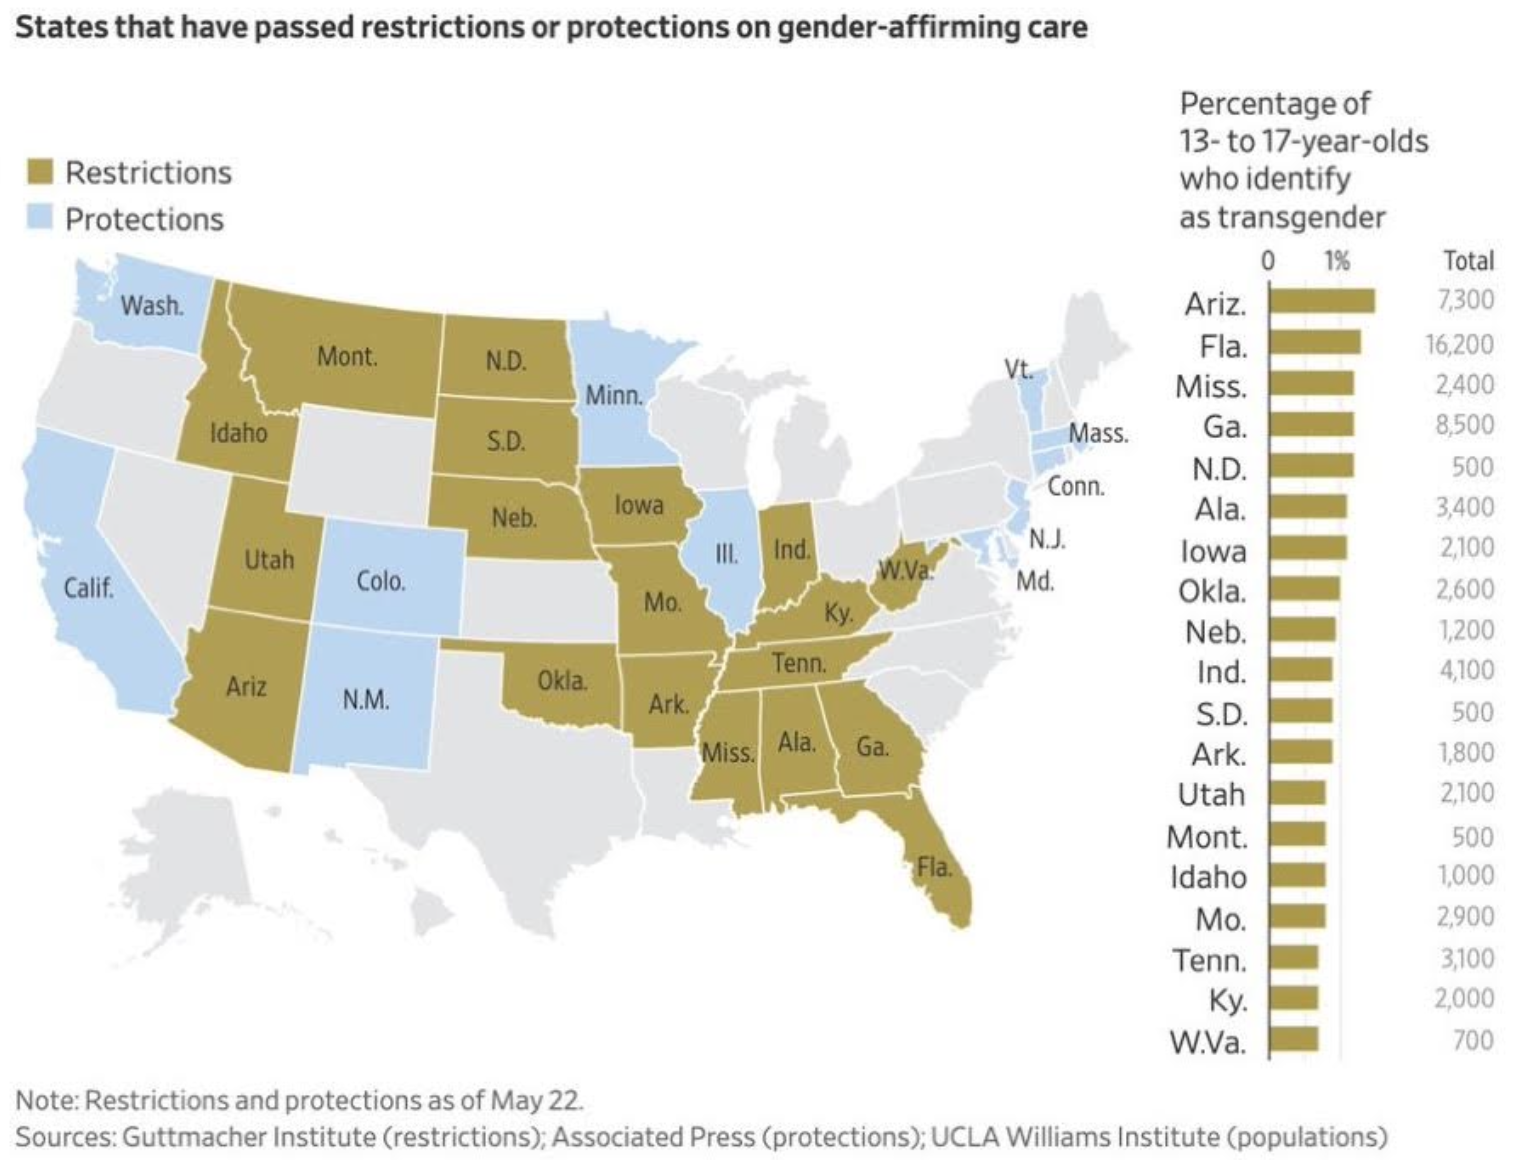
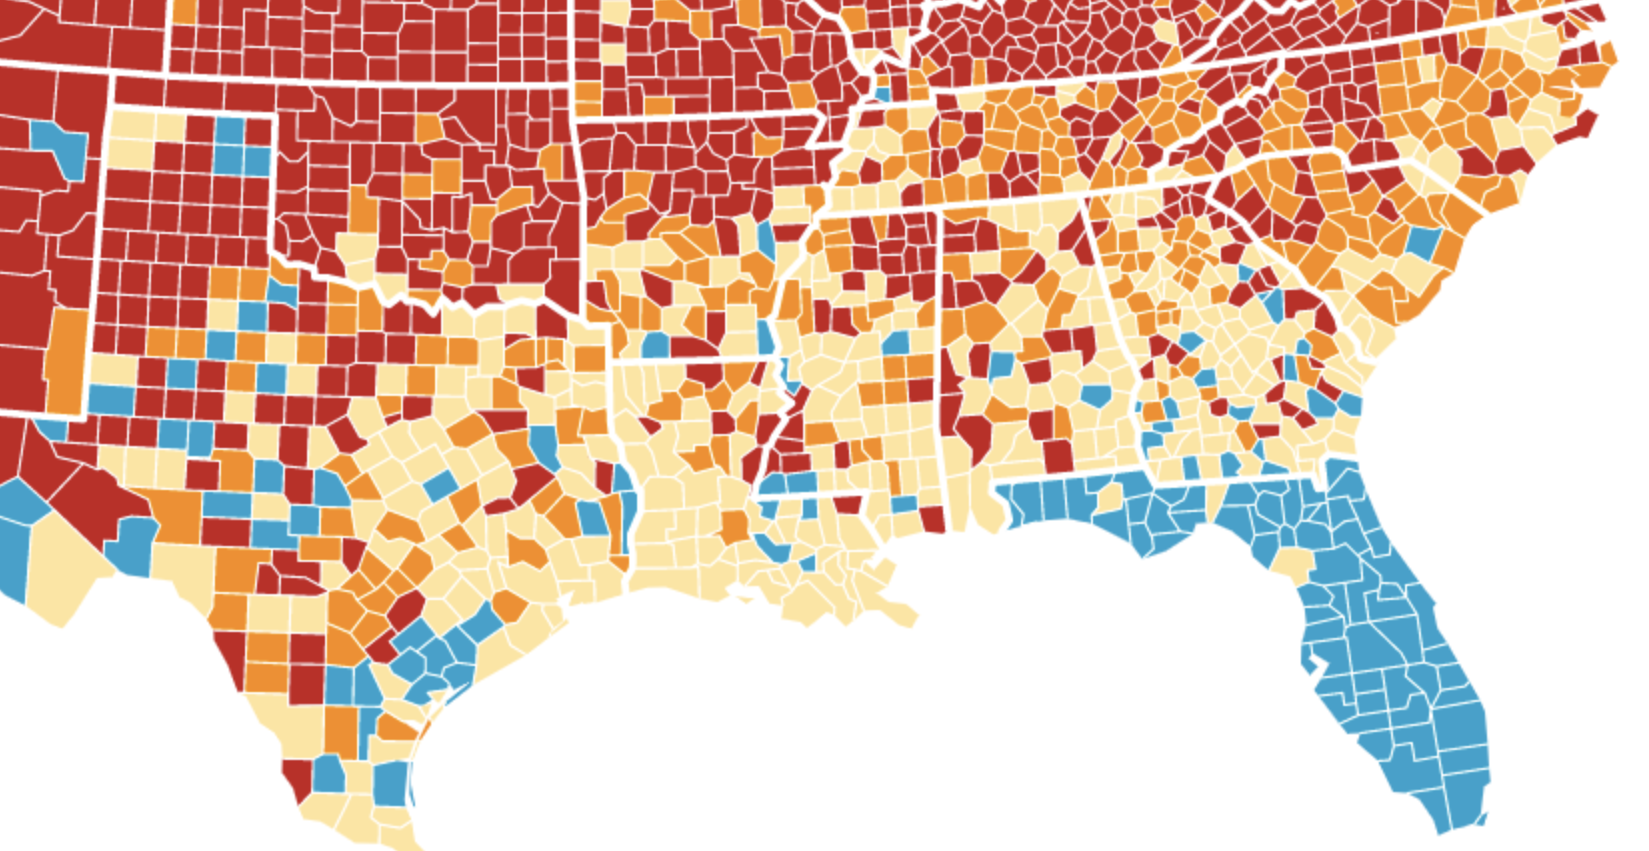
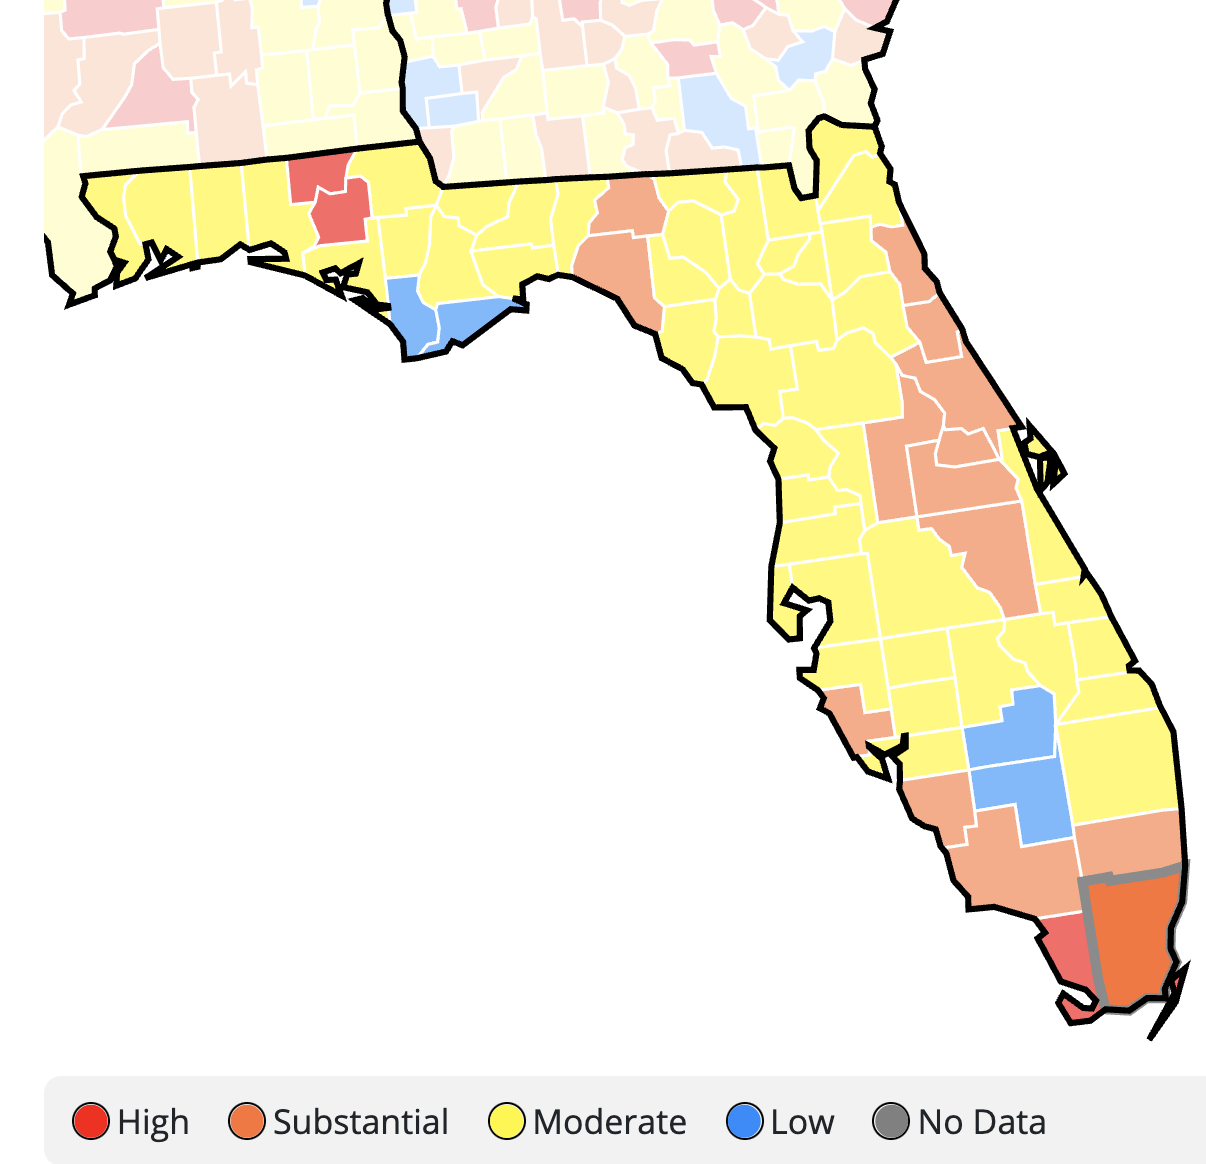
To be sure, to cite a recent news maps of the change that has swept across America of Orbán-like doctrine, mental health was thrown to the winds by the broad imposition of restrictions on gender identification, as a slew of “red” states have introduced restrictions on gender-affirming care across the nation, per the Guttmacher Institute, crating a cleft across the nation of the Orbán-esque policy by enacting outright restrictive transgender laws or curtailing care for trans teens in states over the past two years–a new hot-button issues to motivate to intensify political polarization by invasive restrictions on competitive sports, restroom use, and other health care. The adoption by state legislatures of restrictions and protections a new front of divisive polarization of increasingly sharp lines, as a terrifyingly contiguous block of “red state” litmus tests of knee jerk variety now threaten to return critical swing states–Georgia; Florida; Arizona–into a hard conservative fold.
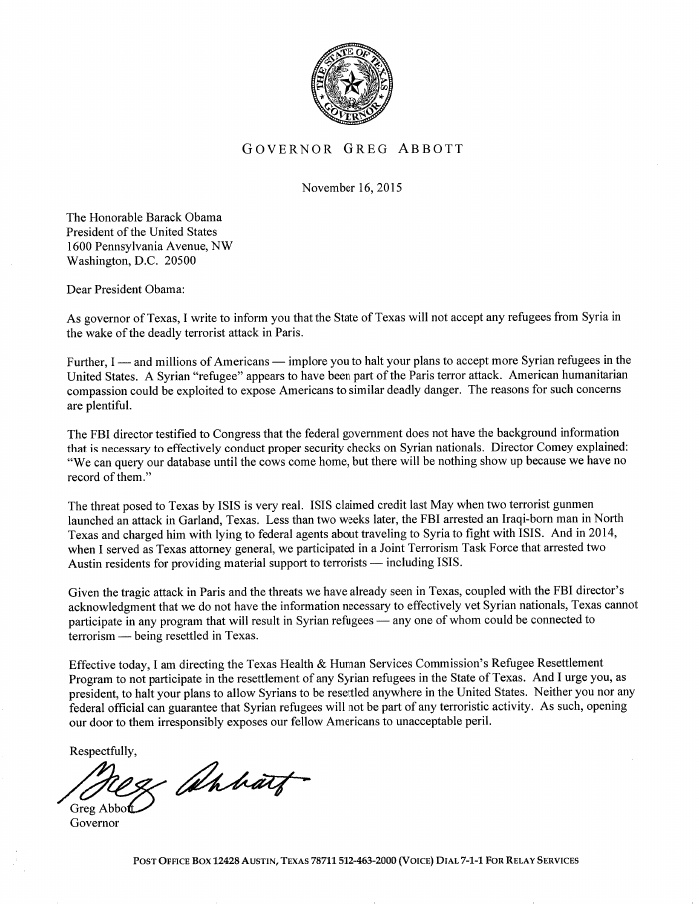
But the national political struggle is perhaps less the point than the harm inflicted upon some thirty thousand kids in Arizona, Florida, and Georgia who may be destined to suffer psychological harm. The laws against transgender identification in America, echoing Carlson’s false charge that transgender people are targeting Christianity–and “the natural enemy” of Christians, arguing that gender-affirming medical treatments are “chemical castration” by 2022 that was protected by the U.S. Constitution, after the White House criticized states’ criminalization of gender-affirming care. Carlson’s statements echoed Orbán, but also pushed the envelop on free speech as medical care for transgender was revealed as a macabre Grand Guignol theater: “Slicing off a child’s sex organs, preventing a 12-year-old from going through puberty, that’s not ghoulish and dangerous and horrifying. No, it’s not. It’s ‘gender affirming health care.’ Indeed, it’s all we’re now calling a best practice.” And after Arkansas banned puberty-blockers in 2021, a potentially life-saving intervention, as endangering children with long-term medical side-effects, encouraging local legislatures to oppose them, giving a platform to anti-trans authors without any medical qualifications or experience, to shape public opinion on gender-affirming medical treatments as reliant on “massive, massive doses” flooding the bodies of young children who become “cash cows” for the medical establishment, but are not seen by doctors–casting trans support as abusive parenting “irreversibly damaging their bodies.” (Gov. Greg Abbott of Texas obligingly took up the charge in a directive declaring gender affirming services provided youth could constitute child abuse as “abusive procedures” in early 2022, echoing bans on gender-affirming surgery in Alabama, Arkansas, and Arizona.)

The map of outright bans on gender-affirming care suggests an echoes of the red state map, to be sure, with the “heartland” of America from the Dakotas to Iowa down to Arkansas and Tennessee and the Deep South constituting a local legislative block against gender reassignment practices, as transgender healthcare coverage by Medicare in America has become a prominent partisan divide, as the call for “protecting” children by preventing transgender treatment have grown in America–

–in ways that stand to place many who identify as transgender at risk, following the bullhorn of Carlson’s openly wrong condemnation of transgender care as a violation of Constitutional Rights.
Yet Tucker Carlson tried his darnedest to cast himself as aggrieved from his Maine country house, defending his ideological ground from an outpost of broadcasting on Twitter. To be sure, Carlson seems to have accepted a legal right to free speech to warn Americans of the dangers of immigration, terrorism, and feminism, in ways that mirrored the redefinition of “free speech” that had bloomed on the internet and among alt right media, and was recently articulated by Fox News lawyers who beat back an earlier charge of defamation brought by Karen McDougal against Tucker Carlson Tonight. The success of Fox News lawyers defending Carlson’s commentary not as truth but as “non-literal commentary,” boosted when federal judges dismissed the defamation suite, accepting the preposterous defense that the 3.2 million viewers his show nightly attracted did not understand them as “statements of fact” or “actual malice,” may have boosted Carlson’s sense of his own free speech. However implausibly, Fox lawyers had successfully argued his words “cannot be understood to have been stating facts, but . . . delivering an opinion using hyperbole for effect” that the District Judge Mary Kay Viscocil had affirmed.
The lawyers’ argument recalled Donald Trump’s defense of using “truthful hyperbole,” with a twist. In deeming Carlson’s speech to be “‘loose, figurative, or hyperbolic language’ that does not give rise to a defamation claim,” the judge agreed a reasonable viewer of Tucker Carlson Tonight “‘arrive[s] with an appropriate amount of skepticism’ about the statements he makes,” as if defamation were not the stock trade in the show. In agreeing to the new nature of hyperbolic speech, District Judge Viscocil effectively defended Carlson as a disseminator of defamation and rumor for the growing rumor mill of the Trump Era. But Carlson’s broadcasts had worked to shape dissensus on a scale that echoed how the Roman poet Virgil called Fama “the swiftest traveller of all the ills on earth, thriving on movement, gathering strength as it goes.” Over six and a half years, Carlson had nightly delivered invective that was perhaps “at the start a small and cowardly thing, it soon puffs itself up, and walking upon the ground, buries its head in the cloud base,” or the air-waves, the “swift-footed creature” of rumor escaped judicial sanction as pure hyperbole, as rooted in “exaggeration” as Donald Trump’s own claims, rather than “stating actual facts.” AlthoughTrump had famously counseled “truthful hyperbole” as a form of “innocent exaggeration” in The Art of the Deal (1987), Fox News seems to have expanded the effective business practice to news broadcasting, defending Carlson’s “hyperbolic language” to be protected as free expression, no matter how incendiary or vindictively dismissive it was.
The admission of hate speech and denigration as a form of “free speech” set a new standard in the weaponization of speech against the electoral map in which partisan battle was energetically waged no holds barred, going full Hungarian, to cite CPAC. If such hyperbole was but the stock-in-trade of Tucker Carlson’s on-air fare, Carlson’s partisan commentary had sped hotfoot through the country, intentionally, crying news not rooted in actuality, or anywhere but partisan reality, but in what we had come to expect on Tucker Carlson Tonight. For Carlson had already explained that immigrants made the United States “poorer and dirtier” (December, 2018), as the protests after George Floyd’s killing were “definitely not about black lives” or justice (2020) Yet FOX lawyers cast the dismissal of defamation charges both a “victory for FOX News Media and or all defenders of the First Amendment”–as if they fit the Free Speech protected by the U.S. Constitution. Such lowered standards of speech enabled Fox TV lawyers to suggest that viewers’ expectations for “truth” from Carlson’s brand of commentary had diminished, and one could not expect him to be prosecuted for going overboard–the argument was not, in fact, about free speech, but the lowering of standards on broadcast news that painted Carlson as not speaking the truth at all.
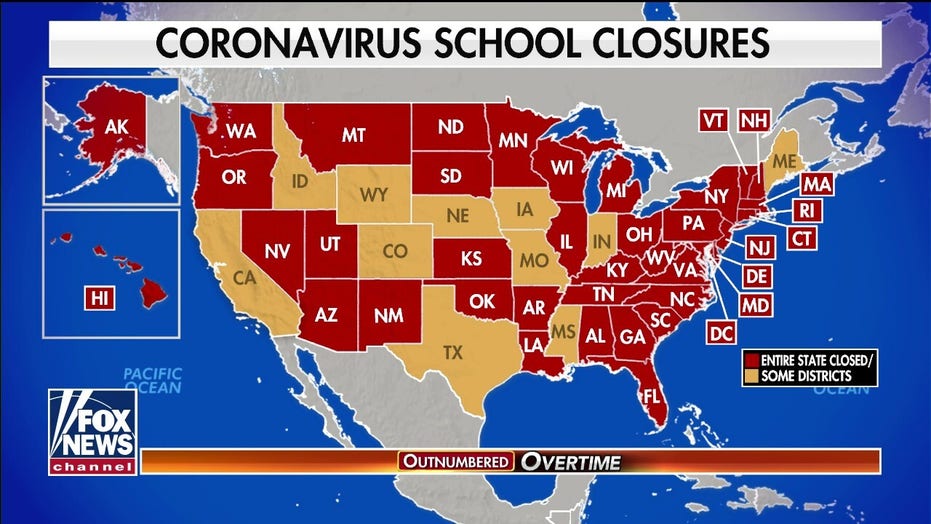
This quite broad interpretation or inflection in historical arguments about free speech was perhaps born online. It was first prominently set by the distortions by which Campus Reform, affiliated with Breitbart, appropriated Free Speech in 2020, litigating that “free speech” zones at university campuses to protect political proselytization–akin to the zones of political protest that emerged in the 1980s and 1990s for protest activities–but now against the restriction of conservative speech. The redrawn “protections” of campus speech mirrored “red” states or states with sizable “red” constituencies, North Carolina to Georgia to Michigan to Wisconsin to New Hampshire to Virginia–

Introduction of Legislation Protecting Free Speech at Campuses in Reaction to Universities’ Restriction of Political Proselytizaiton
–and had created a striking division by using state legislatures to “open” university campuses to conservative ideologues, a mission that escalated after Donald Trump’s election. The dispatching of talking heads from the alt right–Anne Coulter; Milo Yiannopoulos; Ben Goldberg; and other online trolls–raised the bar on ‘free speech’ and adopted it as a logo for conservative causes, in an attempt to staunch an electoral divide.
The citing of free speech as an outcome of Tucker Carlson’s defamation trial was nothing less than a feather in the cap of alt right media. Campus Reform had long sought to “expose the liberal bias on America’s campuses”–of which many universities seemed guilty as charged–to protect conservative speech and learning at college education after Trump’s election, following protests after Trump’s election on college campuses. The rallying cry that “The radical left will stop at nothing to intimidate conservative students on college campuses” animated the movements of protecting Second Amendment clubs in Utah, Free Speech Balls in Mississippi, and other conservative activists interested in sponsoring ideological speakers.
Tucker Carlson accused his past employer of ‘de-platforming’ the voice of conservative America, and limiting his broadcasts–even if the notion that he had crossed a line in the broadcasts was less compelling than the sexist private behavior and a bevy of texts that the new defamation suit uncovered red. Carlson invoked the term ‘free speech’ in the context of broadcasting, to make a point quite different from the definition of free speech in 1789–but far more akin to the earlier defamation suit that viewed his show as “loose, figurative or hyperbolic language.” When Carlson recast himself as aggrieved by the mainstream media, he hinted his dismissal reacted to the bravery of his vigorous election denialism. But his liability had grown. Carlson’s new texts reviled Donald Trump in a language not seen on air reveal a level of contempt for a man he characterized as a “good at destroying things” and as “a demonic force, a destroyer,” before whom he needed to stay alive: “But he’s not going to destroy us. I’ve been thinking about this every day for four years.”
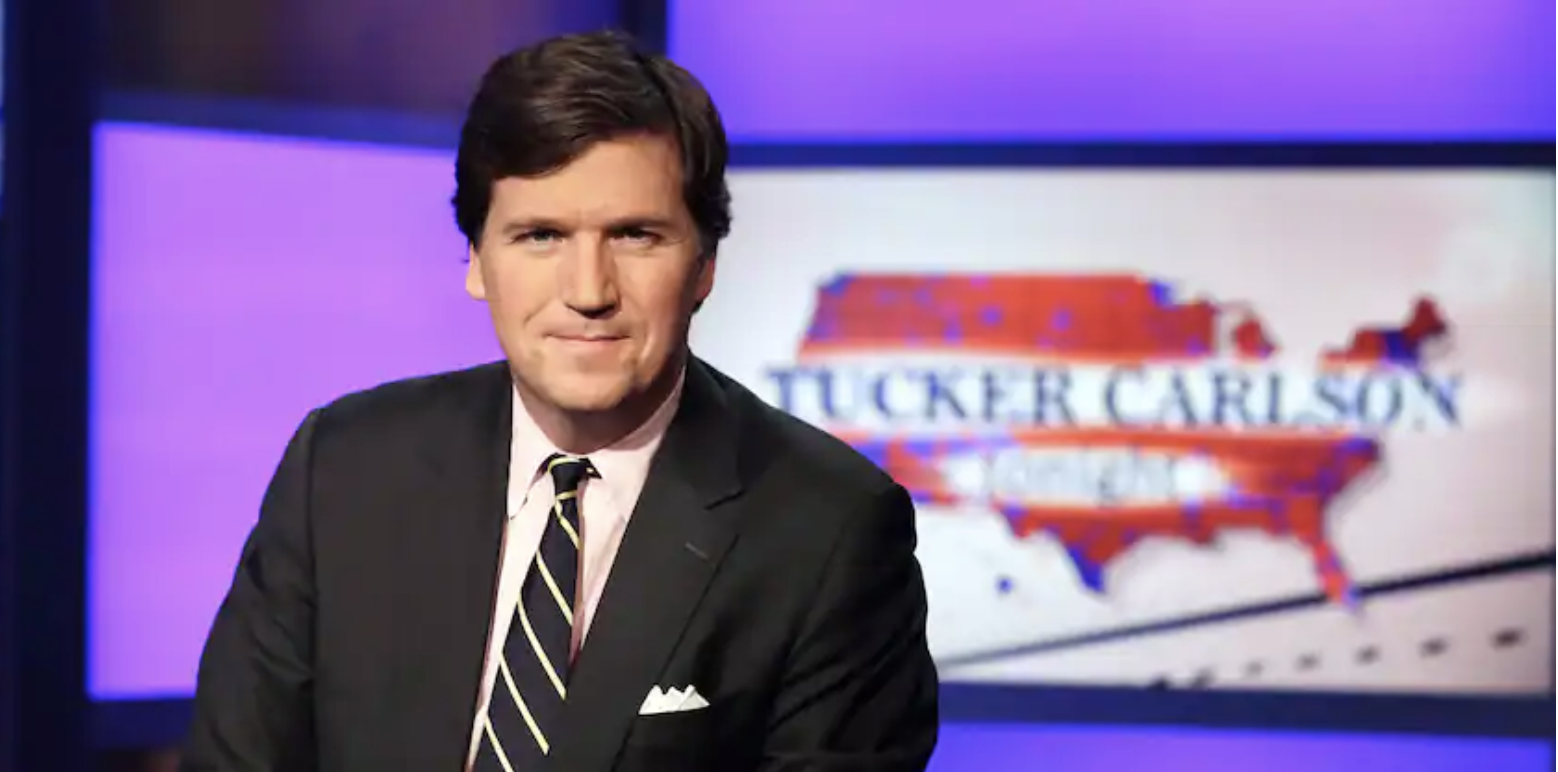
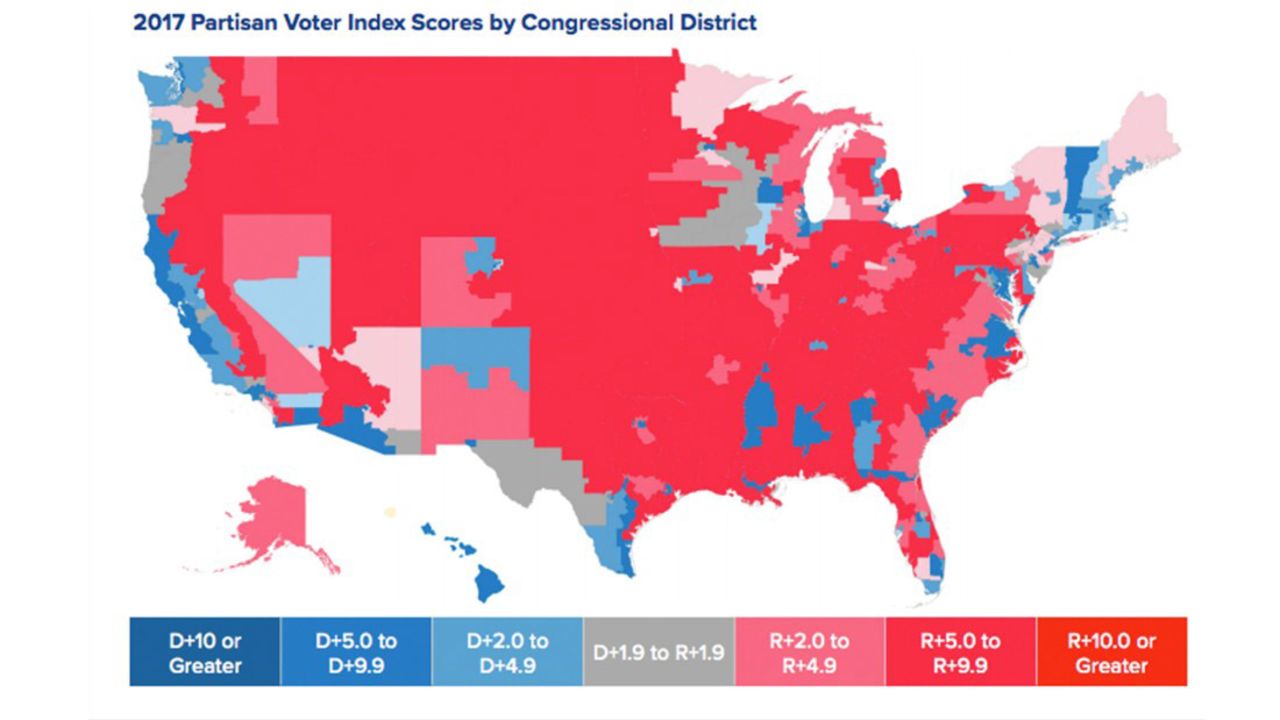
Yet Carlson had himself destructively sewn discord to destroy the civil fabric of the nation, however, which became the main currency of his own show. Even as he claimed to be within his “rights,” Carlson pushed the envelope to create a racist, invective-filled shows on cable news, espousing replacement theory as a danger to the character of the United States that aped white supremacism. Before the split map of red and blue counties of the 2016 election, he perpetuated the gap between parties as destiny, reprising themes of the Trump campaign and promulgating new resentment. The map before which he delivered the news became a banner of election denialism. Delivering “news” before a blurred electoral map–a map so iconic among Republicans to not demand detail–the backdrop for rosy-faced invective on Tucker Carlson Tonight. This post unpacks the persistence of this map on Fox News as a backdrop for Carlson’s version of truth-telling in opening monologues broadcast nightly from November 14, 2016, to April 21, 2023–as if it were a static screen to which Carlson sought to orient viewers, freezing the 2016 electoral map in time.
/cloudfront-us-east-1.images.arcpublishing.com/gray/P2W2HMNBFVGIBCLMH66KFWEIUA.jpg)
Fox News Channel March 2, 2017, in New York/Richard Drew, AP
While the red swath had grown far less monolithic in the early hours of the tally of the 2020 election, in ways that might have seemed to warrant a challenge to Carlson’s logo, the map of 2016 was an icon for the “news” hour, the logo was so iconic that it had not changed,–even as the recent election suggested an opening in the monolithic division of blue and red states, and a more closely divided vote indeed. But as election denialism continued, Carlson had clung to the 2016 map, which occupied a central place in the ideological bent of his viewing audience, who saw that victory as a new road map for partisan identity–even as the states seemed to break in a different manner. Indeed, the early results on the “magic walls” on interactive news screens quickly reconfigured the logo that Tucker Carlson had used as the back screen of his nightly partisan broadcasts.
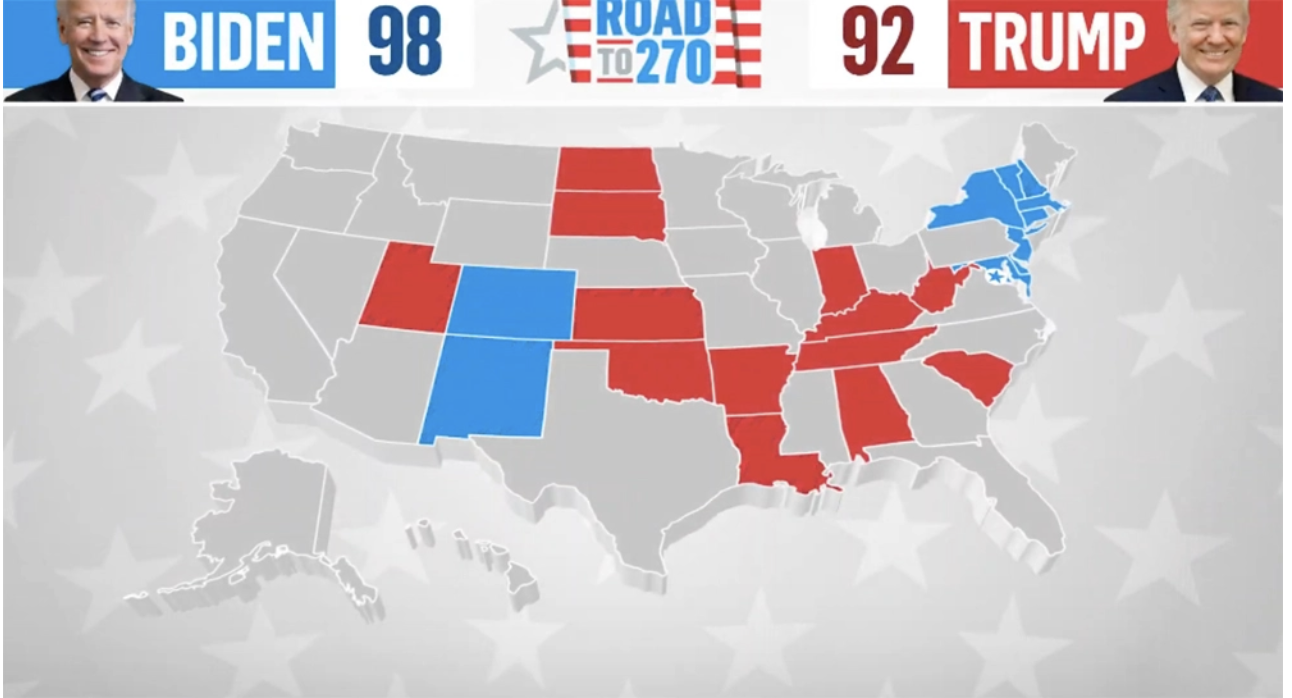
Magic Wall on NBC News, Election Night 2020
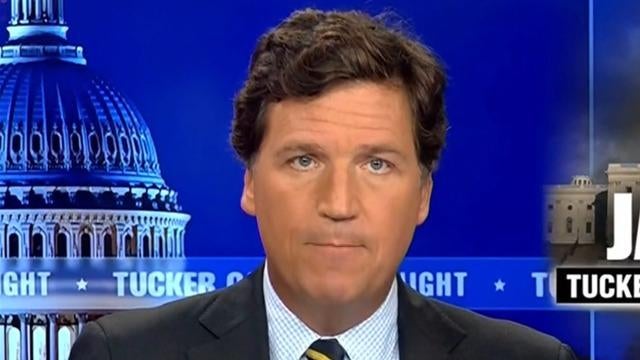
1. Tucker Carlson seemed more florid and a bit unnerved on Twitter, a bit faded after all those broadcast, a bit less animated, before a framed Bill of Rights, with far harsher lighting. He claimed himself ready to confront what he cast as a moment of media crisis in which he was not involved. Bereft of the logo of the nation as it was fragmented by electoral politics in 2016, split in “blue” and “red” counties as if it contained separate nations, the aggrieved news commentator seemed trying to convey an air of normalcy, hunkered down in a house as if sheltering in place.

Safety, and indeed free speech, had been imperiled by the liberal state. Protection of an imperiled democracy offered a rationale for broadcasting that was indeed akin to January 6, as if an insurrection was being live cast direct from Maine, in what seemed Tucker Carlson’s summer house, a site of safety and white purity, far from the current partisan wars, but also command central for waging them. In granting the possibilities January 6 rioters who entered the Capitol were only exercising free speech and rights of assembly, Carlson reprised a tired charge “liberals” imperil our national security–a big reveal of American conservative news media for some time. The emergence of the constellation of “national security” was forged in the post-World War II period, first linking “security studies” to “international political economy” in ways later made explicit by 1947, when The National Security Act coordinated global risks and federal agencies by a National Security Council created “to advise the President with respect to the integration of domestic, foreign and military policies relating to the national security and internal security.” The postwar triangulation solidified the place of America in a global theater that would redefining American liberalism, framing “national security” by military policy as well as foreign policy liberals long found problematic more than purely pragmatic.
When Carlson blamed liberals for intentionally undermining national security on his show every night–by cutting the military budget, welcoming refugees from war-torn nations, or migrants on the southern border as creating a national security threat, it was as undercutting that global order, as much as undermining a national order. And, most recently, he had delivered an exposé of sorts about the Capitol Riots of January 6–

–even if this meant taking the QAnon Shaman who decorated his face with warpaint as a victim of an American media, as much as a victim of his belief in false freedoms.
In exposing global existential threats, Tucker Carlson had created a script of urgency January 6’ers had almost coopted–an d then reframed the trials of the rioters in the January 6 Insurrection as an issue of freedom. If Carlson’s rants on immigration crafted a uniquely survivalist tone taken up by January 6’ers as charges when they entered the Capitol, creating an alternative narrative and reality about the protests, as well as about the convictions of : “in free countries, governments to do not lie about protest as a pretext to gain more power,” white-washing the event as “mostly peaceful chaos” in ways that offered those being tried for besieging the U.S. Capitol some hope. Carlson cunningly suggested federal forces increased the violence by planting disruptive agents in the January 6 crowd, finding evidence of a “false flag” operation in 46,000 hours of “secret footage” House Speaker Kevin McCarthy provided as an exclusive, as one of his first public acts, because, as Carlson put it, “Americans have the right to know” and have not been told the full story.
Tucker Carlson’s “return” was a form of phoenix-like relaunch, born out of the ashes of the the defamation lawsuit against Fox News, arising to strike against the legal verdicts not of the January 6 rioters, but verdicts finding Donald Trump guilty of battery, defamation, abuse, felony and falsifying business records. Quite soon afer he was released from or asked to leave Fox News, it was predictable Carlson would not allow himself to be pushed around. Promising to continue to speak the unvarnished, unrestrained manner that gave voice to the aggrieved, he found a defender in free speech absolutist Elon Musk. Musk had stated ambitions to make the center of news information in the 2024 election, claiming Twitter might create a major platform of the election, and Carlson almost wanted to lend a helping hand. Granted a newly prominent platform by the free speech absolutist to reinvigorate his own failing business, Carlson perpetuated a true deep fake, reclaiming free speech as the terrain of the alt right, appropriating the early modern liberty as an empowering rallying cry against entitled but entrenched media interests.
The most recent gambit of Carlson to sew board discontent not only recast the former president as an aggrieved victim, but showed himself a victim of powerful interests that seek to de-platform his show–at a close remove from the limiting of liberties that now stood in the rifle sites of the new priorities of the state. The historical decline from America’s Four Freedoms were at threat as the switch he made to Twitter only revealed the threats to freedom of expression that were historically enshrined by the passage of the Bill of Rights sought to protect in an early age of print culture. The streaming and broadcasting of defamatory lies on television provided a qualitative and mode of expression more akin to groupthink than expression, cleverly camouflaged in Carlson’s championing of a right to “free speech.” Presenting himself as the aggrieved party, he became a living symbol the violation of civil rights haunting the country from the January 6 rioters to Derek Chauvin to Donald Trump, all white men targeted by the liberal state, at a time when the union–and not only the Capitol building, but the country that the Capitol represented–was under attack.

The new argument of “legal exceptionalism” deviously undercut justice, if not the trial system, in the false populism of common sense. The dismissal of Tucker Carlson from Fox News may have occurred in the fallout from settlement of the Dominion lawsuit out of court, that revealed him to have sent several quite disparaging texts about Donald Trump amidst the rampant sexist of his newsproom, in a revelation of his off-the-camera behavior. The demand for a greater level of honesty on Twitter might allow was cast as a greater level of purity. In pandering to grievance yet again, he continued the Tucker Carlson narrative of grievance that was hardly new to his show. To be sure, in the light of the remarks made public during the Dominion lawsuit for defamation of the electronic voting systems, he wanted a place to reach the 3.2 million viewers who had nightly tuned into his show. His bracing announcement “We’re back!” quickly topped 100 million views in less than twenty-four hours, winning 21 million watches of a video, even if the number probably magnified individual viewers. This approached the audience of 3.2 million of times past.
Tucker Carlson let his viewers know that after he left the FoxNews network, in the fallout from settlement of the Dominion lawsuit out of court, texts disparaging Donald Trump and revelations of improperly sexist newsroom behavior were less the reason than claiming moral high ground. But Carlson may have been protesting too much: his show had almost intently if not obsessively exploited a politics of grievance to fostered since 2017 the hyper-partisan division of the United States. The recurring topic of the show was stated in the electoral map logo of red expanse and blue readouts that hung in the background of his nightly rants–Carlson’s news commentary fit the slightly blurred map of the electoral division of the nation, now an existential fact and eternal lesson in ways that its content didn’t even demand to be interpreted, glossed or read.

The blurred out map before which he had broadcast since 2017 on Fox News displayed a cleaving of blue and red counties he cheerily perpetuated. His show id his best to preserve if not magnify this map, if not to make it an iconic as a map of the party’s future. The map was a leitmotif of sorts of a struggle that animated all Carlson’s on-air rants: as if patriotism perpetuated the partisan divides, he basked before the warm glow of an electoral divide among blue and red counties that cartographic semantics dictated displayed perhaps less two different nations than two world-views. He didn’t need to explicate this divide that lay at the center of most all nightly broadcasts, but electoral divides placed in question the fate of the nation before the duplicity of Democrats and the national security threats they had enabled–as he invoked narratives of “how nations collapse.” The all but blurred logo had a centrality that didn’t even need to prominently register.
Continue reading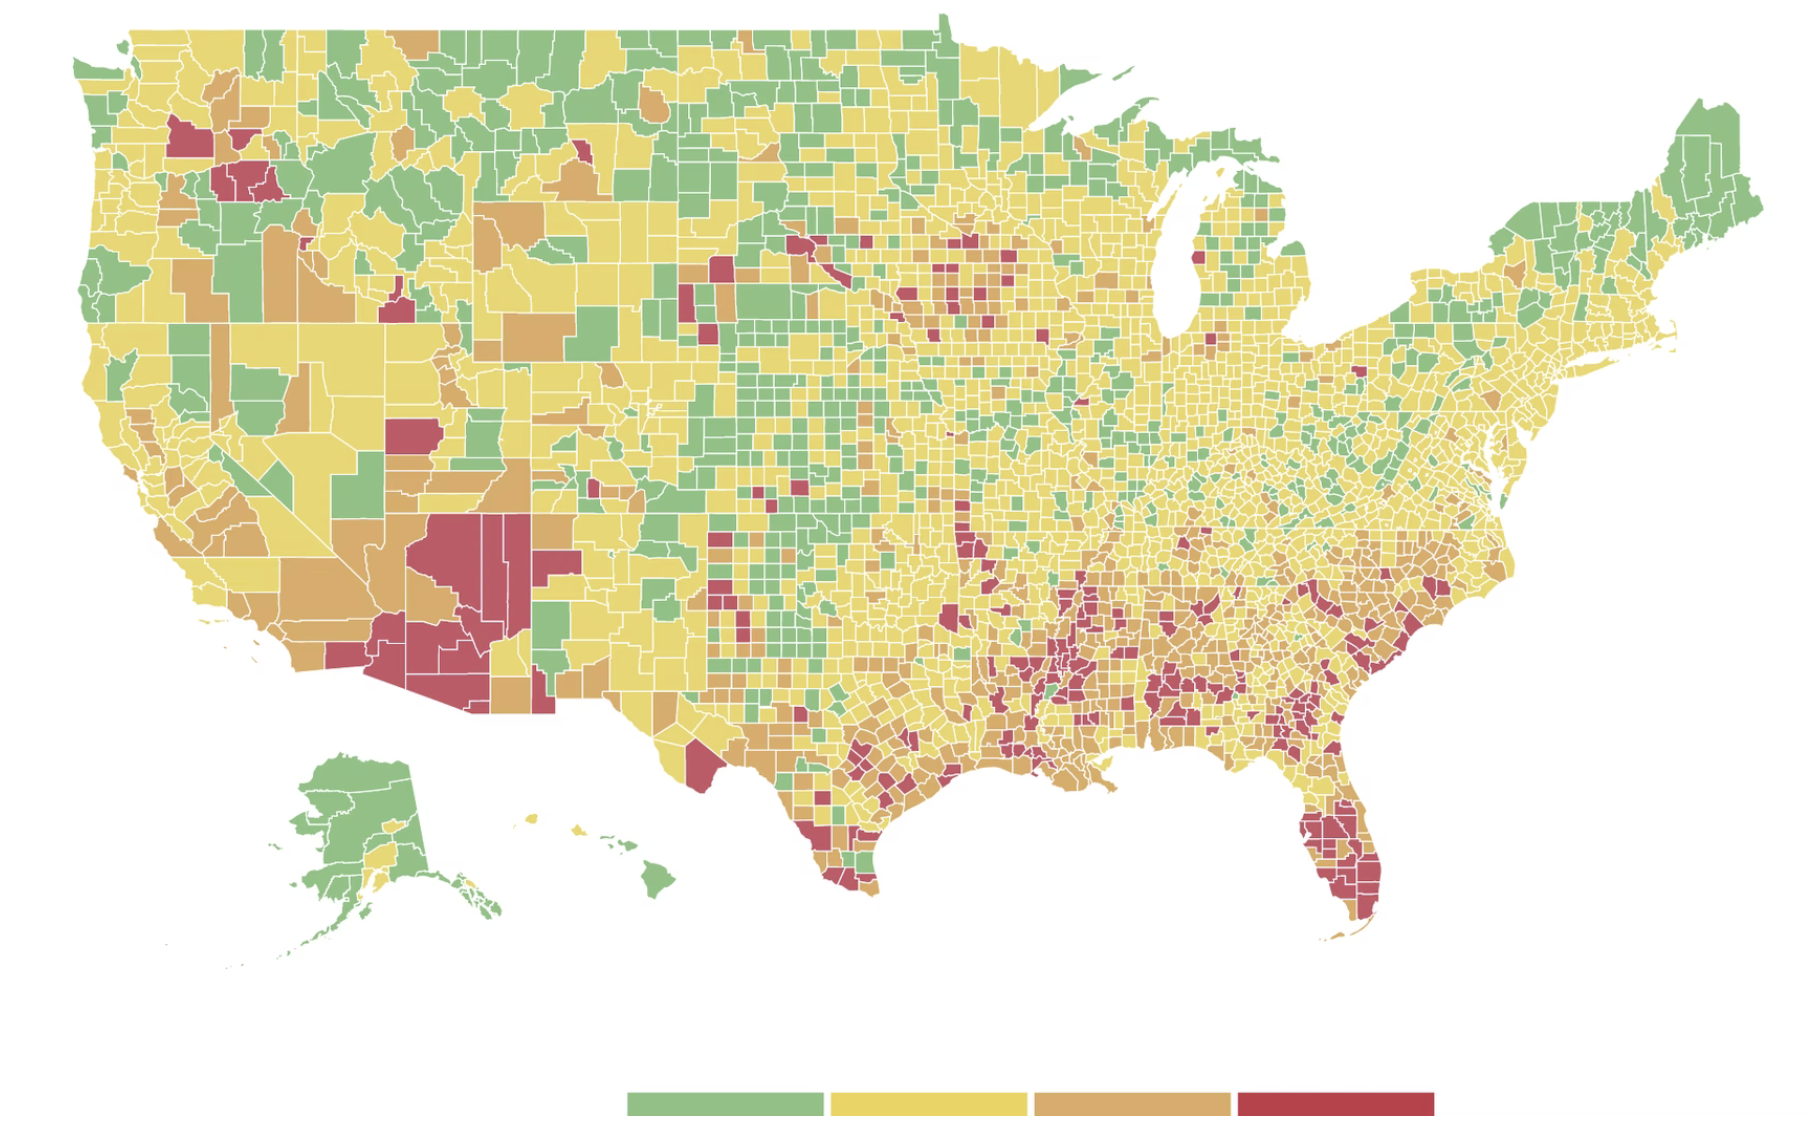


 Marion Ruszniewski/Agence France Presse