Category Archives: climate change

The Growing Global Landscape of Glacier Loss

With frozen glaciers disappearing into the oceans at an unprecedented rate, the rise of an ecotourism of glacier viewing is hardly unexpected. The new heights of glacial melt that are feared for much of the arctic this summer–even if the disappearance of sea-ice predicted by late summer won’t be radically different or worse from previous years–suggest cause for environmental alarm as monumental as the burning of dry forests that spew smoke across the nation. The arctic sublime is, perhaps, more deeply rooted in our imagination, as the fascination of the edges and margins of the arctic as a timeless region and place. The contraction of those margins by melting glaciers suggests that our notion of acclimating to a wandering pole seems more time-stamped, in the mode of current maps, than timeless, a warping as well as a melting of time and space.

The disappearing glaciers map conflicts between two logics–a globalized world of smooth surfaces of the Anthropocene, and image of a timeless arctic wild, whose purity is frozen and lies preserved just beyond our reach. The blurred boundary of the Arctic Sea is a consequence of the blurring of boundaries wrought by globalization: warming temperatures that have been created by escalating emissions of carbon and other greenhouse gasses are creating an age of global melting–and glacial melting–where icebergs are fewer and harder to see, and the sea-ice in the former Arctic Ocean is far less likely to strand ships. The erosion of an edge of the Arctic circle, already nudged north at a rate of just under fifteen meters a year beyond  66.6° N, is mapped in anticipation of arctic melting, a surface of pristine blue bound by a line–despite questions of the margins of thawing permafrost, meltwater flow, ice-thinning or of sea-ice. Drawing a clear line for the Arctic Circle is the vestigial inheritance of print cartography, whose conceptual authority hinders us from mapping the critical margins in which glacial meltwater moves into the northern oceans and warming northern seas.

The shrinking mass of the patchwork of glaciers, mapped in part by satellite, reveal rates of disintegration more rapid rates than the ice-sheet of Greenland, in the new millennium, marked by accelerated reduction of mass, of hydrologic consequences that demand local observation. After twenty-five consecutive years of sea-ice los, late season warming created melt conditions for over a third of Greenland’s ice sheet, revealing the new face of global warming of spreading icemelt–as well as surface melt on 36% of the ice-sheet, surface melt at its highest altitudes were fed by surface air temperatures the sixth warmest since 1900. After sustained sense of limited loss of glacial mass in previous decades, among small glaciers over three decades 1961-90, even given the difficulties of accurately mapping time-series for glacier mass before satellite observations, increase loss of ice mass set off alarms. The far lower mass lost by glaciers sharply contrasts to current levels of ice-melt and widespread glacier loss, here alarmingly noted by a cautionary color ramp of orange-red.
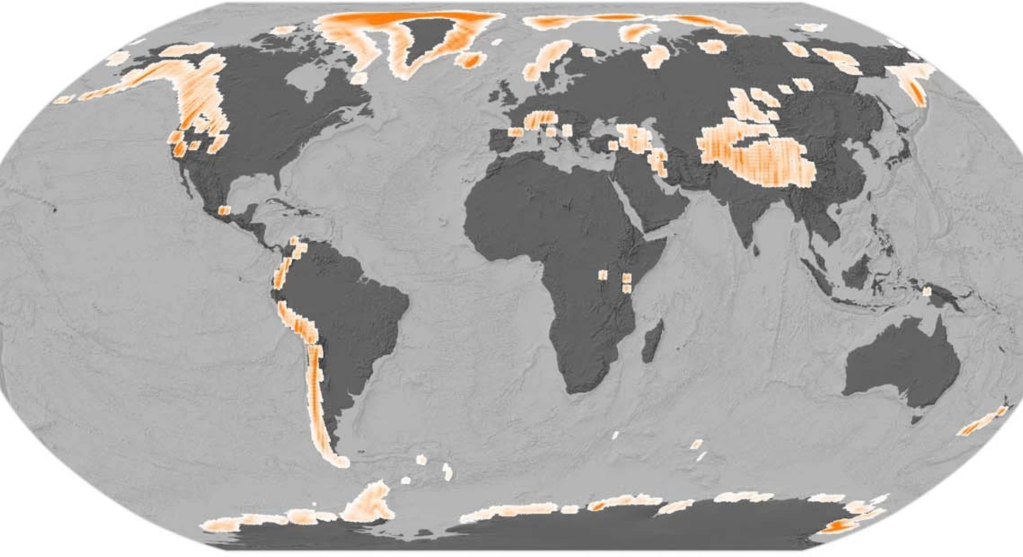
Accelerated Global Glacier Mass Loss in the Early Twenty-First Century/Hugonnet, in Nature (2021)

To be sure, the increased interest in preserving a recording of the arctic’s vital signs–the changing soundscape of ice crackling under ships, and glacial waterflow, seek to register the vitality of the glacial landscape to bring the arctic regions to greater prominence, relating to the new scale of anthropogenic disturbance able to be sensed by their own “vital signs”: the Arctic Report Card issued annually by the U.S. National Oceanic and Aeronautic Administration since 2006 offers a rich database virtually accessible of the disturbances of the global arctic,–although the report of 2018 predicted the entrance of the arctic into “uncharted territory” as a lead research scientist of NOAA warned, with an irony firmly based on new data of surface-air temperatures, sea ice decline, wildlife mortality to erosion to ice-melt that had previously long been difficult to access. If we feel the weird weather systems as a local deviation, more than a consequence of arctic melting, they may remind us how rooted our sense of place is in the frozen remoteness of the upper north, whose icepack reflects more than absorbs solar temperatures–as melting stands to end the idea of a frozen timeless purity, as the survival of sea ice more than a few years precipitously declined, even if some fraction of the Arctic Ocean seem to still remain frozen year-round.

How can we chart these uncharted territories in maps, or can we develop the tools for a conjectural cartography as sufficiently orienting even while we face the prospect of a migration of due north–a change as radically unsteadying for mappers as removing the carpet from beneath our feet? The long-term movement of magnetic North toward Siberian islands is indeed on an uncertain course–

–shifting from Thoreau’s time to the Siberian shores, making us rethink arctic margins, and indeed the stability we were long accustomed to associate with magnetic north, a motion partly tied to melting, and which makes us take stock of glacial health, whose vitality has less to do with warmth.

Conceptual artists as Julian Charrière, whose Swiss origins have perhaps left him particularly sensitive to Alpine landscapes and glaciers, have made it an artistic mission to preserve the fragility of ice fields, sea ice, and underseas sounds of the new Arctic, offering a sense-based record of melting in images able to act as repositories of a new visual relation to a fast-melting world in collaboration with scientific explorers of the reduced levels of sea ice and growing glacial melt.

Julien Charrière, Towards No Earthly Pole, 2019 in Erratic (SFMOMA)

The arctic landscape is also made more alive by the sounds of arctic landscapes, all too easily black-boxed from our world in a denial of climate change. The sounds of glacial calving that are so resonant with the catastrophic consequences of polar glacial collapse offer a sonic register of a collapsing arctic world; the multiplication of YouTube videos of glacial calving seem a yearning to make more concrete the awesome spectacle of glacial collapse. Attempts to extract ice cores from glaciers to preserve the evidence of climactic history before it melts has also inspired attempts to record the interior sounds of glacial vitality in sound recordings of the snapping, crackling, and crevassing as evidence of glacial vitality not from the margins but center of the arctic landscape that remains–somewhat akin to how bioacousticians recorded Humpback Whales circa 1970 to preserve vocalizations as ecological affirmations of balene humanism, revealing sonic expressive sequencing and improvisation never before heard by an innovative “hydrophone” in a nature recording so famous to grow consciousness for a global moratorium on whale hunting.

But if the perception of the aesthetic beauty of whale calls were background music for mindfulness, the melting margins of the Arctic are rarely mapped they demand–or mapped at all, as they are so reduced.

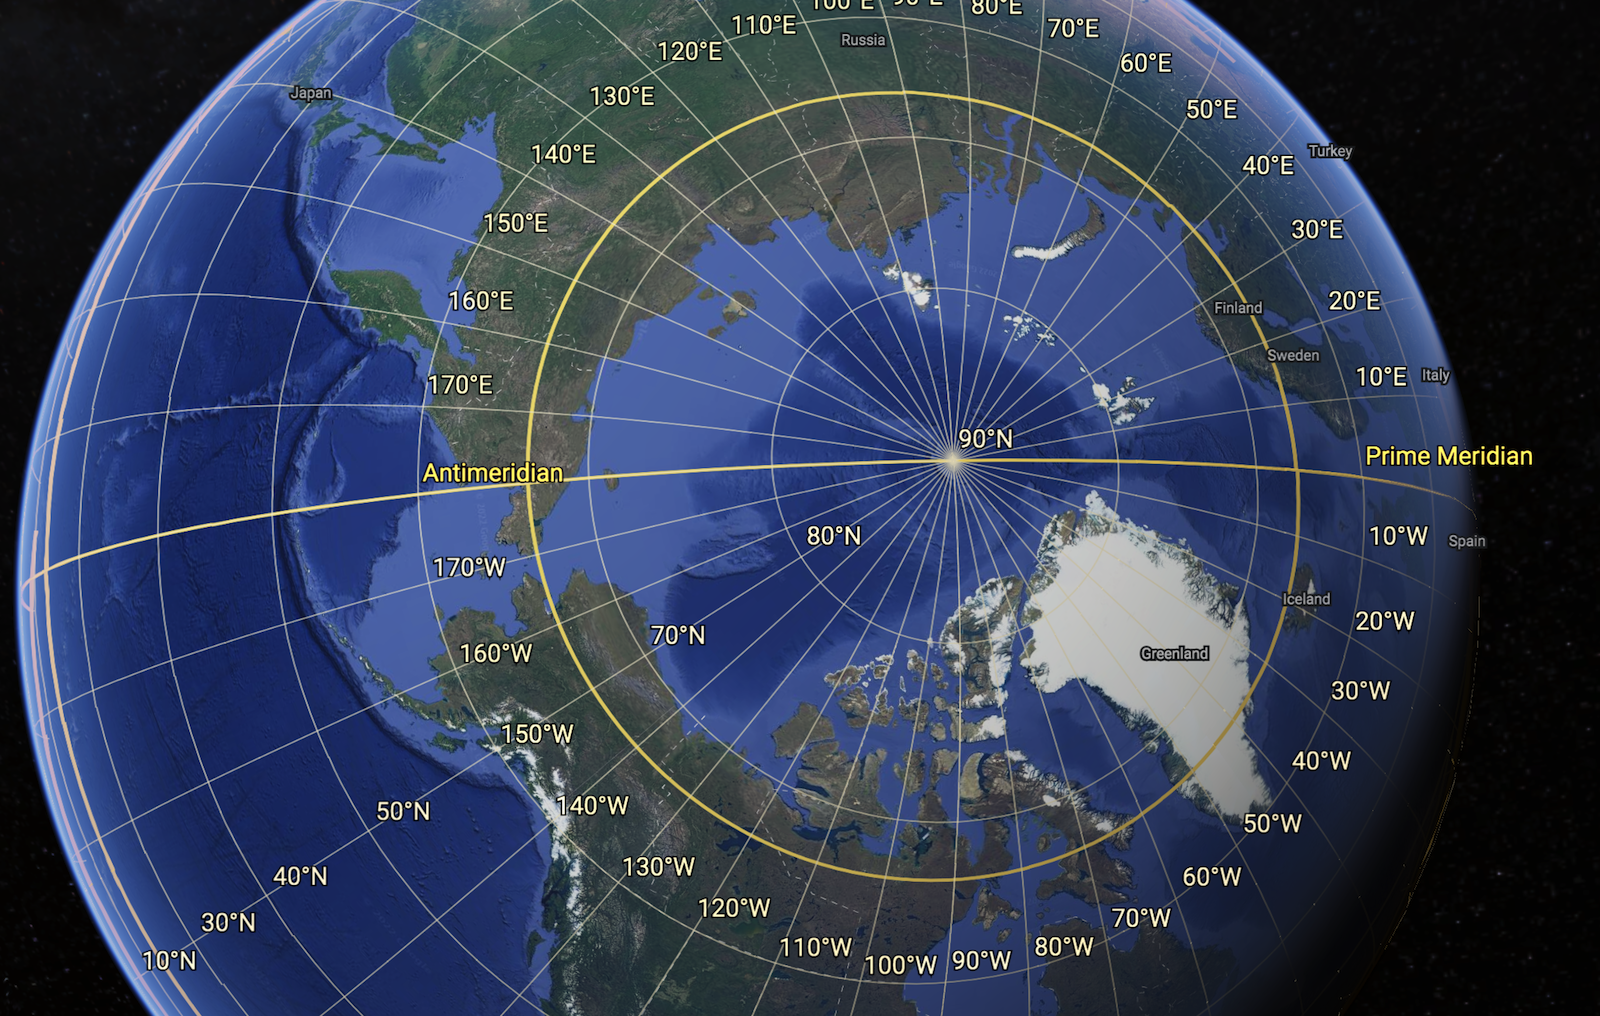
The arctic circle above alaska

Global warming stands to erase the arctic as an extreme frontier, and to change the flow of sea temperatures in ways that will dramatically accelerate sea-level rise. The archetypal romantic Arctic explorer, Robert Walton, marveled at the “beauty and delight” of desolate frozen fields, even as his blood froze in his veins on the Greenland whaling ship he commandeered to reach the North Pole. , marveled at its “beauty and delight.”

Only as Walton’s whaling ship is trapped by floating ice and cannot move did his arctic reveries conclude; before the ice breaks and frees the ship, he spied Victor Frankenstein, the sled on which he pursued the monster who had perhaps duped Frankenstein to follow him to the North Pole, impervious to temperatures his creator could not survive. The novel inspired by ghost stories may invite us to track the monster from a ship that lay at the edges of sea-ice in the Arctic Ocean–

Walton’s Course and the Edge of Average Arctic Ice Edge from March through August in Nordic Sea/ ACSYS Historical Ice Chart Archive, Boulder CO, Frankenstein Atlas by Jason M Kelly

–she was informed by the frustration of numerous polar voyages sponsored by the British Admiralty to the North Pole that were stopped by ice sheets and icebergs beyond the Barents Sea. Mary Shelley seems to have mapped a desolate arctic landscape to conclude Frankenstein’s search for forbidden knowledge, perhaps as she revised the manuscript with grading contributions from Percy in England, and access to the records of the Admiralty. The arctic setting became the fatal conclusion for the “Modern Prometheus,” before the backstory of Frankenstein raising ghosts by alchemical incantations send him to fuse Paracelsianism and natural science that would long haunt histories of science. The very setting of Alpine glaciers where Shelley conceived the story found their conclusion in the arctic, both haunted by accelerated glacier loss. The register of glacial melt is a current register of the Anthropocene, whose own Promethean character is only just beginning to be understood. The northern arctic margins where Frankenstein and Walton crossed paths was still continued to be charted through the mid-nineteenth century, the Polar Sea resistant to staking territorial claims as solid land, the sea-ice unable to be mapped within northern polar seas–

British Admiralty Chart of North Polar Sea (1855, rev 1874) noting Coasts British Explorers Discovered pre-1800 (Dark Blue) and post-1800 (Brown); noting coasts explored by Americans, Germans, Swedes and Austrians 1859-74 in Red Ink

–in ways that we are currently coming to terms with as a mapping of ice-melt and sea-ice melting, in a horror story of its own that has transcended territorial claims.

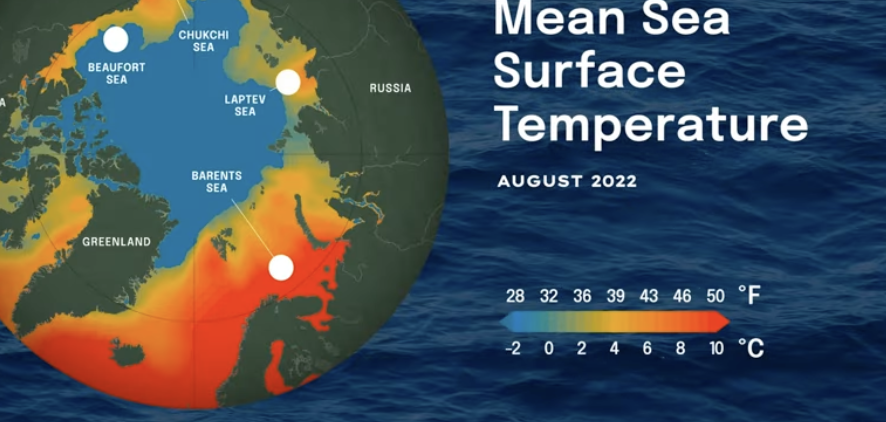
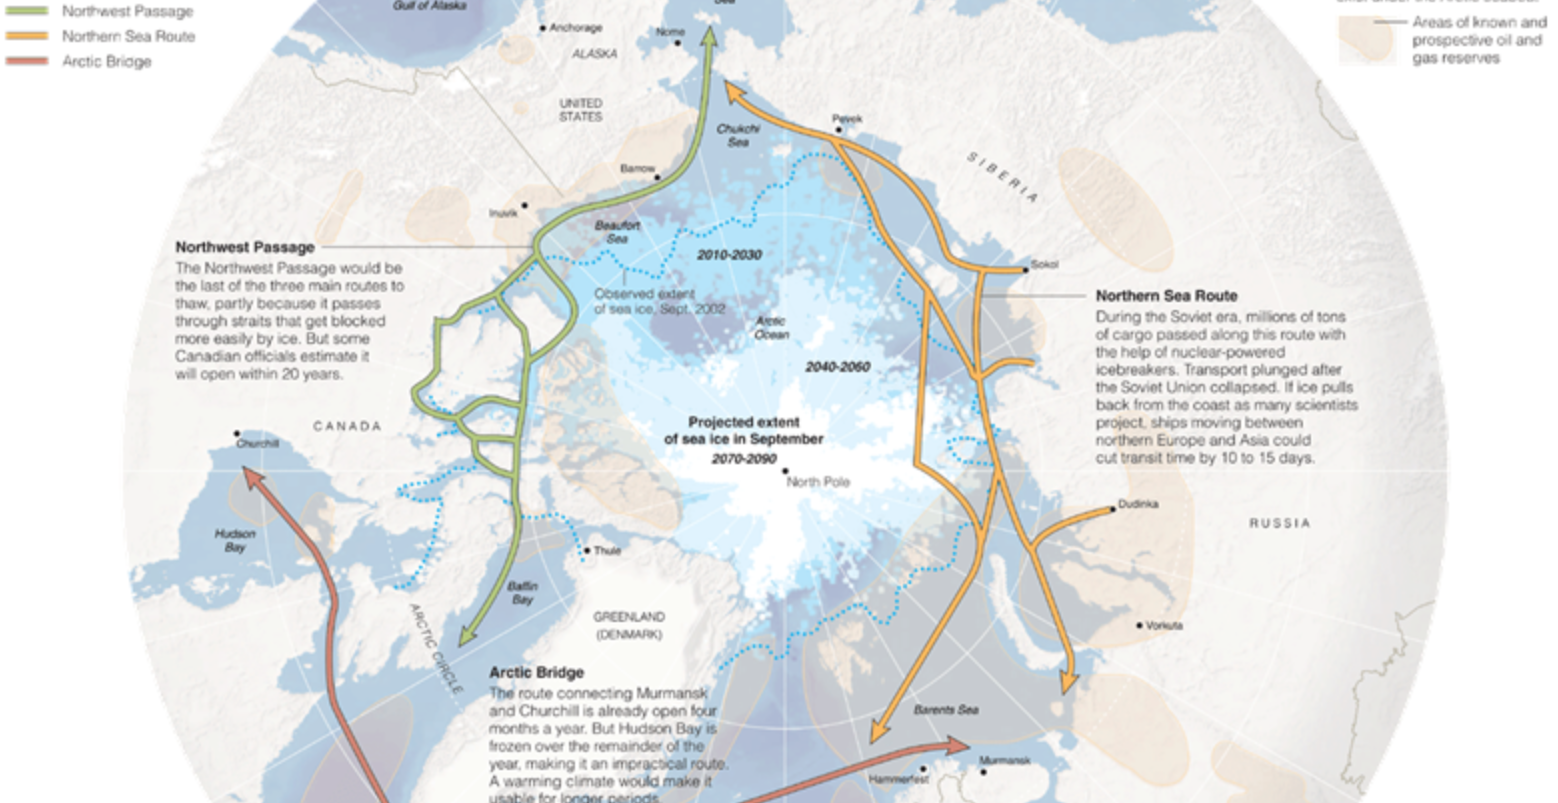
The current landscape of arctic melting frustrates bounding the arctic by a simple line. Rather, we are challenged to map the rates of glacial retreat and the melting of ice sheets, that stand to erode the sense of the Arctic as a fixed frontier, whose margins are remapped as remote sensing provides data of the increasing rates of melting. While icy breezes refreshed Walton’s senses as he passed to the Arctic, if not overwhelming him with the vision of filling long-nurtured hopes of sea-faring at the edges of a geographic extremity, we lack map signs adequate to register fears of polar melting in our warming world. Niko Kommenda’s 2021 visualization in the header to this post of the increased rates at which global glaciers melt bravely tries to sound the alarm. The schematic projection captures the terror of the impending glacial melting, a flattening of the polar surfaces of the globe, where trans-arctic commercial pathways are finally being imagined and plotted, two hundred years after seeking in vain for a northwest passage across Arctic Seas.

By 2016, as the ice had already retreated from the pole,  nine hundred passengers had signed up for spots on a luxury cruise liner, the Crystal Serenity, to sail through the sudden access that low sea ice offered to the lost geographic imaginary of the Northwest Passage, a sea route around the top of North America that had become open to commercial ships, and has since become a route of commercial yachting, if it was only first crossed in 1906 if attempted long earlier. While once passing some 36,000 ice-bound islands, some seven routes have opened for ships today, and innumerable routes by yacht, stopping at the site of the unfortunate 18445 Franklin expedition and recent polar catastrophes,

Jason van Bruggen/Boat Iternational

as well as some pretty spectacular vies of calving glaciers, but demand constant navigation of the shifting sea-ice and floating glaciers by yachtsmen, and super yachts able to cross sea ice who often retrace the popular “Amundsen route” first made in 1906, when sea-ice retreat allows navigation.
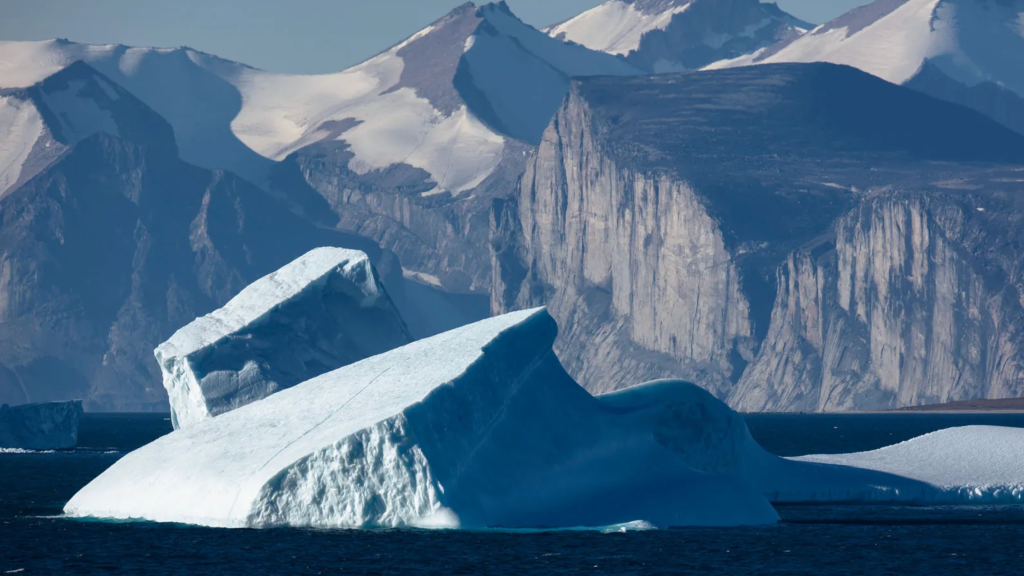
Entry to the Northwest Passage in 2022/Jason van Bruggen

As we anticipate the ice-free arctic, we will brace for a shifting global axis, potentially upsetting our mapping tools, and a rapid rise in global sea-level, if the melting rate of sea ice proceeds at currently revised rates. As the shifts in global mass distribution due to the melting of glaciers and polar ice-sheet seem to have progressed to throw earth off its axis, we are increasingly disoriented not only by raging fires, or torrential rain, but by ice-melt–the sea ice of the arctic is predicted to melt by the summer of 2030, polar archipelagos melting two decades earlier than once projected, when 2050 was projected as a watershed for an ice-free Arctic Ocean, even in low-emissions scenarios. (Observed sea-ice area in the arctic dramatically plunged 1980-2020, but even in the face of such authoritative models, it is difficult to imagine the disappearing act to conclude.)

Although global mapping companies are beset with worries at the possibilities of a wandering and irregularly migrating or wobbly north pole, as extreme melting has sent the arctic regions and magnetic north into uncharted waters, we rightly worry we are headed not only into an era of submerged landscapes, but unstable relation to old orienting points. The “post-glacier” era not only has started to shift stability of the earth’s axis, on account of the readjustment of mass melting of the polar ice-sheet and global glaciers have already caused in the new millennium, but may well be tilting our bearings and sense of being in the world. The unsteady migration of the North Pole in the new millennium is a deep unsteadying, warping our sense of mapping and being in the world, whose strange behavior has accelerated since the nineteenth century in unsteadying ways, moving from Canada toward Russia in a weird consequence of globalized economies that may be accelerating its motion and force necessary geodetic adjustments to our GPS. If the geodetic maps that Henry David Thoreau devised for Walden Pond were seen by some readers as a comic send-up of the mapping of national waters of the U.S. Coastal Survey, magnetic north offered a framework for transcendentalism for Thoreau to map Walden Pond and the adjacent lake country,–tangible and quantitative even if it diverged from the compass, an accurate frame of reference for surveying and an ethical framework and way of life to liberated from social constraints, a firm foundation to a imagine a more ethical world, firmer than the sailors who vainly sought to arrive at the polar cap.

4. The nineteenth-century American explorer Elisha Kent Kane’s accounts of arctic icebergs that had trapped the search vessel on which he was surgeon soon became a media sensation of sorts in the mid-nineteenth century. Indicating the global lines of the arctic that Kane courted vicariously for his audiences in newspaper articles, public speeches, and indeed the watercolors and drawings he displayed on the lecture circuit and Philadelphia’s American Philosophical Society, of which his father served as secretary from 1828-48, seems to have engaged the nation’s attention to the arctic in ways that appear destined to parallel the upcoming attention to the glacial retreat by which the quite sudden melting of long-frozen polar ice merits action in an age of global warming. Despite a growth of climate expertise, we are painfully without guides to the disappearance of glacial markers and glacial melt that has already changed the axis on which the earth spins.

It is disturbing to find a landscape once seen as timeless to be mapped as time-stamped. Can the awe of the arctic landscape still hold awe? Elisha Kent Kane’s audacious account of first-hand contact with the Humboldt Glacier–now the Sermersuaq Glacier–off of Greenland, while now forgotten, was so vivid Henry David Thoreau even felt jealousy, as he doubted polar explorers like Grinell, for all their public celebration, had ever needed to travel to Greenland’s coast. (Thoreau echoed Ralph Waldo Emerson’s doubts in “Self-Reliance” about the value of currents fad for travel abroad, calling the rage for visiting Rome or Greece less a real destination than “a fool’s paradise” that follows from neglect of one’s own backyard: “the soul is no traveller, the wise man stays home;” the rage for ravel as an amusement only leads only to travel away from one’s true self.) The conflict or the terrain for conflict had perhaps been mapped: among the personal papers of the doctor served as senior medical officer in a polar expedition, Bones McCoy to Grinnell’s more elegant Capt. Kirk, except that Kane was chosen to head the attempted polar expedition that followed recent maps of the open polar sea, imagining they might find a northwest passage, before they were trapped by sea ice, and forced to abandon their ship for a long trek south, subsisting in the wild on walruses and having dressed in animal skins amidst the frozen landscape of towering icy peak.
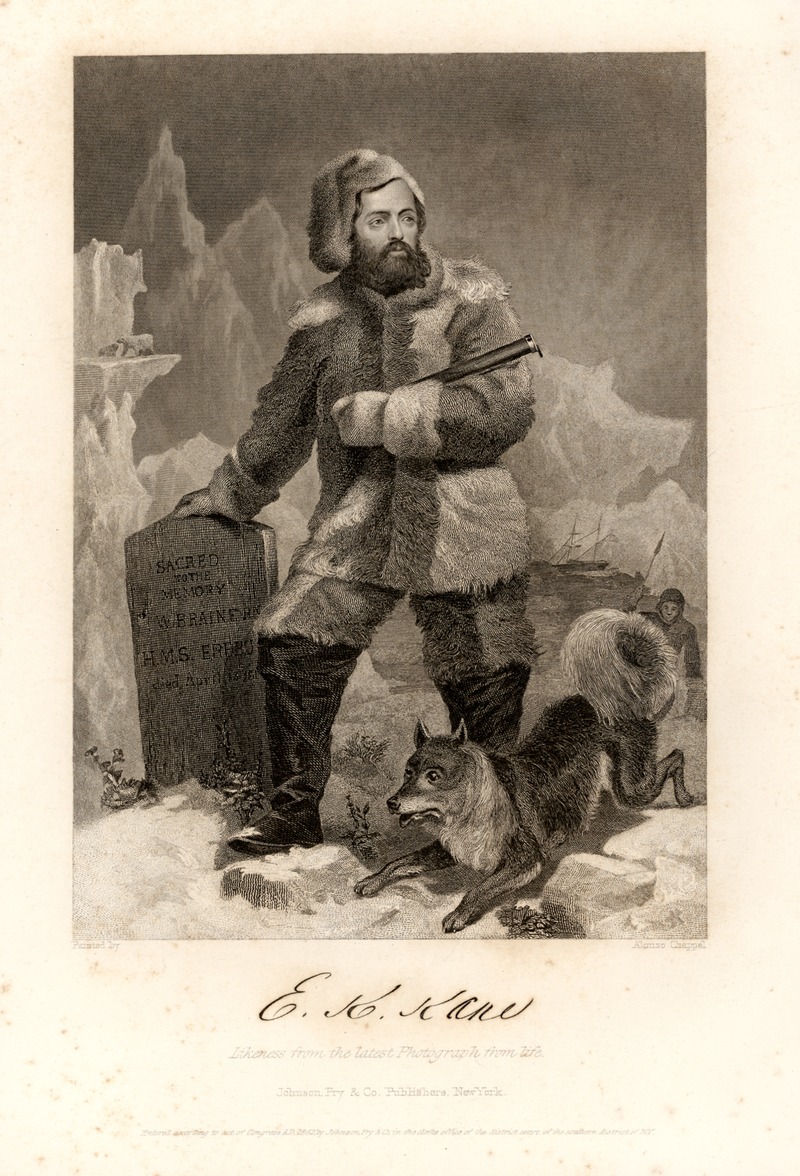
Kane

The U.S. Grinnell Expedition in Search of Sir John Franklin: A Personal Narrative (1853) 

Kent Kane had fronted the wild as a scientist-explorer published in a personal narrative of 1853, a year before Thoreau’s condensed narrative of the twenty-six months spent at Walden Pond, based on lectures that had made good on many newspaper accounts he had filed while at sea. In his escape narrative of the arctic, the surgeon rejected scientific jargon to evoke the terror of arctic landscapes of an uninhabited wild. He rendered its uncanny spectacle by watercolors to capture his fronting of the uncanny unknown arctic wilds that escaped the impoverished dimensions even of architectural panorama, placing adiences in a harrowing story barely avoiding shipwreck on massive icebergs that threatened the vessel in arctic seas where the compass itself froze as a romance of confronting the nature of a frozen north, as if the snowy lands were uninhabited, as a Robinson Crusoe of the northern hemisphere, in a melodrama against magnified elements.

Ship Wrecked on an iceberg, from Elisha Kent Kane, Arctic Explorations in the Years 1853, 1854, 1855

Emerson’s maxim about the vanity of travel is often cited proverbially, perhaps imbued with new tones in an age of globalization, apart from the Sage of Concord proviso about the pleasures of solitude that “Our minds travel when our bodies are forced to stay at home.” The range of remote observation that we are able to access about the arctic this warming summer–and warming summers previous–are cause for alarm, as the number of glaciers have declined rather precipitously in recent decades, as the oceans have warmed, and their melting across the northern hemisphere have contributed and stand to contribute more to the rising of sea-level, as well as exhausting one of the largest storehouses of freshwater in frozen form.

Whether or not the heroes of arctic exploration never fully explored their own back yards with due diligence or not, Thoreau framed a prospective from Walden on the world, as he cultivated his perceptual abilities–refining his own study of the local landscape and its morphological characteristics. To be sure, Thoreau appreciated his own backyard as a source of rich meditation informed by his avid reading of Darwin’s discussion of Patagonia, Rev. William Gilpin’s accounts of the depth of Scottish coasts and Lochs, as well as Kane’s spectacular accounts of his approach of Greenland’s glacier, to view icebergs calving from its coast at first hand. The edge of Walden Pond emerged something of a standard by which he was to judge them all, and for each natural history text (from Lyellian geography to historical bird migrations pioneered by Gilbert Whyte’s Selbourne) to measure Walden Pond against. They offered a basis for Thoreau’s mind to travel, while he was rooted on the banks of Walden Pond, and even to imagine, the actual engineering of Walden Pond and the ponds of Sudbury Plain as excavated by glacial retreat, long before the “Hyperborean” workmen (Irish day laborers) came to export its precious if undervalued ice for a global market.

Kane’s sensational voyages to the arctic had made him an American hero, against whose narrative of an arctic picturesque narrative or so, Thoreau might well have sought to define himself against, but in the past sixty years, Thoreau has remained the model of local observation. Recently, as one tries to process the extent of global warming, remote sensing gives some strength to Thoreau’s point–and Emerson’s–given the possibility of considering the world from one place, without braving the elements to risk being trapped by sea-ice and ice floes of the arctic north in the rather sensational manner of Elish Kent Kane, heroized in his time as a public speaker, American hero, and arctic explorer, before Thoreau began to gain popularity on the lecture circuit in Massachusetts. He was a bit of a competitor, and arrived in Boston with the huge drawings he had made of arctic icebergs that his ship had encountered and seen at first hand as an actual arctic sublime.

Arctic Glacier, Melville Bay from US Grinnell Expedition in Search of Sir John Franklin Grinnell (1853)/ American Philosophical Society Library

Thoreau famously prized Walden Pond as a site of purity from which to apply himself to watching the world, perhaps recuperated in the enthusiasm for viewing glaciers today in an era of ever-decreasing contact with the wild, the uneasiness of watching the retreating remaining glaciers in the warming waters of the northern seas is more than tinged with a sense of melancholy, capturing the sight of the few remaining glaciers and icebergs, and summoning what is let of Thoreau’s deep admiration of the wild. Thoreau would indeed be shocked at a shifting North Pole as a surveyor who, Patrick Chura has shown, prided himself on determining magnetic North by a “true meridian” if modest in many ways: accessing the “true meridian” was a more elevated sense of moral purpose and direction, as he navigated at night-time by the North Star that escaped slaves followed to secure their freedom. Thoreau was proud of his exactitude and precision as a surveyor of farms and of the woodlots around Walden Pond, mapped “so extensively and minutely that I now see it mapepd in my mind’s eye,” he wrote in 1858, to plot his motion across lots’ property lines,–as if the exactness of magnetic north was warranted to navigate the woods accurately.

Thoreau prized the ability to detect the undisturbed wilds of America just outside of Concord, Massachusetts, and in his own back yard, cultivating his perceptions of the wilds of the continent that still survived even in the age of the railroad and outdoor lighting, the timeless glaciers–or seemingly timeless iceberg–offer one of the last sites of the wild, a fast disappearing margin of nature, in a warming world and a world of warming oceans. Now, rather than haunted by icebergs, we are more likely to be threatened by prospects of glacial retreat. In an increasingly warming haunted by polar melting and glacial retreat, twenty-eight trillion tons of global ice melted between 1994 and 2017, raising the prospect of melting of the 70% of the earth’s freshwater stored in permafrost, ice-sheets, glaciers, and ice caps. Remote sensing led NASA to say almost elegiacally, “goodbye, glaciers” in 2012, finding almost 60% of ice loss melting in the northern hemisphere, and much in the Americas, northern Canada having lost 67 billion tons of ice in the previous seven years, southern Alaska 46 billion tons, and Patagonia 23 billion tons. The skills of engineering by which Thoreau, who built his own house in rusticated style, recovering the shingles from an Irish worker as Romans might reuse pieces of ancient buildings, fancied the environmental engineering feats by which glacial retreat had sculpted the ponds he boated, swam, drank, and skated in winter. If Kane had been inspired on his expedition by maps of an ice-free open arctic sea, we have trouble not standing in fear of the prospect.

Augustus Heinrich Peterman, 1852

At the same time as Kane set sail in search of Grinnelle, or 1855, Peterman combined the arctic panorama with intense cartographic scrutiny of the islands and icebergs of the frozen landscape, trying to preserve a navigable open arctic, combining art and cartography to tempt travelers to the prospect of Humboltdian voyages to the many islands and archipelagos of a partly frozen north.

Peterman, Karte des Arktischen Archipel’s der Parry Inseln, 1855

1. The scale of global melting is the negative image of globalization, haunted by a hidden story of dizzyingly increasing global icemelt and global melting. As increasingly warmer waters enter the arctic regions it melts more sea ice, allowing more sunlight to enter the arctic ocean, whose contracting margins trigger a feedback loop as more icemelt reduces the margins of arctic sea ice whose effects we are hardly able to process, let alone to confront.

T. Slater et al, (2021), Copernicus

Indeed, we are haunted by the image of glacial melting far more than we might imagine, and wherever we live. For the mapping of glacial melting–suggested by the data vis heading this post–is best understood as something of a negative map, as well as a map of tragic if not irreversable loss. It is a map that we will not need to travel far to see–per NASA, which has been monitoring glacial loss and ice sheets’ weight since 2002, the prospect of all glaciers and ice sheets melting would provoke sea level-rise over sixty meters or 195 feet. The message of the remote sensing GRACE satellites provided from 2002 to 2017, and GRACE-Follow On satellites after 2018, have yet to hit home, Emerson might say, perhaps as even accurate monitoring is only offering provocation to assess the shrinking margins of the arctic on the ensuing loss of habitat, warming ocean currents, that send ever less cold water to the deep ocean to trigger upwellings of nutrients, and indeed land erosion that rising sea-level can provoke.

Despite its persuasive power, this map remains largely negative, as it tracks ice loss, without the more terrifying consequences of a greater degree of icemelt, with significant consequences downstream. We imagine glaciers as if they had edges, but the margins of ice melt are an image globalization and the only recently conceivable prospect of the margins of arctic melting The arctic must be understood by its margin, not a line, whose changing margins–seasonal margins, margins of melting, and margins of glacial coasts–shown as ‘dripping’ in the header to this post, a projection revealing how much the loss of ice due to global warming has accelerated in the north.

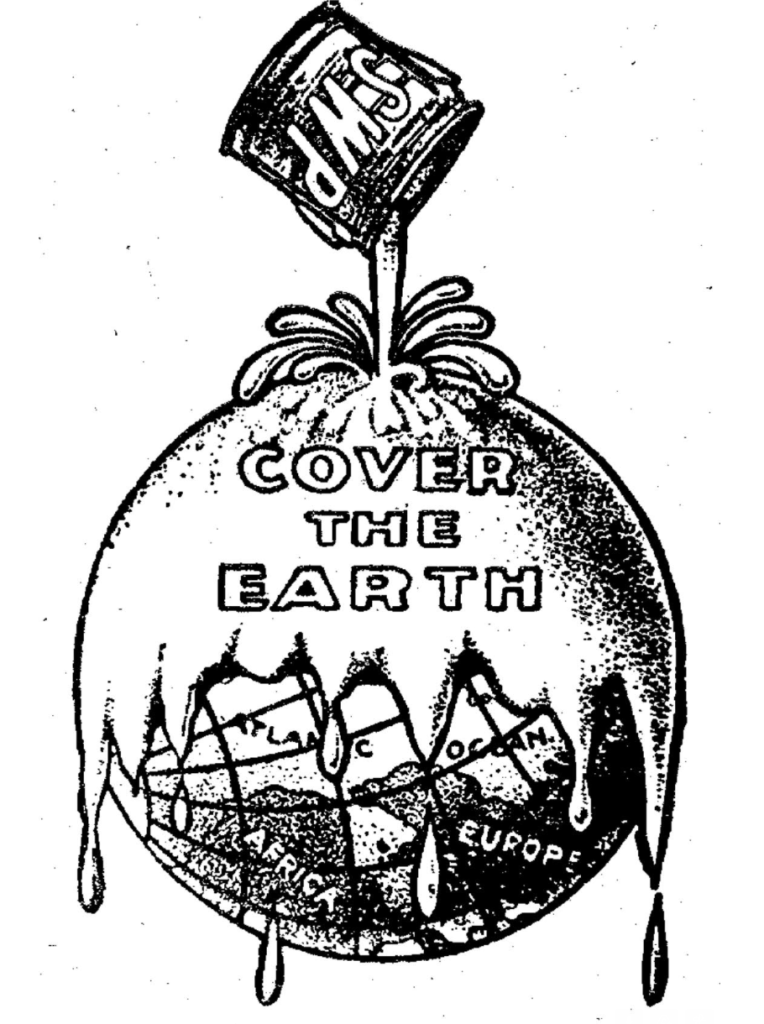
Faced with the burgeoning data of 267 gigatonnes of ice-melt as glaciers and ice caps recede, Niko Kommenda hoped to process remote sensing by statistical data profiles to render the loss of ice at specific as a sequence of spikes at fixed transects. Kommenda long considered possibilities of visualizing glacial melt as a visual projects editor at the Guardian, but the prospect of a recent doubling of rates of ice-melt over the previous two years suggested a need to illustrate the rising rate of flow as a massive shift in the calculus of water flow into global oceans. Recalling the use of spiking red to render rates of mortality of COVID-19 in American cities, if with a downward flow, he mapped a synoptic data vis of global annual change in ice mass. The global continents drip red, in a gripping distribution of the image of ice-loss that almost recall a geo-referenced remix of the classic Sherwin Williams logo, but of a world whose northern hemisphere was dripping with melting ice, as the small rise of several light blue spots suggest rises in ice mass mostly confined to high altitudes.

The map evokes geodetic take on the familiar Sherwin Williams globalism, repurposing the promise to “cover the earth”: in a projection akin to a transverse Mercator project like WGS84, flattens the earth to a single legible surface, haunted by the specter of nearly inevitable sea-level rise.
Drop Cloths & Plastic Sheeting - Sherwin-Williams

Henry Sherwin’s logo was, when it appeared after World War I, in 1919, a rebus signifying the victory of American capitalism and enterprise as it expanded to markets to a European theater, across the Atlantic Ocean, in an iconic image of free enterprise that new no national frontiers–

Cover the Earth indeed! The bold totality of Kommenda’s graphic suggests a bold distillation of international mapping tools, a drip drip drip that is almost unstoppable: rising rates of flow from the melting of global glaciers had doubled form the start of the new millennium, sounding an alarm after the first comprehensive studies of ice rivers revealed at high latitudes more meltwater leeched than the ice sheets of Greenland or Antarctica,–putting glacial thinning into prominence as a result of NASA satellite data. Remote sensing may have revealed one of the greatest historical catastrophes of losses of ice in human history, prompted Kommenda to tote up a compelling balance sheet of losses of frozen mass to embody the alarm glaciologist Romain Hugonnet sounded. The work of Kommenda’s mapping continued, as he focussed on the outlines of glaciers and glacial complexes–“The more accurately we can map glacier outlines, the better we can track their melting due to climate change,” Ann Windnagel of the National Snow and Ice Data Center, who has been trying to track the recent reduction of glacial complexes in the Arctic, Iceland, Alaska, Scandinavia, Antarctica, and Central Asia, as well as the Southern Andes, in a global assessment of glacial health–ranking the glaciers’ size and footprints as a long-lasting, enduring flowing mass of ice. To describe the “footprint” of a mobile form may be an unhelpful mixed metaphor, but the inventory of glacial size can map glacial health in relation to glacial fluctuations, ice shelves, ice tongues, ice thickness and ocean temperature, given considerable contribution of glacial melt to sea-level rise–often able to be compared with over 25,000 digitized photographs of glaciers, dating back to the mid-19th century, as a graphic historical reference for glacier extent. By tracking ice bodies and glacial complexes over time, snapshots help appreciate the extent of complexes in different regions.

The awareness of just how much glacial mass had been lost by warming became evident as it set the earth’s axis wobbling off due North in ways that may upset the geodesy on which the global grids we rely in satellite-based mapping rely. The hope to mirror the deep urgency Hugonnet felt to make the remote glaciers more immediate in a multiscalar global water cycle, able to encompass the considerable risks of huge downstream changes in regional hydrology, a fact that Hugonnet appreciates as a long-term resident of the Alps–the fastest melting glaciers offer a microcosm or test case able to contemplate the consequences of a global phenomenon of glacial melting–also known as glacial disintegration, as the over 200,000 global glaciers and glacial complexes have begun quite radically to reduce in their mass and size–releasing a considerable chunk of the world’s freshwater reserves to global oceans.

Although Alpine glaciers are far less thick than their polar counterparts, they risk to by 2050 in current warming scenarios to loose 80-90% of their mass, altering downstream ecosystems by starving them of water, even if not flowing into the open sea. The starving of landscapes from freshwater sources is striking; glacier outlines allow mapping shrinking glacial margins in many regions, including mapping glacier devolution in Alpine areas by a combination of optical imagery and LiDar, as well as old arial photographs, to help to take stock of the loss of about 30% of the volume of forty-eight glaciers in the Austrian Silvretta in Tirol, revealing a rapid recession of glaciers the recent emergency of formerly ice-covered rock face, after gradual glacial retreat, suggesting the loss of a massive repository of frozen freshwater. Zurich’s World Glacier Monitoring Service (WGMS) has already detected a doubling of losses of glacial mass each decade since the 1970s; but the picture of losses at high latitudes and high altitudes needs to be made concrete for those living on near the coasts–despite the North Atlantic anomaly of decelerated mass loss.

Glacial Retreat in Tirol by Digital Elevation Models from 2017 (Black Boundary Lines)

We may lack commensurate memory or metaphors to describe the disastrous consequences of the disappearance of glacial mass, it never having occurred in human history–and any prospect of the growth of glaciers remain quite remote, and if folks continue to feel that “the science is still out on global warming,” the multiple impacts of global thawing will be far more less able to be visualized–or the species that will survive the different possible future scenarios of catastrophic climate change. The scenarios that have been lambasted and demeaned as “theories” but the record-low sea-ice places the survival of glaciers in Antarctica and Greenland that are surrounded by bodies of water at extreme risk of accelerated rates of disintegration that may advance to general collapse by 2050–the record lows of winter sea-ice in Antarctica this June 2023, over a million sq km below the previous record low set just the previous year.

We prefer to view the arctic with awe, and at a move. Or are climactic analogies bound to catch up with us, in inescapable ways?

The current burgeoning riverflow as snowpack melts in California, but may well exemplify the potentially catastrophic effects of raging river water throughout the Central Valley. Increased riverflow from the Sierras have not only rendered rivers dangers, but changed habitat, submerging vegetation and prompting fears of erosion on narrowed riverbanks–and indeed the overwhelming of the drainage systems of the state. The changing calculus of icemelt from the Sierras after a boom year of rainfall and snow said to have ended a multi-year drought will challenge the coastal habitats of the state’s rivers, as well as endangering swimmers: surging rivers stand to submerge older habitats, and suggest the need for more local studies of ecosystems and habitat in the face of increasing glacial ice-melt. The stressors are unknown if unimaginable; icebergs suggested to be linked to awe and abundance and timeless abundance, as much as fragility. Alaskan wild lands, coastal ecosystems in Greenland, the Arctic, Labrador and Newfoundland would be threatened in ways impossible to imagine.
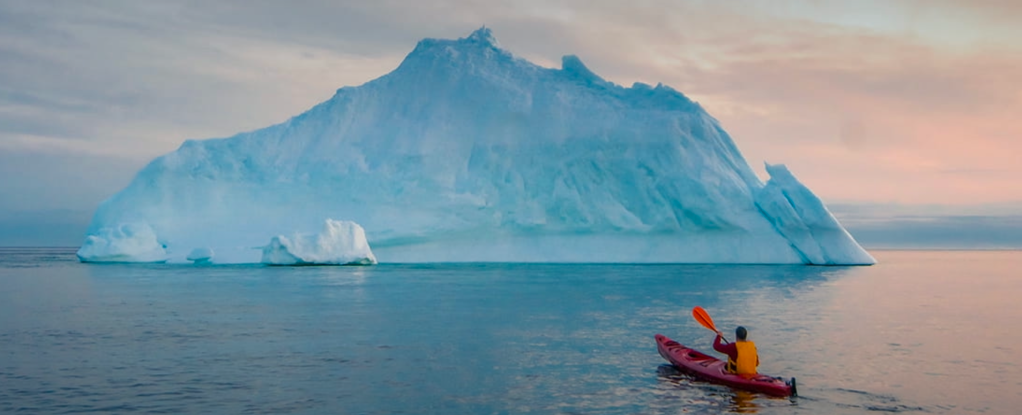
2. The glacial landscape is more acessible to those with the means than ever before, who might well imagine themselves as in a Thoreauvian wild. The expansion of polar melting has created, perhaps paradoxically accelerated, a new sort of ecotourism to search of remaining glaciers of solid blue ice. This seems more of a cross, to be sure, between the expeditions of Kent Kane and for purity channeling Thoreau’s attraction to the wilderness and the wild. Thoreau famously realized the glacial origins of Walden’s kettle morraine and glacial origins of Walden Pond’s purity by a glimpse of appreciation of its deep geological time as he stood by its stony shore. While the memorable image of him seeing himself in the snows of the Winter of 1846-7 preceded his epiphany of the glacial drift across New England, he focussed one spring after the pond froze on the almost animate veins and vessels in the patterns snowmelt created on the sandy banks of Walden Pond, more pronounced beneath the recently built railroad track, as the steep banks revealed “foliaceous heaps” whose interpretation he felt might reveal the secret of life, if not “nature in ‘full blast'” that he had so desired to discover in the wild. As he stood before the sandy banks of the Deep Cut beneath the tracks, as if witnessing ancient treasures uncovered by the construction of subway stops in Rome or Naples, he witnessed secrets of seasonal change and revivification of the vital spirits of Walden Pond in the life of inanimate sand, combining his own passion as a self-styled naturalist and interpreter of global history, in ways akin to the glimpses of calving icebergs, or of the epiphanic blue ice of ice ecotourists witness as they paddle off the northern latitudes in search of ecological grandeur of the wildstill able to be accessed or recouped off Newfoundland’s coast.

Thoreau famously found the most opportune moment for mapping the depth of Walden Pond in the midst of the preceding winter months, in January, 1847 when “snow and ice are thick and solid.” That winter, the arrival of over a hundred Irish laborers excavated ice of Walden for Frederic Tudor, the Boston ice-baron, using saws, ploughs, knives, spades, rakes, and pikes to remove some thousand tons of ice a day–and 10,000 tons in one week–that is often contrasted to Thoreau’s contemplation of the local and the infinite value of the priceless purity of the waters of Walden Pond. Tudor exploited the global circulation of ice packed in sawdust by train and ship that fed a global demand booming in the colonies and plantations for ice future cool drinks and ice cream on a far-flung market, in ways that offers an image of an earlier globalism, based on the growth of markets that failed to grasp the priceless value of Walden’s limpid transparency. But if Tudor and Thoreau are often contrasted, the enterprise by which Emerson was relieved to have the prospect of the “increased value” he might gain from his woodlot in Walden Pond by leasing the rights to harvest its ice to the businessman may well have provided Thoreau with a foil Thoreau detected in how Emerson perceived the “prospect” by which his woodlot by Walden Pond might recoup its cost and gain “increased value” to contrast to the thrift and economy by which he cultivated virtue while living in the woodlot quietly–and indeed fashioning a new sort of exemplary life for himself far from his father’s pencil trade or the commerce of Concord or Harvard’s academic halls.

Few sites of purity remain outside the arctic. But Thoreau discovered a method of sustained local observation of ecosystemic change that the melting of arctic glaciers demand. We risk devaluing how fast-disappearing glaciers feed ecosystems and ocean circulation, at the changed margins of arctic landscapes in an age of ocean warming. Indeed, the extent of expanding icemelt triggers not only feedback loops, but habitat loss, coastal erosion, and changing ocean currents that only local observation can track. If the order of neoliberalism dulled our senses to the disappearance of glacial mass, encouraging an era of denial even as arctic ice thinned, before the melting of 2007 trigered a shift in the thickness of sea ice with less ice remaining in the arctic seas from 2005, undermining the structures of glaciers, we are slowly leaving an era of denial in which maps are able to play an important persuasive role–both to rebut climate denialism and to come to terms with the new margins of the arctic, as arctic borderlands long imagined as permanent are poised to erode: by 2010, Greenland’s coast entered into a thin ice regime definitively, with sea-ice thinning in warming waters over the next decade. By 2019, one of the warmest summers in recorded history, Greenland’s ice sheet was losing some 12.5 billion tons of ice a day in the heat of the summer, in one of the largest events of melting since 2012.

Ice Loss in Greenland, 2013-19

If we have to travel ever further north to experience the timelessness of icebergs–“It’s taken them 10,000 years to get here, but you can discover them in just a click with IcebergFinder.com!”–the latest form of ecotourism seeks to celebrate the contact with a fast-disappearing north, whose “very narrow, very thin margins” have become far more narrow in the face of a warming arctic sea, as the surveyor W.V. Maclean told the pianist Glenn Gould, as we watch the ice floes of Hudson Bay. The stoic surveyor, pulling from his pipe, sought, like a modern Virgil, to summon the scarce abundance of the frozen arctic in ways that maps might ignore, for the CBC documentary Gould produced to show the northern reaches of Canada in a modernistic manner by overlapping audio tracks that commensurate with the “lifelong construction of a state of wonder and serenity” he saw as the role of art. Gathering awe for northern reaches of a nation he saw as generating insufficient awe for many Canadians, Gould clearly channeled his own fascination northward by rail and air, awed by the scarce margins of the northern reaches, the jagged edges of whose the margins of ice, embodied in the pristine barren of ice floes, his documentary reveals as a part of his own conception of art.

Pianist Glen Gould chose as a central subjects of his 1964 CBC Documentary, “The Idea of North,” the cartographer W.V. Maclean, as the surveyor with first-hand expertise of agrarian prospects of northern Canada offered a dry witness to the arctic to invite audiences to the north, far “from the noise of civilization and its discontents,” in an odd use of Freud’s phrase, not as an uncanny, but an the Virgil of unfathomably vast arctic regions entral and on the margins of Canadian identity. The surveyor offered a fitting profundity for the CBC documentary by inviting to reflect on the arctic while hearing a Sibelius symphony, which, despite the thin profit margins, was promoted as a sort of virtue that Canadians had for too long overlooked, daunted by the prospect of extensive rail. despite its thin margins, the arctic was the land of margins, demanding its own poet.

The thinning margins of glaciers and of sea ice are however increasingly hard to convey tranquility. The illusion of the smooth surfaces of global capitalism and markets are perhaps impossible to be reconciled with the jagged edges of arctic ice, or the consequences of the new margins of the arctic, and terrifying realities of the prospect for arctic melting–or global melting, a long neglected component of climate change. If the arctic circle is drifting northward at a rate of 14.5 meters every year, arctic melting accounts for over a third of sea-level rise, and the Antarctic circle shifts south by fifteen meters every year, the warming atmosphere melting long immovable glaciers. Shrinking margins of sea ice have retreated annually, as the Arctic warms four times the rate of the planet, as accelerated Arctic warming in the recent decades–spiking in 1999 and the mid-1980s–suggest that seasonal warming stands to cause massive loss in sea ice that changing arctic margins, and our understandings of the north, challenging earlier simulations and climate modeling.

These are margins that the point-based tools of geospatial technologies are pressed to assess on a local level or “downstream” from the deterioration of the arctic ice-shelf. It is as if we started to loose memories of the past landscape of the north: arctic sea ice has steadily declined since 1979 at the astonishingly rapid rate of 3.5-4.1% per decade. The scarcity of ice in the shifting margins of the north reveals quite different rates of ice melt; warmer waters beside the margins of shores have revealed striking anomalies of ice volume: the levels of sea-ice in May, 2023 were the ninth lowest on record,–considerably below the average of 1979-2022–as the decline of arctic ice elevations, the very age of arctic had precipitously declined by 2016, the “perennial” sea-ice more than two years old now a fraction of what had long been the significant majority of arctic ice.

The consequences felt downstream on local ecosystems, habitat, and coastal health we have yet to map. As impressive as statistical cryosat data on the thickness of ice-sheets across Greenland and arctic regions, we remain fettered by the difficulty of cognitively processing of ice-thickness anomalies, as great as they are, of a pointillistic character–to quote geographer Bill Rankin, whose coining of the term pointillistic cartography may well be steeped in his arctic surveys.

Sea Ice Thickness Anomaly For April 2023, Relative to 1997-2020/CryoSat 2, AWI, v. 2.5I

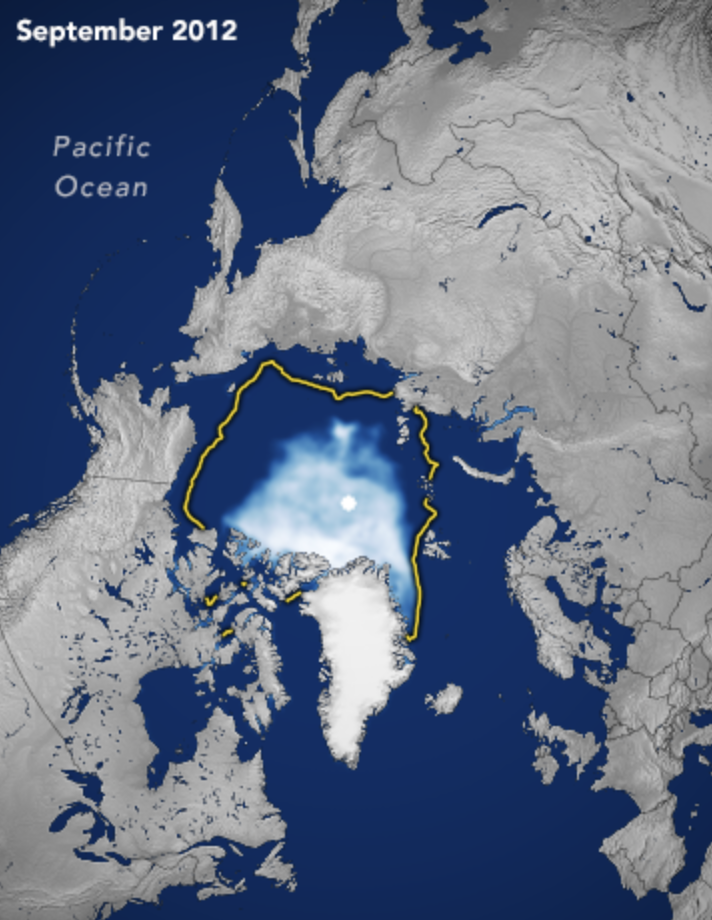
Only by looking in an iterative, analog fashion at the downstream consequences of habitat and ecological niches can we train our minds to better interpret statistical pixellation of ice-thickness variability, and the consequences of those dark blue pixels that crowd Greenland’s northeastern coast, and much of the Canadian far north on the edges or expanding margins of the once-stable Arctic Circle. Each deep blue dot of a meter and half anomalies in reading the fields of light blue pixels the Interferometric Radar Altimeter notes, where warming waters move north of the arctic circle, driving the rapid rates of ongoing steady shrinking of polar sea ice–and the disappearance of permanent sea ice, to judge by the seasonal retreat of frozen seawater in recent memory from the pole during the past two decades against the 1981-2010 median.

While we isolate this as a northern phenomenon, limited to an “Arctic Sea,” its constitutes nothing less than an undermining of the collective memory of oceans of the flora and fauna who are its residents–perhaps particularly in Alaska and Canada’s north, but also Siberia and Greenland.

Seasonal Extent of Sea-Ice at North Pole against Median (yellow line), September, 1980-2020/ NASA Earth Observatory

The decline of the age of arctic sea ice is a diminution of arctic memory, and a change in the arctic landscape. It was not anticipated however, in ways that may seem to accelerate the fast-changing nature. Despite longstanding convictions of the immunity of Arctic permafrost to global climate change, as if the coldest areas were somehow immunized or inoculated against thawing.

Yet Google Earth Engine datasets have over the last fourteen years indicated a massive increased in arctic landslides triggered by melted ice in the permafrost during the summer months–“thaw slumps” of long frozen matter able to release potent greenhouse gases as methane emissions in the atmosphere and carbon dioxide in the fastest warming areas of the world of the high Arctic are unable to be stopped–reshaping the arctic landscape in ways that may in time lead to the eventual disintegration of the ice sheet. Glacial melting prompts the growth of coastal landslides created by the collapse of rock glaciers long held together by ice–avalanches and landslides grew in 2014-19 across the warming north, catalyzed or triggered by glacial retreat. In the face of such expansive rewriting of the arctic margins, we risk ignoring the more analog, recursive, local observations of wildlife and habitat that Henry David Thoreau, for one, detected at Walden Pond’s margins, preserving tallies of the dates at which irises, lilies and blueberries bloomed around Walden Pond, allowed Charles Davis and Richard Primack to understand and indeed measure the climate change by howh warming’s shifted the dates of flowering of irises and lilie–giving new sense to Thoreau’s stay at Walden as an experiment,–beyond as one of living in nature or refining his own abilities of sense-perception, but providing an experimental baseline to observe the effects of global warming.

The growing margins of glaciers, including ice tongues form from the flow of ice from many northern glaciers in the northern glaciers of Greenland’s ice sheet and the largest southern glaciers track the migration of long-frozen ice to the arctic sea, increasingly visible in the last twenty years. But can we come to terms with the study of their effects outside of similar analog observations?
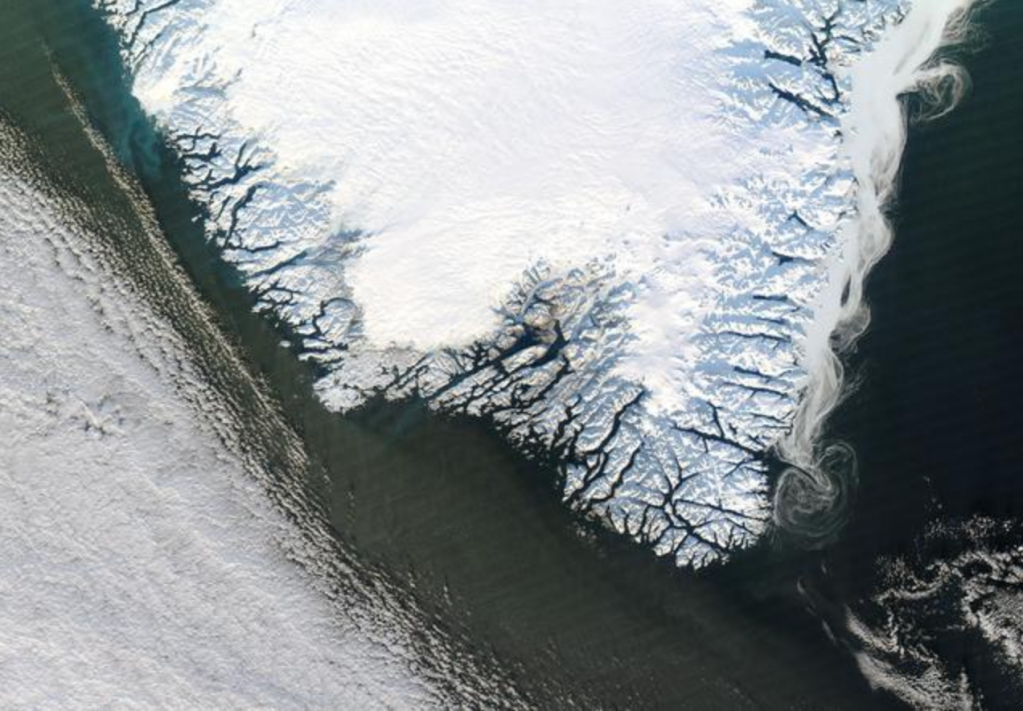
Greenland’s Melting Ice Sheet/NASA/GSFC

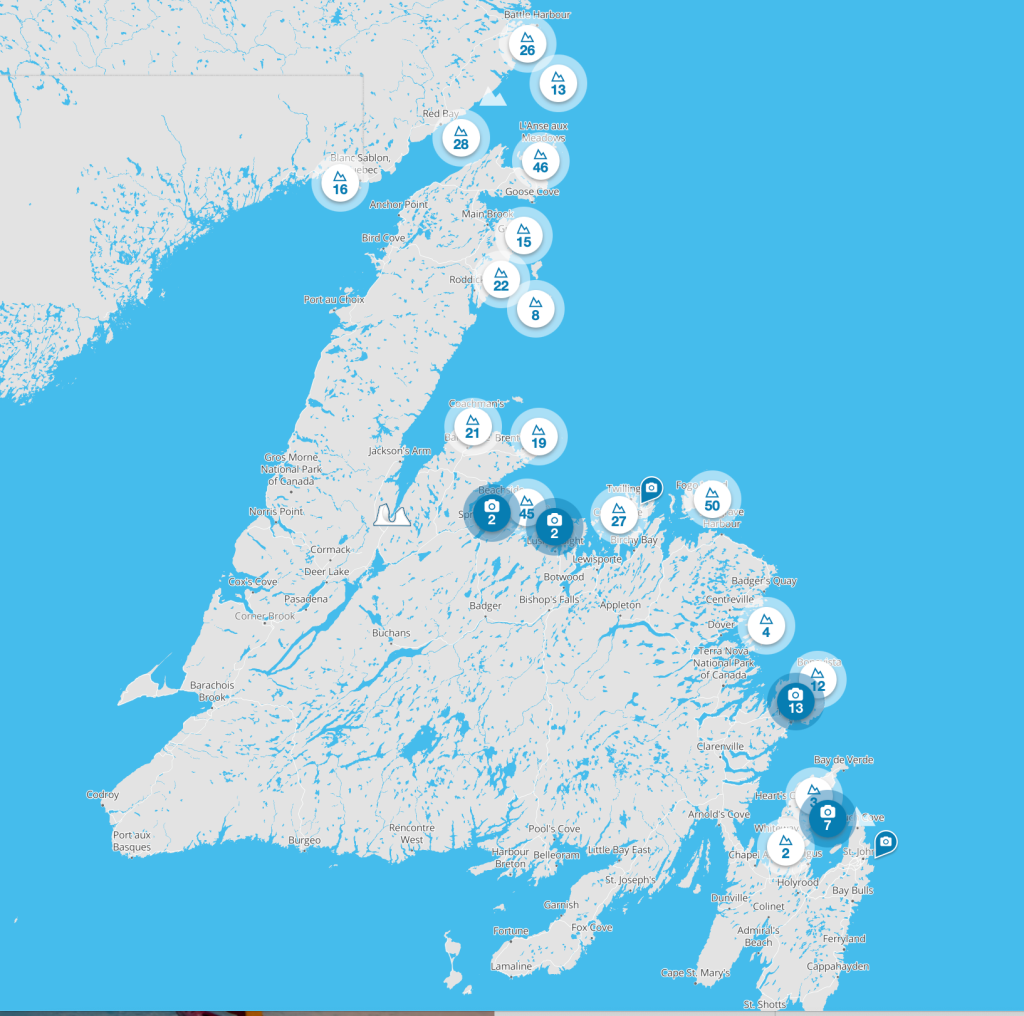
3. The retreat of glacial ice sheets in Greenland, which is melting in a warming ocean past the point of no return, is already losing 255 gigatons of ice each year, 2003-16, and while its melting is not inevitable, its melting–measurable by elevation loss–would increase as its elevation lowers to an ever warmer atmosphere. And as the coast of Greenland, long a source of iceberg transit, seems to melt, he viewing of icebergs, those last remnants of a frozen Arctic Ocean, are tracked not as sites of self-reliance, are crowd-sourced for tourists, as if testimonies still promising access to a divine,–

-as if to arrive at the Walden-like purity of a blue-tinged spectacle of ice off the shores of Labrador or Newfoundland, while they are still visible, still floating as remants in the warming arctic waters.

IcebergFinder.com/Newfoundland and Labrador

Continue reading

2 Comments

Filed under anthropocene, arctic melting, climate change, climate modeling, global warming

The New Arid Regions of the United States

The southwest and states east of the Sierras magnify the effects of global warming in the intensity of their aridity. But global warming reveals a new relation of regions to overheating, and reveals the depths of inflexibility to accommodate water scarcity, as well as the tragedy of its effects. As aridity of the soil and reduction of groundwater reaches unprecedented scales, our passivity is accentuated as we are suspended before maps that try to visualize unprecedented aridity magnified by global warming and its magnifying effects.

For the cascading effects of warming on the land and environment might be mapped in ways that cannot essentialize the greater “aridity” of the region, but the effects of increased aridity of soil, air moisture, and dry air on a region that we have remade into a region of food supplies, agriculture, and livestock, but, beyond, on hydropower. While the Colorado mountains long provided an effective basin to gather rainwater for western states that have been funneled to state reservoirs for agricultural irrigation, the man-made irrigation networks were drying up as the snowpack determinedly fell, and warmer temperatures evaporated what snowpack fell.

The logic of this longstanding pattern of appropriation of water from across the Colorado Basin was in a sense begun with the Hoover Dam, but was, writ large, organized by very process of appropriating water rights to redistribute water that had been enshrined in California from the turn of the century, circa 1914 and the policies of filling reservoirs to redistribute water rights. While we have considered appropriative water rights a distinct feature of how water is redistributed unique to the Golden state, the appropriation of water rights by reshuffling of water in state’s now precarious supplies how diverts over 99 million acre feet of surface water diverted along the Sacramento and San Joaquin Rivers to farmland, created a powerhouse of national agriculture. Much of the 75 million acre feet that flow from reservoirs across the state evaporates before it arrives at crops, however–far more that actually reaches the farms or cities.

–and the growing heat of the Great Plains have likewise diminished surface flow of the Colorado Basin already reduced by diminished rainfall. The increasingly warmer atmosphere of recent years has created a new “Arid Region” of the United States, of even greater aridity than when it was first mapped by John Wesley Powell in 1890, and the renewed aridity of the region not only challenges the calculus of water distribution according by appropriative rights that is structured by the Interstate Compact, but the very logic of redistributing water.

The past two decades have seen the departure of seven trillion gallons from Lake Mead, the largest reservoir on the Colorado River, holding rainflow from the Upper Basin before it crests the Hoover Dam. The drop will trigger hydrologic stresses across western states, as ever ever-increasing amounts of water are sucked up into drying out air and atmosphere, requiring more abundant irrigation of croplands and grazing grounds. This new and expanded “Arid Region” suggests a return of the repressed, returning at even greater scale and aridity to haunt the nation by a lack of groundwater again.

Evapotranspiration Rates in Colorado River Basin, Landsat 13

that is not to say it ever left. But the solutions of diversion have been undermined by the cascading effects of climate change and increasing temperatures, across an expanse of irrigated lands where water from the Upper Colorado, as from the western slopes of the Sierra Nevada, are funneled to cities, farms, and irrigation projects, and used to generate electricity. Even as Californians and westerners face the threat of further fires more destructive than any in recorded history–potentially enough to energize an implausible recall effort in the state of California–we face the problems of managing not only historic drought, mandated energy shortages, reduced water supplies. The climate crisis appears to have provoked a deep crisis in leadership, but one without easy means of resolution.

The most improbable political candidates–global warming skeptics after Donald Trump’s heart–have argued drought, wildfire, and electrical storms reveal Gavin Newsom’s lack of leadership, even as they stridently object to aggressive climate legislation aimed at emissions reduction as restraining the free market business,– preferring a free market approach for all climes that would be the laissez-faire redistribution of water to the highest bidder, monetizing a scarce resource to consolidate financial profits and gain in response to diminished water supplies.

As more water is being released from Upper Basin reservoirs to make up for the shortfall in Lake Powell, but the shortage of water in Lake Mead–the largest reservoir in the United States–to less than 40% capacity by 2022 will mean reducing water for lower basin states like Arizona of 812,000 acre-feet, Nevada–by 21,000 acre feet, and Mexico, by 80,000, that have led to the call for new “water markets” to be created across the western states. Indeed, even western states no longer carry the brunt of increased use of freshwater for irrigation–

High Country News

–the demand for conserving water in agriculture is increasingly incumbent on western states, so much so that the shift to less water-intensive crops–like California’s almonds–at a time when many crops require more irrigation, and a shift toward fewer acres of pasturage for livestock–good luck–have become a necessity. Increasing the efficiency of irrigation systems is necessary–ending customs of flooding fields, increasing drip irrigation, center-pivot irrigation, or micro-irrigation, in a New Deal for agriculture, even regulating irrigation systems before water markets price rural communities out of their accustomed access to freshwater. The increased trend toward shifting the distribution of water by “water markets” from lower- to higher-value use is dangerous for farmers, and indeed all rural areas, but also for the western ecology, as it would be the most difficult to preserve water in rural communities or farming areas less able to pay for pricing of water for higher use-value, although they currently consume over 70% of the water in the Colorado basin, or encourage sustainability in regions that are increasingly facing realities of sustained drought, if not megadrought of unprecedented intensity.

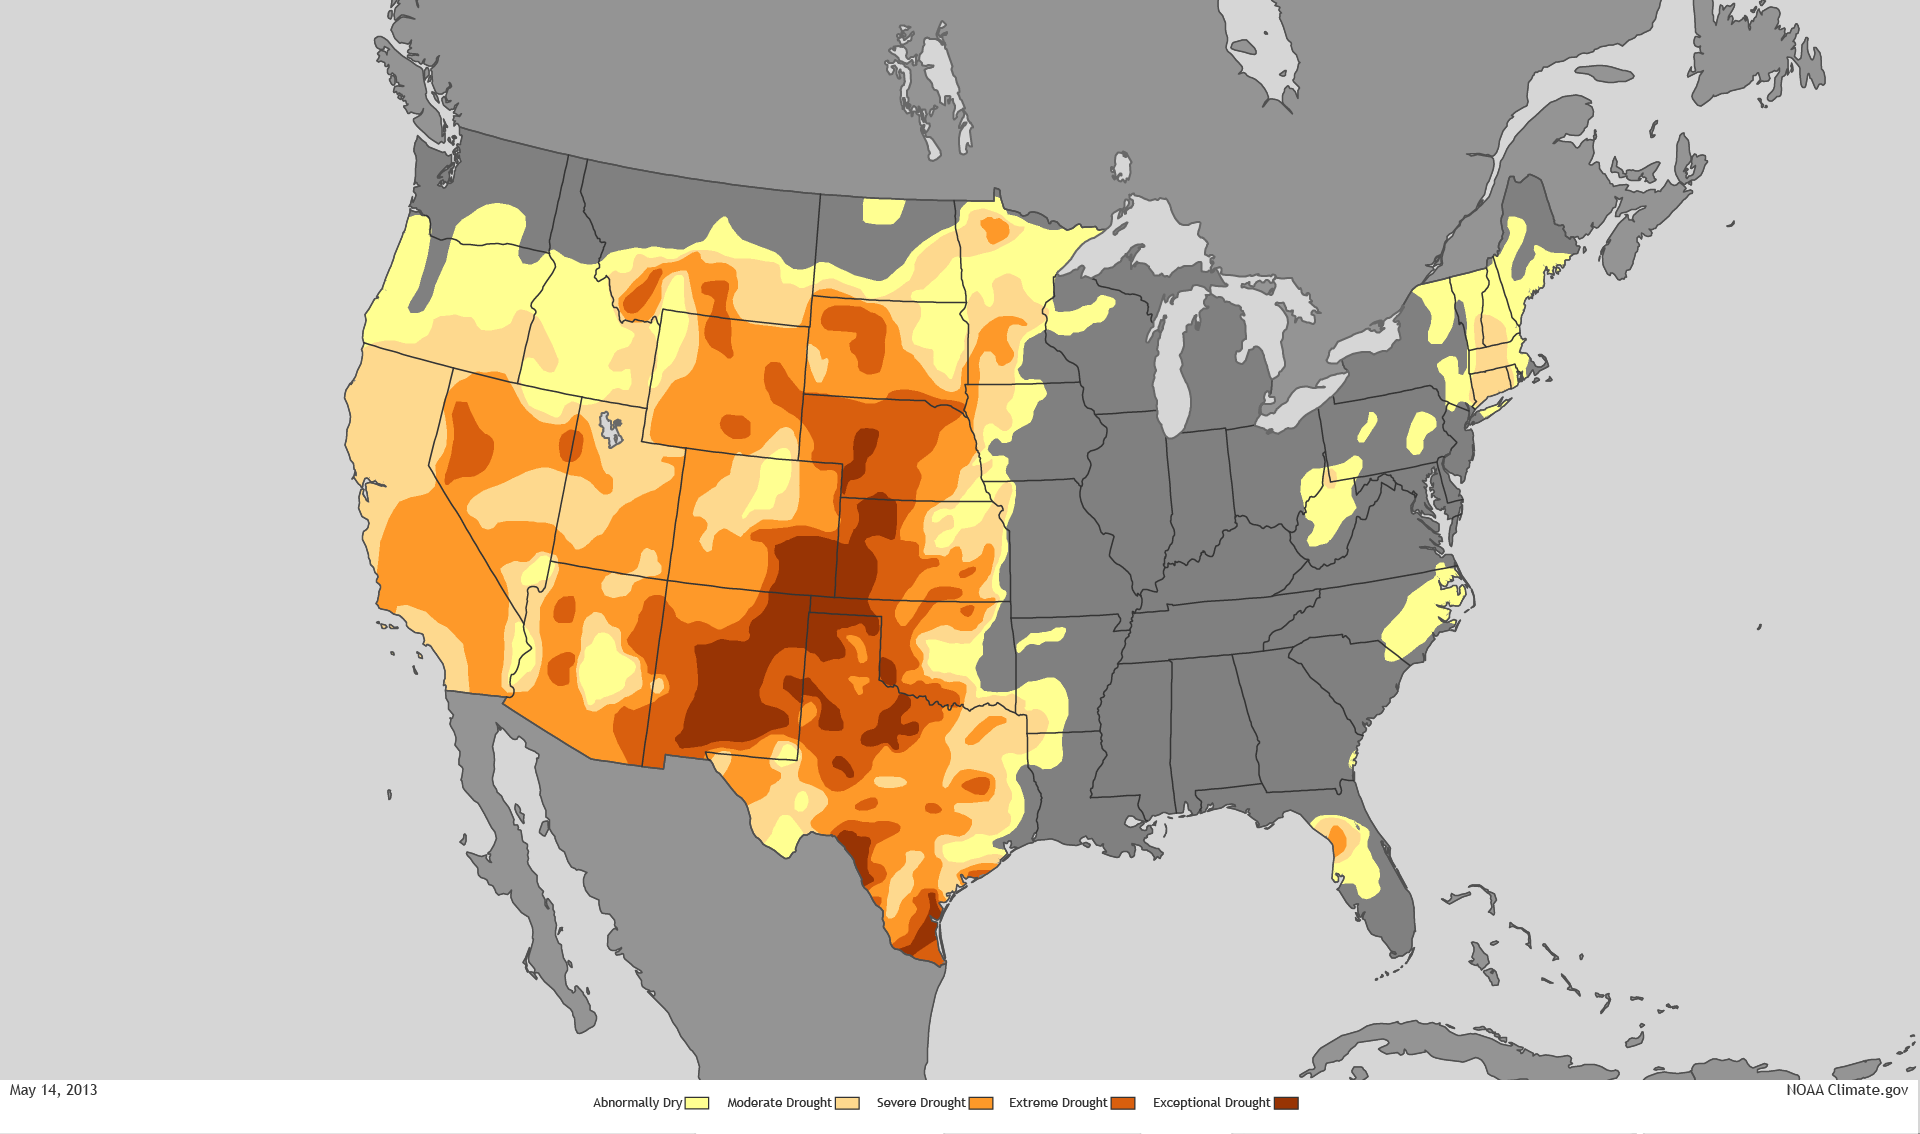
United Stated Drought Monitor for Western States, October 2021

Yet the systems of allocating water from the Colorado River by a system of dams, diversions, and canals have led to broad calls to end further projects of water diversion, as the diversion of water to western states may be drying up itself by up leads to calls for new policies of allocating water, not based on the highest bidder, as the river we have made increasingly mobile across boundaries will be divided or redivided between agriculture, urban use, indigenous Americans, and land trusts, as we are in need of redefining the working basis for conserving the redistribution of water rights beyond capture and diversion, and outside of existing water markets and appropriative water rights within states. While the Bureau of Land Reclamation has run the reservoirs, dams, canals, and hydroelectric plants and contracting with individual districts, a broad reconception of practices of regulating water markets, allocations of water, and costs of large-scale water diversion, as demand for water outstrips supply.

Yet as increased farmers are withdrawing water from the ground, or from rivers, from California’s Central Valley to the Lower Colorado River Basin, in Arizona, New Mexico, and Nevada, the need to reduce the eighty percent of water dedicated to agriculture across the west will demand new practices of conservation, beyond what John Wesley Powell mapped, in 1880, when he advocated new practices of land use, as climate change increasingly destabilizes the Basin, including the thirty sovereign Native American tribes along the river basin. The need to manage demand and riverflow that will begin with the start of the “Tier One Shortage” from 2022, will introduce new rules on water-use and supply that stand to reduce the amount of water flowing to Arizona by a third. Water diversion from the Colorado River has transformed the land west of the hundredth meridian by re-engineering its flow to make the “desert bloom.” Yet the recent dramatic reduction of rainfall, river flow, and increased aridity of the lands, leave us contemplating the viability of relying on water diversion.

John Wesley Powell, “Arid Region of the United States, showing Drainage Zones” (1880)

The new arid region is reflected in weather maps, but will be a region of radically reduced piped water and a new landscape of hydrologic diversion. If the “Arid Region” was mapped in earth-tones of clear distinction as a cautionary way by explorer and geologist John Wesley Powell, to alert the government to the distinct climate of lands west of the hundredth meridian, the recent area is both based on more detailed and specific remote sensing records, often from satellite observation, but suggests a far more complex area to manage.

For the western states are linked, both by projects of water diversion, and by hydropower, to a region where rainfall and snowpack has declined, and far less water enters into the river-flow of the rivers whose diversion allowed the expansion of agriculture and livestock across the western states. Due to global warming, the earlier “arid region” expanded, returning bigger and better than ever since it was described as extending west from the hundredth meridian by John Wesley Powell, in one of the foundational maps of climate aridity. In today’s parched California, dangerously low levels of rainfall across the central valley seem to belong to the Arid Region. But we have hardly come to terms with its new expanse or migrating edges. The “lands of the ‘Arid Region'” that Powell had hand-colored with earth-tones to communicate the dramatically falling rainfall west of the hundredth meridian long ago mapped a biting response to the eagerness of homesteaders to Go West, cautioning about constraints on water-rights that division by states–rather than drainage districts–would bring. If current rainfall maps of USDA or EPA seem to engage in dialogue with Powell’s old polemical cry, the limited traction of mapping policy against increased pressures of climate change place most maps in a sort of Scylla and Charybdis, located not in the Straits of Messina, but the scissors of decreased rainfall, rising temperatures, and lack of groundwater retention.

1. The problems of managing water rights and ensuring flow are now far greater than what Powell’s creative palette of before the fact overlays even imaged was able to depict, and was a puzzle beyond the interlocking pieces of drainage districts that he–as if akin to the first puzzle-boards composed of hand-painted maps, as this forty-nine piece puzzle map of ca. 1849, painted by Kelly & Levin, of the similar region, that curiously compressed the western United States. Was Powell’s map indicative of the difficulty of solving the puzzle of allocating water resources across arid western states?

Puzzle “Map of California, Mexico, Texas and the United States,” ca. 1849, Kelly & Levin. Boston MA

While the puzzle pieces rarely echoed the shapes of individual states, undoubtedly because o the difficulty of their cutting the contours of states, the puzzling of how the rivers of the west would align with states in this roughly contemporary 1880 Milton Bradley map-puzzle, an “Outline Map of the United States,” posed by including light blue rivers across a map with little sense of varied topography.

ca. 1860, M. H. Traubel, Lith., Philadelphia PA/American Antiquarian Society

In contrast to the resolution of assembling individual pieces of a map of fixed bounds, the expanded arid region mapped by remote sensing spans a farther territory and expanse, and raises deep questions of access to water or even soil moisture in a region that developed as an agricultural breadbasket and locus of husbandry of livestock.

The growing puzzle broached by how the water supply of the west will be reassigned is rarely faced or addressed, although it is ruminated upon as the sub-text–or super-text?–of terrifying maps of rising aridity and low rainfall across the western states, that magnify a new “arid region” with less clear suggestion of an outcome of land management but pause before the cyclically compounded effects of rising heat, low soil moisture, limited run-off, and the specter of drastic irrigation cuts.

Current remotely sensed maps use far less clearly set boundaries or edges of water-shortages, but pose similarly pressing puzzles of how to resolve the appropriative logic of water rights, as drought intensity reduces the water that once flowed from the “upper basin” of the Colorado, feeding the river and redistributed water, and even more surface water is lost to evaporation.

Snow drought is worsening the American West's water woes | The Economist

The puzzle of hydrological access to land-water has become so curtailed across western states, that increased pumping of groundwater risking depleting aquifers by draining vital aquifers, irreparably damaging rivers and riverine waters. The New Arid Region, afflicted by far more aridity and low soil moisture than at any time, parallel to increased global suffering of warming and increased heat, the persistence of private water “rights” to agrarian expanse stand increasingly on a collision course with global warming throughout the new arid West in ways we have yet to address, even as we recognize that we are facing a climate emergency of the sort without precedent in modern memory.

2. No single visualization can, perhaps, adequately come to terms with the unprecedented aridity of the recent years. For no visualization can fully capture the cascading and magnified effects of declining water and soil health, and their effects on ecosystems, as much as on livestock or irrigated crops: the distance from reduced irrigation and new climate specters demands an intensified map. But the terrifying nature of the intense aridity of western states in part lies in how we have seem to forgot the semi-arid nature of the region. The deeper effects of a drying out atmosphere were evident in the huge deficit in water vapor in the past decade during the “fire season” from August to September, dramatically unlike how fire fighters navigated the same terrain in previous decades, when many fire containment strategies were developed and many active firefighters had trained. The map is one that should raise immediate fears of the loss of a landscape of future irrigation, and the need for tightening agricultural belts and shifting our conceptions of food supply and water budgets–as well as the same landscape’s increased combustability and inability to manage or control by an old playbook.

Decreased Water Vapor Present in the Air in Past Decade from Two to Three Decades Previous

The previous month has brought an even more pronounced record of drought across the Upper Basin of the Colorado on which so much hydropower relies, as do other schemes of water diversion.

US Drought Monitor for Colorado River Basin, September 23 2021/Brad Rippey, USDA

The revelation of a new intensity of exceptional drought in many pockets of the Upper Basin of the Colorado River presses the bounds of how we imagine dryness, aridity, and their consequences, even as we rely on older methods of fire-fighting, and fire-prevention, and outdated models of water diversion and energy resources.

The historical denial of what John Wesley Powell had already called the “Arid Region” west of the hundredth meridian, has become a snare for ecological disaster translating into a process of the drying out of long-irrigated zones, with consequences that the nation has not been able to comprehend–and demand a New Deal of their own to replace the diversion of water and generation of energy in the Hoover Dam. Or have we forgotten the intensity of a differential of climate, soil moisture, and increased aridity that Powell long ago mapped in order to illustrate the new regime of government its unique atmospheric conditions it would require, using his uniquely designed palette to hint at the best way to organize the region of water scarcity according to the units that its drainage districts–rather than the state lines surveyed by latitude and longitude?

John Wesley Powell, “Arid Region of the United States, Showing Drainage Districts” (1890)

Powell had explored the canyons, rivers, and plains, as he addressed the Senate Select Committee on the Reclamation of Arid Lands in 1890, he crafted an eloquent seven-color map of rich earth-tones to impress readers with the sensitivity of the region’s texture and urge restraint for expanding the westward flow of homesteaders with hopes to make the desert bloom. Indeed, by circumscribing areas for which sufficient water in this “Arid Region” would be able to providently allow future settlement, Powell neatly divided areas for settlement in a region by hydrographic basins collecting sufficient rainfall for farming. Whereas rainfall maps of previous years mapped a blank spot of water scarcity, Powell hoped to direct attention by a devising a map of the region’s subdivisions that called attention to its soil quality and decreased moisture, focussing on its distinctly variegated terrain in ways foreign to Senators in Washington. Powell hoped to convince who were removed from the region to acknowledge the commanding constraints created by these drainage districts for all future agricultural development and settlement–an unpopular position that ran against the notion of allocating free land in an age of expansive homesteading. If the image of a “drainage district” was foreign to existing state lines, Powell’s image of an “arid region” long haunted the geography of the American West–and contributed in no small part to the subsequent reengineering of the waters of the Colorado River.

In light of the dramatically increased aridity now endemic to the western states, Powell’s map gains terrifying relevance as western states enter severe drought, placing the breaks on once-expanding developments across western states. Powell’s map articulated a historical vision of the limited infrastructure of water in the American west. While the technologies of irrigation that allowed such a massive project of damming and canalization only later developed, did his map inspire the need for a project of such scale as a better model of land management? The intensified aridity that afflicts the western states responds not only to low levels of rainfall. We continue to hope groundwater depletion that afflicts the lower basin won’t extend to the Upper Basin of the Colorado River that has captured water on which so many farmers rely–and thirty-five million north of the border and three million living in Mexico depend, across its Lower Basin. The escalating megadrought has created pressures across the overpopulated west that the water-sharing model Powell proposed for drainage districts cannot resolve, but the distinct forms of water management he advocated have been forgotten, as the declining water level on the Colorado River seems a time bomb as its waters have fallen so far below capacity that while the waters that drain from the Upper Colorado into Lake Mead, the largest reservoir in the western states, are only 37% full, and Lake Powell stands at 34% capacity. As less and less water enters the river system of a drying-out west, the future of the river on which so many rely for irrigation and energy is all but uncertain.

The water-level of Lake Mead, the largest reservoir in the US and a critical source of water for millions across the Southwest, has fallen 140 feet since 2000, a third of capacity.  Can we come to terms with the increased aridity across the west that the drying out of the Colorado River may bring?   The western states are haunted by the return of the "Arid Region" John Wesley Powell once mapped.
Lake Mead, May 2021

Demand for water in the upper basin and older technologies have meant far less water reaches the lower basin, but what does has been redistributed across western states–absolutely none reaches the ocean at the river’s old delta. Supplies of surface water and groundwater barely provide for the border region, as the overdraft of the basin’s aquifers have made trans-border water management a crisis often overlooked in favor of water management north of the border. As unprecedented soil aridity currently seems to run off the rails, after three summers of no rainfall have depleted soil moisture, may remind us how we have missed the lesson of Powell’s map of instilling new set attitudes toward the land, as the volume of riverflow consistently dropped as it crosses the Mexico border since the filling of the Glen Canyon Dam.

Does selective amnesia underlie how we map the drying out of the west? Most data vis of rising temperatures and low rainfall across the western states is already magnifying and escalating the effects of unprecedented heat over twenty years in a deeply melancholic vein, daunted by the scale of dryness across such an interstate expanse, and passive before an absence of atmospheric moisture that seems a modern casualty of global over-heating. If we were already “living in the future” in California’s frequent and increasingly extreme fire regimes, the multi-hued data visualizations electrify the landscape–and not with power or hydro-energy, but by the all-too familiar color ramp of the extremes of climate change we have been trying hard not to normalize. These images chart a landscape that has gotten away from us, outside seasonality changes, making the American West a cautionary case study for global climate change inspires melancholy.

The additive logic and graphic syntax of maps, long before the separate map-“layers” that accommodate information from GPS, provided a basis to define the fungibility of water and the emergence of “rights” to water across the Arid Region, enabling the idea of governing the transference of water and water “rights” across the region, that separated water from the landscape and environment. The flow of water had long been understood and reconstrued in the west by a logic of irrigation needs–and the “rights” to unpolluted water for livestock raising, pasturage, and agricultural needs of land owners–that was removed from conserving groundwater needs. The increased nature of the fungibility of water as able to be transacted across basins, state lines, and counties reflects the legal fiction of considering water as a “good” tied to the needs of property owners, that, long before global warming, had already sanctioned the removing water from the ground.

If we use metaphors rooted in temporality that try to come to scale with the new era of global warming that cut down and perhaps minimize the era of water scarcity. in which we are entering–“heat waves,” for example, that broke records in states from Washington to Idaho in June and July, breaking or matching records of hot temperatures, the levels of aridity that have allowed the ground to grow arid and degrade have not only led to a spate of western wildfires, but have changed the levels of soil moisture over the long term in ways we have difficulty to map in the scale of our weather maps, or even the maps of the U.S. Drought Monitor, as the cascading influence of such unprecedentedly dry conditions–where stresses on river water create extraction of groundwater that stresses aquifers and groundwater supplies–can be scarcely imagined, or confined to the conventions and color ramps of weather maps.

We have struggled for decades to process the cascading effects of waves of unprecedented heat that over time have produced a drying out of soil and reservoirs over the past twenty years, resulting in an expanded and far more destructive fire season and parched lands whose effects we cannot fully come to terms or comprehend, as we have not seen or experienced the extent of dryness of subsoil, soil, and low rainfall which the US Drought Monitor seems to have mapped, as drought expanded not across the entire Pacific Northwest, from Oregon to Idaho, or 86% of Idaho–by the land’s combustibility, impossible to read without premonitions of lost forests–including old growth forests–melancholic fears more than tinged by an acute sense of a lack of agency.

The sense of struggle with an absence of agency–at the same time as an almost moral urgency–reflects the difficult to process such absence of water as a landscape we have inherited from the rapidly accelerating dynamics of climate change. The history of the increased aridity is all the more poignant as a source of melancholy not only because exceptional drought was the standard before President Trump, and a national emergency before his Presidency. We have failed to register this national emergency with the same immediacy, even as the theater of the border was magnified in disproportionate ways in public discourse on migration. The sense of melancholy is compounded as the map seems haunted, if only tacitly, and perhaps without acknowledgment, by the fact that the head of the USGS in 1890 admonishingly illustrated virtually the same basins now suffering severe and moderate drought as distinguished by semi-aridity–if the current levels are nothing like those faced over a century ago, when the transition of public to private lands. We have recently mapped the substantial threat of increased aridity to the Great Plains–less than a tenth of whose croplands are irrigated–where farmers depend entirely on rainfall to grow soybeans, sunflowers, cotton, and winter wheat, the fear of greater “dry spells” as anthropogenic emissions drive decreasing rainfall and groundwater reserves–a term that tries to convince us they are not permanent–led red flags to be drawn in broad brushstrokes in those states, where extreme and exceptional ‘drought’ .

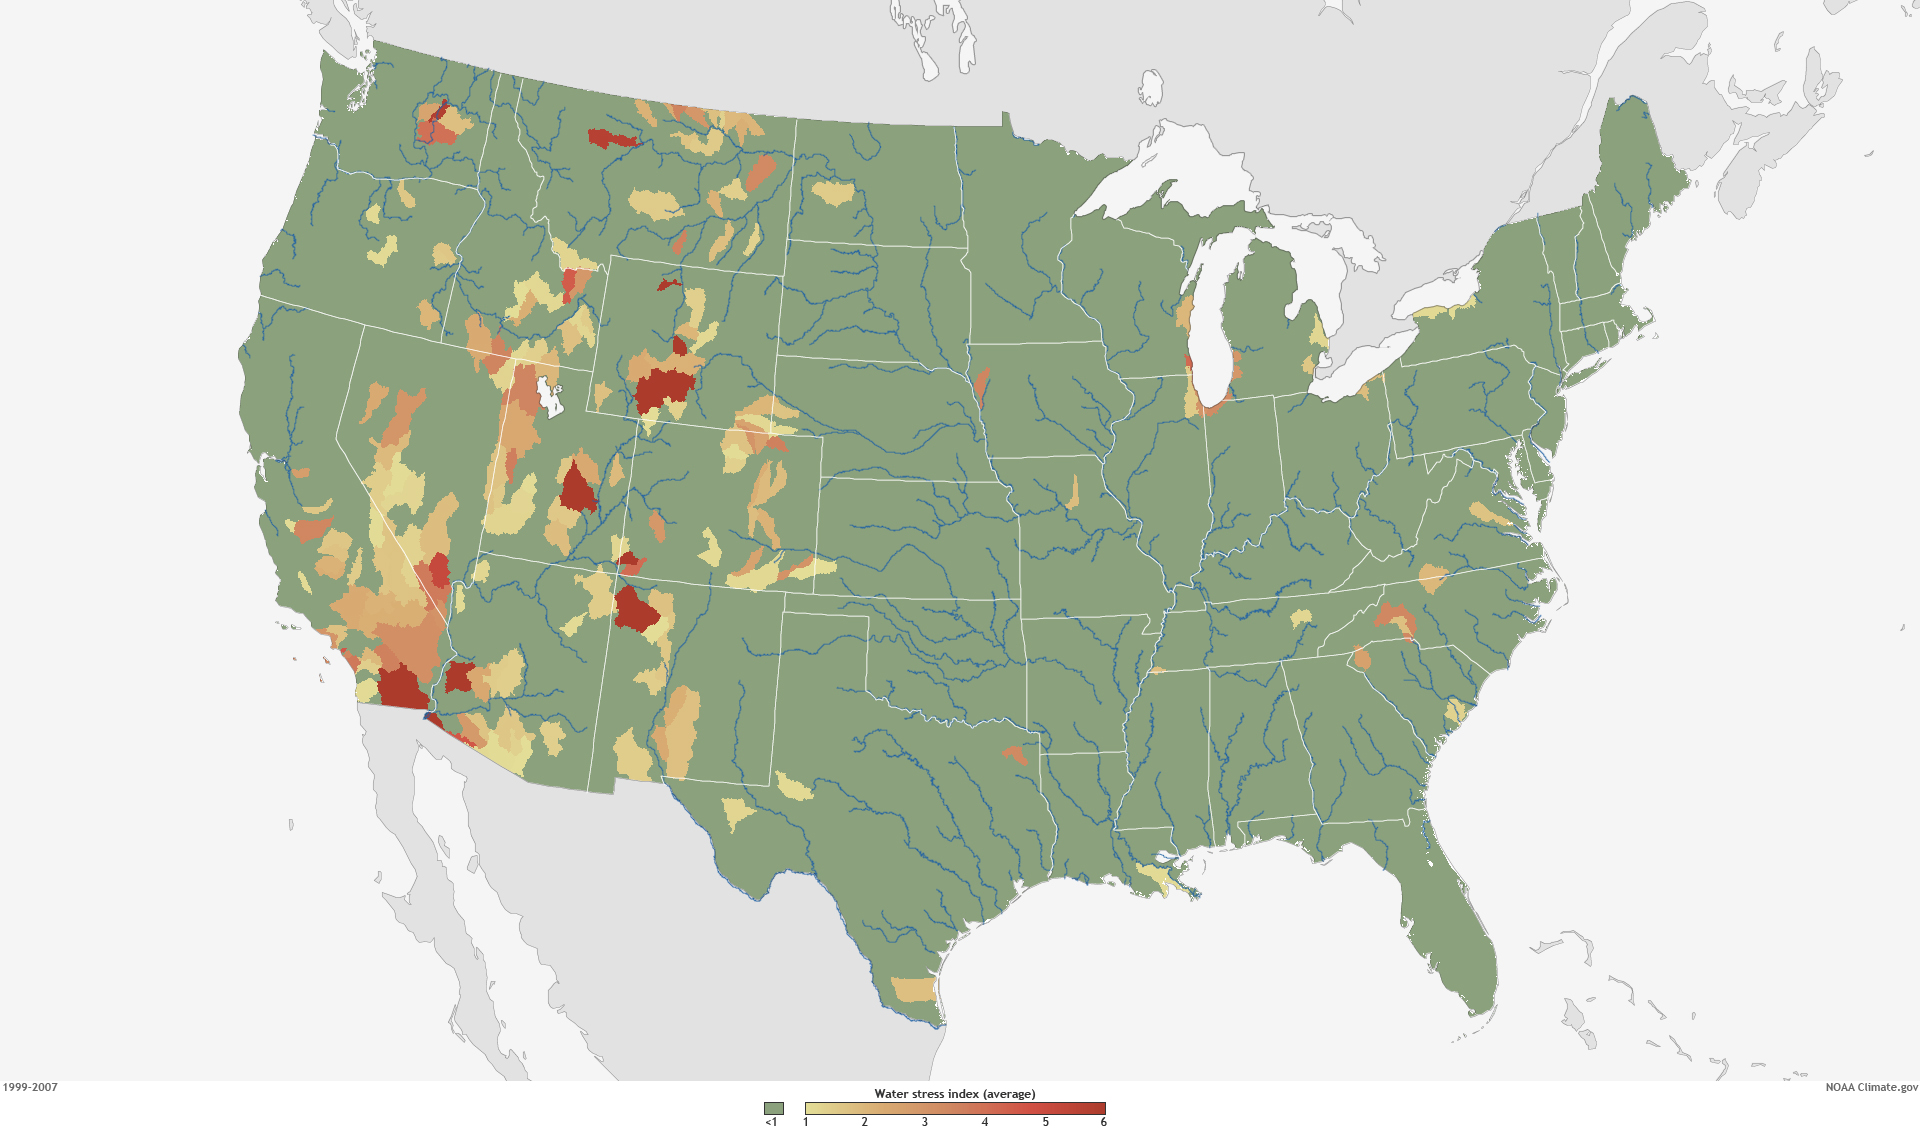
But climate change has created a new concept of “water stress”–stresses best be pictured not by the isotherms of weather maps, but the watersheds and drainage districts that were the basis of Powell’s revolutionary map, and matching the very region of the Arid Zone where the soil scientist Powell turned viewers’ attention to the crucial index of ground and soil moisture, the true determinant of the future of agrarian settlement and the future of food. The regions determined of greatest future stress were the very basins that Powell mapped, and suggest the relevance of his map, as well as his caution of the difficulties of governance in an area of severe water stress-stress being understood and indexed as a relation between supply and demand, as well as rainfall, in national watersheds.

3. The “Arid Region” of the Untied States had been austerely and admonishingly described by John Wesley Powell as a geologist to caution against the administration of its future settlement with a level of clarity that reveals his Methodist upbringing. It is hard to know how clearly we can ever parse aridity, in an age when rising temperatures have unremittingly drained soil of water. As if informed by a deep respect for the map as a clarity of record, possessing the power to reorient readers to the world by preaching a new relation to the land, Powell had placed a premium on cartographic form as a tool to re-envision local governance–and prepared his striking eight-color map of the limited rainwater that arrives west of the hundredth meridian, the eastern border of what he baptized as the Arid Region, an almost zonal construction akin to a torrid zone.

The imposing title of this reclassification of the interior of the United States revealed Powell’s own keen sense of the map as a visual record of the territory, whose transparency as a record of the quality of the land would be a basis for all discussion of settlement. Powell parlayed his own deep study of the geography of the Colorado Basin to query the value of parsing the administration of water rights by state lines in 1890, convinced of the need to oversee later apportionment outside the jurisdiction of the arbitrary boundaries of western states, but joined them to his sense of duty of preparing a legible map of striking colors to convey the constraints and difficulties for its future settlement– not only by the scarcity of the threads of rivers curled against its topography, but the few watersheds.

Powell trusted the map might mark the opening of the “Great American Desert” in order to alert the US Congress that the dry lands west of the hundredth meridian was a divide. Even if the meridian no longer marking as clear a divide of reduced rainfall, as we confront the growth with unprecedented degree of global warming of a parched west–both in terms of reduced rainfall and declining soil quality–it may serve as a model for the map we need for the future governance and administration of already contested water rights. Powell’s place in the long story of soil quality reflects how neatly the American west as a microcosm of global warming is rooted in the conversion of public lands to private ownership, into which warming has thrown such a significant wrench.

Arid Region of the United States, Showing Drainage Basins (1890)

For the Arid Region’s aridity has since been unremittingly magnified, producing a region more arid than we have ever experienced and struggle to find an adequate color ramp adequate. But we would do well to try to map the forgetfulness of that arid region, even as we confront the quandary of the stubborn continuity of sustained dryness of a megadrought enduring multiple years, compounding the aridity of the soil, and multiplying fire dangers–and the conditions of combustibility of the region–far beyond what the west has ever known or Powell imagined possible. If aridity of soils and poor land quality has spiraled out of control due to “global warming,” raising questions about the future of farms and livestock, the absence of groundwater and surface water alike, global warming demand we shift from national lenses of water shortage to beyond American territory,–but also to discuss the warping nature of national lenses on the remaking of the sediment of the west–and Colorado Basin.

The difficulties of parsing river-flow by “states” as helpful political aggregations for future settlement was rebutted by the map, which sought to direct attention to the aridity of the ground’s soils to orient its administration in a region where water was destined to remain front and center on settlers’ and residents minds for the foreseeable future. The subsequent attempt to jerry-rig the question of scarcity of water by entitlements that rely on re-apportioning unused water escaped the constraints Powell located in the basic common denominator of groundwater.

As much as the region needs to be mapped outside a national context–despite the national nature of climate tracking–the hope of revealing imbalances of the drought indeed exist across borders, and impact water-sharing agreements, much as the smoke from recent northwest fires has traveled across the Pacific northwest. National territory is as meaningless an analytic category for global warming, or water scarcity, which, this blogpost argues, exists in a global contest of migration, as the migration or transborder transit of fires’ smoke.

4. The conditions of aridity that Powell described in the Colorado Basin and its neighbors offer an oddly productive image of the dryness of the ground, in an era before irrigation, that may be useful for how we can come to terms with the fear of a suspension of irrigation across western states. But it is as if the very definition of aridity was forgotten, as infrastructures of irrigation have re-mapped the region that John Wesley Powell in 1890 mapped as an area of difficult agrarian settlement, as farmlands of agrarian fertility and wealth. Powell proposed to view the “arid region” of the United States east of the Rockies with a clarity approaching scripture in a powerful eight-color map to instructively show how limited water constrained settlement of the region after surveying the Colorado Basin.

Powell probably imagined his map in somewhat revisionary as much as rebarbative, reorienting attention to the dry nature of the soil of the semi-arid region of the Colorado Basin by parsing it in areas by which the availability of water constrainted the settlement of the “open” government lands of the west, obscuring that they were seized from indigenous, to correct the mythic geography propounded by official state-sponsored geologists. Unlike Powell, most state geologists had boosterishly endorsed a site for future pasturage, to be enriched by unknown artesian springs, and ripe for settlement by homesteaders, and Powell’s map posed a more tempered image of resettlement that would obey the laws of the availability of water in the Colorado plateaux and other regions he knew so well, cautioning against the encouragement of settlement and sale to prospective farmers in ways that have improbably made the map something of an icon of conservationist thought. Against promise of prospective bucolic lands of pasture, the dry colors chasten viewers by communicating scarcity of water of drainage basins.

The arid region that Powell correctively propounded was long inscribed in the psycho-geography of the United States to be forgotten, but the arrival of irrigation infrastructure allowing irrigation of western states continues to inform, even in our own era of global warming, the return of the boosterist sloganwhere water flows, food grows,” that is still raised in Northern California’s San Joaquin Valley, to protest “cuts to farmwater” in the recent order of an “emergency curtailment” across rivers of the Sacramento-San Joaquin Delta watershed — essentially the entire Central Valley. The recourse to an engineering “miracle” of making water flow uphill and redistributing more water from reservoirs contest calls for conservation–and only demand the further construction of dams, reservoirs, and water storage for better irrigation. The very promises that the flow of the Colorado River would irrigate lands, that made good on the promises made to homesteaders by describing the region to settlers as a New Canaan, where the growth of future streamflow and even rainfall that had never been documented, would make it suitable for the expansion of animal pasturing and farming, suggests a mythic geography of timeless bounty has replaced its actual conditions.

Friant-Kern Canal Flowing past Kern Dam/Septmeber 2020, Eric Paul Zamora, Fresno Bee

The mythic geography led to a rewriting of America’s irrigation infrastructure that in itself may be one of those pieces of infrastructure just no longer adaptable to extreme climate change. And as we face the scale of the national emergency of water shortages about to be triggered by falling reservoir levels, the crisis of using and recycling water, and the inefficiency of desalination plants of riverwater and groundwater, on which the world currently relies–and were predicted by the US Bureau of Reclamation back in 2003 to provide a “sustainable” solution to the dwindling water provided by the Colorado River, which had allowed the unexpected expansion of the settlement of western states. While desalination plants currently generate worldwide over 3.5 billion gallons daily, with 50 million gallons produced daily in Carlsbad, CA alone, desalination plants in one hundred and twenty counties, only half using sea-water, its energy expense justified as Colorado River decreased, promoted as a “sustainable and drought-proof water supply in Southern California” in an era of climate change, as if to calm our concerns at the dramatically decreased groundwater of western states.

Reclamation scientists assured the nation in 2016 of future recharge in the Upper Colorado Basin would offset temperature increases in their modeling scenarios through 2099, projecting basin-wide precipitation, the fears of the persistence of a mega-drought of extreme aridity with little recharge that may last decades has left fifty-sevens million living in drought conditions across the west according to the U.S. Drought Monitor, that has brought a new era of mega-fires. The thin blue line of the Colorado River is but a crack or thread coursing through a combustible landscape in this recent map of the expansion of unprecedented extreme drought in western states from National Geographic:

For all the disturbing and disquieting elegant if terrifying spread of deep red isotherms in Riley D. Champine’s map, the consequences of such exceptionally below-average levels of precipitation and aridity are difficult to comprehend as cumulative and deep in our nation’s history, as well as the effect of man-made climate change.

The utter saturation of this data vis of growing dryness of a region where rain far below previous norms fell forces the viewer to process an undue range of measures of aridity that they must struggle to process-if the deep orange and reds approaching emergency warning to suggest that surely a climate emergency is at hand. The absence of text in the visualization invites viewers to acknowledge they stand an eery remove of familiarity with an irrevocably landscape, posing unspoken if also unanswered questions about hydrological infrastructure in the Colorado basin, and greater west, that all but erases the geopolitical formation of this landscape–interruption of a rich color ramp at the southwestern border compartmentalize the large-scale decline in precipitation apart from national categories; but the danger lies in its focus on the economically developed north, more than the global south, as if it lacked adequate resources to prudently respond to groundwater shortages, but as an emergency for the developed world.

The focus of the climate emergency is on a large scale, daunting the possibility of individual response, but focussing on prudence at a local level, even if its scale is not defined, questions whether state politics can even resolve the intensity of the dilemma of declining rainfall levels below a thirty-year norm, a deviation on so broad a scale to be impossible to process save in local terms, but that omits the way the basin has been engineered as a site where groundwater now all but fails to accumulate, increasing the basin’s deep aridity more than the color ramp reveals.

The trust that Powell placed in his maps stand in sharp contrast to the “purple” coloration of regions of extreme heat introduced across western states to suggest so many “red-flag” warnings of excessive heat. In a year already tied with 2017 for receiving “excessive heat” warnings from the National Weather Service, already in early summer at a rate that is increasingly alarming, purple designates the need for caution when leaving air-conditioned environments, and suggests the booming of electric cooling across the west: the metric of a prediction of temperatures reaching 105°F for a two-hour stretch has paralleled the debate in Washington on infrastructure spending that suggest a similar disconnect that Powell confronted when he tried to describe the need for constraints on planning settlement west of the hundredth meridian in 1890.

Four Excessive Heat Warnings issued from late May 2021 have introduced yet a new color to prominence in National Weather Service maps, the new deep purple was introduced in weather maps in 1997 as a venture of the NWS into health alerts; rarely used in other weather maps, which in recent years have shifted from urban areas to large stretches of the nation, shifting from a use of red to designate high temperatures to purple to designate risk of triple-digit temperatures, especially in man-made surfaces like asphalt (able to rise to 170°-180° Fahrenheit–territory of third-degree burns–or cars which can rise thirty degrees above air temperature.

Heat Advisories, July 11, 2021/National Weather Service

During the decade before 2003, the water-level of Lake Mead had begun to decline precipitously, inaugurating a historical decline that led it to fall to but 35% of its storage abilities. While the decline was not more precipitous than the two earlier declines in its water-levels in the reservoir from the mid-1950’s and mid-1960’s, the current decline in storage capacity of what is the largest reservoir of water in the United States has raised the unthinkable and unimaginable arrival of water cutbacks, as Arizona’s share of the Colorado River’s waters will be reduced by 7%, and Mexico–where the Colorado runs–will lose 5% of its share, in a scenario never foreseen in the dam’s history, but that reflects the increased aridity of the watershed from which the Colorado River draws. The decline to 1,075 feet in the reservoir’s depth that triggered the Tier 1 reductions in flow may only be a harbinger of the arrival of future Tier 2 reductions, should Lake Mead drop to 1,065 feet, as is expected in 2023, and raises the fear of a Tear 3 reduction, should the lake level fall below 1,025 feet, reducing the water allocated to western cities. In ways that the infrastructure of irrigating the Arid District of the United States could never have foreseen, the arrival of the driest period that the basin has ever experienced in 1200 years has brought longer periods of drier weather without rainfall that have reduced the riverwater that fills the reservoir.

The declining level of Lake Mead plunged below average lake elevation of 1173 feet, by 2003, in ways that should have sent alarms across the west, were we not consumed by a war against terror. The Bush administration’s attacks on global warming grew, questioning the science of global warming and the dangers of increasing aridity. But the disconnect between the expectation for irrigation by the farming industry and farming states was dismissed, with global warming and climate change, as temporary shifts that wouldn’t alter the landscape of irrigation or river flow.

Robert Simmon, based on data provided by the U.S. Bureau of Reclamation

Continue reading

Leave a comment

Filed under border studies, climate change, data visualization, global warming, mapping global warming

Freezing Time, Seaweed, and the Biologic Imaginary

We can all too easily lose sight of the centrality of seaweed plays in coastal habitat–even in Northern California, where seaweed washes up regularly in clumps and beds along the shore. Bull kelp and other marine plants on the sandy beaches of northern California seem otherworldly representatives of a removed marine world, but their proximity is revealed in remote mapping that promises to remap the role of seaweed in coastal ecosystems, and offer a picture of the terrifying prospects of ocean warming and climate change.

The relatively recent contraction of kelp forests across much of the offshore where they long provided such dense habitats may soon start to contract in ways never before experienced. The remapping of kelp forests, and the problems of their contraction of treasured habitat, reveal how much coastal waters demand to be seen not as so separate from the land, but part of a complex ecotone–a region where land and sea interact. Underwater species impact a large ecosystem that provides atmospheric oxygen, integral to coastal biodiversity that imparts a specific character to the California coast, and a sense of where we are–as well as makes it a destination for countless Pacific pelagic, shorebirds, and insects, as well as shellfish and fish. But the decimation of kelp forests, tied to an absence of predators to urchins, but more broadly to the ocean warming of coastal waters, as well as potentially an unprecedented increase in coastal pollution, makes both the mapping of the shrinking of kelp forests and the deciphering of that shrinking pressing problems of mapping, destined to impact a large variety of ocean and land-dwelling species.

The need for such mapping underscores all of our relation to the vital ecosystem of the shores and coastal ocean–even if we too often bracket it from our daily lives. While beached kelp may be present before our eyes, the problems of mapping of kelp forests with any fixity complicates how we process the disappearance of offshore kelp beds in an amazingly rapid timeframe. And the failure of creating an actual image capture registering the extent of kelp forests poses limits our awareness of their diminution off coastal waters. The observations of the shrinking of coastal spread of bull kelp is based on local aerial surveys, over a relatively small span of time, the accelerated roll-back of a once-vital region of biodiversity is both global, and demands to be placed in a long-term historical perspective of the way we have removed the underwater and undersea from our notion of coastal environments and of a biosphere.

Bull kelp forest coverage at four sites on the North Coast of California,from aerial surveys (California Dept. of Fish and Wildlife)

What was first registered in the plummeting of abalone, and the wasting disease of sea stars, afflicting stars from Baja to Alaska in 2013, suggest a condensation of a radical change in near-coastal environments of global proportions, paralleled by the arrival of warm waters that are not conducive to kelp growth, even before El Nino, and before the the arrival of purple urchins whose levels stars controlled, as if the result of cascading effects of a tipping point atmospheric change.

The quite sudden growth on the ocean floor of “sea urchin barrens,” where the near coastal waters are cleared of seaweeds and kelp, is a global problem. As global oceans absorb warmth of increased global warming, near-shore environments are particularly susceptible to species changes that create large disequilibria–from the bloom of phytoplankton to the rise of purple sea urchins and the dearth of shellfish–that stand to change coastal oceans. Yet the same creatures are often ones that fall of outside of our maps, even if the presence and scale of massive kelp beds and submerged forests are hard to map. And even if we see a shrinking of the large undersea submerged beds of kelp off coastal California, it is hard to have clear metrics of their shrinking over time or past extent–or of intervening in their reduction, which we seem forced to watch as inland spectators.

NASA Earth Observatory., image by Mke Taylor (NASA) using USGS data

Indeed, if the presence of coastal seaweed, and the distinctive kelp forest of California’s coastal ocean seems the distinguishing feature of its rich coastal ecology, the holdfasts of kelp forests that are grazed down by sea urchins and other predators are poorly mapped as solely underwater–they are part of the rich set of biological exchanges between the ecotone of where land meets sea, and ocean life is fed by sediment discharge and polluted by coastal communities, as much as they should be mapped as lying offshore, at a remove from the land. Yet the death of beds of kelp that is occurring globally underwater is cause for global alarm.

For from Norway to Japan to but the decline of natural predators of urchins in California has made a rapid rise of urchins on the seafloor along the coast have contributed to a shrinking of once-abundant kelp forests that produce so much of our global atmospheric oxygen. And these hidden underwater changes seem destined to rewrite our globe, as much as climate change, and threaten to change its habitability. Even as large clumps of seaweed are removed by powerful waves, that deposit piles of offshore forests ripped from holdfasts on beaches in northern California, the narrative of large coastal kelp deposits, their relation to climate change and coastal environment demands to be better mapped, as the transition of kelp to barrens afflicts so much of the coastal waters of the Atlantic and Pacific, at so many different latitudes and across such a variety of local cold water ecologies.

While the decline of kelp forests seems as radical as the clear-cutting of redwoods, it is both far more rapid and far more environmentally disruptive, if far less visible to the human eye.For in recent decades, increasingly warming waters and out of whack ecosystems have led to a massive decline of seaweed, decimated by a rise in the sea urchin population to by 10,000 percent off the California coast over only last five years, shrinking kelp forests that stand to catapult us to a future for which we have no map. The long-term decline in sea otters and sea stars, natural predators of the urchins, have removed constraints on urchin growth, which warming waters has encouraged, reducing a historical abundance of kelp in the near coastal waters across California.

This has perhaps been difficult to register due to the problems of mapping seaweed, and indeed registering kelp forests’ decline. The advance of sea urchin populations that have created barrens in coastal waters stands to disrupt and overturn some of the most abundant ecological niches in the global oceans. How has this happened under our eyes, so close tho shore and lying just undersea? We have few real maps of seaweed or kelp, lurking underwater, rather than above land, and leave out kelp from most of our maps, which largely privilege land. But the abundance of kelp that produce most of the global oxygen supply live in underwater ecotones–sensitive places between land and sea, in-between areas of shallow water, abundant sunlight, and blending of land and sea–an intersection, properly understood, between biomes, on which different biological communities depend.

Looking at the offshore seaweed near Santa Cruz, CA, I wondered if the predominantly passive registration of location–onshore registration of sites remotely by satellites, familiar from the harrowing images of the spread of fires, provided a basis to register our states of emergencies that was spectacularly unsuited to the contraction of coastal kelp, despite the huge advances of mapping techniques, and left us without a map to their contraction, or to register the subtle if radical consequences of kelp loss, and the almost as devastatingly rapid progress of their advance as populations of urchins have mowed down underseas kelp beds. For even as we strike alarms for the the decline of global kelp populations and seaweed forests as a result of the warming of offshore temperatures that place the near offshore regions at special risk of atmospheric warming–

Paul Horn, Inside Climate News/Source Wernberg and Staub,
Explaining Ocean Warming (IUCN Report, 2016)

–we lack maps of the place of seaweed and kelp beds in their ecotone, and indeed have no adequate maps of seaweed populations under threat.

Continue reading

Leave a comment

Filed under climate change, global warming, oceans, remote observation, seaweed

Saturated Shores in Southeastern Texas

There is almost no trace of the human, or of the extreme overurbanization of the Texas coast, in most of the maps that were created of the extreme flooding and intense winter rains that hit Galveston and Houston TX with the windfall of Hurricane Harvey.  While maps serve to orient humans to the world–and orient us to human processes and events in a “human world,” as J.B. Harley and David Woodward put it, the confused nature of relations between the human and natural world, is increasingly in danger of being mipmapped.  Data visualizations of extreme weather that erase the modification of coastal environments provide a particularly challenging means of orientation, as news maps are suspended between registering the shock of actual events–and trying to contain the natural emergencies that events of extreme weather create–and the demand for graphics that register natural calamities and the ethics of showing such calamities as “natural”–or even what the category of the natural is in coastal regions that so heavily modified to modify actual weather events.

The ethics of orienting viewers to the rainfall levels that fell in Houston after the landfall Hurricane Harvey Part of the huge difficulties lies in adequately orienting viewers in ways that register a changing natural world–how we are mapping rainfall, for example, or the approach of hurricanes, or are rather mapping the new relation of rain to built surfaces and landcover change that lack permeability for water, facilitating flooding by storms whose potency is changed by the greater atmospheric content of a warming Gulf of Mexico, which the ground cover of Houston, Galveston, and the Texas shore are less able to absorb and return to the Gulf. The area is, itself, something of an epicenter of the increased number of hemispheric tropical cyclones–which demand warm water temperatures above 80 80°F / 27°C and a cooling atmosphere and low wind shear–often led to the Gulf coast.

NASA Earth Observatory/Tropical Cyclones through 2006

–those that come ashore at Galveston hit a seashore that is eminently unprepared to accommodate an influx of water that the paved surface has rendered all but impermeable. If the problem of global cyclones that can become hurricanes is truly global–

NASA Earth Observatory/150 years of Tropical Cyclones

–the intersection between cyclones and areas of paved ground cover is problematic to the southwestern states, and most of all to Texas, Louisiana, and Florida, where water absorption has been anthropogenically reduced in recent decades. At the same time, few other areas of the inhabited world are so widely “tracked” as the destination of tropical cyclone formation..

NWS JetStream Online School)

The problem is partly evident in the choice of new color ramps that transcend the rainbow spectrum of measuring the intensity of rainfall in the recent arrival or ground fall of Hurricane Harvey, which condenses the great difficulty of using old cartographical categories and conventions in order to capture or communicate increasingly extreme weather conditions. in an era of climate change.  But the cartographic problem goes farther:  for it lies in the difficulty of registering the changes in relations f how rain dropped meets the ground, mapping relations between complex processes of warming and atmospheric warmth that lead to greater humidity across the gulf region to ground cover permeability that leaves regions increasingly exposed to flooding.

The relentless logic of data visualizations based on and deriving primarily from remote sensing are striking for rendering less of a human world than the threat of allegedly “natural” processes to that world.  Perhaps because of the recent season of extreme weather we have experienced, weather maps may be among the most widely consulted visualizations in our over-mediated world, if they were already widely viewed as the essential forms of orientation.  But the pointillist logic of weather maps may fail to orient us well to extreme events as the hurricane that dumped a huge amount of water on overbuilt areas to include the human–or the human world–seem a tacit denial of the role of humans in the complex phenemona of global warming that have, with the warming waters of the Gulf of Mexico and ever-increasing ozone over much of the overbuilt southeastern Texas shore, created a perfect storm for their arrival.

This failure to include this role haunts the limited content of the weather map; including the role of humans in maps of extreme weather events indeed remains among the most important challenges of weather maps and data visualization, with the human experience of the disasters we still call natural.  And although the subject is daunting, in the spirit of this blog, we will both look at the communicative dilemmas and difficulties of eye-catching color ramps and their deceptiveness, and poetic difficulties of orienting oneself to shores.  For as the disaster of Harvey is depressing, it compels raising questions of the orientation to the shifting shore, around the national epicenter of Galveston, where the landfall of Hurricane Harvey focussed our attention on August 27, 2017–

90-7
wpc-5day-0Z-8.28.17

–and the meaning of place in an saturated shoreline, where the sea is somehow part of the land, and the land-sea divide blurs with a specificity that seems as if it may well be increasingly true in an approaching era of climate change.  And as we depend on the ready generation of maps based on remote sensing whose relentless logic is based on points, we risk looking sight of the role of place in determining the relations of rainfall to shoreline in maps of coastal flooding that remove remote observations from the built environment that flooding so drastically changes, challenges and affects, in ways that may elide specificities of place.

At a time when we are having and will be destined to have increased problems in orienting ourselves to our shores through digital maps of rainfall, the unclear shorelines of Galveston sent me to the bearings that a poet of an earlier age took her bearings on the mapped shorelines of the place where she had been born, and how she was struck by a bathymetric map to gauge her personal relation to place, and saw place in how the changing shoreline of the northern Atlantic were mapped in the maritimes, in a retrograde form of print mapping in a time of war.  For the way the mapped shore became a means by which Elizabeth Bishop gained bearings on shores through a printed map of coastal bathymetry to access the spatiality of the shore–how “land lies in water” and the blurred relation of land and water that the bathymetric map charts–in an age when the materiality of the map was changing, with the introduction of aerial composite maps from the early 1930s, as the rise of aerial composite maps removed the hand of the mapmaker from the map in an early instance of remote sensing–

5852167

Cartography Associates/David Ramsey: Historical Map Collection: Composite of 164 Aerial Views of San Francisco by Harrison Ryker/Oakland, 1938, 1:2000

–in a medium of aerial photography that focussed on land to the exclusion of water, and that all but erased the relation between water and shore just a few years after Bishop quickly wrote her poem in Christmas 1935 about coastal “edges” of land and sea.  Ryker, who developed techniques of aerial photography used in the mapping of the shores of Puerto Rico for the Fairchild Aerial Camera Company, as well as photographs of the devastating Berkeley Fire of 1923, went into business in 1938–the year of his map–as a map publisher, with a patent for the stereoscope used to interpret aerial imagery,  and must have performed the massively detailed mapping of San Francisco in one hundred and sixty for images taken from airplanes from 1937-38 as a sort of calling card, soon after Bishop wrote her poem, before manufacturing a range of stereoscopes of pocket and desktop versions for military ends that were widely used in World War II by the US Army.

Before war broke out, but in ways that anticipated the coming war, the printed bathymetric map must have resonated as a new reflection on the impersonality of the aerial view; Bishop was suddenly struck when she encountered the materiality of a print map on Christmas 1938 as the art of cartography was already changing, responding to the drawn map under glass of the Atlantic as a way to recuperate the personal impact of place.  Her poem powerfully examined the logic of drawn maps utterly absent from the digitized space of rainfall maps of a flood plain, deriving from data at the cost of human inhabitation of place–and in envisioning data to come to terms with the catastrophic event of flooding distancing or removing the craft of mapmaking from the observer in dangerously deceptive ways.  And so after wrestling with the problems of cartographic representation using remote sensing, while recognizing the value of these readily produced maps of rainfall and the disasters they create,

1.  For weather maps are also among the most misleading points to orient oneself to global warming and climate change, as they privilege the individual moment, removed from a broader context of long-term change or the human alteration of landscape.  They provide endless fascination by synthesizing an encapsulated view of weather conditions, but also  suggest a confounding form of media to orient audiences to long-term change or to the cascading relations of the complex phenomenon of climate change and our relation to the environment, as they privilege a moment in isolation from any broader context, and a sense of nature removed from either landscape modification or human intervention in the environment, in an area were atmospheric warming has shifted sea-surface temperatures.  The effects on the coast is presented in data visualizations that trace the hurricane’s “impact” as if its arrival were quite isolated from external events, and from the effects of human habitations on the coast.  The image of extreme flooding is recorded as a layer atop a map, removing the catastrophic effects of the flooding from the overpaved land of the megacities of southeastern Texas, and the rapid paving over of local landcover of its shores.

90-7

.

Such visualizations preserve a clear line between land and sea, but treat the arrival of the rains on land as isolated from the Consuming such events of global warming in color-spectrum maps.  The data of rainfall translate data into somewhat goofy designs represents a deep alienation from the environment, distancing viewers in dangerous ways from the very complexity of global warming that Gulf coast states encountered.

Such data visualizations seem dangerously removed notion of how we have changed our own environment, by describing a notion of “nature” that is immediately legible, as if it were removed from any human trace or of the impact of modification of the land, and by imaging events in isolation from one another–often showing a background in terrain view as if it has no relation to the events that the map describes.  Although weather maps and AccuWeather forecasts are sources of continual fascination, and indeed orientation, they are are also among the most confounding media to orient viewers to the world’s rapidly changing climate–and perhaps among the most compromised.  For they imply a remove of the viewer from space-and from the man-made nature of the environment or the effects of human activity form the weather systems whose changes we increasingly register.  By reifying weather data as a record of an actuality removed from human presence at one place in time, they present a status quo which it is necessary to try to peel off layers, and excavate a deeper dynamic, and indeed excavate the effects of human presence in the landscape or geography that is shown in the map.  We are drawn to tracking and interpret visualizations of data from satellite feeds in such weather maps–or by what is known as “remote sensing,” placed at an increased remove from the human habitation of a region, and indeed in a dangerously disembodied manner.

Visualizations resulting from remote observation demand taken as a starting point to be related to from the human remaking of a region’s landscape that has often increasingly left many sites increasingly vulnerable to climate change.  But the abstract rendering of their data in isolation from a global picture–or on the ground knowledge of place–may render them quite critically incomplete.  The remove of such maps may even suggest a deep sense of alienation form the environment, so removed is the content of the data visualization form human presence, and perhaps from any sense of the ability to change weather-related events, or perceive the devastating nature of their effects on human inhabitants:   their stories are about weather, removed form human lives, as they create realities that gain their own identity in images, separate from a man-made world, at a time when weather increasingly intersects with and is changed by human presence.  While throwing into relief the areas hit by flooding near to the southeastern Texas shore at multiple scales based on highly accurate geospatial data, much of which is able to be put to useful humanitarian uses–

Harvey flooding_1.jpg

Dartmouth Flood Observatory/University of Colorado at Boulder, August 29. 2017

1504094467hurricane-harvey-flood-map.gif

Maps of the World

–the reduction of floods to data points creates a distorted image of space renders their occurrence distant from the perspective of folks on the ground, and places their content at a considerable remove from the complex causality of a warming Gulf of Mexico, or the problems of flood drainage by which Galveston and Houston were beset.  Indeed, the multiple images of that report rainfall as an overlay in a rainbow spectrum, at a remove from the reasons for Houston’s vulnerability to flooding and the limits the region faces of flood control, in broadcast Accuweather images of total rainfall in inches advance a metric that conceals the cognitive remove from the dangers of flooding, ora human relation to the landscape that the hurricane so catastrophically affected.  Can we peel under the layers of the data visualization, and create better images that appreciate the human level on which the landscape stands to be devastated by hurricane rains, as much as tracking the intensity of the growth of rainfall over time?

90-5.jpeg

AccuWeather, Rainfall levels by Thursday

90

AccuWeather, Friday to Monday

Such layers of green, meant to suggest the intensity of rainfall that fell over land, reveal the concentration of water in areas closes to the Gulf of Mexico.  Even the most precise geographical records of the dangers of flooding in the floodplain of southeastern Texas with little reference to the historical modification of the region by inhabitants–

Harvey flooding_1

Dartmouth Flood Observatory at University of Colorado, Boulder/August 29, 2017

–and conceal the extent to which the landscape’s limited ground cover permeability has left the region far more susceptible to flooding, and elevated the risks of the emergency.  The problem of reading any signs of human presence into these “images” of precipitation provoke problems of disentangling remote sensing data from knowledge of the region’s recent urban growth and the consequent shift in local landcover.

The perspective of our relation to these events is often as fleeting and as existential as they flood us with data, which we viewers have little perspective or tools to process fully.  The onrush of recent remote sensing maps batter us with an array of data, so much as to lead many to throw up their hands at their coherence.  Even as we are  still trying to calculate the intensity of damages in Puerto Rico–where electricity is so slowly returning that even even after four months, almost a third of its 1.5 million electricity customers still lack power–and the cost of fires in southern California.  We look at maps, hoping to piece together evidence of extensive collateral damage of global warming.  Yet we’ve still to come to terms with the intensity of rainstorms that hit southeastern Texas–deluging the coast with rainfall surpassing the standard meteorological chromatic scale that so misleadingly seems to offer a transparent record of the catastrophe, but omits and masks the experiences of people on the ground, digesting swaths of remotely sensed data that take the place of their perception and experience, and offering little critical perspective on the hurricane’s origin.

The rapidity with which rain challenged ground cover permeability provides both a challenge for mapping as a symptom of global warming and landscape modification:   the mapping of “natural” levels of rainfall blurs the pressing problem of how shifting landcover has created an impermeability to heightened rains, and indeed how the new patterns of habitation challenge the ability of the coast of the Gulf of Mexico to absorb the prospect of increased rain in the face of decreasing groundcover permeability, and the extreme modification of the coastline that increasingly impeded run-off to the Gulf.

2.  Across much of southeastern Texas, a region whose growth was fed by the hopes of employment in extractive industries, real estate demand and over-paving have unfortunately intersected with extreme weather in southeastern Texas in ways which dat visualizations have had trouble exposing, but which raise a curtain on the coming crises of a failure of ability to accommodate increased levels of rainfall  If the lack of precedent for the intense rainfall in Galveston Bay generated debate about introducing a new color that went beyond the rainbow scale employed in weather charts, what seemed a problem of the cartographic color-spectrum suggested a problem of governability and indeed government response to extreme weather conditions.  How to register the dangers of rainfall that goes of the scale or standards of measurement?

One must consider how to orient viewers to the intensity of consequent flooding, and to its consequences and better prepare ourselves for the arrival of deluging rains without falling back on the over-freighted metaphor of rains of biblical scope.  How many more hurricanes of increasing intensity can continue to pound the shores, by whipping precipitation from increasingly warming waters and humid air?  The cumulative pounding of tropical cyclones in the Gulf stands to create a significantly larger proportion of lands lying underwater–temporarily submerged lands–with radically reduced possibilities of drainage, as hurricanes carry increased amounts of evaporated water from the humid air of the warming gulf across its increasingly overbuilt shores. in ways that have changed how the many tropical cyclones that have crossed the land-sea threshold since NOAA began tracking their transit (in 1851) poses a new threat to the southeastern coast of Texas, and will force us to map the shifting relation between land and water not only in terms of the arrival of hurricanes, or cyclonic storms–

–but the ability of an increasingly overbuilt landscape to lie underwater as the quantity of the Gulf coast rainfall stands to grow, overwhelming the overbuilt nature of the coast.

Most maps that chart the arrival and impact of hurricanes seem a form of climate denial, as much as they account for climate change, locating the hurricanes as aggressive forces outside the climate, against a said backdrop of blue seas, as if they  are the disconnect.  Months after the hurricane season ended, the damage for hurricanes caused have hardly been assessed in what has been one of the most costly and greatest storm damage since 1980 in the United States,–including the year of Hurricane Katrina–we have only begun to sense the damage of extreme weather stands to bring to the national infrastructure.  The comparison to the costs of storm damage in previous years were not even close.

But distracted by the immediacy of data visualizations, and impressed by the urgency of the immediate, we risk being increasingly unable to synthesize the broader patterns of increased sea surface temperatures and hurricane generations, or the relations between extremely destructive weather events, overwhelmed by the excessive destruction of each, and distracted from raising questions about the extremely poor preparation of most overbuilt regions for their arrival, and indeed the extent to which regional over-building that did not take the possibility of extreme weather into account–paving large areas without adequate drainage structures or any areas of arable land–left inhabitants more vulnerable to intense rains.  For in expanding the image of the city without bounds, elasticity, or margins for sea-level rise, the increasingly brittle cityscapes of Galveston and much of the southeastern Texas shoreline were left incredibly unprepared for the arrival of hurricanes or intense rains.  Despite the buzz of an increased density of hurricanes to have hit the region,

1851_2013_mjrhurr2

the questions of how to absorb hurricanes of the future, and to absorb the increased probability of rainfall from hurricanes in the Gulf of Mexico and its shores, suggests questions of risk, danger, and preparation that we have no ability to map.  What, indeed, occurs, as hurricanes themselves destroy the very means of transmitting on the ground information and sensing weather, and we rely exclusively on remote sensing?

Destroyed satellite dishes after Hurricane Maria hit Humacao, Puerto Rico  REUTERS/Alvin Baez

To characterize or bracket these phenomena as “natural” is, of course, to overlook complex interaction between extreme weather patterns and our increasingly overbuilt environments that have both transformed the nature of the Southeastern Texas coast and have made the region both an area of huge economic growth over time, and have paved over much of the floodplain–as well as elevated the potential risks that are associated with coastal flooding in the Gulf Coast.  To be sure, any discussion of the Gulf of Mexico must begin from the increasingly unclear nature of much of our infrastructure across land and sea, evident in the range of pipelines of gas and oil that snake along a once more clearly defined shore charted by ProPublica in 2012, revealed the scope of the manmade environment that has both changed the relation of the coastal communities to the Gulf of Mexico, and has been such a huge spur to ground cover change.

The expansive armature of lines that snake from the region across the nation–

pipeline_line_map

ProPublica, Pipeline Safety Tracker/Hazardous liquid pipelines are noted in red; gas in blue

-and whose tangle of oil pipelines that extend from the very site of Galveston to the Louisiana coast is almost unable to be defined as “offshore” save as a fiction, so highly constructed is much of the national waters in submerged lands in the Gulf of Mexico–

gulfofmexicopipelines

ProPublica, Pipeline Safety Tracker/Hazardous liquid pipelines are noted in red

They indeed seem something of an extension of the land, and a redefinition of the shore, and reveal a huge investment of the offshore extractive industries that stand to change much of the risk that hurricanes pose to the region, as well as the complex relation of our energy industries to the warming seas.  Yet weather maps, ostensibly made for the public good, rarely reveal the overbuilt nature of these submerged lands or of the Gulf’s waters.

Despite the dangers that such an extensive network of hazardous liquid lines along the Gulf of Mexico, the confusion between mapping a defined line between land and water, and visualizing relations of extreme weather disturbances as hurricanes in the Gulf of Mexico and local infrastructure haunts the extremely thin nature of the sort of data visualizations that are generated about the dangers of hurricanes and their landfall in the region.  For all too often, they presume a stable land/sea divide, removed from the experience of inhabitants of the region and how we have remade the shore.

3.  How can we better integrate both a human perspective on weather changes, and the role of human-caused conditions in maps of extreme weather?  How can we do better by going beneath the data visualizations of record-breaking rainfall, to map the human impact of such storms?  How could we do better to chart the infrastructural stresses and the extent to which we are ill-prepared for such extreme weather systems whose impact multiplies because of the increased impermeability of the land, unable to absorb excessive rainfall, and beds of lakes and reservoirs that cannot accommodate increased accumulation of rainfall that  stand to become the new normal?  The current spate of news maps that provoke panic by visualizing the extremes of individual cases may only inspire a sort of data vis-induced ADD, distracting from infrastructural inadequacies to the effects of global warming–and leaving us at a loss to guarantee the best structures of governability and environmental readiness.

Indeed, the absence of accurately mapping the impact and relation between landcover, storm intensity, rainfall, flooding, and drainage abilities increases the dangers of lack of good governance.  There need not be any need for a reminder of how quickly inadequate mapping of coastal disasters turns into an emblem of bad governance.  There is the danger that, overwhelmed by the existential relation to each storm, we fail to put them together with one another; compelled to follow patterns of extreme weather, we risk being distracted from not only the costs but the human-generated nature of such shifts in seasons between extremes of hot and cold.  For as we focus on each event, we fail to integrate a more persuasive image of how rising temperatures stand to create an ever-shifting relation between water and land.

Provoked by the rhetoric of emergency, we may need to learn to distance ourselves better from the aerial views that synthesize intense precipitation, tally hurricane impacts, or snowfall levels, and view them less as individual “strikes” or events and better orient ourselves to a broader picture which put us in a less existential relation to extreme weather.

2017-four-us-hur-landfalls_3

The Weather Channel

We surely need to establish distance to process syntheses of data in staggering aerial views on cloud swirl, intense precipitation, and snowfall, and work to peel back their striking colors and bright shades of rainbow spectra, to force ourselves to focus not only on their human costs, or their costs of human life, but their relation to a warming planet, and the role of extreme of weather in a rapidly changing global climate, as much as track the “direct strikes” of hurricanes of individual names, as if they were marauders of our shores:  their creation is as much tied to the changing nature of our shores and warming sea-surface temperatures, and in trying to create a striking visualization, we deprive ourselves from detecting broader patterns offering better purchase on weather changes.

direct-strikes

The Weather Channel

If patterns of weather maps epitomized by Accuweather forecast and projections suggest an exhilaratingly Apollonian view on global and regional weather patterns, they also  shift attention form a broader human perspective in quite deeply pernicious ways.  Such maps provided the only format for grasping the impact of what happened as the hurricane made landfall, but provided little sense of the scale of inundations that shifted, blurred and threatened the coast of the Gulf of Mexico.  They provide a format for viewing floods that are disjoined from victims, and seem to naturalize the quite unnatural occurrence of extreme weather systems.  Given the huge interest in grasping the transformation of Hurricane Harvey from a tropical storm to a Category Four hurricane, and the huge impact a spate of Category Four hurricanes have created in the Gulf of Mexico, it’s no surprise that the adequacy of the maps of Hurricane Harvey have been interrogated as hieroglyphs or runes of a huge weather change:  we sift through them for a human story which often left opaque behind bright neon overlays, whose intensity offer only an inkling of a personal perspective of the space or scale of their destruction on the ground:  while data maps provide a snapshot of the intensity of rain-levels or wind strength at specific sites, it is difficult if important to remember that their concentration on sites provide a limited picture of causation or complexity.

All too often, such maps fail to offer an adequately coherent image of disasters and their consequences, and indeed to parse the human contributions to their occurrence.  This post might be defined into multiple subsections.  The first actions suggest the problems of mapping hurricanes in the Gulf of Mexico in relation to flooding in data visualizations of the weather and the overbuilt region; the middle of the post turns to an earlier poetic model for considering the relation between land and sea that visualizations all too easily obscure, and the meaning that the poet Elizabeth Bishop found in viewing relations between land and sea in a printed map of the Atlantic; after returning to the question of the overbuilt shore compounds problems of visualizing the Texas coast, the final section, perhaps its most provocative, returns to Bishop’s reading of a map of the Atlantic coast.

What such new weather maps would look like is a huge concern.  Indeed, as we depend on weather maps to orient us to place ourselves in the inter-relations of climate change, sea-level, surface temperatures, and rain, whether maps cease to orient us to place, but when best constructed help to describe the changing texture of weather patterns in ways that can help familiarize us not only to weather conditions, but needed responses to climate change.  For  three months after the hurricanes of the Gulf of Mexico caused such destruction and panic on the ground, it is striking not only that few funds have arrived to cover costs of rebuilding or insurance claims, but the judgement or understanding of the chances for future flooding have almost left our radar–perhaps pushed rightly aside by the firestorms of northern and southern California, but in ways that troublingly seem to forget to assess or fail to assess the extent of floods and groundwater impermeability  along the Texas and Louisiana coast.  The problems that preparation for future coastal hurricanes off the Gulf of Mexico raise problems of hurricane control and disaster response that seem linked to problems of mapping their arrival–amd framing the response to the increasing rains that are dumped along the entire Gulf Coast.

Indeed, the chromatic foregrounding of place in such rainbow color ramps based on GPS obscure other maps.   Satellite data of rainfall are removed from local conditions, and serve to help erase complex relations between land and water or the experience of flooding on the ground–by suggesting a clear border between land and sea, and indeed mapping the Gulf of Mexico as a surface as if it were unrelated to the increased flooding around Houston, in maps prepared from satellite imagery, despite the uneasy echoes of anthropogenic causes for the arrival of ten hurricanes in ten weeks, in ways that suggest how warming waters contributed to the extreme inundation of the Gulf Coast.  Despite NOAA  predictions of a 45% likelihood of ‘above-normal’ activity for the 2017 Atlantic hurricane season, with, a 70% likelihood of storms that could transform into hurricanes, the images of inundated lands seem both apocalyptic and carefully removed from the anthropogenic changes either to the ocean or land that intensified their occurrence so dramatically on the ground.

Dartmouth Flood Observatory Flooding Harvey

 Dartmouth Flood Observatory

Harvey flooding_0.jpg

Dartmouth Flood Observatory/August 29, 2017

Is it possible to recuperate the loss of individual experience in such data maps, or at least acknowledge their limitations as records of the complexity of a changing climate and the consequences of more frequent storm surges and such inundations of rainfall?  As we seek better to understand the disaster relief efforts through real-time maps of effects of Hurricane Harvey as it moved inland from the Gulf of Mexico, shifting from Category 4 Hurricane from a tropical storm, we tried to grasp levels of rainfall that spun out of 115-mile-an-hour winds across southeastern Texas that damaged crops, flooded fields, ruined houses, and submerged cars, we scan stories in hope of clues to assess our position in relation to increasingly dangerous weather systems whose occurrence they may well forebode.  At a time of increased attention to extreme weather has long developed, the gross negligence of climate change denial is increasingly evident:  it recalls the earlier denial of any relation between hurricanes and climate change, when increased hurricanes were cast as “the cycle of nature,” rather than as consequences whose effects have in fact been broadly intensified by human activity.

Current attempts to map the toll of record-smashing hurricanes focused almost exclusively on point-based data view rainstorms largely as land-based records; even as they intend to monitor the effects of Harvey’s landfall by microwave censors, they risk seeming to isolate real-time rainfall levels from the mechanics warmer air and sea-surface temperatures which result from human-caused global warming, not relating increased storm surges or inundations to achanges in coastal environments or climate change.  To render such changes as natural–or only land-based–is irresponsible in an age of reckless levels of climate denial.  Indeed, faced by the proliferation of data visualizations, part of the journalistic difficulty or quandary is to integrate humanistic or individual perspectives on the arrival of storms, rendered in stark colors in the increasingly curtailed ecosystems of newsrooms which seek simplified visualizations of satellite data on the disaster, which fail to note the human contributions to the travails that are often reserved for photographs, which increasingly afford opportunities of disaster tourism in the news, emphasizing the spectator’s position before disasters, by images that underscore the difficulties in processing or interpreting the proliferation of data from MODIS satellite feeds:  we can show the ability to measure the arrival of torrential rains, but in offering few legends, save the date and scale, but offering few keys o interpret the scale of the disaster.

The looming portent of human-made climate change, however, underlies the poor predictions that NOAA offered of perhaps 2-4 major hurricanes this Spring, and the lack of a new director for NOAA–on which local and state agencies depend to monitor the nations shores and fisheries–suggested the, from June to September, which left states on their own to make decisions and plan for disaster mitigation programs and better flood maps.  (The danger of appointing a newly nominated director, Barry Myers, who is a strong supporter of the privitization of weather maps and an executive at the private Accuweather mapping service, suggests the difficulty of determining the public-private divide in an era of neoliberalism, and a free market of weather maps that were once seen as central to national security and standards of safety.)   There are two hidden scales on which we read these opaque maps of global warming and globalization and local inundation are triply frustrating.   For all the precision and data richness of such point-maps of largely land-based rainfall, local temperature, or flooding, the biases of such instantaneous measurements seem to fit our current governing atmosphere of climate change denial, and dangerous in erasing how such storms are informed by long-term consequences of man-made climate change.  (As the mapping tools of coastal weather seem destined to change, what sort of change in direction for NOAA coastal maps do we want:  the appointment suggests the terrifying possibility of a return to the Bush-era proposal nominee Myers supported that prohibiting the agency from producing any maps already available in the private sector then threatened federal weather lines to go dark–lest they literally compete with ad-supported websites private providers–and shift federal information offline?)

For making moves toward the future readability of weather maps may well be at stake in critically important ways.  The 2005 proposal that Myers backed would have eliminated the National Weather Service, even while exempting those forecasts needed to preserve “life and property,” would in essence have returned the weather services to a pre-internet era, even as the most active hurricane season including a record breaking fifteen hurricanes and twenty-eight storms began in the gulf coast, including the infamous hurricane Katrina.  The proposed bill would have prevented NOAA from posting open data, and not only readily available to researchers and policymakers, in ad-free formats, free of popup screens, but allow them to make their own maps on the fly–ending good practices of posting climate data would work quite dangersously to prevent development of tools of data visualization outside commercial models of rendering storms and hurricanes as if environmentally isolated.

2005-tracks-update.jpg
direct-strikes

A deeper problem of providing such limited weather maps of tropical storms may be the subtexts about the relation of human causes to weather they convey, and the absence of a greater narrative of the transformation of a global ecology or of the ecology of the Gulf Coast.  The curtailed images of “nature” they present by symbolizing rains, winds, floods, or submerged regions in appealing hues as natural–raise questions of the odd simplicity of the absent storylines:  cheery colors erase or bracket complex questions of climate change, the human contribution to extreme weather events, or the human experience of suffering on the ground:  Rita, Cindy, Katrina, Dennis, and Wilma seem not part of the environment, epiphenomenal interlopers moving across a static deep blue sea, in an apparent dumbing down of the mechanics of hurricane or storm formation in a rainbow spectrum removed from a human-made environment.

Continue reading
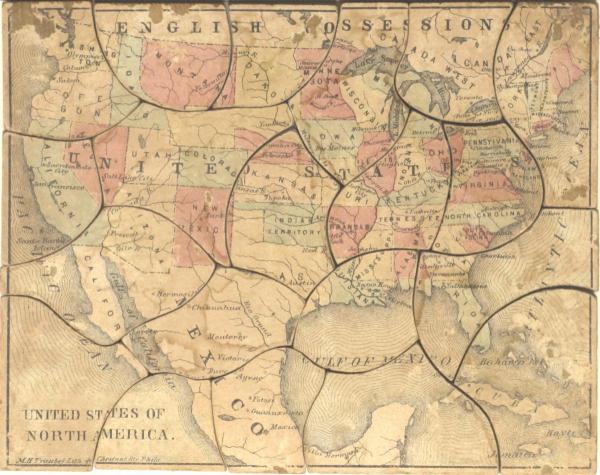
Leave a comment

Filed under anthropogenic change, climate change, coastlines, ecological disasters, gulf coast

Melting Boundaries and Frozen Pasts: Anthrax, Globalism, and Climate Change

The first six months of 2016 brought the greatest increase in global warming in recent years, and a rise in temperature that far surpassed all previous records–and occasioned a rapid melting of polar ice challenging to map as well as to imagine in all its cascading consequences.  The 378th consecutive month of land and water temperatures far above twentieth-century averages, as per the World Meteorological Organization, became an occasion to wonder how “many more surprises are ahead of us”for the director of the  World Climate Research Program, and brought the arrival of strikingly new consequences of climate change with the unearthing of unmarked graves, as the once-fixed boundary to what had constituted the northern boundary of continents has begun to retreat.

A set of such surprises have already arrived.  The increased melting of what were once thought permanently frozen regions of arctic permafrost first awoke dormant but contagious anthrax.  While this latest development provided a note of panic, it seems only emblematic of the eventual cascading of after-effects that the melting of the arctic stands to bring, and of the difficulty to place them in any coherent narrative.  Yet while we use maps to organize a range of data on climate change, it’s also true that the emergence of anthrax in the Siberian tundra provides a poignant illustration of the “surprises” that climate change will bring.  And while the world has not known smallpox cases since 1977, the contraction of the permafrost stands to reveal extinct smallpox, and indeed prehistoric viruses of up to 30,000 years old, as cattle graves are newly exhumed from permafrost.  The last smallpox epidemic in Siberia dates only from the 1890s, but the buried bodies by the Kolyma river have appeared as if by unexpected time-travel with Smallpox DNA, raising the possibility of with the unearthing of riverbanks, and  sites of burial of both infected animals and diseased bodies as the ground thaws.  Areas infected with anthrax spores release by preternatural global warming are being cordoned off, but the revived viruses and spores may travel widely in water in ways difficult if not impossible to map.

As we seem to be opening up much of the north pole and an Arctic Ocean for multiple new shipping routes, in ways that have led to projections of expanding trade-routes with names that reference imagined passageways like the Northwest Passage, the imagined increased shrinkages and thinning of layers polar ice due to global melting are understood as opening up new routes to nautical shipping as ice retreats from much of the arctic regions–but which, if they were only understood in the abstract in 2013, are now becoming increasingly concrete in the range of consequences that can cascade from them.

Arctic ROutes.pngBloglobal (2013)

The arrival of a period of pronounced decline in arctic sea ice has produced a newly palpable intimations of the vanishing of what were once expanses of ice.

Figure41.png
Continue reading

3 Comments

Filed under arctic melting, Climate Change, climate change, global warming, mapping global warming, Polar Ice Sheet

Droughtshaming!

Will the hashtag #droughtshaming change the public water consumption levels in California?  or is it only a manifestation of an all too long-submerged consciousness of evident property differences across most of Southern California–a space where ever-conspicuous consumption has long been made manifest in keeping yard lawns perpetually green?   and what of the Wet Prince of Bel Air, who has used an incredible 11.8 million gallons yearly during the drought to maintain the green yards on their southern California estate?

Almost as powerful a portmanteau as “Mansplaining,” the compound currently trending on Twitter presents both a righteous form of indignation, improvising map via social media that suggests our changing sense of our environment may open new arenas of public speech. The creation of a set of zoomable interactive maps from the New York Times of projected water-cuts and current water-usage across the state’s water districts have been recently mapped an uneven balance between water districts statewide, in ways that not only call clear attention to sharp discrepancies of water-usage across the state, not only between how urban and agricultural regions might be affected by mandated reductions in public water usage–


central valley water cuts


but what might be called the selective yard-drenching in specific regions of the south-lands, according to the same interactive data visualization–


drenching years in 2014-15 in LA


and the notable persistent over-use of water in wealthier areas of LA’s per diem consumption of water this past winter–


LA Consumption habits per diem Winter 2015


The map above offers an approximate reflection of a topography of disposable income, described b UCLA’s California Center for Sustainable Communities.  The Center quite recently found not only that “wealthy used more than three times the rate of non-wealthy people,” but wealth was the most conspicuous correlation and predictor of water use–and watering lawns, as we have long known, an increasing sign of conspicuous consumption even in an age of drought.

Is this a decision to spend more on water, or is it, as seems more likely, the conspicuous expenditure of water on yards, perhaps fueled by the cost of letting all that greenspace go dry, or the actual dangers of fire hazards that letting lawns go dry might create?  The oft-cited datum that Beverly Hills residents daily “used” some 286 gallons of water during September 2014, at the same time northern and coastal San Diego County consumed some 584 gallons in the Santa Fe Irrigation District, contrast sharply to Compton residents served by the LA Department of Water and Power who restricted themselves to 93 gallons a day and Angelinos in East LA some 48 gallons.

But it bears repeating at a time when Governor Brown wants to mandate across the board 20% reductions in water use as a means of increasing efficiency, if only to ask what some of the best manners of mandating reductions are.  By dividing water-usage by census tract, clear patterns in LA County emerge, that make it something of an epicenter, to mix geographic metaphors, with the recent rash of tweets about excessively selfish individual water use at Beverly Hills mansions that include, in some cases, spas and vineyards as well as expansive still-green lawns:


Water:Income LA


But rather than only call attention to the sociological correlation between water-waste and wealth, this post wants to ask questions about the ethics of the spontaneous sorts of mapping of water-waste that have proliferated in Angelino social media, as if to sharpen critiques of the lack of social responsibility of the wealthy in a city of sharp social divides, in ways that remote sensing is promising new results in a far more detailed manner for select Los Angeles neighborhoods in order to drill more deeply into the extent of watering of lawns, flowers, and trees that underlies such datasets.  But human-scale photographs posted on social media via Twitter has been an initial means to assemble immediately available instances of water over-use.

The spontaneous mapping of such inequalities on social-media is a sort of crowd-sourced shaming to redress unspoken social inequities, with offending addresses lain out on twitterfeeds for the public to see, lest anyone be confused about who has the public interest at heart, and who is most concerned with keeping the brown grass at bay, even without looking at the bigger picture, in something approximating collective rage against the overwatered large yard as an exercise of collective shaming, which has gained a real edge given that the state is poised to levy hefty fines on identified water wasters since mid-2014.  It’s triggered a geographical awareness of the steep inequities of water use and comes close to socially sanctioned class-consciousness–


droughtshaming


–and its effects on the lived landscape ofBeverly Hills lawns:


Streisanf

Such selective outing of levels of outrageously cartoonish disproportionate use of water utilities may run the ethical risk of crowd-sourced surveillance, where aerial photography approaches NSA-style snooping via overhead drones–the regional sustainability manager for Sacramento’s Utilities Department was said to be “pleasantly surprised” at such snitching last summer, when #drougthshaming took off on the Twittersphere.  But the current spate of tweeted outrage expressed on social media has also become a venue for expressing suppressed sentiments of a class struggle, very slightly veiling disgust at profligate over-watering lawns indulged by those running automatic sprinklers as if they were draining regional aquifers single-handedly, with little heed for state-wide water shortages, brought to the front in signs posted in public parks that remind users that “Brown is the New Green.”


Brown New GreenAaron Mendelson/KQED


Tweets are most famous for unleashing wrath against the privileged who are out of touch with the reality of water-needs–


green lawns

OhMo

Kim

–at the fact that rhythms of daily consumption patterns are so drastically different across a single city by degrees of multipliers.  And is it even a surprise that the mansions of three and a half acres we’ve become used to viewing and vicariously living on Reality TV have been most notoriously cautioned by local Municipal Water Districts to cut the their water use drastically?  (Both Barbara Streisand and Kim Kardashian have publicly agreed to curtail their water use–“Kim takes this drought seriously;” said a representative; “she has no problem letting her grass go brown.”)

The targeted social criticism is by no means limited to the super-wealthy:

Sprinklers Running since <7AM

The steep social discrepancies in water-use have thrown into relief the divided economic structures of the city that we’ve long known about from the American Community Survey–Orange County and Palos Verde residents use respectively thee and two times the state-wide per capita daily consumption rates in February 2015–but now suggest that water wastage among the wealthy is actually undermining the public good in a clearly mappable manner.  We have long seen larger yards in specific neighborhoods, but watering practices seem to have grown out-of-hand in expropriating the public resource with obliviousness, even while we blame “nature” for a drought that is increasingly evident is indeed largely man-made, and even may as due to human nature as climate change.

LA in detail


During the summer, such deep discrepancies of daily water consumption are of course placed into even further relief in  data visualizations of local levels of consumption, reflecting an apparent rationalization of increased water usage as well as the readiness of covering rising water costs, as lower income families responded more rationally to higher water costs.


LA summer of 2014


To be sure, Northern California has done fairly well to reduce consumption from the Spring 2013–


usage change nocal


But it is also true that the aerial photographs of the ambient effects of income inequality that sent Google Earth images viral after being posted on persquaremile reveal the grey v. green dichotomy to be by no means limited to the southland–


oak:piedmont


Such a democratic appropriation of Google Earth may have paved the way for the tweeting of extravagant consumption of water that has become all too evident in some of the larger Beverly Hill yards, that can be linked to specific addresses.

The calls for greater restraint in water usage since March 2013 is far from clear in much of the greater Los Angeles area, as posters on social media have not only realized, but realized that they were able to publicly point out.


SoCal 2013-15

Both a more equitable distribution of water access and a rethinking of such deeply-lying assumptions of personal prerogative to wasting water deserve attention as Californians try to curb continued water use in a responsible manner.  We will have to tilt swords with some of the deeper espousers of a free market of deregulated water consumption, but at this point, for better or worse, deregulation has its back snugly against the wall.

And despite the reluctance of water utilities to identify wasters of boggling amounts of public water–as the Los Angeles homeowner known only as Wet Prince of Bel Air, a name won for pumping an incredible annual 11.8 million gallons during the recent drought to his estate.  The recent news that 100 residents of such wealthy Los Angeles neighborhoods as Westside have been pumping millions of gallons of water apiece has called for more effective means of recourse than twitter revenge, as such outing bears little fruit; in the light of recently passed laws against over-use of water, remote sensing technologies have been used by journalists at Reveal who are eager to even up the score:  taking advantage of   new fines assessed against excessive water use, the mapping through Digital Globe and others provides a deeper survey of water use than would be released by Los Angeles’ compliant Department of Water & Power.  Indeed, the Center for Investigate Reporting has begun to “out” high water-users by remote sensing–and publishing the maps!

Given the limits of Twitter photographs to document public instances of water overuse, the expansive indulgence of overwatering in such somewhat reclusive sites as Bel Air, perhaps inspired by droughtshaming, have used remote sensing provides a means to assess an accurate record of water-use to map the high use of water to estates to out individual culprits of over-watering, tracking the greening of their gardens by Google Earth and Digital Globe and an assessment of exactly how healthy those yards are.

BelAirOverview20160909.jpg

Using remote sensing of the health of plants–by means of a form of remote sensing developed to detect plant health common in agricultural assessment– the Normalized Vegetation Index (NDVI) helps to pinpoint individual culprits of water over-use might be identified whose identity would be otherwise kept hidden by the county, by measuring the living vegetation that has continued its ability to absorb visible light wavelengths of light, the very ones used in photosynthesis, to create a unique dataset of those with the largest living yards in the municipality.

For the primary culprits are be identified by remote sensing of living green vegetation that remain on such sites as the heavily wooded estate that is maintained by move producer Peter Guber, part-owner of the Golden State Warriors, who indulges his wooded estate with over 2.8 million gallons of water each year, while pushing the Warriors to take up a home in San Francisco to boost their revenues.  The owner of the 42-room French-style chateau from TV’s “The Beverly Hillbillies,” former Univision CEO Jerrold Perenchio, who uses up to 6.1 million gallons each year to water his plants and gardens.  The owner of the 28,000-square-foot “Bellagio House” whose floral gardens suck up over 4.6 million gallons per year.  The technology used of combining infrared and near-infrared light by the Normalized Vegetation Index (NDVI).    The NDVI has become sufficiently refined from satellite or drone remote observation to parse and better describe water use and its impact in plants with a great precision, as is evident in the MODIS satellite maps of groundwater in the United States, and to present a highly sensitive reading of vegetation health at precise moments in time, and indeed within given parameters of health, by mapping the presence of water in plants–as one would map the presence of water in the ground.
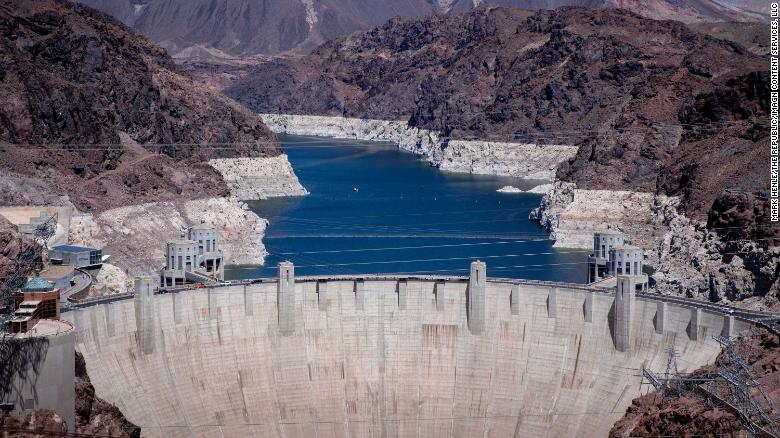
NDVI.jpg

By means of a similar remote sensing with NDVI, one can effectively map lots’ local water saturation at a scale to detect individually owned gardens such as those that Guber indulges on Lausanne Road in Bel Air–outlined below , with relative vegetative health shown in red colors, showing the highest range of the NDVI–as an accurate way to assess the extent of living vegetation, using infrared and near-infrared light to measure the local health of vegetation with amazing sensitivity, much as is familiar from global maps–but is only recently possible at such low scale thanks to Digital Globe–in ways that can not only identify individual culprits of water over-use, but presumably take them to task.

Guber's estat.png

–or the Casa Encantada owned by Garry Winnick–

Casa Encantada.png

For unlike the yellowed out areas of most of even the region of Bel Air, the bright red expanses suggest an odd over-nourishment of gardens even in a time of drought that indeed seems quite newsworthy, and is perhaps able to be viewed by Digital Globe alone.

Casa Encantada trees.png

–and can also be mapped, if with less clear-cut results, by soil moisture:

Soil Moisture.png

While such remote sensing from satellites had been confined to national regions at specific times of year,

600px-ndvi_062003

600px-ndvi_102003

–or used to map global differences in plant health–

600px-Globalndvi_tmo_200711_lrg.jpg

–the local assessment of those who over-indulge in caring for their lawns and flowers is both something close to surveillance and perhaps a form of surveillance that recent laws about water use have sanctioned in California during our current drought.

The odd triangles and spots of green that remain in a drying out landscape in which most of the rest of us live (spot the non-arboreal light green track in the tan landscape shown below?) reveal the levels of water waste which demand to be curtailed, and are emblematic of the golf courses and overwatered farms that we’ve just begun to take stock.

FullSizeRender-11

1 Comment

Filed under Bel Air, California drought, climate change, mapping drought, remote sensing