
Malcolm Margolin was among the coolest and most curious people I’ve known. And while terribly saddened by his recent death, and mourning his dynamic presence, he was long a model for struggle we will need to remember in a dark age. I first met Malcolm as we walked the Bayshore Trail in opposite directions, Malcolm appropriately seeming to patrol the newly reclaimed bayshore pathway a tradition of the Ohlone people. As if a modern Henry David Thoreau who found a new Walden in the East Bay, Malcolm seemed, walking along well-worn trails, self-appointed clearer-of-paths of the East Bay wilds. While from Massachusetts, this Harvard-educated hippie won a grant to write a book about working the land without transforming led him to appreciate the native ways of another tribe, what Gary Snyder called “old ways,” that were rooted in place as much as they channel American transcendentalists that was purely Thoreauvian in its spin.
As Thoreau, Malcolm saw the ethical traditions of the local as a deep purpose of “rules, customs and practices outside the dominant way of life,” evident in the local Indian community, as if he recognized it–and adopted the vision of straddling outsider cultures and communities on projects of refusing to tame wild lands, allowing them to exist for our benefit against all odds. Malcolm grasped–as have others –the value symbolic anthropologist Clifford Geertz ascribed “Deep Hanging Out,” as a basis for ethnographers’ sense of purpose was immediately recognizable to Malcolm. And it was a way of describing his longtime Berkeley residency on the margins of academia, and at the center of a large industry of small presses as as deeply purposeful as the noted generations of anthropologists who had studied–and indeed mapped–indigenous cultures in the state, more often reifying their presence as an “extinct” peoples. Malcolm’s work, if often based on oral accounts of life before westernization, provided a model of Geertz’s concept of “thick description” less tied to the symbolic webs of culture, than the immersion in a sense of place and vital relation to place. The purpose he gained in the rich local setting of Berkeley, CA, from its parks to its shell mounds to its coasts and islands left a bookish world for close study of the ethics of place, before he brought this attentive wonder to a home in the bookish world. And the deep knowledge of place–a sort of expanded “local knowledge” of the Bay, to cop another phrase from Geertz–offered an alternative anthropology of the local, rooted firmly on the West coast.
As a former parks ranger who had, indeed, cut his teeth rebuilding the trails in what was Oakland’s Redwood Regional Park–a jewel of native forested lands of old growth trees in the East Bay, one of the large redwood forests in the East Bay, and third East Bay park open to the public–the largest natural grove of coast redwoods in the East Bay. While Redwood Regional Park, where he first worked and developed a sense of the preservation of the wild, was renamed after Aurelia Reinhardt, Malcolm must have been nourished by its old growth redwoods; I’d like to imagine, their age, if actually not that deep, gave him a new sense of spatial orientation to place to Ohlone residents, and a sensitivity to the suffering it had undergone and he might save. His love of place may have begun earlier building trails, but in immersing himself in the practicalities of lost woodland trails as a redemptive process led him to become a proselytizer of many regional off-road trails, to treasure them as a site of contact to other worlds and pasts in danger of being lost. If AI algorithms somehow generate a tie from a search about Thoreau’s writing at Walden between “the site associated with Henry David Thoreau’s experiment in self-sufficient living and a more recent effort to return land in Berkeley” to the Ohlone people, a missing link may be Malcolm’s attention to the uncovering of indigenous practices and histories of place.
The understandings of Indian Country that he gained, and enjoyed, led him to move between many worlds to establish his footing, and gaining a sense of potential redirection of past injustices that he dedicated a great part of his life. If few cartographers are so resistant to following rules, Malcolm’s interest in the quirky and the overlooked led him to blaze new trails across much of the Bay Area. Whether the serendipity of Malcolm’s work in an old growth forest in the 1960s, as newly planted redwoods of the region first provided a hope of restoring forested lands that had ben cut down.
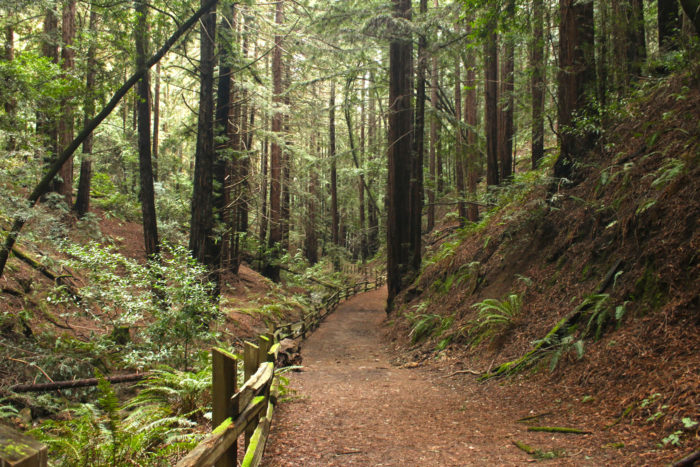
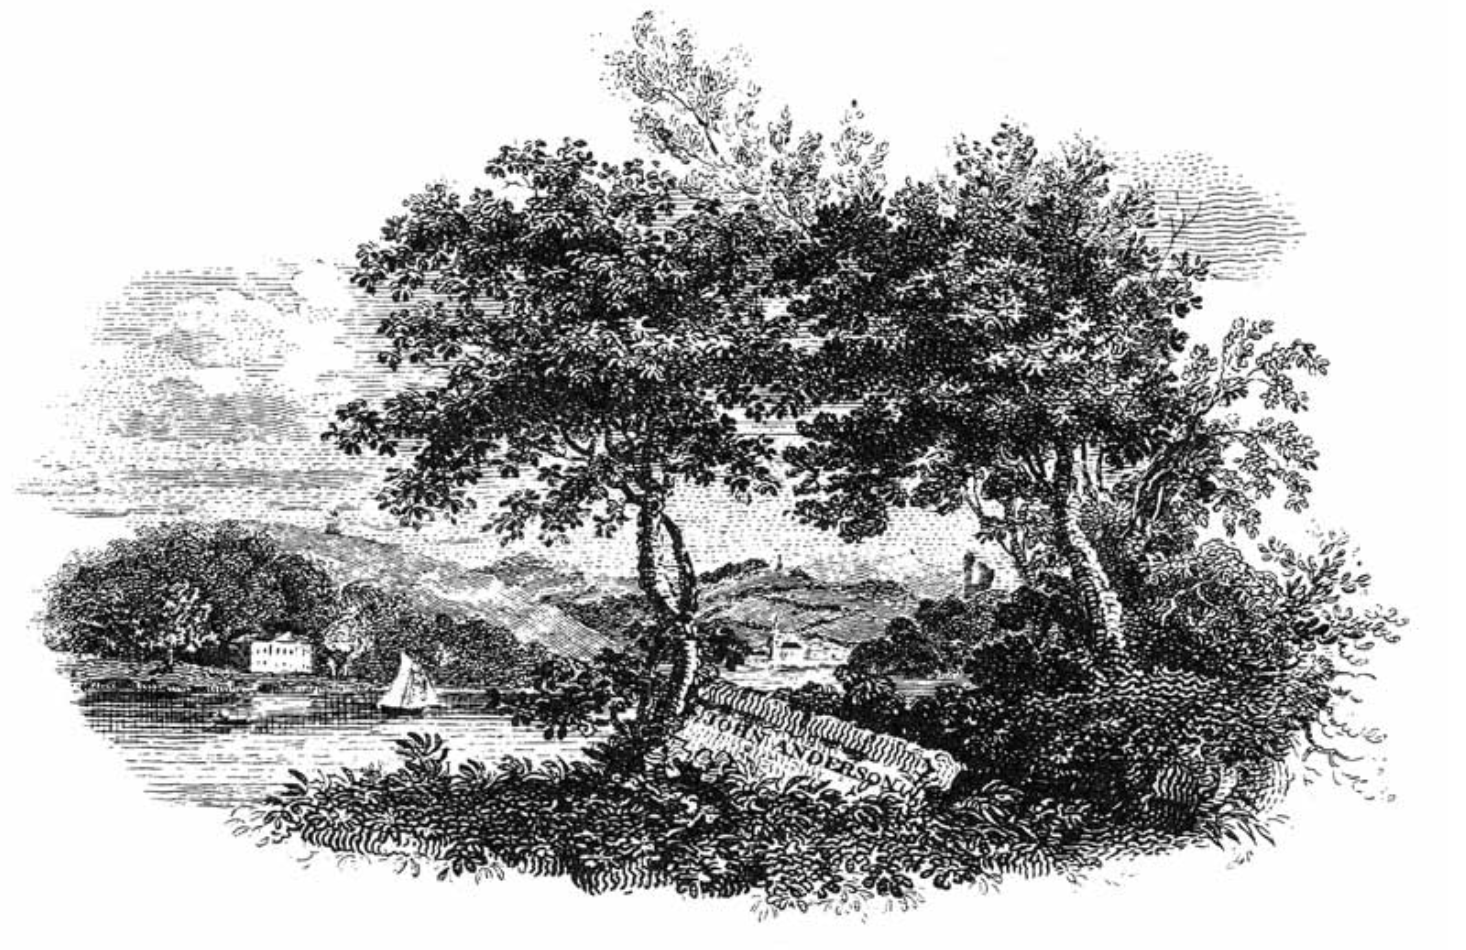
Forested Trail in the Dr. Aurelia Reinhardt Redwood Regional Park. Photo credit: H Grimes
While Malcolm told me a few times he would never have been able to research Ohlone Way (1978) or other works without the University of California’s library at the ready, praising the gift of the open stacks at the public university, this East Coast transplant who lightly tossed his Harvard credentials cast himself as an outsider intellectual who could serve to orient a new generation to the region’s native lands. Malcolm had, in Ohlone Way, animated a sense of preserving native ways. If in part this followed Alfred Kroeber and Henry David Thoreau in describing Indians as “extinct,” at first, at least in California, he spent much time and effort revising the remark with a celebration of native presence and the vital nature of traditional tribal arts–few did as much to stress their current relevance and continued presence in these lands. While Malcolm’s project of “cultivating the wild without taming it” became a sort of ethos of the outdoors, popular in the era, his guides to the practicalities of the wilder areas to enter just outside the East Bay and San Francisco presented a vital document of a world before urban sprawl, promising to rehabilitating one’s relation to the wild–and rehabilitate one’s soul–of deeply Thoreauvian ends of transcendental thought.
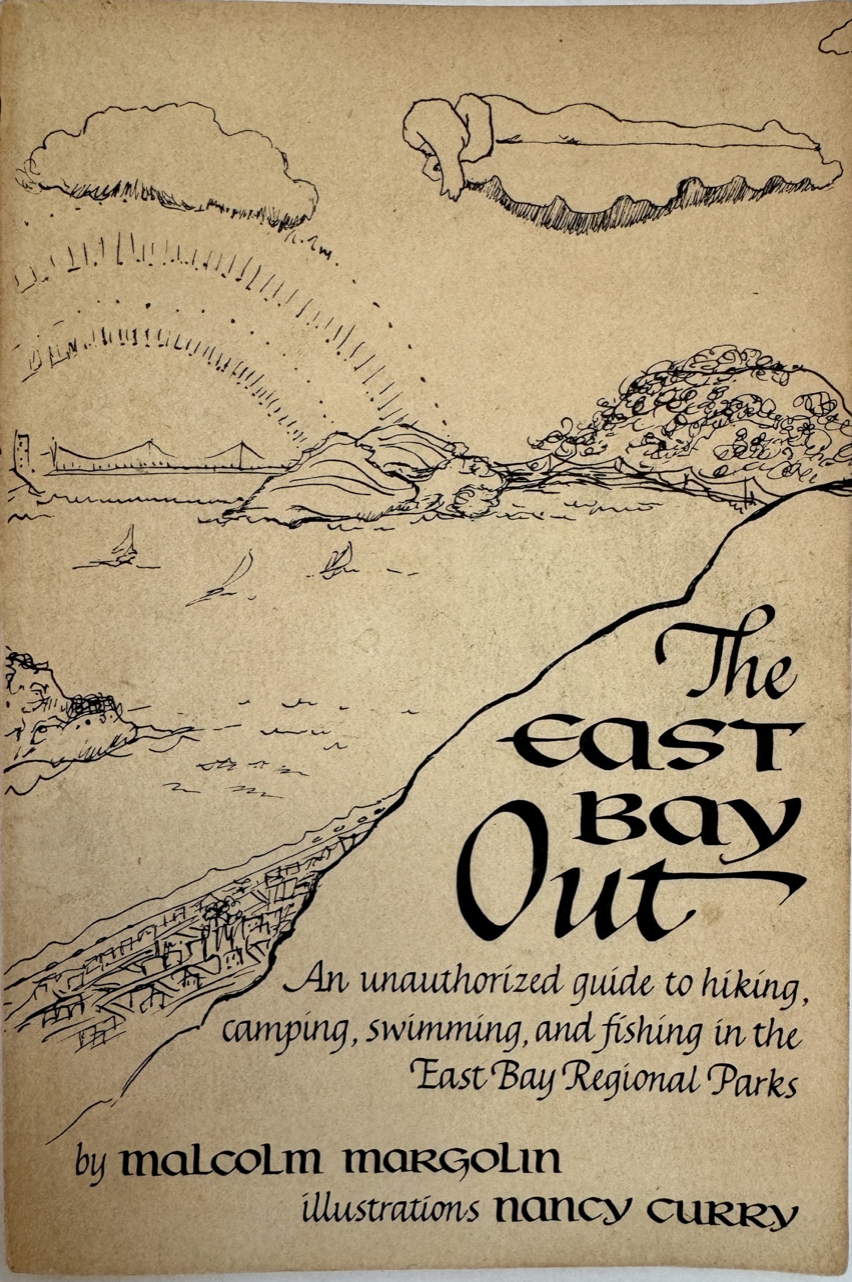
East Bay Out (1974)
For ever since idiosyncratic explorations of the region some fifty years ago, and the pioneering communication about the land he learned to know so well, East Bay Out (1985), the very deeply personal guide that allowed audiences to embrace to orient themselves to the Bay he loved, as if it were a world outside and beyond the familiar, to explore out of the paved regions of Berkeley, in what has been an increasingly compelling mode of deeply meditative work on the edges of settled world we collectively failed to pay sufficient attention as built infrastructure expanded. If an idiosyncratic sort of cartographer who bucked at the idea of having to follow rules, Malcolm developed a sense of wonder in the East Bay, as much as he simply moved there; as he immersed himself in its forested wilds, the parks became a keystone to the admiration of nature–as he grew to be the elder statesman of wonderment, never tired at pointing to the overlooked we needed to notice, and most at home when he engaged as deeply as possible in his surroundings, including, of course, its rich indigenous pasts to which he dedicated so much attention and wonder. As if the making of trails in Redwood Park were a weak fit with his ambitions and skill, trail-making lead him to blaze trails of inquiry across the East Bay, in part because of his resistance to following rules. If Thoreau had famously described himself as all mapping, for Thoreau, was indeed a form of reclaiming an ethical relation to space, from the recuperation of a mapping of an ethical relation to the Concord River that spanned its indigenous past and the present, through the French-Indian wars, but also, at Walden Pond, a universal history of heroic aspect and the present. As Thoreau described himself to readers of his book–Malcolm knew it well–as the self-appointed “surveyor, if not of highways, then of forest paths and all across-lot routes, keeping them open, and ravines bridged and passable at all seasons, where the public heel had testified to their utility” Malcolm had a deep sense and deep meanings of new forms of mapping as a public utility.
As access to the wild shrinks and is constricted, Malcolm’s work stands as a theological practice of the outdoors, perhaps as rigorous as the ethical practices of his Yiddish-speaking grandparents, if more light-hearted and wondering, with an ample dose of John Muir’s sense of wonderment at the Cathedral of the wilderness. The sense of straddling worlds was perhaps a deeply Jewish angle to the past: if Malcolm was born in Boston in 1940, to a prosperous merchant family, less than a generation after Geertz had been born in San Francisco in 1926, the position that he had in Berkeley was one that left him little to be envy for his academic anthropological colleagues, more embedded than they were in local cultures in many way, but with the distance on academic preoccupations and terminology, or indeed on his scholarship: the sense that Jospeh Epstein expressed of both being “part of a great nation, and, having been born Jewish, simultaneously just a bit outside it, too” as being quite a position of advantage for a writer was, I think, an advantage Malcolm also felt–an ability to write as an insider and outsider that was magnified or redoubled in his relation to academic writing, and the establishment of a new press to publish his work on the Bay Area’s landscape–maybe in emulation of Thoreau’s self-publication of his first book, A Week on the Concord and Merrimack?–certainly gave him a sense of shared perspective on the massive extermination of indigenous California culture, and the ethical importance of preserving its vital life.
For if his sense of deep ethics were entirely secular, and resolutely so, the intensity of wonder and interest in the living landscape from which an indigenous past had been dangerously distanced was fundamental in his straddling of worlds. That book had helped re-interpret the regional landscape of the East Bay landscape that Malcolm, a transplant from the East Coast, to be sure, made his own to an ever=-growing audience of readers. He had self-published the book a few years before I arrived in Berkeley, CA myself, as it happens, after Malcolm had become a force in the attraction of renewed fascination to the rich ecology of the diversity of the Bay Area’s natural history and the scale of their loss–The Natural World of San Francisco (1967) had just appeared in print, and former rock climber David Brower had already started to agitate tirelessly to preserve the natural landscapes of the Bay Area, fighting for the conservation of areas of seashore and wilderness in nine national parks from the Point Reyes National Seashore led to the adoption of the pioneering Wilderness Act (1964), promoting the notion of coastal preservation was energized across the country, in ways that created a legacy for conservation only being recently turned back after a generation has taken it for granted. Soon after land acknowledgements became the norm in much of the United States, and were played regularly on the PA system of Berkeley Libraries, to remind all reading that they were so doing on “unceded” Ohlone lands that the tribe possessed from time immemorial, the ground has shifted under our feet. The position of wonderment that Malcolm long held, from tromping around different East Bay parks to exploring the region that he convinced all who would listen was a wonderland, provided a source of resistance to the development of the Bay Area, a deep environmentalism of historical consequence. And uncovering trails of wonderment was what Malcolm was all about.
It may make sense to take stock of the major shift of the Great Society and 1970s of land conservation as part of a massive shift in collective memory of which Malcolm was part. If the Regional Parks provided a crucial space to hold the state in abeyance, and indeed to keep the state out of one’s life, the shorelines preserved in seashore parks–including much of the coastal region of California, that would lead to the California Coastal Commission–afforded an early notion of a remove from the state, by the early 1970s, to preserve the entire coastal waters of 1,100 miles of coastline from uncontrolled development of coastal property that would prevent the loss of access to coastal waters and the shore by 1972—best understood in the somewhat longue durée of the foundation and preservation of a ten national seashores across the nation from the early 1960s, a distinction that defined the nation’s drive to coastal preservation during my own childhood.

David Brower and the Foundation of Ten national Seashore Parks, 1961-1972
The memory of conservation may have faded more quickly, if Malcolm’s work did not help keep it alive. The local new energy of treasuring wilderness by books on open spaces, environmental awareness, and nature photography, calling for an ethos of conservationists of leaving absolutely no mark in the landscape “save the scars upon the Earth that could have been prevented had they stood their ground.” The pioneering work was never so clearly seen as in the creation of national seashores–an effort that might have begun on McClure’s Beach in Marin County, just outside San Francisco, and Tomales Bay Park, but created energy that led to the creation of “national seashores” across much of America–from Cape Cod (August, 1961) to Pt Reyes (1962) to Fire Island (September, 1964), to Cape Lookout (1966) to the Gulf Islands (January 1971)–and Malcolm saw the regional parks where he worked as a groundsman 1970-72 as something like an alternate text to the map of the current Bay Area, developing as an East Coast transplant a distinct sense of wonder at the biodiversity of the parks that survived, even if the rich range of grasslands, nourishing streams, and herds of elk and bears that once roamed the land that was cared for by indigenous survived only in the testimony of the first settlers. And if many are annoyed but he land acknowledgements that have appeared on university stationary, movie theaters, and play houses and arts centers as if pious obligatory statements, offering but lip service, the importance of preserving and observing the forgotten history of the land was a movement at which much of Malcolm’s work set the ground.
As much as a new Henry Thoreau, Malcolm remained at the helm of the press of most of his life–only leaving with reluctance, continuing even after his retirement to be an advocate of offering a path for all to find their own Waldens, and by a plurality of Thoreaus, not only in the Bay Area but far beyond. And if the parks provided a way of thinking outside the state, and subtracting oneself from the state that was increasingly entering one’s head, it is more tragic than ironic that as we stand at the prospect of a government shutdown after his passing, the President defined by a moral void and absence of any moral center seeks to furlough parks workers in response to the eventuality of such a shutdown, and indeed to mandate leaving the parks open to all Americans, supervised only by a with a rump staff, flying in the face of expert advice, not deeming the workers who run them to be essential workers who must remain on their jobs for its duration–if some in the National Parks would be required to stay on the job, but have to wait for back pay. Parks Service was already reduced by a quarter since Trump took office at the year’s start, cutting backcountry visits, the presence of rangers, and relying on volunteers at parks as historic as Yosemite, but the reduction on critical maintenance of open lands and disaster preparedness may damage the very preserves for which a generation fought. If Malcolm would have hoped the compromise would spur a range of public protest and indignation at an end to wilderness protections, we’ve been so battered by an onslaught of public absence of oversight to make the prioritization of open park lands as a preserve to subtract ourselves from the state may be a challenge, even if it shouldn’t be.
A clear-sighted of environmental visionary, Malcolm was able to corral multiple folk behind his vision to crusade for promoting a sense of happiness in envisioning a future and better world. For much of what Malcolm agitated for was a better way of settling in the world–and indeed being settled in the Bay Area–than was evident in the landscape of development that was emerging in the years he arrived in the Bay Area, in ways that allowed him to make it home. The energy by which he teased out meanings from alternative geographies of his adopted home of the East Bay, of plants, animals, and past inhabitants opened eyes to new geography of place and space in the region, against an increasing automotive space defined by the straight lines of property, highways and trip-tiks–those ancestor of GPS, ordering spatial travel on fold-out paper map, highlighting stops only for hotels or scenic views, of clear edges, privilging boundaries and confines of attention in place of marginalizing the off-road parks. For rather than encouraging investigating the off-road regions at small-scale, maps offered a purblind image of place. (It may well have helped Malcolm didn’t drive, but made the lack of a license into a virtu:e: late in life, he smiled regaling me the distinct advantages of not driving, reminding me how he benefitted form never driving: both to getting driven home from parties and always meeting people in the rear seat or be given rides that had led him to meet the most interesting people who drove him home in the rear seat of their cars.). The handbook he wrote for exploring the Bay Area’s parks on foot, and to lead other groups to marvel at their wealth, was a large part of Malcolm’s source of energetic vitality.
Berkeley was a perfect place to find interesting people to talk to, no doubt remembering his life as a bon vivant. When we had met on the Bay Trail, Malcolm’s Old Testament beard wafting in the wind as he turned the Bayshore Trail that day seemed a sort of synecdoche for the testimony he offered and channeled of collective memory of the bay, and of the land, deeper than any map, that might be captured by deep time, or deep hanging out, to use the phrase of Clifford Geertz he was fond enough to use as a title for his final book, to claim the anthropological mantel he had been accorded even in the aftermath of some resistance to his appropriation of indigenous testimony as a record of a timeless past. And ever energetic, even in the assisted living quarters in Piedmont, he swept his hands in the air as he optimistically envisioned the ways that “people will take to the streets” against the Trump Presidency, which he asserted would bring the greatest revolution in political self-awareness since the sixties, convinced of the huge benefits on the horizon, if no doubt at this point also reliving his own love of the protest culture of the late 1960s, and perhaps taking a far more positive view on American politics than I had the heart to contest.
The belief in the value of a deeper knowledge of the Bay, deeper than the aims of developers or the maps of property, animated Malcolm as it had animated, in a sense, his entire energetic career. The promise and premise of East Bay Out, a work long in making, was that we’d all do better to cultivate the off-road and unpaved.) Was not the fixed itinerary one against which Malcolm rebelled in expanding attention in East Bay Out on a broader concept of space and place, worthy of attention, directing increased attention to the parks he knew so well? The elegant if austere line drawings of Nancy Curry helped to offer an assist to visualize the parks he knew so well as an off-road region worth exploring, to not allow to be reduced to rectangular regions of green–

–providing personalized itineraries treated travel as a process with no detours or uncertainties, as an experience mimicked by the streamlined paths of AAA versions of Bay Area Rapid Transit map-

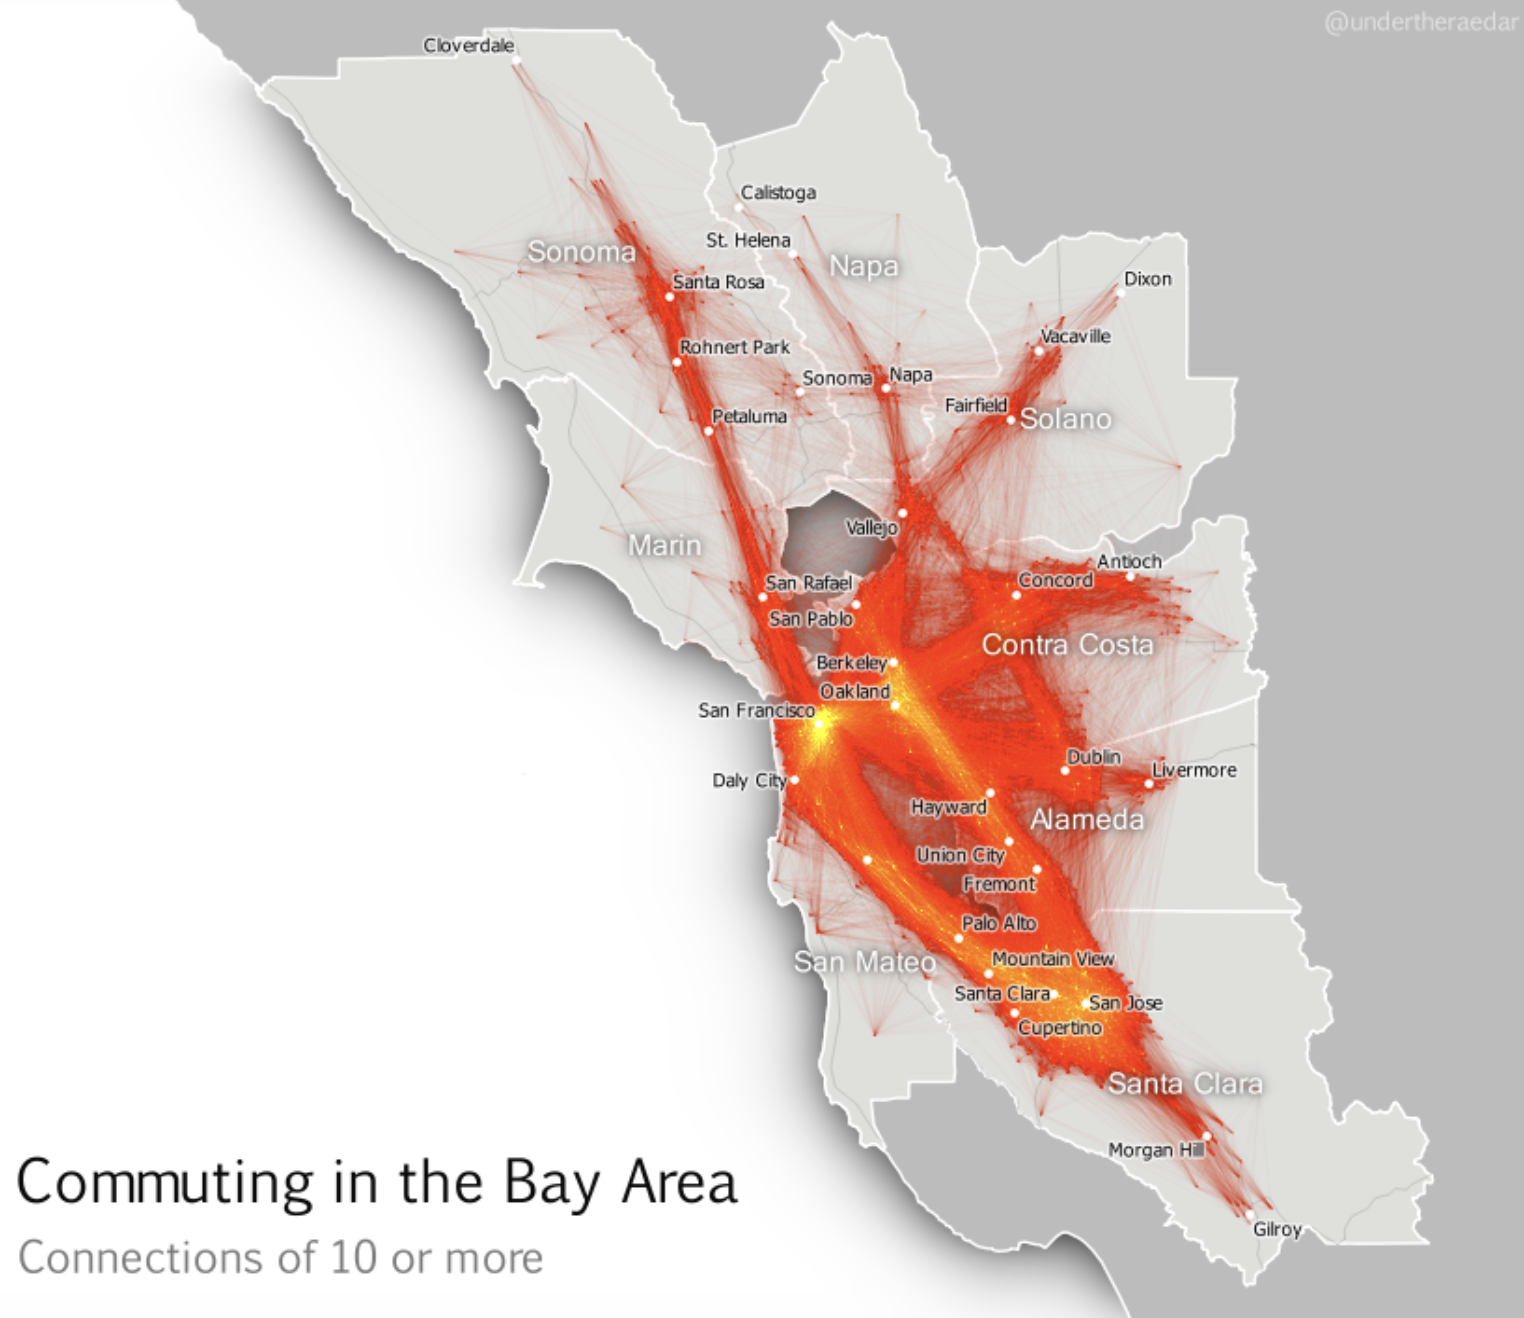
-a region where the transit map and commute intensity has grown rapidly, if not astronomically, in recent years–so that the average distance commuters have lived at an ever-expanding distance from work, and the already considerable ten mile commute of 2019 has nearly tripled by 2025, and commutes across Malcolm’s treasured Bay Area have put folks working in downtown Oakland from ever larger distances at which they rarely have time to experience the green areas in the map, or the riches of the Bay–a distance of commute that have dramatically expanded since the commute has grown to almost thirty miles, creating a hellish commute that compromises time outdoors.

Commute Distance at which Workers in Downtown Oakland Live, 2010
At the time as this distribution of the daily commute across the freeways of the East Bay, Oakland Mayor Mayor Libby Shaff promoted the tree the symbol of the city–affixing it to all street signs in the city as a new proud logo of the greening city–promoting a tree-planting project across the city that would reclaim the city’s live oaks celebrated as a the basis for plentiful Oholone harvest of acorns, a mission to “re-oak” Oakland beginning with the planting of an inaugural stand of 72 saplings of coast live oaks in plastic buckets in a West Oakland park, realizing the deep belief, endorsed by landscape architect Walter Hood of UC Berkeley, how“Names are a powerful way to think about a place,” and first proposed the Mayor’s recent resurrection of the city’s forgotten groves, first celebrated by men like Malcolm Margolin as an indigenous inheritance. If the impact of the Ohlone Indians on the landscape they distinguished led Spanish and Mexican residents of the mid 19th century to name the place “encinal”–or oak grove–the protection of the trees already fast disappearing from the region in the 1850s as it grew led its first mayor, Horace Carpentier, to try to protect the trees, even as oaks were felled for development and the expansion of its gridded streets.
Today, few oaks survive save landmarks that stand as sentinels, as the Oak in front of City Hall, whose canopy of tributaries of branches was only planted in 1917, but was adopted as an icon of the hope to remake the city in the sign of the sheltering canopy of the expansive green tree once more.
Malcolm’s heroic task was to remind us all of the green areas that are on the map, before they are mapped out of existence or public consciousness, and remind us how easy they are to . Indeed, vast areas like the 5,924 acres of Sunol Regional Wilderness, the over 5,000 acres of Briones, the nearly 5,000 acres of Anthony Chabot, 2,000 acres of Redwood Park and Tilden Park, and the slightly less large but brilliantly illuminating grand 1,500 acres of the Morgan Territory were something like negative lands, too often unexplored, not to mention the reduced rump of what has the grandiose name of the Ohlone Regional Wilderness, situated between Sunol and Del Valle, that suggested a new topography of space in which Bay Area residents were urgently asked to reorient themselves in Malcolm’s pioneering work.
The dreamy cover of that “unauthorized” paperback guide to the region–East Bay Out (1985)–certainly offered a decidedly off-road record of outback experience of the region, neither a God’s eye or bird’s-eye view, its old cover featured a blissed out Malcolm or reader floating above the bay from atop a cloud, looking down on a built but intriguing bayshore, as if in harmony with nature, ready to descend explore the open areas for camping and swimming the book described. (It is hard not see the cover, as I never did before, as an image of Malcolm Margolin floating as a benevolent spirit presiding above the coast of a region he celebrate with enthusiasm and came to know well.). If perhaps the figure on the cloud was an iconic persona of the Aquarian Age, Malcolm adopted the calligraphic skill of Bay Area penmanship to invite all readers to tap their inner Thoreaus in the guide to living outdoors–hiking, camping, swimming, and fishing–in their own Waldens able to be discovered not far from the edges of urban life in the East Bay Regional Parks. An evangelist and a guru, as much as a historical anthropologist, Malcolm led the way from his own cloud to the future.

The East Bay Out (1989)
I first saw Malcolm one afternoon pacing leisurely on a recently restored shoreline in the Berkeley Marina, he seems rooted in the Bay Area he loved so much, moving along the path quite rapidly and deliberately on paths restored in by 2009. The remade wetlands home to many more birds than a decades previous had been a major victory of the restoration of the shoreline he had very much promoted and must have relished. Perhaps ever since Malcom came to Berkeley, he was seeking actively to front the wild, as Thoreau would put it, with joy–rediscovering the parklands as if facing a frontier–Thoreau’s sense of the word–but not the frontier of lands held by settlers, that deserved to be seen again by the wilds that it still contained.
1. Instead, it belonged to the bayshore people he had made his own alternative present. There was a sense of the urgency that he did so squinting in to the horizon, as if he were looking for signs of the past occupants of these native lands that he knew so well, seeming as he walked an Old Testament prophet on a New World coast, beard buffeted by a bayshore breeze. He caught my eye before we had ever met, and I already wanted to know what he was so clearly thinking about. But, if Thoreau was walking the paths alone, Malcolm seemed eager to invite others to walk the same old paths with him. When Malcolm confided somewhat conspiratorially either at the outdoor tables of Saul’s Delicatessen or Piedmont Pines how much Berkeley was a perfect place for “folks like us.” No doubt the had long honed the pitch of overly generous flattery to make one feel part of a club, and promote the rather miraculous trajectory by which he had founded a productive press and nourished a new community of readers long before Indian activism.
But he praised the city and its active readers, sense of responsibility, and accessible libraries as a treasure: access to the libraries of UC Berkeley that he so often used from when he first arrived in 1969. There was a vision of rediscovering the old landscape by a poetics removed from the present day. In ways, he echoed the sentiment of recovery that was voiced by Thoreau, when he imagined the poetic practice of exploring, as if “I walk out into a Nature such as the old prophets and poets, Menu, Moses, Homer, Chaucer, walked in,” a landscape he offered “you may name it America, but it is not America: neither Americius Vespucius, nor Columbus, nor the rest were discoverers of it [sic],” but was arbitrarily named on maps, in which but a “few old roads that may be trodden with profit.” Somewhere, Malcolm still walks wider trails. The sense of a pre-Columbian contact with a lost land was dear to Malcolm, who never got rid of describing the encounter–more accurately than one of conquest–as the arrival of a starved and tattered group of Spaniards disembarking from ships on the edge of a peaceful, settled, and economically established nation, hardly in need of mapping and having already persisted as the engaged custodians of its plentiful ecosystem whose rivers fed fields and forests regularly harvested and maintained for a range of coastal peoples.
When we met, I had no credentials or a university affiliation, but couldn’t help being flattered by the attention. I now realize how much the East Bay was a living library for Malcolm–a library without walls, and an interconnected one that couldn’t be segregated on shelves by call numbers or single volumes. I don’t think it is a library that won’t be so deeply appreciated without him here. But the energy and encouragement to interrogate and appreciate its hidden maps, and hidden pathways, will be wanting an active a set of prompts and stimuli. Malcolm Margolin had found a home in the East Bay, but also made it one of the more interesting places for discussing books and ideas outside of university libraries’ bookshelves. And Malcolm of course worked to open eyes to alternative geographies long before the multiple alternative hand-drawn atlases of urban nature and bayshore habitat evident in the restored wetlands,–or the new cartographies of Obi Kaufman or Rebecca Solnit of California–he did much to encourage, to open eyes far beyond the rich bay. But if John Muir saw the wilderness of Yosemite as a cathedral, to pursue my analogy, the more bookish Malcolm saw it as a living text, pulling out threads of narrative with endless curiosity that have altered our picture of it and encouraged the stability of a built geography to be questioned.
Malcolm was walking that afternoon with energy, around the bayshore trail, alone, as if in the footsteps of the shore-dwelling Ohlone, enjoying the restored shoreline rather recently completed, and of which he was so much apart. Eager to catch or notice something new, the man seemed a long-haired bearded prophet, to watch, even if I didn’t know who he was, with something like awe, as if he were looking for a new frontier of natural observation, retreading long untrodden shoreline paths able to be imagined of the indigenous community of a once highly populated East Bay.
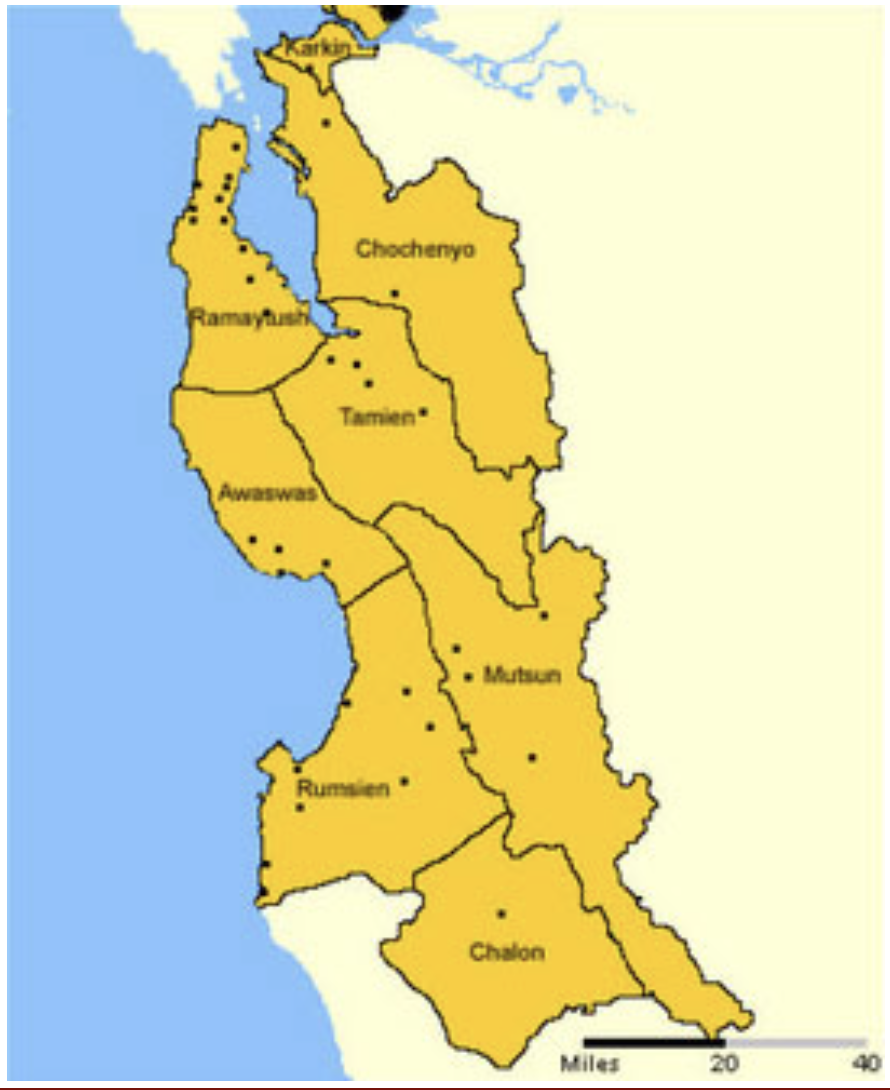
Bay Area Indigenous Language Groups and Coastal Settlements/Levy (1970), amending Kroeber, 1925
Malcolm may well have been in that moment envisioning the lost past of the coastal bayshore as he moved deliberately across the shoreline trail, as if searching for evidence while scanning the shoreline as if squinting for traces of Ohlone shell-mounds long since lost to the landscape. He had done so much to preserve the memory of the shell mounds, many of which were leveled in their entirety the 1920s, at the same time A. L. Kroeber had begun to teach anthropology courses about California’s indigenous in lecture halls at U.C. Berkeley. Kroeber, who was attracted the artifacts and symbols of the indigenous, seized on the project of “salvage ethnography,” in the footsteps of the mission that his teacher Franz Boas, linking archaeology and ethnology in artifacts, proclaimed the Yahi Ishi in 1911 to be the last surviving “wild man,” cornered by dogs in the hills near Lassen, of a tribe he believed exterminated by white settlers of the state, who he proclaimed “the last wild Indian in America,” who died from tuberculosis five years later in captivity. Seeking to preserve the final remaining traces of the indigenous cultures Kroeber believed vanishing or gone, he imagined a map torecover the expansive linguistic repertoire of a lost indigenous world across the state of California, mapping the linguistic groups of California’s former residents as a living world in a cartographic symbology of set boundary lines and distinct colors of discrete linguistic groups.

Linguistic Groups of California and their Families (1925)
While Kroeber did encourage skeletons from indigenous graves, including the massive shell mounds that had formed burial sites of ceremonial veneration over time, the massive structures of over thirty feet tall and longer than a football field in length to assemble knowledge stretching back thousands of years he believed confirmed “the permanence of Californian culture is of far more than local interest,” as he wrote in 1925, but “a fact of significance in the history of civilization.” The elevation of the moment of contact to an inverted picture of starving if not ravenous Spaniards, alienated from the land, meeting a stable society of flourishing tribelets living without money and not needing intentionally offered a new perspective on civilization itself.
Malcolm did much to affirm the importance of indigenous California in global history,–if for different reasons and an opposed logic by insisting on the necessary importance of indigenous anthropology for the present day: the veneration of these ancestral burial grounds had functioned as a permanent ceremonial site for the itinerant coastal peoples, and of orientation for a modern world that was far more out of joint and less attuned or aware of historical change. In keeping with the razing of many historical structures in the East Bay, the mounds Kroeber urged pillaging for evidence of native habitation were unceremoniously cleared for railroad tracks, paint factories, and parking lots of the malls now located on the level ground of “Shellmound Road,” a small stretch without hint of the massive structures over thirty feet tall that existed for each of the villages that dotted the bayshore before the arrival of the Spaniards, serving as navigational markers in the bay, as well as sites rich with ancestral meanings that often had their own names. Alfred Kroeber’s obsession with the pre-contact civilizations led him–much as Thoreau adopted the same word for indigenous at Walden–to call Amerindian tribelets “extinct as far as all practical purposes are concerned.” Insistently inverting that demeaning word–extinct–by revealing proof of the continued vitality of Ohlone culture and cultural practices was very much what Malcolm was about, as was asking us to re-see the Shellmound as a heap of rock to be excavated, cleared, or plundered. These were also lost worlds of a past that must have seemed fantastic, not only to his daughter, Ursula K. LeGuin, but to Kroeber himself, who, fresh from the east coast and armed with the toolbox of Frans Boas, saw a new world being able to be unearthed directly before his eyes with fascination.

Excavation of the Emeryville Shell Mound, 1924/Phoebe Appleton Hearst Museum
Many of the once abundant superficial traces of the shell mounds were long ago leveled, but they persist not only in local memory. Underground mounds are often intact, below the urban plant; when I saw Malcolm prowling the shore; he was smiling in satisfaction at encouraging negotiated agreements between the city of Berkeley and the Muwekama Ohlone, for the fate of mounds seen as sacred for over some 4,500 years, erased to the short-termism of the present, in which over four hundred and twenty-five shell mounds were constructed, often outlasting the villages that they once accompanied as sites of burial and focal points of community life of the sort Malcolm celebrated and waxed eloquent, as the oldest mound in West Berkeley, nearly 5,000 years old, only landmarked in 2000, long fought over by developers, more than anthropologists or historians.

Map of the San Francisco Bay Region, Showing the Distribution of Shell Heaps along the Bay Area, noting mounds on the coast as Present, Partial and Destroyed/N.C. Nelson, 1909
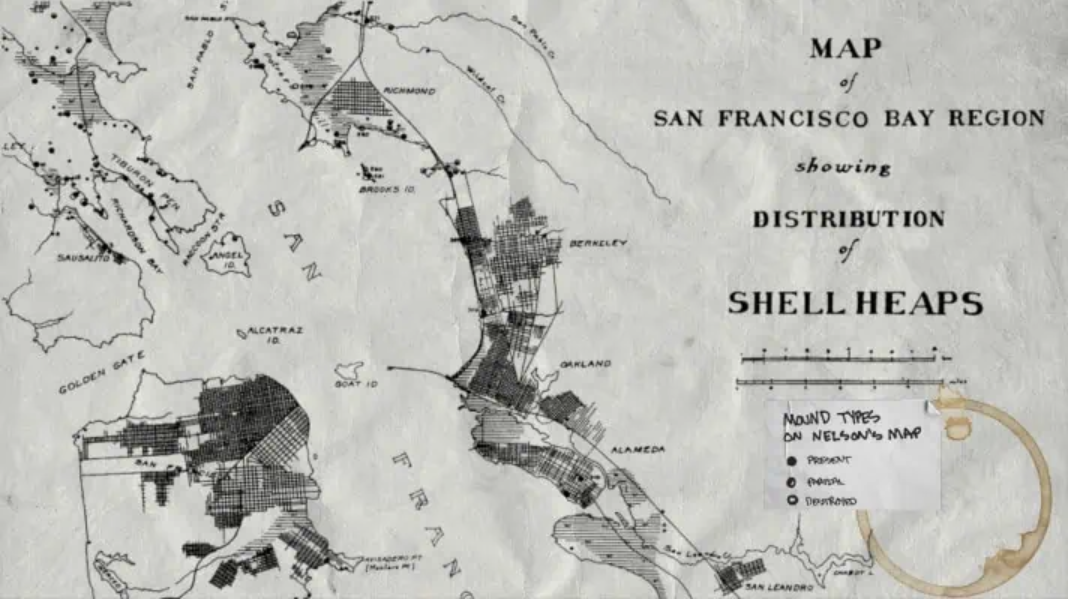
Map of San Francisco Bay Region, Showing Distribution of Shell Heaps (1909), Native History Project
As much as saddened by his death, Malcolm’s sense of the patrolling of the wild, or the edge of the frontier of wilderness, or just the shoreline, is a model for the persistent reminding of wilderness’ continued survival, and importance, to the world. Malcolm began as an East Bay Parks man, immersing himself in the 60,000 acres of east bay parks, far beyond the shore, For the relatively quite recent transformation of the parklands from open space bears historical traces not so far from living memory of the historical habitation of its open space, and the preservation of of the old shell-mounds in the recent historical record, and indeed present in local tangible artifacts that offered a new means and a pressing one to understand the history of many of the forty parks .
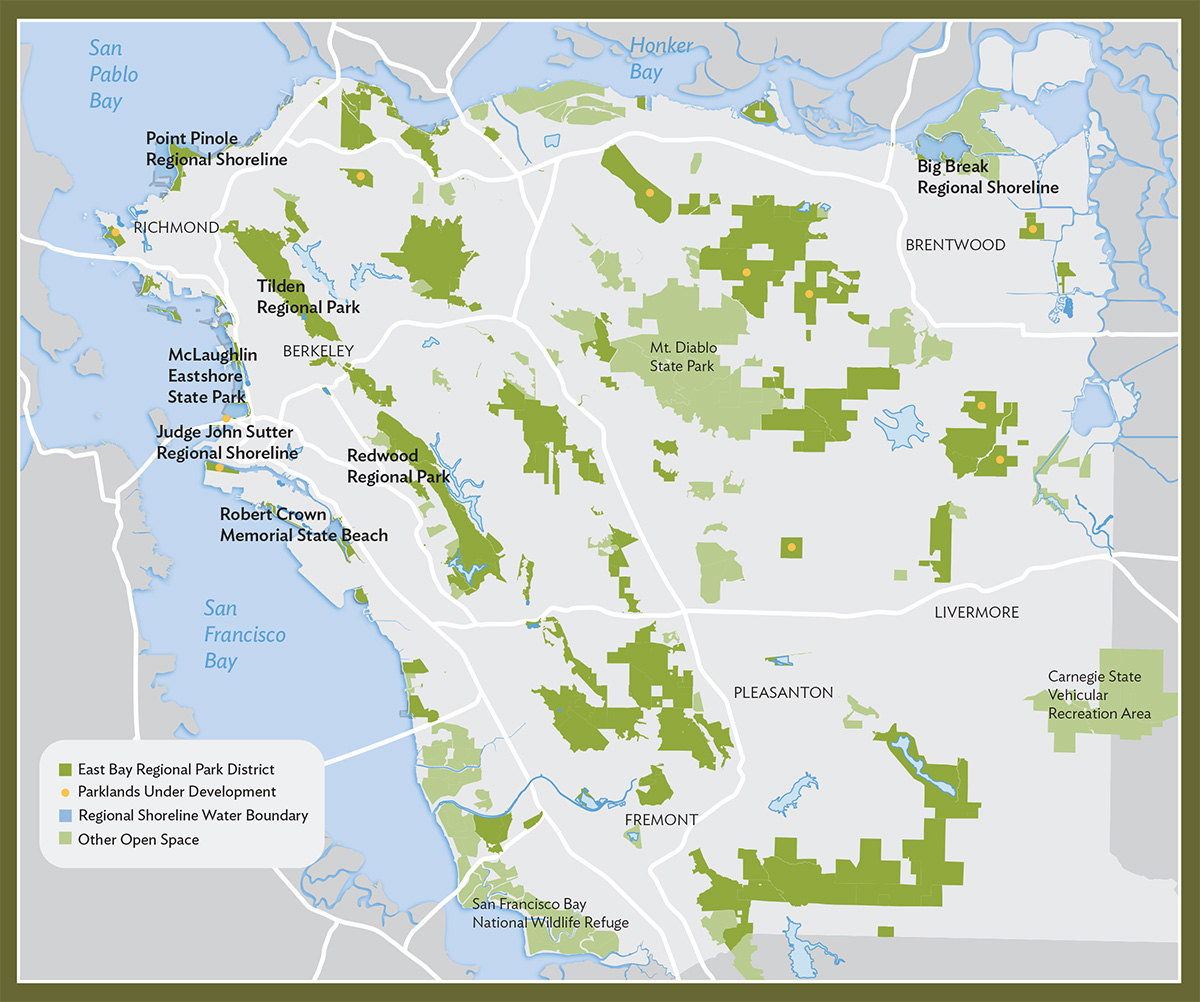
East Bay Regional Park District Today (2024)
The areas that were only just being explored, camped in, and lived in were something that he recognized as a valued historical repository, and indeed one to celebrate as part of the Bay Area. If Malcolm gained a new sense of himself in the East Bay as a ranger in Tilden Park, his unique brand of celebrating the region beginning from the orientation of the community to its parks, Malcolm was always looking for the survival of the wild. The light green overlaps of this map of the regional parks, or this modern expansion of the Regional Park District that exists today, omits much–the rich and enormous stately live oak trees, whose rich and nutritious acorns made the region a veritable storehouse of a plentiful supply food gathered, hulled, dried and stored as a nutritious staple later boiled as mush; or the seagrass of the Bay Area shores, that made the shore such an important meeting place and trading post for different tribes; or the willow stems and reeds in coastal marshes and rivers that are woven into baskets. These are of course among the layers of East Coast history, not evident in most data visualizations, if any, by which Malcolm taught many to re-see or see again the region of the East Bay–or offer, to cite John Berger, several ways of seeing.
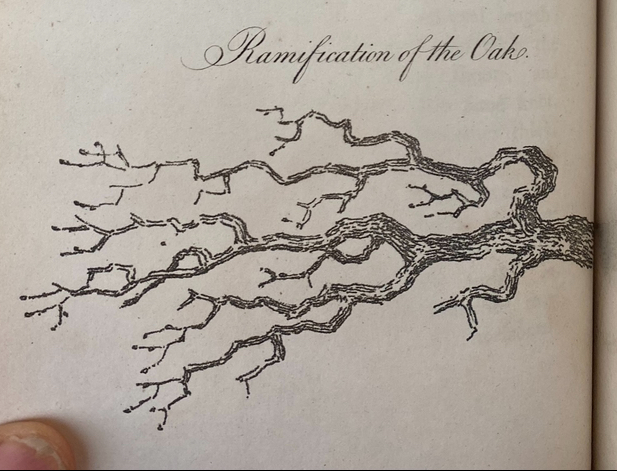
Perhaps it was during his stay as a ranger living in the park, touring visitors, and walking its paths, the arms of towering native live oaks of up to two hundred and fifty years old stand as witnesses of another age seemed to welcome him. Is it a coincidence that the cover illustration of Carl Dennis Buell of The East Bay Out, Malcolm’s “Personal Guide to the East Bay Regional Parks” written after leaving the Parks Service, featured in silhouette the capacious canopy of the elegant towering tree? The Enlightenment image of the Oak Tree on the cover of Malcolm’s book might have belonged to the engravings of the great English naturalist Thomas Bewick, who admired the brachiation of the oak as a source of divine marvel–a marvel that Malcolm seemed so eager to recuperate and transmit as a form of resistance during the shifting settlement of the East Bay. If Bewick became an engraver–and indeed raised the status of engravings–to communicate trees and avian riches of his native Northumbria, in boxwood woodblocks, that elevated wood engraving to a register of natural description, Malcolm became a printer to promote the Bay Area as a rich habitat, and increasingly as ancestral lands worthy of veneration and of better preservation, to encourage a sense of wonder and amazement by communicating the depth of his feelings about the East Bay.
Bewick was an early naturalist of the modern world, an author who brought attention to the rendering varied leaves and branches, birds, wildlife, and rustic places to the eye by borrowing the engraving burins to capture the gnarly branches of oaks laden with leaves in wood plate with a density of fine lines–opening to the world a warm generosity of wooded life–

Engraving of Live Oak after Thomas Bewick’s Engraving of Oak Tree
–it is hardly surprising that the great naturalist’s rendition of the generous canopy of the oak became something of an icon for Margolin’s own guide to the Bay Area, East Bay Out, the unknown “outback” beyond the built up area of the Bay, a sort of forager’s guide to the riches of wilderness akin to Bewick’s own investigations of Northumbria–

Thomas Bewick, Engraving of Oak Tree Dwarfing the Nearby Town
The oak trees that Bewick became famous for engraving–as birds; inhabitants of wooded lands–intentionally shift our focus of attention as readers of his books from the towns they lived in to the surrounding natural world. The images of the woodsmen who were more engaged in nature were Romantic icons, but, as a modern-day Thoreau, focussed on the natural world in place of the built world, less concerned with human engineering or artifice than the importance of attending to the surrounding natural world in Northumberland countryside that he most often drew, calling attention to its oaks, birds, and outdoors to offer a unique angle on the industrializing landscape.
If lying off of the beaten road, and outside built environments, showing other forms of life far from the city, foregrounding on details of the landscape the cleric William Gilpin had focussed attention, akin to moments of rural repast, drinking waters of fountains and waterfalls from a traveler’s leather hat.

Thomas Bewick, Tail-Piece of History of British Birds (1821)
There was a Thoreauvian sense of transcendence of the local that animated Margolin’s attention to the environment, of which the oak might stand as a transcendent icon. Although oak moths have recently arrived in the richly brachiated canopy of the large coast live oaks in UC Berkeley, as they regularly do, feasting o foliage of the Quercus agrifolia for multiple recent years–2019, 2020, before again 2025–and prematurely cause grey and brown litter of leaves to fall in heaps, live oaks endure the regular pillaging of leaves, returning to their familiar evergreen in a manner of weeks, as they regenerate buds, leafing out once again in a matter of months. suggesting the huge vitality of trees that seem sick. The rapid recovery that the coastal live oak makes regularly from the onslaught of voracious caterpillars as the e California oak moth strip the trees of their expansive verdant canopies without impact on the trees’ long-term health, as within three months they leaf out, regaining health almost suggestive of a rebirth by deep reserves of energy–making it unsurprising Malcolm adopted the distinctive tree as an emblem for much of his work. The brachiation of that oak branch recalled the eighteenth century aesthetic renderings of Reverend William Gilpin, one of the earliest coiners of picturesque “landscape,” with a scientific attention to detail, attening to natural forms as if revealed truths–admiring that “peculiar kind of beauty, which is agreeable in a picture” as able to provoke a discerning interest in the wilderness as providing esthetic forms–
The branches of the oak were an aesthetic opening of attention to the country–and provided Gilpin with a basis to ask his viewers, similarly, to adopt a new attitude to expanding cities, guiding their eye past those branches to the human space in the backgrounds of his paintings, cannily situated far behind those gnarly oak branches that frame historic ruins, far more worthy of attention.
The live oaks around Berkeley were part of the animate landscape that endured across time in the regional parks today whose green leaves regularly return even after their branches are stripped bare, taking part in an ecosystem they almost miraculously seem to refuse to leave. The brachiation of the oaks had been something of a pillar of natural history from the late eighteenth century, as naturalists as Thomas Bewick called attention to the brachiation of oaks within the complexity of natures worthy of marvel–an ancillary art to Romantic poetry, and William Wordsworth even vowed “that [if] the genius of Bewick were mine / And the skill which he learn’d on the banks of the Tyne / Then the Muses might deal with me just as they chose / For I’d take my last leave both of verse and prose.“
Thomas Bewick
Malcolm was perhaps less willing to wear only one hat as a guide to the beauties of the unbuilt regions of the Bay Area, but more eager to play the Pied Piper to a generation in the outdoors.
2. The towering coastal live oaks in Berkeley inspire awe in their brachiated canopies,–maybe an awe Malcolm picked up, of going native in the arranged marriage between himself and Berkeley. The arranged marriage to the Bay Area may have arisen out of convenience and necessity but developed into one of mutual admiration and respect was deeply nourishing and profitable to many, born out of deep sensitivity to place and to forest grounds he encountered in the East Bay. The rich guide that he provided to the “outer” East Bay became almost an ecological resource of its own right, a prompt to preserve its wetlands and restore its parks, to act as a custodian of open space and forested hills, even in the fear of fires that has come to grip the region in later years.
It led to a readiness to question the authority of the modern map–to see the “East Bay Out” in other words–and relish the absence of all anthropogenic presence in the first maps of a seemingly pristine Plane de Puerto de Sn. Francisco” (1776) of a fortuitous date indeed by José de Cañizares–stored by the Bancroft Library, the very year that Americans declared independence from England,–that offer a caring attention to the estuary and tidal marshals of the region, and its bay waters:

José de Cañizares, “Plano de Puerto de Sn. Francisco,” 1776
–long before, Malcolm would be the first to tell you with a large knowing smile of taking real satisfaction in an incontestable fact, Americans had arrived in San Francisco. Those drought dedicuous live oaks were indeed among the plants that native Bay Miwok and Oholone people had increased in their biodiversity in the canyon woodlands, offering year-round specialties as acorn soup, leaving a lasting imprint in the range of oaks, each tree able to provide up to 10,000 acorns and offering rich habitat for animals who would bury many of the acorns stored underground.
The trees offer a rich and often drought resistant canopy for birds across much of the state, that allowed the Coastal Live Oak a corner species for coastal ecosystems up to eighty feet tall, their dense green foliage often improving the health of nearby plants year-round, in a more recent map. I think of Malcolm as able to toggle between both maps, but as realizing the need to allow multiple ties between art and cartography, and recognize the poverty of relying on data-driven maps–an implicit point to which this section of this post will return in hopes to make his case. For indeed Malcolm, as much as anyone, was crucial in redefining how “we” see the East Bay, and the identity of the East Bay as a region over time–from the time of first contact, when a group of starving white European colonizers in rags arrived on the coast of what would be Alta California, and gave it its name as a region by 1804. Malcolm was interested in peeling back that map from local informants who might help tell the tale of how it existed earlier, a real “historian” of historical anthropologists.

Population of Coastal Oaks in coastal California/National Institute of Statistics and Geography
Perhaps from when Malcolm made a decisive stand of resisting wearing the uniform of a parks ranger–a moment I have long imagined was a deep-seated conviction based on the deep sense of kinship he felt to the stewardship and identification with the land–Malcom was listening to local signs of evidence of the Bay Area lands he loved so well, and his attentiveness to the bonds of local inhabitants to the lands, as much as the shores, in no small part led to a new awareness of the local indigenous settlement of the region, and the poverty of failing to appreciate indigenous inhabitants of the region as custodians of the lands he knew so well, whose lives are impossible to separate from it. The sacred nature of relation to the land that was fed by some thirty creeks, filled with freshwater fish, animals, and many thousand species of birds, who Malcolm imaged might fill the sky so densely to block out the sun, suggested a powerful narrative of the loss of colonization and the absence of stewardship he felt today, before which a better map of the region provided a deeply therapeutic and indeed restorative function, inseparable from attention to those lands.

Indigenous Tribes and Native Peoples of the East Bay/image courtesy Sogorea Te’ Land Trust
The traditional names of the lands he was so committed to exploring and orienting others was inseparable from the map, but had been forgotten and left off of it–and one of the last final efforts of Malcolm sought to mobilize, where I got to know him better, was the ambitious project of remapping the entire state of California in ways to make the forgotten indigenous presence more centrally legible. Malcolm’s urgent message is of course increasingly pressing today, and continues, and the importance of the deep relation to the fragile topography that of a web of rivers that the Seogorea Te’ map above so lovingly details by light shades of blue and green, in place of cities, urban settlements, or property lines.
Encouraged by the fertile grounds of increased awareness of the needs for ecological stewardship of the land of an early environmental movement, from the Save the Bay campaign already founded in January, 1961, and in the Bay Area fertilized by Wendell Berry, and Gary Snyder, and nourished by the small non-profit presses–whose rights to the work of Berry and Snyder sustained them by digital sales alone. Snyder, who had studied anthropology and folklore by the transcribed oral tradition of Haida storytellers at Reed University, glossed glossed the oral literature as the creation of healthy art of mythic narrative vibrant with keys to the forgotten sustainable cultures of North America. Already possessing a poetic ear, Snyder read the transcription and careful translation of what ethnographers presented as a local Haida informant as a vital resource of a vision quest in an era we had lost a sense of orientation to animal spirits or birds, examining the “dimensions” of the myth as a needed resource, perceiving the animism of its telling as a living artifact and meaningful performance of culture. Did his reading of Haida myth provide a direction in which Malcolm would work? The early works of what are now environmental classics would certainly pay dividends for the independent presses. (When Margolin retired after Heyday press’s fortieth anniversary, it was robust enough to expand to Los Angeles, and be a fixture in the region’s as well as the nation’s literary landscape; renewed interest in new editions of Snyder and Berry’s works helped expand it expand catalogues to popular works, updating the classic corpus of independent Bay Area presses.)
Did the regional parks offer an alternative text by which Malcolm was eager to map the open areas that still existed, not yet encroached by development, as sites of continued wonderment? They certainly stood as evidence of a former wilderness, encroached by the boom of expansion of so many of the cities that make up the Bay Area, a boom that began in the 1950s, evident in this map that imagines the tree rings of local population centers around the Bay, many of which emerged only in 1960, that provide one of the most unique forms of growth of an urban agglomeration in an area where wilderness was precious: if the metaphor o f the tree ring offers a nice cartographic symbology to imagine the Bay Area as a site of uneven, but rapid growth, 1960-2010, in ways that overlap with Margolin’s heyday in the region he provided so much of an alternative counter-cartography, the expansion of cities like Concord, Fremont, Antioch, and San Jose that now form a dense inner core of the Bay Area that might be called the inner ring of commuting, was an incursion into open lands greenspace, where the parks provided evidence of the rich biodiversity and offered more than a refuge–but an alternative way of imagining its future.

Growth of Population in Urban Cities and Towns in the Periphery of the Bay Area, 1960-2010
One might grasp the force of promoting the regional parks as a critically important heritage of surviving biodiversity of a region that was compromised already by farming, wood harvesting, and the damming of some of the most nourishing rivers of the coastal ocean, including the San Pablo to create a large reservoir for drinking water by 1919, that compromised the rich ecosystem where early settlers describe catching salmon with pitchforks in its waters, and Malcolm would have sought the local informants for evidence of the rich topography he felt still survived, but had been preserved by a relative miracle of land conservation and preservation as conservation and preservation efforts were blooming in their own metaphor ecosystem around the East Bay.
This was the destination of the readers of the books Malcolm was beginning to set out producing, at the same time as conservationists were promoting illustrated books, often with photographs, of the natural treasures of the region, as the Sierra Club Brower and founded and directed, 1952 – 1969), became a leading environmental membership organization whose aggressive publishing programs offered wilderness testimony in large format books foregrounding high-quality nature photographs, setting a model for bearing witness of the changing landscape and ecological risks that we faced, as he promoted a range of new parklands as repositories of memory,–from public organizing of opposition to the damming Grand Canyon and Dinosaur National Monument, to national parks not only on the seashores, as Point Reyes, but including the North Cascades, and the Redwoods, and protecting millions of acres of public lands. The media advocacy Brower pioneered in newspapers and magazines so deftly dramatically communicated conservation to new audiences, and crated a market for practices of conservation that Malcolm added his unique sense wonder.
Before the Bay Bridge was imagined, Brower got behind the project proposed by civic engineer John Reber to dam not only the San Pablo River but to built a San Pablo Bay at the dammed San Pablo Reservoir, a project already so devastating to the ecosystem of regional grasslands. For Reber had in the late 1940s proposed a way to meet the postwar population growth in the region by adding a huge amount of landfill to the bay, ending its wetlands, and engineering two freshwater lakes that would divide the “Bay” into four zones, preserving but a newly dredged deepwater port in Berkeley. The almost forgotten plansto foreclose Bay waters and tidal shores showed little familiarity with the region–it might easily have been fully liquified by seismic activity!–but provided a model of the distance of local engineers of urban development and State Water Projects Authority from the custodial role indigenous had long played in maintaining the bay as a region of vital habitat, both of freshwater fish, sea grasses, and shorebirds–and the proposal for a massive construction project that projected the San Pablo Dam as a basis for the bay was only narrowly defeated due to the local activism–only after the over-eager U.S. Corps of Engineers builds a 1.5 acre hydraulic model of the Bay to test it, although the vision of barriers to bay waters stretching from Richmond to Treasure Island, essential to shipping channels, never survived the modeling of a bay comprised of landfill–a massive engineering project of terraforming before that world was used, luckily never realized.
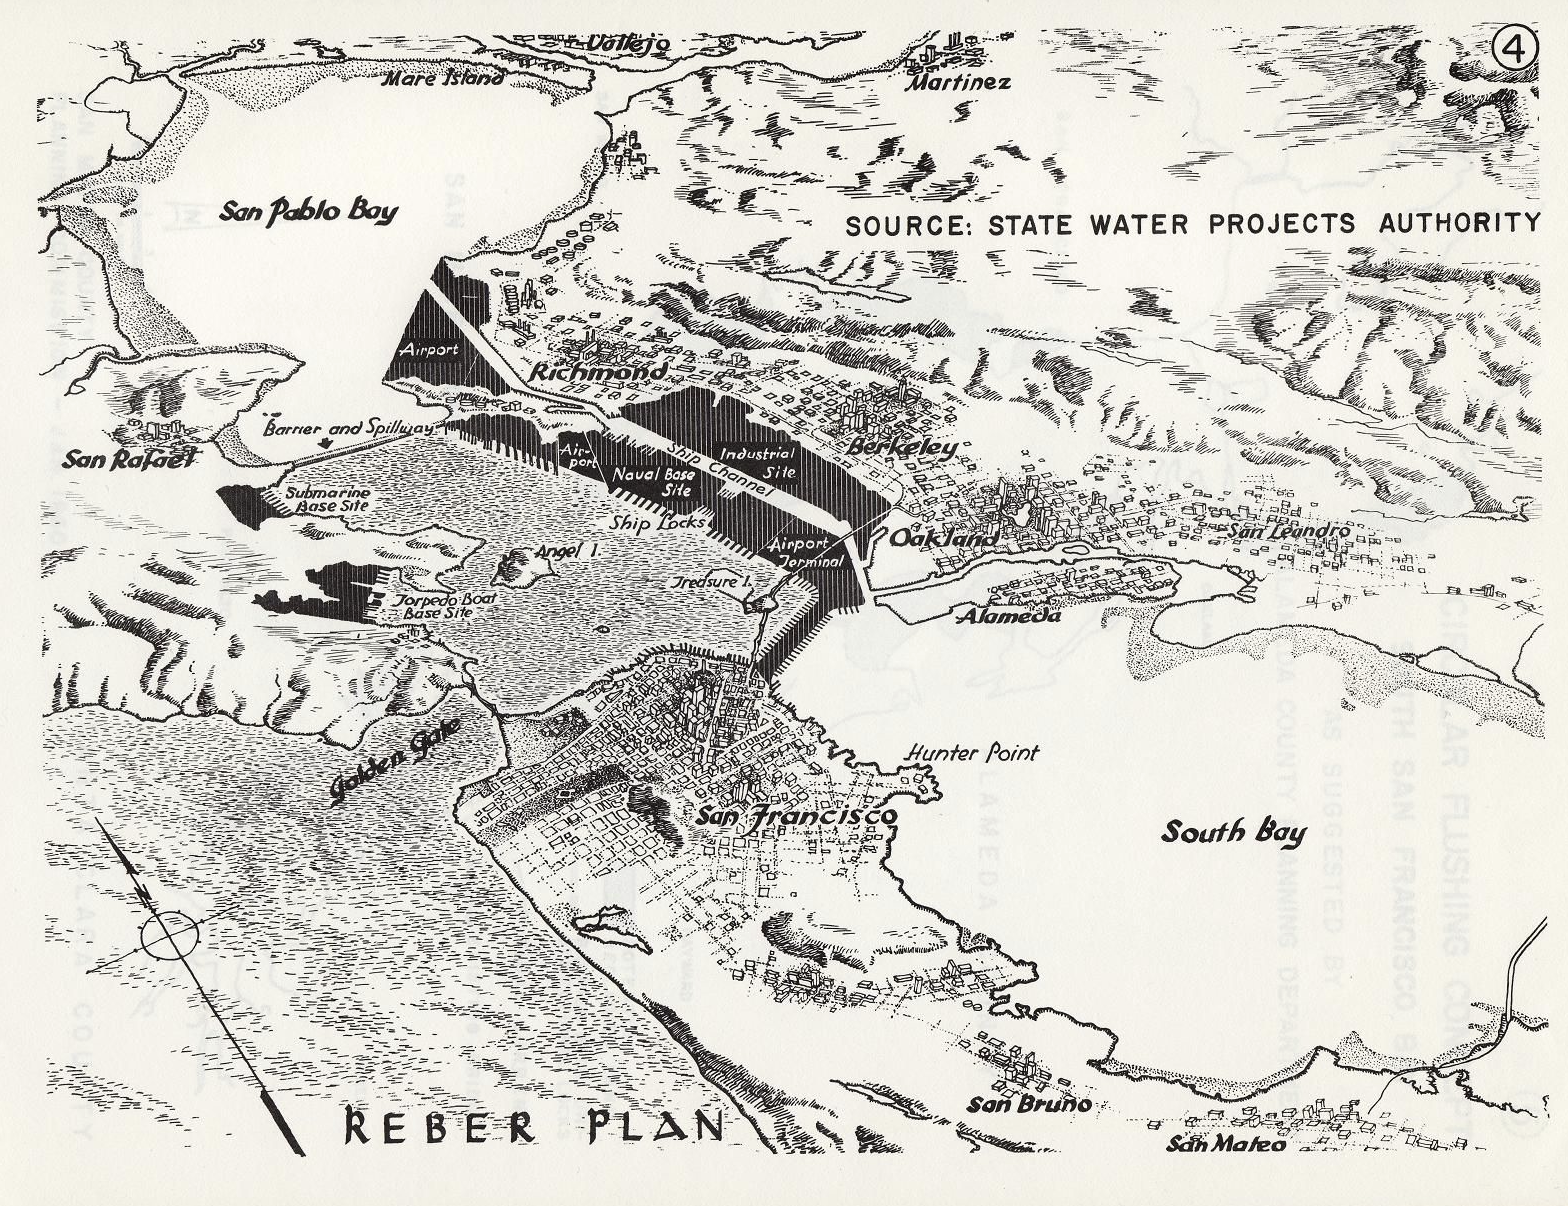
Detail of Reber Plan (1949) to filled in for a deepwater port, airports, and military bases (1949)

The ground for objecting to such plans for the threat of transforming the bay’s wetlands and natural habitat for economic markets and shipping lanes was rife–even if the liquefaction of the proposed landfill additions showed the accredited engineer’s almost basic unfamiliarity with the dangerous level of seismic activity that would be so prohibitive in any massive project of contracting the bay’s open waters.
The evidence of the inhabitation of the bay waters, increasingly threatened by development schemes, seemed to curtail any of the collective wonderment Malcolm dedicated so much of his life to cultivate and preserve. This included the expansive Bay Trail itself, replacing the old landfill to restore the shoreline to a space of vital habitat and healthy salt marshes, that might erase some of the imprint of rapid anthropogenic change, returning wildlife to the East Bay, and perhaps allowing the mists of the shoreline to be seen once again, if you squinted your eyes at the right time.
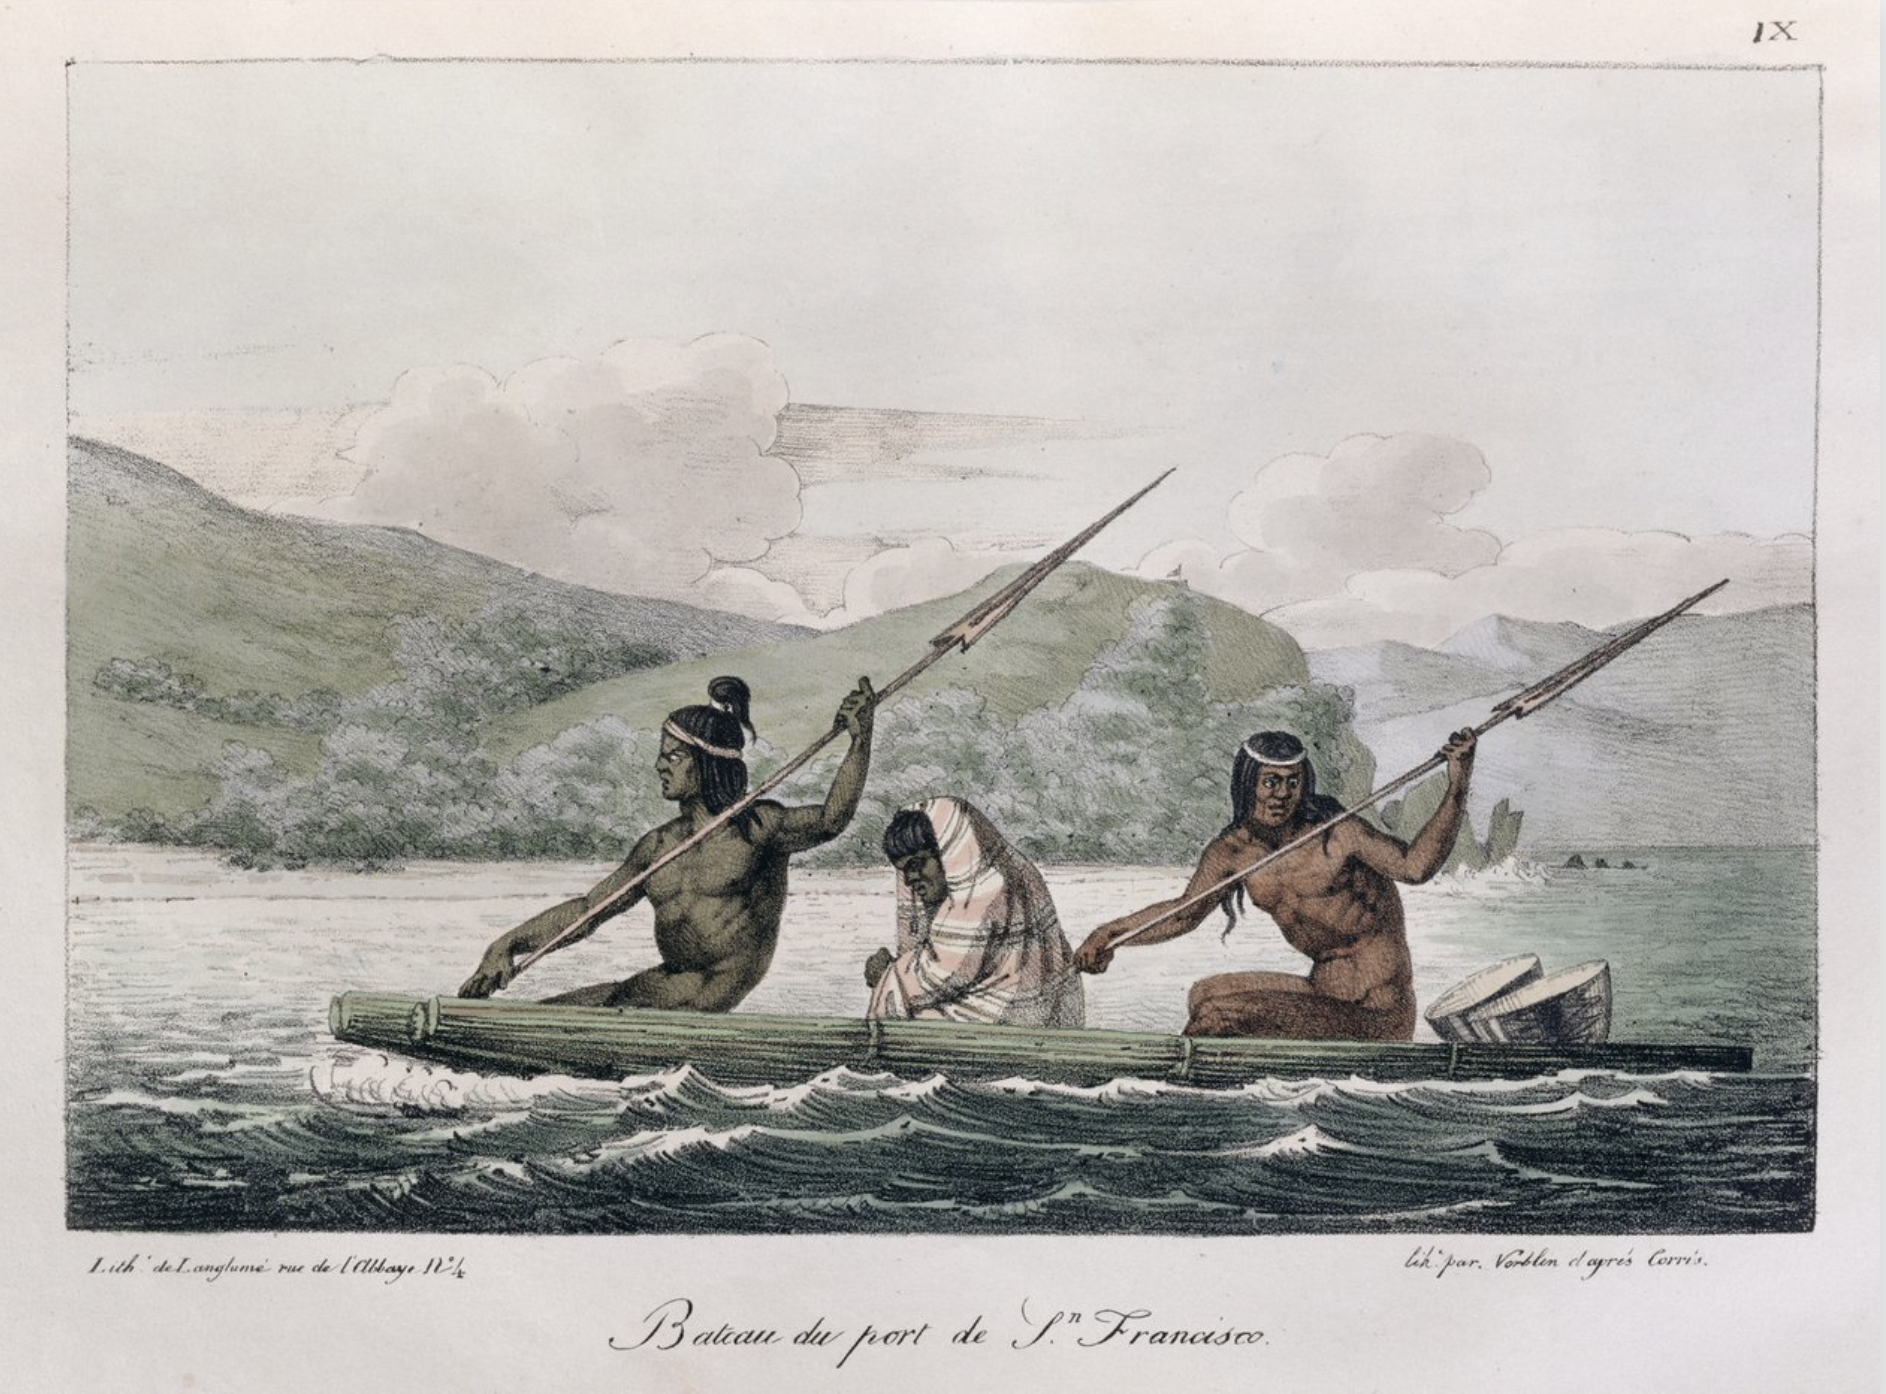
Louis Choris, Bateau de Port de San Francisco, c. 1815
The color lithograph of a ship paddled by indigenous residents of the Bay Area included in Voyage Picturesque Autour de Monde (1822) eroticized the west, as well as California, to be sure. The sense of reintroducing residents of the East Bay to the natural areas around them was more decidedly local for Malcolm Margolin. But as parks come under assault, and the sense of stewardship he celebrated by native inhabitants is being so openly and flagrantly disrespected by government, it seems important to remember how even in the face of an onslaught we have rarely seen in memory, Malcolm refused to be pessimistic, and saw himself as having had no reason to be so.
The awe before nature that inspired Malcolm, and that he always seemed to seek to inspire, urged we consider the enrichment of place that the Bay seemed to offer–its habitat must have provided a sense of encouragement and a sense of commitment he channeled from the descendants of native inhabitants. For Malcolm unearthed collective memories that he sensed in their stories and descriptions of the engagement with elements rathe than automobiles and automotive transit, offering a therapeutic alternative geography of the bay–and finding a real pharmakon of a new idea of space that needn’t be dominated by local real estate or what I’ve called the confines of automotive space amidst the increasingly congested stretches of commute that defines the Bay.
He actively explored and expanded the narrowing contours of a Bay Area increasingly defined and denaturalized as an expansive area of commenting, whose interconnections of traffic and highways. The automotive landscape of daily commutes have indeed offered a world of less and less connectedness–in contrast to the indigenous he reminded took themselves quite seriously as custodians of the land, without needing to see themselves as property owners. And as the construction of more and more paved space in the zbay Area fail to promise any sense of greater custody or responsibility for the land, our sense of the Bay has decidedly shrunk, as a recent exhibit in the Exploratorium’s Bay Observatory that asked visitors to map the San Francisco Bay has shown
.
–or the pathways derived from the locations of over 10,000 geotagged social media posts that suggest the well-worn routes of automotive travel, compiled by Erica Fisher, that neglect large areas of the the East Bay, on roads that seem to fade into a white mapped unknown space.

Malcolm was energized from compelling others to explore and learn to re-recognize the riches of the region, and the state. Attendees of hisfinal projects were invigorated by his vision–or were encouraged and somehow empowered to feel the same way. His hopes for continuing celebrating an annual Festival of the Birds in Berkeley during the Trump era, ideated as engaging the public by a two-day extravaganza cum party featuring films, live performance, music, and art, in Malcolm’s style, as well as poetry readings and art-making sessions, and craft fairs, pointed to birds as signs of hope, and witnesses of the region. The festival celebrated the new habitat that the bayshore had indeed become, against all odds, a site of friendly avian habitat and attracted increased pelican, herons, egrets, geese, ducks, owls, and shorebirds to live in restored wetlands, as a continued sign of hope, if non-human signs, that Bay Area residents would do well to attend to. if birds provided a common language, outside of legal claims to ownership, to reorient ourselves to the land that can be seen as something like a living resource, the early decision to draft an “un-authoritative guide” to camping, hiking, and exploring that led to the new sense of authorship that Malcolm embodied, and the intense attention to local nature that midwifed the magazine Bay Nature, that continues to offer a new sense of orientation to better understand the natural landscapesf the Bay.

At the Festival of the Birds, I bought and picked up several hand-made bird key-rings made from colored beads. They were tokens of the needed uplift of hope that those small festivals provided, entirely animated by Malcolm’s rolodex and his animated presence, as a bobblehead in their midst, as if in a victory lap in the David Brower Center, but were also a remembrance of the power of birds to redefine our sense of place. If talking to animals was an indigenous trait Malcolm so celebrated, and were long tied to indigenous belief in animals’ souls, and the ability of speaking to animals long attributed indigenous by settlers not as possessing special talents to communicate with native animals, but to from whom they were seen as but a small step removed. The rolodex that was invented by Arnold Neustadter and Dutch designer Hildaur Nelson of Brooklyn NY in 1958 was initially marketed as a way to organize one’s professional and private life by a rotating card file became mastered as a medium by Malcolm as an active way he participated in public life, but joined private and public. The rolodex was far more than an archive, wielding it as a matchmaker moving in hyperspace, linking people, events, places and museums to animate ideas for a larger cause: it was almost able to keep up with the rapidity with which wheels moved in his mind. Malcolm arrived in Berkeley a decade after the Rolodex, in 1967, the Summer of Love, but used the invention that was Neustadter’s platform to vault out his father’s box-making business as a platform to enter the vibrant environmental and ecological community of a region associated with tech and Silicon Valley, that left a deep imprint on the Bay Area–as the Rolodex was able to survive the advent of computers, iPhones, and virtual planners. (It also offered an orientational tool for wandering Jews.)
This is important in the danger of affirming the parks and parklands, perhaps the first area that Malcolm got to know and worked in the East Bay, even if he acknowledged far more awe in, say, Yosemite than Tilden Regional Parks, which he knew so well. Despite growing visitors to national parks, and also the local parks where Malcolm Margolin got his start in the East Bay, their funding is for the first time increasingly at risk. The over eighty-five million acres that the Park Services manage attracted a record 331 million visitors last year, and park visitors provided benefitted local communities a $55.6 billion as well as supporting over 400,000 jobs, but the Trump administration has early cut a thousand park service workers–while predictably charging foreign visitors, as if a tariff on tourism, extra surcharges “to keep the parks beautiful”–but more national monuments and parklands stand to be sacrificed, as the President seeks to diminish national monuments far beyond the already striking diminution in size during his first term as U.S. President. And these include, famously, many monuments of indigenous native history, in danger of development for economic development and mineral extraction.

Trump distinguished his first Presidency by reducing the number of national monuments for the first time since Dwight Eisenhower, and reducing Bears Ears by 80% of its total designated size, the shrinking of national monuments and opening of forested lands to logging, mining, and extraction to increase America’s economic productivity or increase fire safety stands to be decreed without public input or review, and his Dept. of Justice Dept. has unprecedentedly acknowledged the President’s power to decertify or shrink national monuments judged “no longer are deserving . . . protections.” The shift in mapping protected national monuments and national parklands would open up the most sensitive lands to mineral prospecting, mining, and drilling; Doug Burghum tasked the Dept. of Interior to “review and, as appropriate, revise all withdrawn public lands” that might be opened them to potentially auctioning lands for oil and gas drilling and mining.

National Monuments at Risk of Opening to Corporations’ Gas and Oil Drilling or Mineral Extraction
Coming at the same time as cuts to park stewardship and preservation, the depressing dangers of a loss of access to park lands made me feel better by visiting the paths of the Claremont Canyon after hearing of Malcolm’s passing, and, in a visit to Yosemite, remember his vigorous faith in open land.
Continue reading


