The detection of sound provides a primary registers by which we are able to judge spatial relations and experience space. But sensitivity to auditory sensations may be increasingly compromised to orient ourselves across much of the country; the epidemic of the extinction of “quite places” in the modern world has created a deep alienation form sounds of place, even as we can continue to map place, and a dramatic contraction of auditory horizons by which we perceive the world. Increasingly impacted by a barrage of anthropogenic sounds, the alienation that is increasingly common from natural ecosystems of sound, and predominance of sound pollution, has led acoustic ecologist Gordon Hempton to devote increasing energies to making sound recordings of areas of natural sound ecologies of the Northwest in Washington State’s Olympic peninsula. The region, one of the few “deep blue” areas in recent mappings of increasingly elevated sound-polluted areas indelibly shape the acoustic and indeed neurological experience of place across the nation. Registering the increasing presence of anthropogenic noice along thresholds of decibel levels creates an image of the dramatic contraction of sound horizons that Hempton is so interested in preserving. The below map, created by computer algorithms, reveal a distribution that has rightly commanded increasing attention upon its release in no smart because of the recognizable mirror it lifts to our own world of a landscape–here, the soundscape is visibly rendered as a landscape that offers few spaces of blue in which to lose oneself–of the shrinking auditory horizons of most.
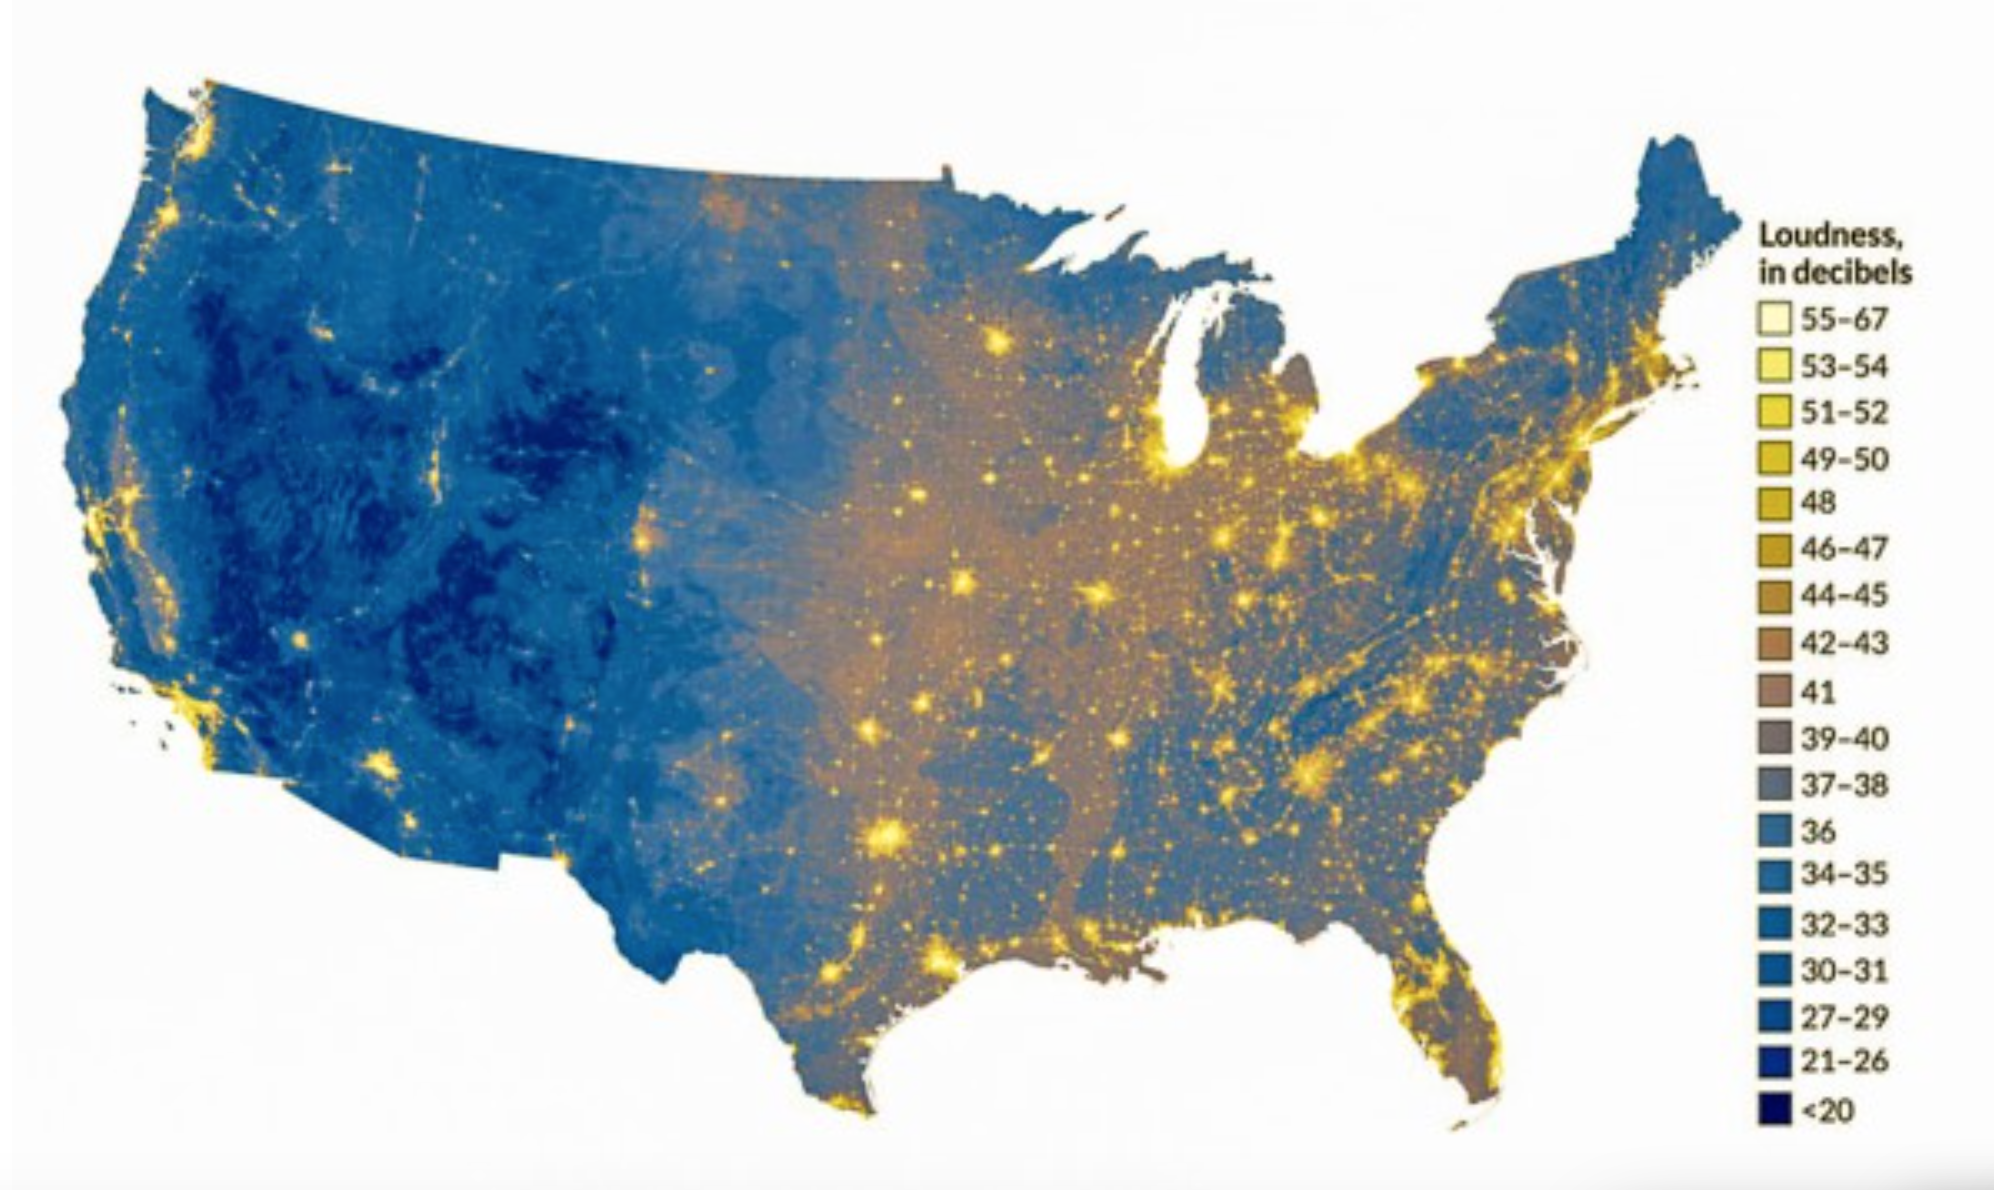
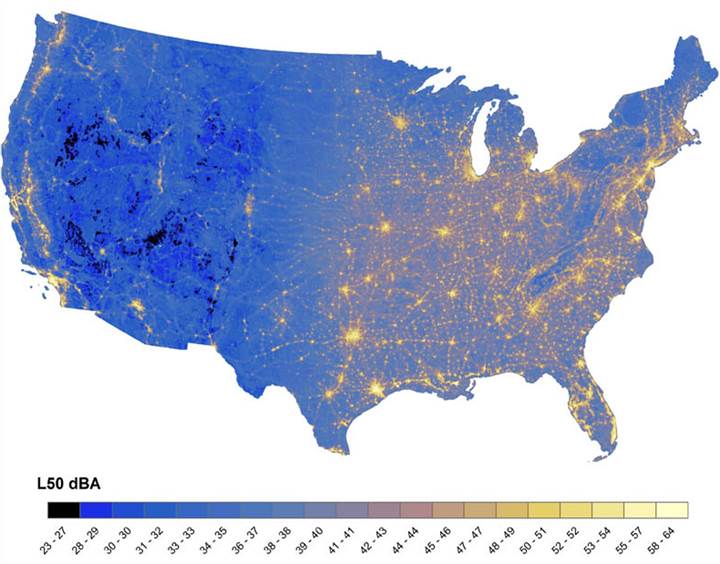
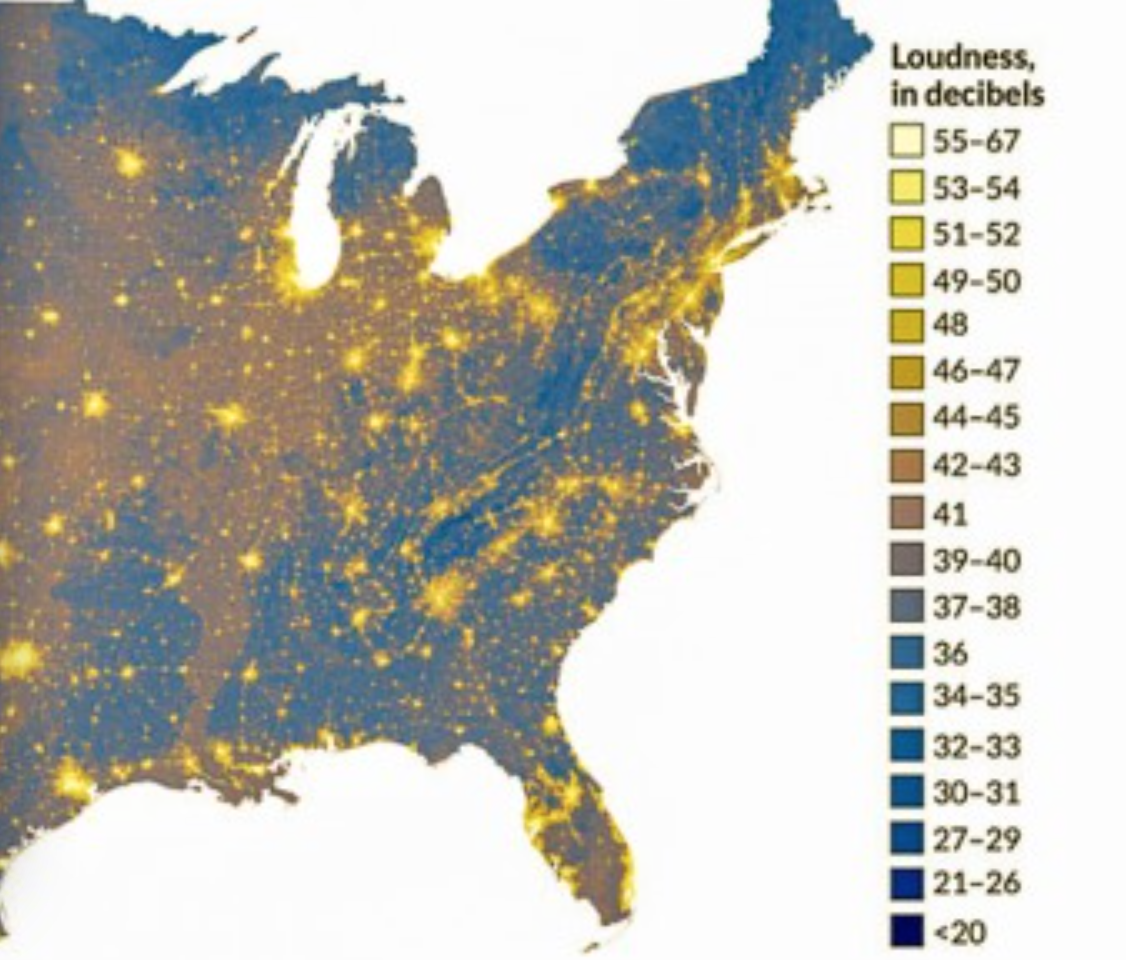
After synthesizing about 1.5 million hours of acoustical monitoring, the below representation of noise-levels across the nation’s roadways create a portrait of sounds likely to be heard on an average summer day presents an image of the extent of places where one can expect to encounter aural intrusions. The flyover view illustrates shifting decibel levels across the continuous forty-eight states, but most strikingly reveals the rare places marked by an absence of human-made sound. The almost inevitable infiltration of anthropogenic noises is only poised to grow further in coming years, standing to change our experience of place and how we inhabit the world.
The unprecedented registration of sound-levels mapped across the country and rendered by computer algorithms is a significant achievement, but a benchmark of human geography. The shifting hues of blues used to map the registration of sounds at above-average decibel levels reveal a significant diffusion of high levels of background sound across the nation–and suggests the radical changes our national soundscape has experienced in recent decades. For background noises have become an almost inescapable aspect of daily life. While registration of auditory differences in ambient sound across space have rarely been able to be charted with such precision, the resulting map shows a national both distinguished by far higher sound-levels than the past, and a diffusion of human-made sounds spreading from megacities to the rural hinterland, leaving diminishing differences between the two: the near-absence of lands removed from human-made sound across much of the land suggests a radical remaking of our auditory world, as loudness is no longer clearly localized. Rather than reflecting clear boundaries, the almost inescapable nature of noise-levels across much of the Eastern seaboard, midwest, and west coast lights expanses by a dim sulphuric glow, confining “wilderness”–if by that we mean by that a space where we can listen to hawks cry, hear water running in streams, rustling grasses, the conversation of rainwater with leaves, or insects’ buzz–to a small regions of deep blue that roughly match the largest national parks. Who’s to say that this is not a shift as significant as climate change?
The rising levels of human-generated background noise across the country may constitute a health risk, given established links between sound-levels and blood pressure; the near-ubiquity auditory interference also suggests a significant compromising of our sensitivities to the particularities of place that seems both particularly troubling and of historical note as a change in our lived environment and auditory atmosphere.
 ScienceNews
While reflecting human density, the map is not only a reflection of population centers–although it does map onto them–but of ambient noise. And it is even more revealing not of where noise is concentrated, than on where it is absent–those deep blue openings on the map.
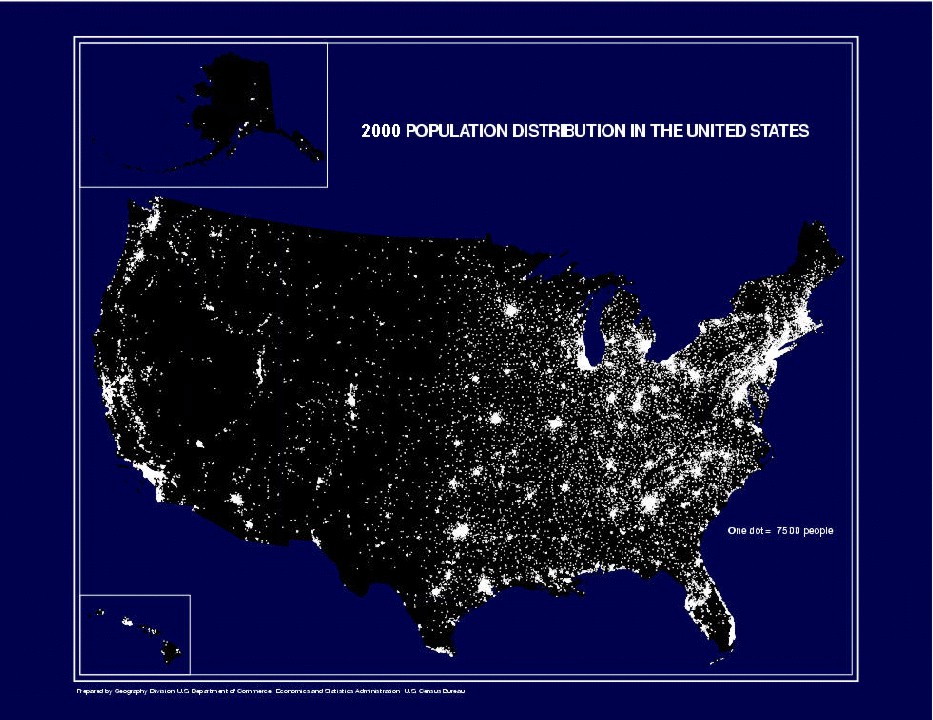 U.S. Census Map/Population Distribution, United States
The rapid expansion of anthropogenic noise has profoundly altered the national soundscape, and indeed made the protected aural environments that suggest the limited success of the management of sound a generation after the 1972 Noise Control Act set a standards of local and regional acoustical management. The acoustic data was processed by computerized algorithms to exclude local street traffic as well as variable air sounds of jets that predicts spatial differentials in the levels of unavoidable local background sound even without such outside intrusions. Human-made noise has not only outstripped population growth; the growth in rising ambient sounds has surpassed three decibel levels is perceptible in almost two thirds of the protected regions and National Parks–roughly mirroring that region of greater natural sounds, not accounting for sounds likely to be soon unleashed by the expansion of hydraulic fracking, pipeline construction, drones, and the expanding density of air travel.
The portrait of our decreasingly differentiated auditory environments raises the stakes for preserving secluded spaces that will undoubtedly compromise our own future sense of space. To be sure, the notion of a comprehensive acoustical monitoring of the entire continuous United States is not possible, and would require far more funds than the National Parks Services has at its disposal. But the picture that emerged of a shrinking space of silence–and a shrinking space of focussing on “natural” sounds, not generated by humans, is striking. Even as we receive increasing recommendations from ecotherapists urging us to act to remedy widespread affliction by nature deficit disorder by immersing ourselves in greater sensory engagement, and ecopsychologists note the health benefits of hearing leaves rustling or wind through trees, the map paints a picture of a future of radically reduced horizons for auditory engagement with unavoidable nature of anthropogenic noise. The illumination of up to half of the nation, if not two-thirds of its inhabited areas, by striking bursts of yellow suggest an encroaching inescapability of noise that may compromise our sense of space: with refuges to experience soundscapes under thirty decibels of loudness increasingly rare, ecotherapists may be conducting some seriously long distance guided trips. One’s eyes are drawn to those deep blue spaces of repose in select areas of the inner recesses of national parks, but one is simultaneously struck by their distance from the environment where one lives.
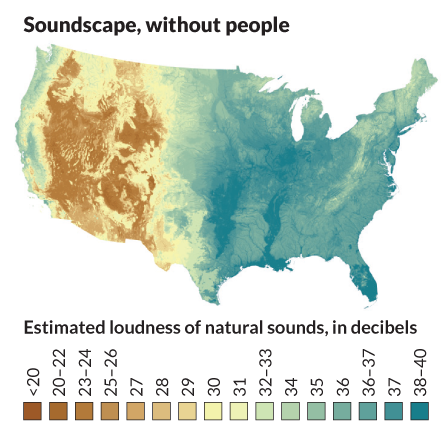
The imagined soundscape without the presence of humans–or filtering all anthropogenic sound–would reveal a national soundscape pronouncedly divided into relatively noisier eastern and significantly more silent western halves, reflecting the greater inhabitation of the half of the country east of the deserts: this seems almost an auditory Continental Divide. When Kurt Fristrup and Daniel Mennitt of Colorado State University of Fort Collins sought to map a landscape of differentials in “natural” sound across the country, they used it as a sort of base-map on which future data levels could be read: indeed, one can distinguish the deep green swirls of sounds of the Mississippi, silences of mountain ranges, and noisy coasts–but an expansive stretches of silence across most of the region west of the Continental Divide.
 National Park Services Natural Sounds and Night Skies
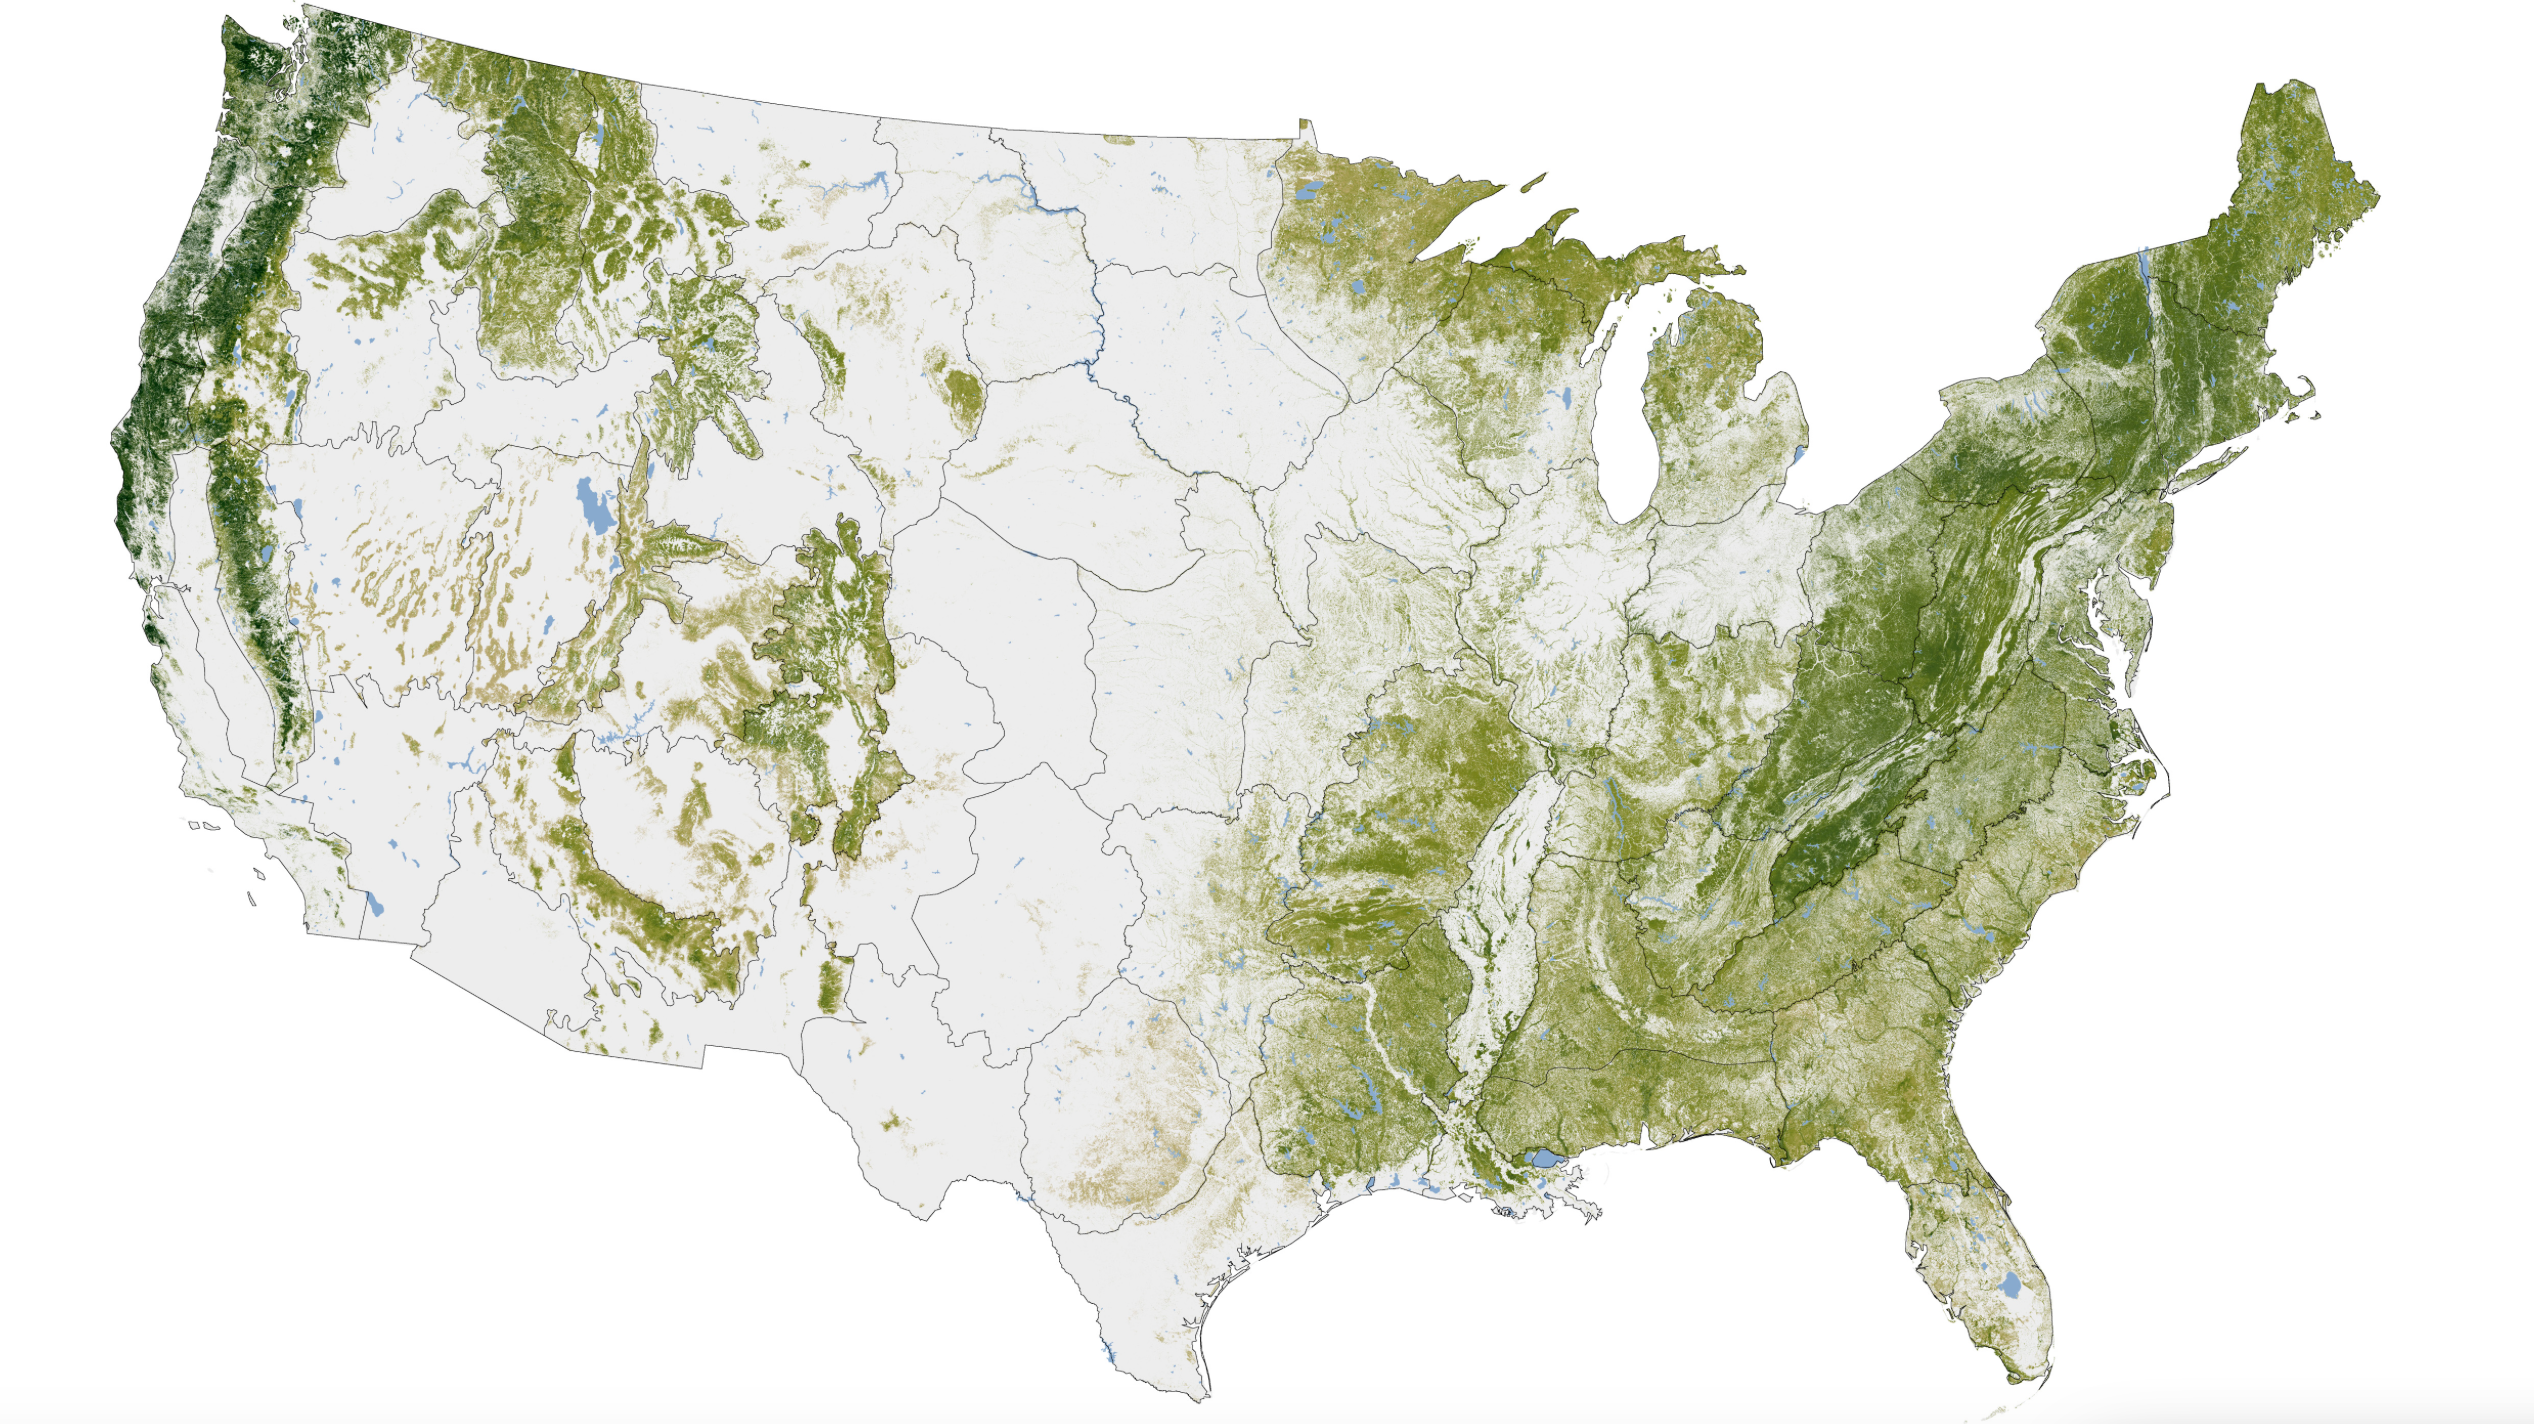
One can usefully compare it to the contacting regions of the forested United States, based on this 2012 remotely sensed map of the woody biomass of the continuous United States, released by NASA’s Earth Observatory and created by computer modeling, that reveals the growing expanse of those regions permeable to extensive infiltration by sound.
NASA
One might compare it to horticulturalist and dendrologist C. S. Sargent’s 1884 comprehensive mapping of the density of US Forests, now digitized by David Rumsey, which presented the first detailed survey of the sort, to note the decline in tree-cover across the Great Plains and Mississippi, as well as the Great Lakes:
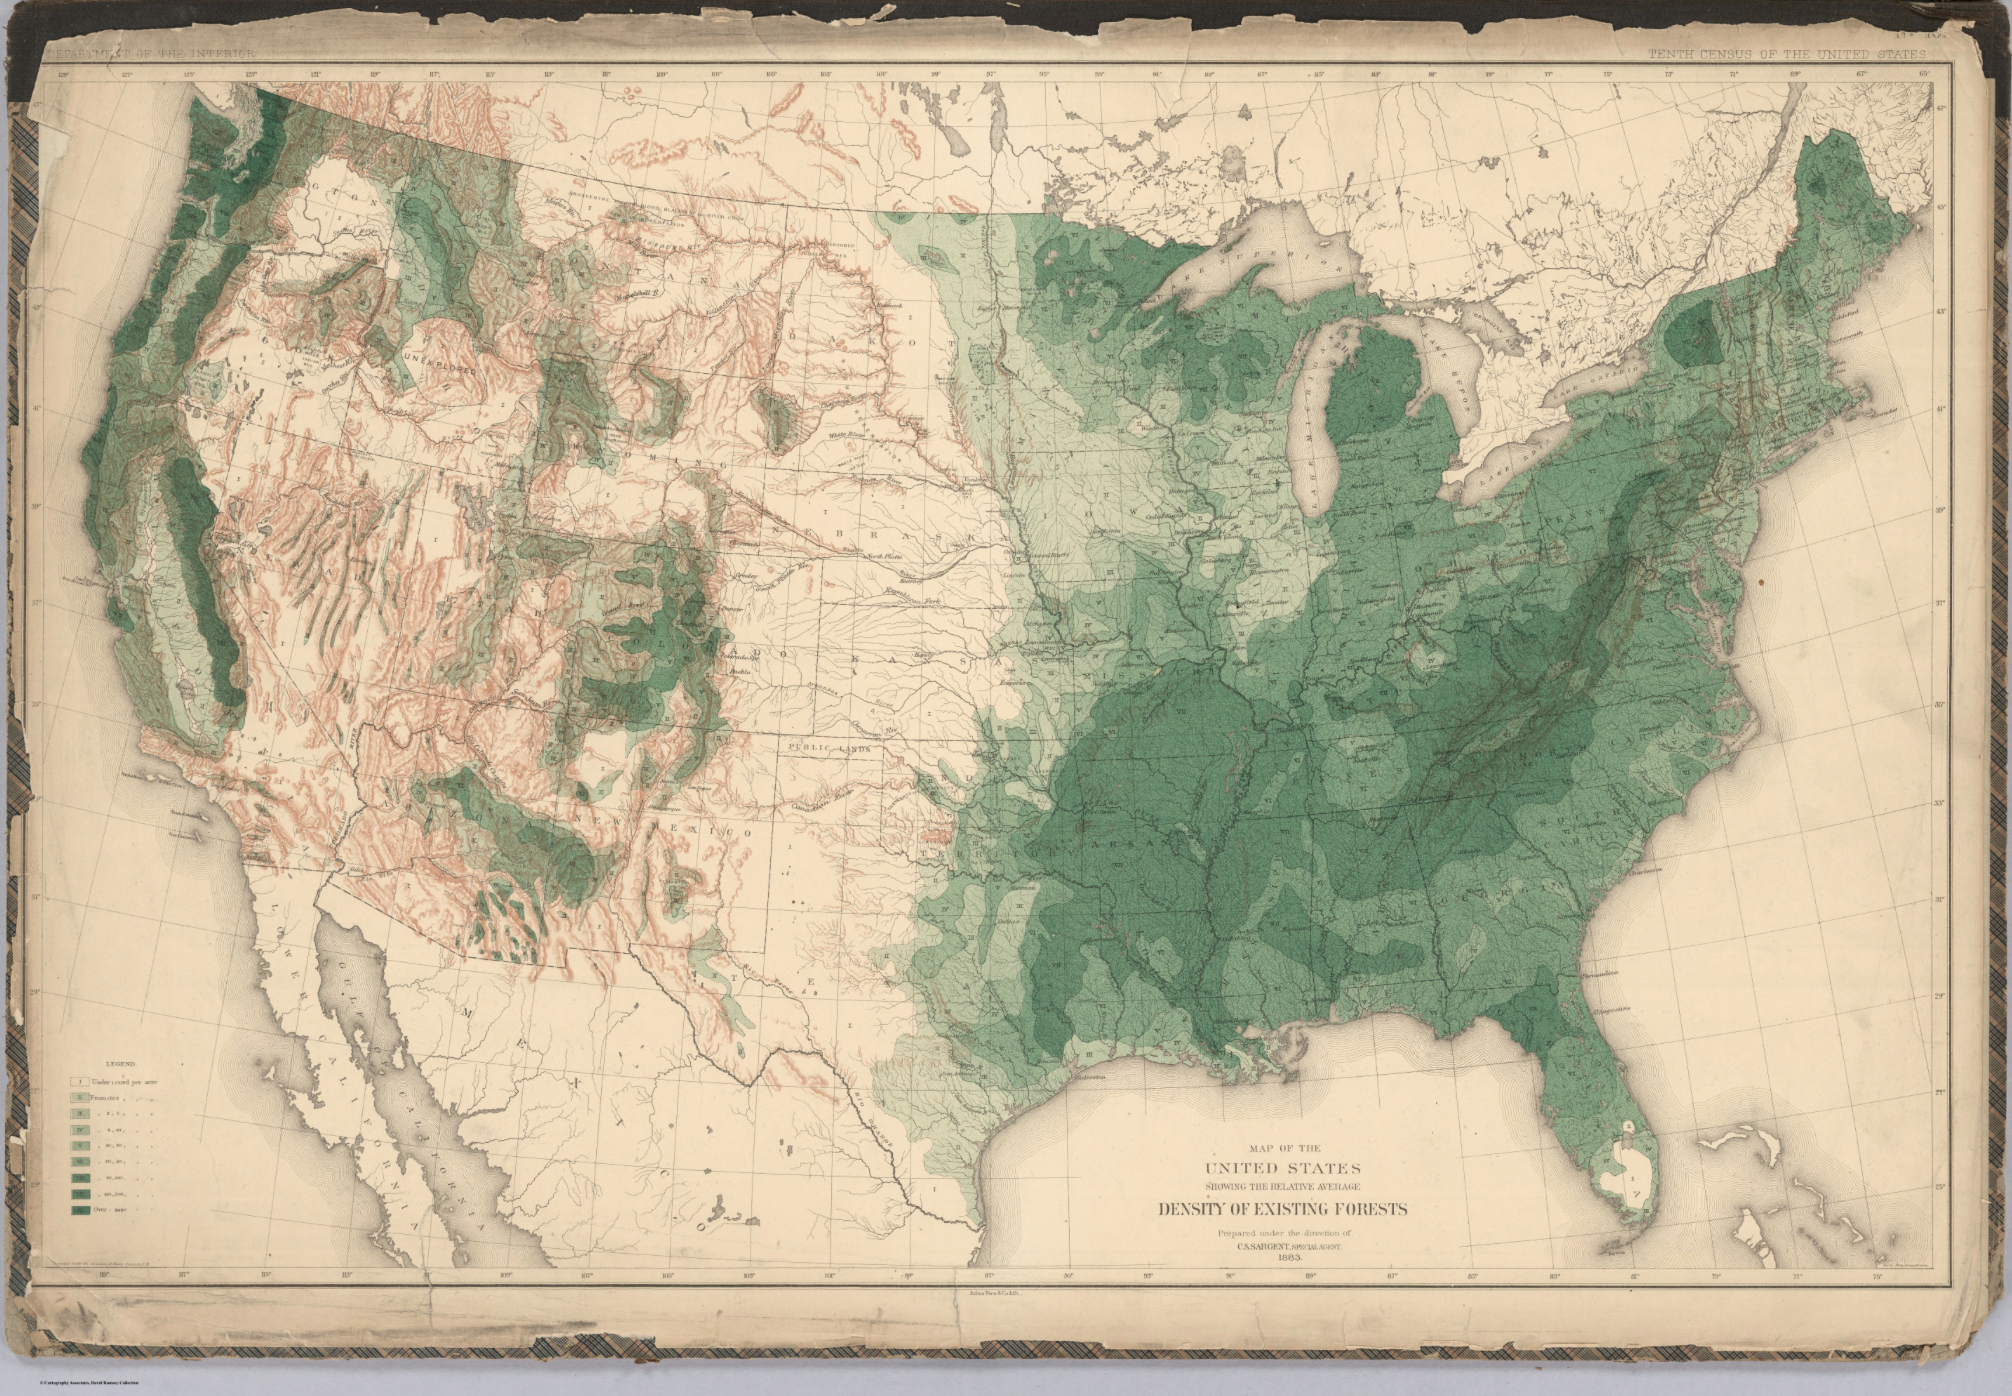
Wired; from Rumsey Collections
The map of “natural” sounds reveals the levels of under 40 decibels marks a threshold in the intrusion of an array of anthropogenic sounds, one that reflects the changes of how we now inhabit the continent, and how we perceive the inhabitation of space, that might be compared to Global Warming in its cascading effects of how sound spreads across its sonic space.
And in creating a synthesis of sound-levels across the nation, Frist has not only set something of a high watermark in the sound-drenched nature of our landscape. The marked change across the national soundscape that Fristrup has helped chart based on 1.5 million hours of acoustical monitoring reveals a shift in hearing that seems on the level of that described by visualizations of the alarming local rises in regional temperatures across the nation, which providing apparent evidence of an inevitable process of global warming: the maps below seems to suggest similarly ineluctible changes of the anthropocene at the nation’s edges that we have only begun to track, although the causation of such environmental impact to a release of greenhouse gasses is less clearly mapped in terms of causation, and human agency less readily determined than the registration of something that seems like climate change.
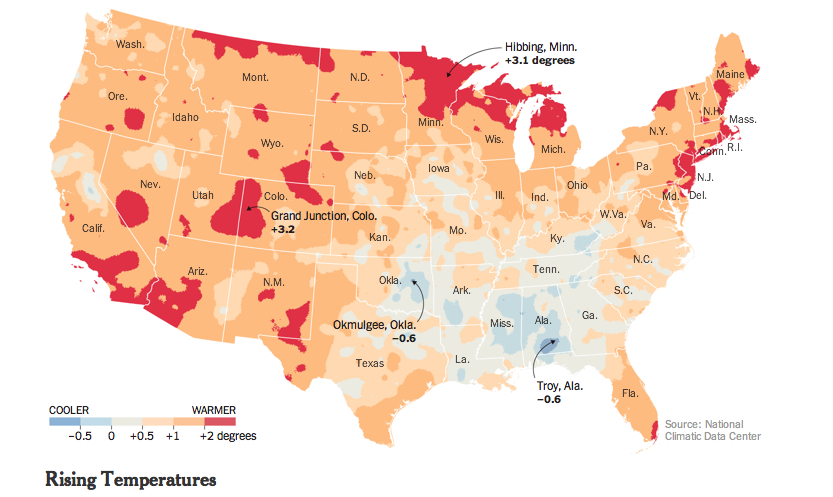 New York Times
Rather than consuming the edges of the country, as the above visualization of rising temperatures across the nation as evidence of impending global warming from the New York Times, noise encroaches on the country from the more populated areas more often located on its coasts and eastern shoreline. The region providing platforms to the world is not organized as a clear workspace or a set of clear property lines, but as corporate entities and logos, and where the bulk of the wealth produced has proved increasingly elusive for many of its residents. But the expansion across much of the nation’s soundscape by human generated sounds reveals what an analogous trend of man-driven change, if one that one can map with fine grain, and which impacts our perception of local experience in ways that seem more easy to measure and render at fine grain.
For the compromise of the sonic sensorium across much of the country suggests the degraded sonic environment we are transmitting to future generations. The map of the auditory landscape across the United States suggests the emergence of sizable and rapidly growing rifts on the amount of audible sound to which we are daily exposed that seem as prominent as a Continental Divide: radically different soundscapes in different parts of the country suggest a country increasingly plagued by noise–middle America or what was once known as the Midwest is distinguished by almost ubiquitous manmade background noise; intense acoustic shocks are rendered as bright corridors of noise run along Eastern seaboard of notably high loudness; only pockets of western parks, rendered as deep blue expanses in the interior, are distinguished by sound-levels of less than 20 decibels. The Acoustic Society of America used some 270,000 hours of measurements across 190 sites in the country’s National Parks in the contiguous United States to assess an initial picture of levels of ambient human noise that seem all but inescapable in the U.S. If the 1972 Noise Control Act was directed to strengthen legal protections against “unwanted or disturbing sound” to regulate noise pollution, sound-levels seem so widespread across the nation to be hard to distinguish how unwanted sounds adversely affects one’s quality of life as unwanted disturbances. Yet we now have a means to visualize the collective rises in ambient sound in ways that are truly as compelling as maps of global warming.
The change in our aural landscapes has gone largely unremarked, in part because the data is less easily available, and visualizations were long less able to be confidently rendered in such clear detail–or the amount of data not able to be clearly synthesized. Even at first seeing the map of sound levels in the nation released by workers at the National Parks Services in past weeks, it’s hard not to be drawn to these scattered refuges that lurk inside the map, as we shun the bursting supernovas of aggressively bright yellow whose streaks across the overstimulated sonic landscape where most of us live. The brightness of areas in which greater levels of sound were sensed seem to push us to the relatively few remaining quiescent places in the continent: it is not that they remind us of just how fully the sounds of motorized vehicles have come to penetrate most of our auditory worlds most of the time, but that they seem so ever-present and so visually loud, even when the levels of sound seem to fade miasmatically into the midwest, but reflect the growing population centers across the country that undoubtedly generate the greatest noise. The map creates a compelling picture about how we can interpret the current distribution of populations as filling the nation’s space.
\
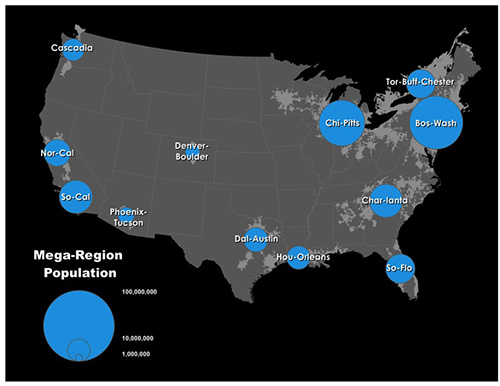 Martin Prosperity
Much of the attention that the map has received respond to just how rarely sound-levels have been so closely integrated–or so clearly shown to overlap–with the mapping of an environmental space, or so compellingly integrated within an understanding of environmental change.
The question of registering an atlas of urban sounds have most often responded to less to subjective or individual perception than public policy issues that surround very specific local levels sonic pollution in urban environments from San Francisco to Oslo, based on visualizing noise levels across urban streets through GIS-based simulations that synthesize variations in decibel levels over time–and reflect a desire to control urban noise that even predate the Industrial Revolution, and which, R. Murray Shafer has found, there is evidence in Bern back in 1628, but which computerized maps provide a basis to visualize the results of such acoustical monitoring today.
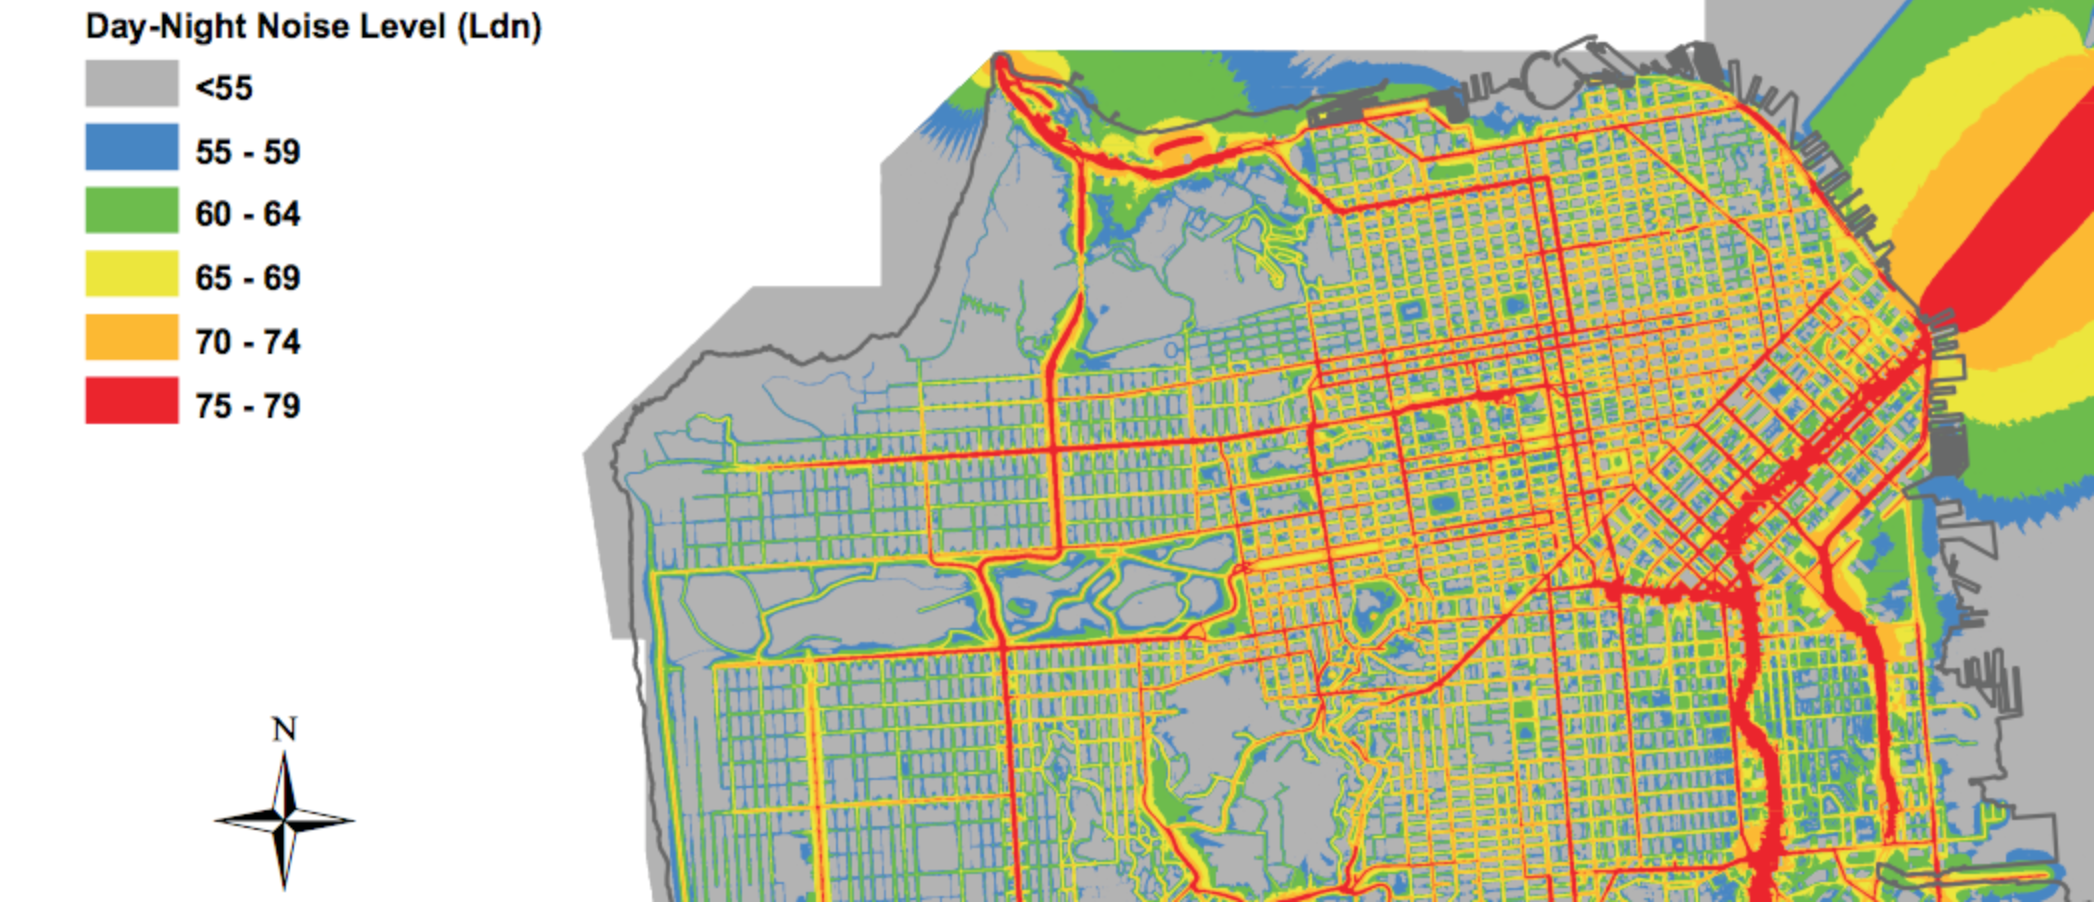
San Francisco
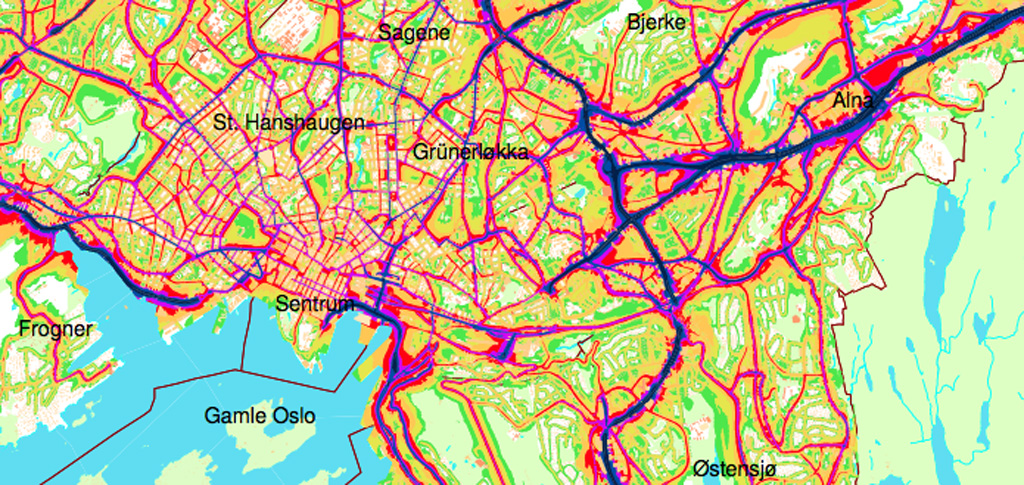
Oslo
Despite such concern for managing urban soundscapes, less attention has focussed on comprehensively mapping endangered sounds–and even less on the endangering of silence, which have not been often imagined as a comprehensible object of concern. Attempts at mapping local sound-levels for reasons of public health have focussed on a local level to assess problems of noise pollution and to assess aural impositions in urban spaces–and to measure benchmarks of tolerable sound-levels in urban space. We more often consider noise abatement in relation to crowded restaurants than open spaces or countryside. The registration of a varying range of decibel levels across the United States created the opportunity to visualize a color-coded record of ambient sound, grouped according to spatially situated environments, applied a broad palette to geographic space based on a much larger dataset, and one that responds less to problems of placing future projects of construction than measuring the increasing ubiquity of sound-levels often linked to urban environments across the country.
The innovation of the NPS sound map of the country’s less inhabited and more densely inhabited regions presents a particularly persuasive picture of the extent of the growing uniform nature of our aural environments. Based on the 1.5 million hours of motoring across the country to capture sound levels sensed on an average summer day, researchers with the National Parks Service have collated an impressive acoustic topography of the continental United States in hopes to map average decibel levels across the country, and found few areas of relative quiet. The result is particularly striking for suggesting deep scars of sound that radiate aglow from urban agglomerations in a heat map of loudness that registers the diffusion of human-made noise levels across the country, and the extent to which much of its illuminated center is flooded with ever-present background sounds–acoustic pools, as it were, of almost 50 dB, or able to drown most natural sounds from animals. If the sound map created from algorithms suggests just how urbanized we are today, and how far urban noise-levels extend across much of the country, it offers evidence of the auditory effects of anthropocene from which there appears no turning back.
The picture does not look good for the future of quiet spaces in most of the coterminous United States. The stars and streaks of aggressively bright sulfuric levels of smoky yellow–indicating concentrations in urban areas of a level of 51 decibels or more–maps clearly onto population concentrations from the shores of Lake Michigan to Dallas, Atlanta or central Florida. The noise map reveals huge differences in noise tolerance and indeed background noise that most Americans experience as normal, and indeed the auditory expectations most bring to their days, and the relative absence of silence over a large part of the inhabited country that noise has infiltrated, from a light gauze of yellow that surrounds are largest farming industries to the clusters of noise around expansive urban areas. In those deep blue swirling patches of the interior lie the most silent spots of the country,abysses of quiet which register the lowest absolute levels of sonic interference, far from the pollution of urban noise which seems to spread like age spots across much of the eastern half of the continent. (The very deepest deep blue regions designate areas of background noise below twenty decibels, the sound of a ticking watch, far below the a refrigerator hum, and very far from the ever-present ring of cell phones, piercing blasts of jack hammers or car alarms, freeway rumble or such sudden spikes as sawing concrete that now seem to so often mark the hubbub of urban life that is often difficult to blank out save by white noise machines.) A considerable share of the population must be quite habituated to an almost constant loudness of almost fifty dB, or about that of constant traffic–and just below that which is claimed to increase high blood pressure, tension, and heart attack risks.
Remapping the limited areas of low-level sounds top stand out more dramatically in black as isolated islands of greatest quiet gives the map an even clearer urgency as a manifesto for the shrinking spaces of silence across the continuous United States:
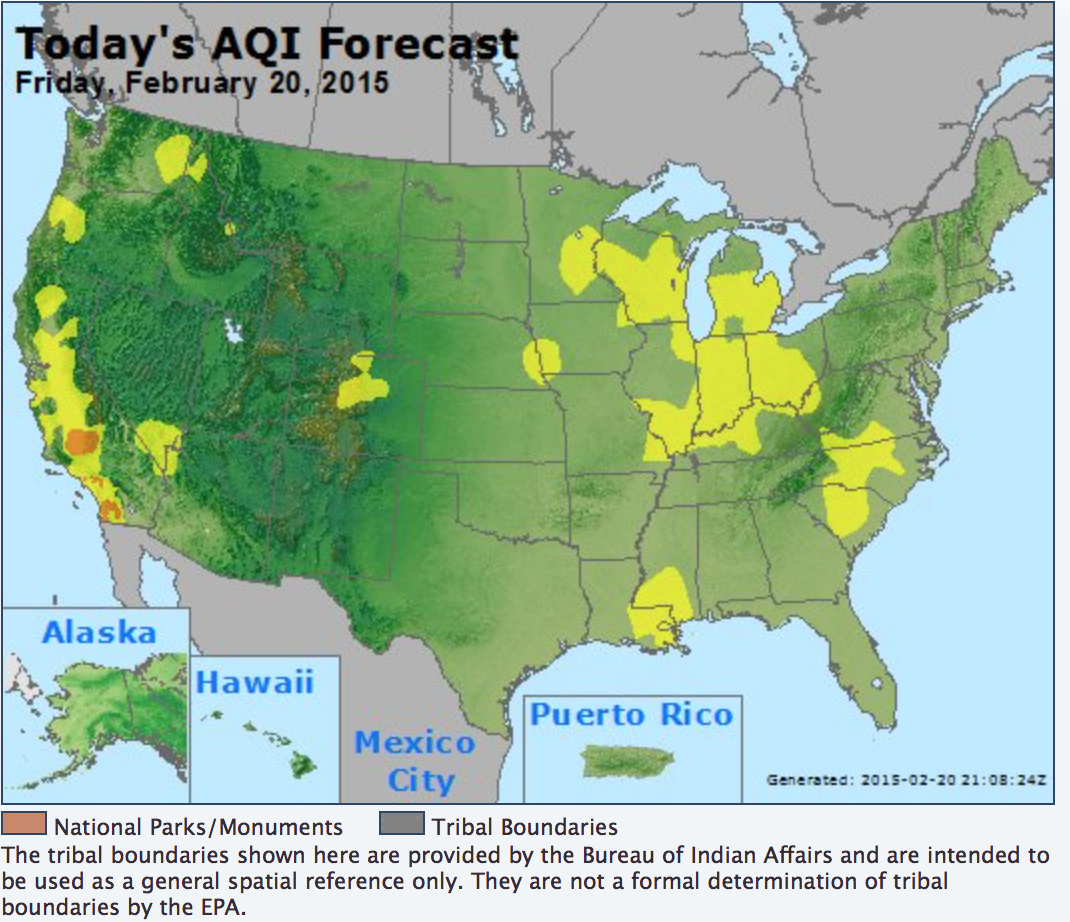
The map advances a narrative of the shrinking areas of silence in the soundscape of the continental United States that is decidedly not rosy, and in which levels of noise pollution stand to double or indeed triple every twenty years, making this a particularly troubling prospect that challenges the future of silence in America. Not so surprisingly, it maps well onto a randomized map forecasting air quality across the nation in its contours, although variations in the NPS soundscape in the header to this post show more finely grained variations and seems to exploit a broader dataset.
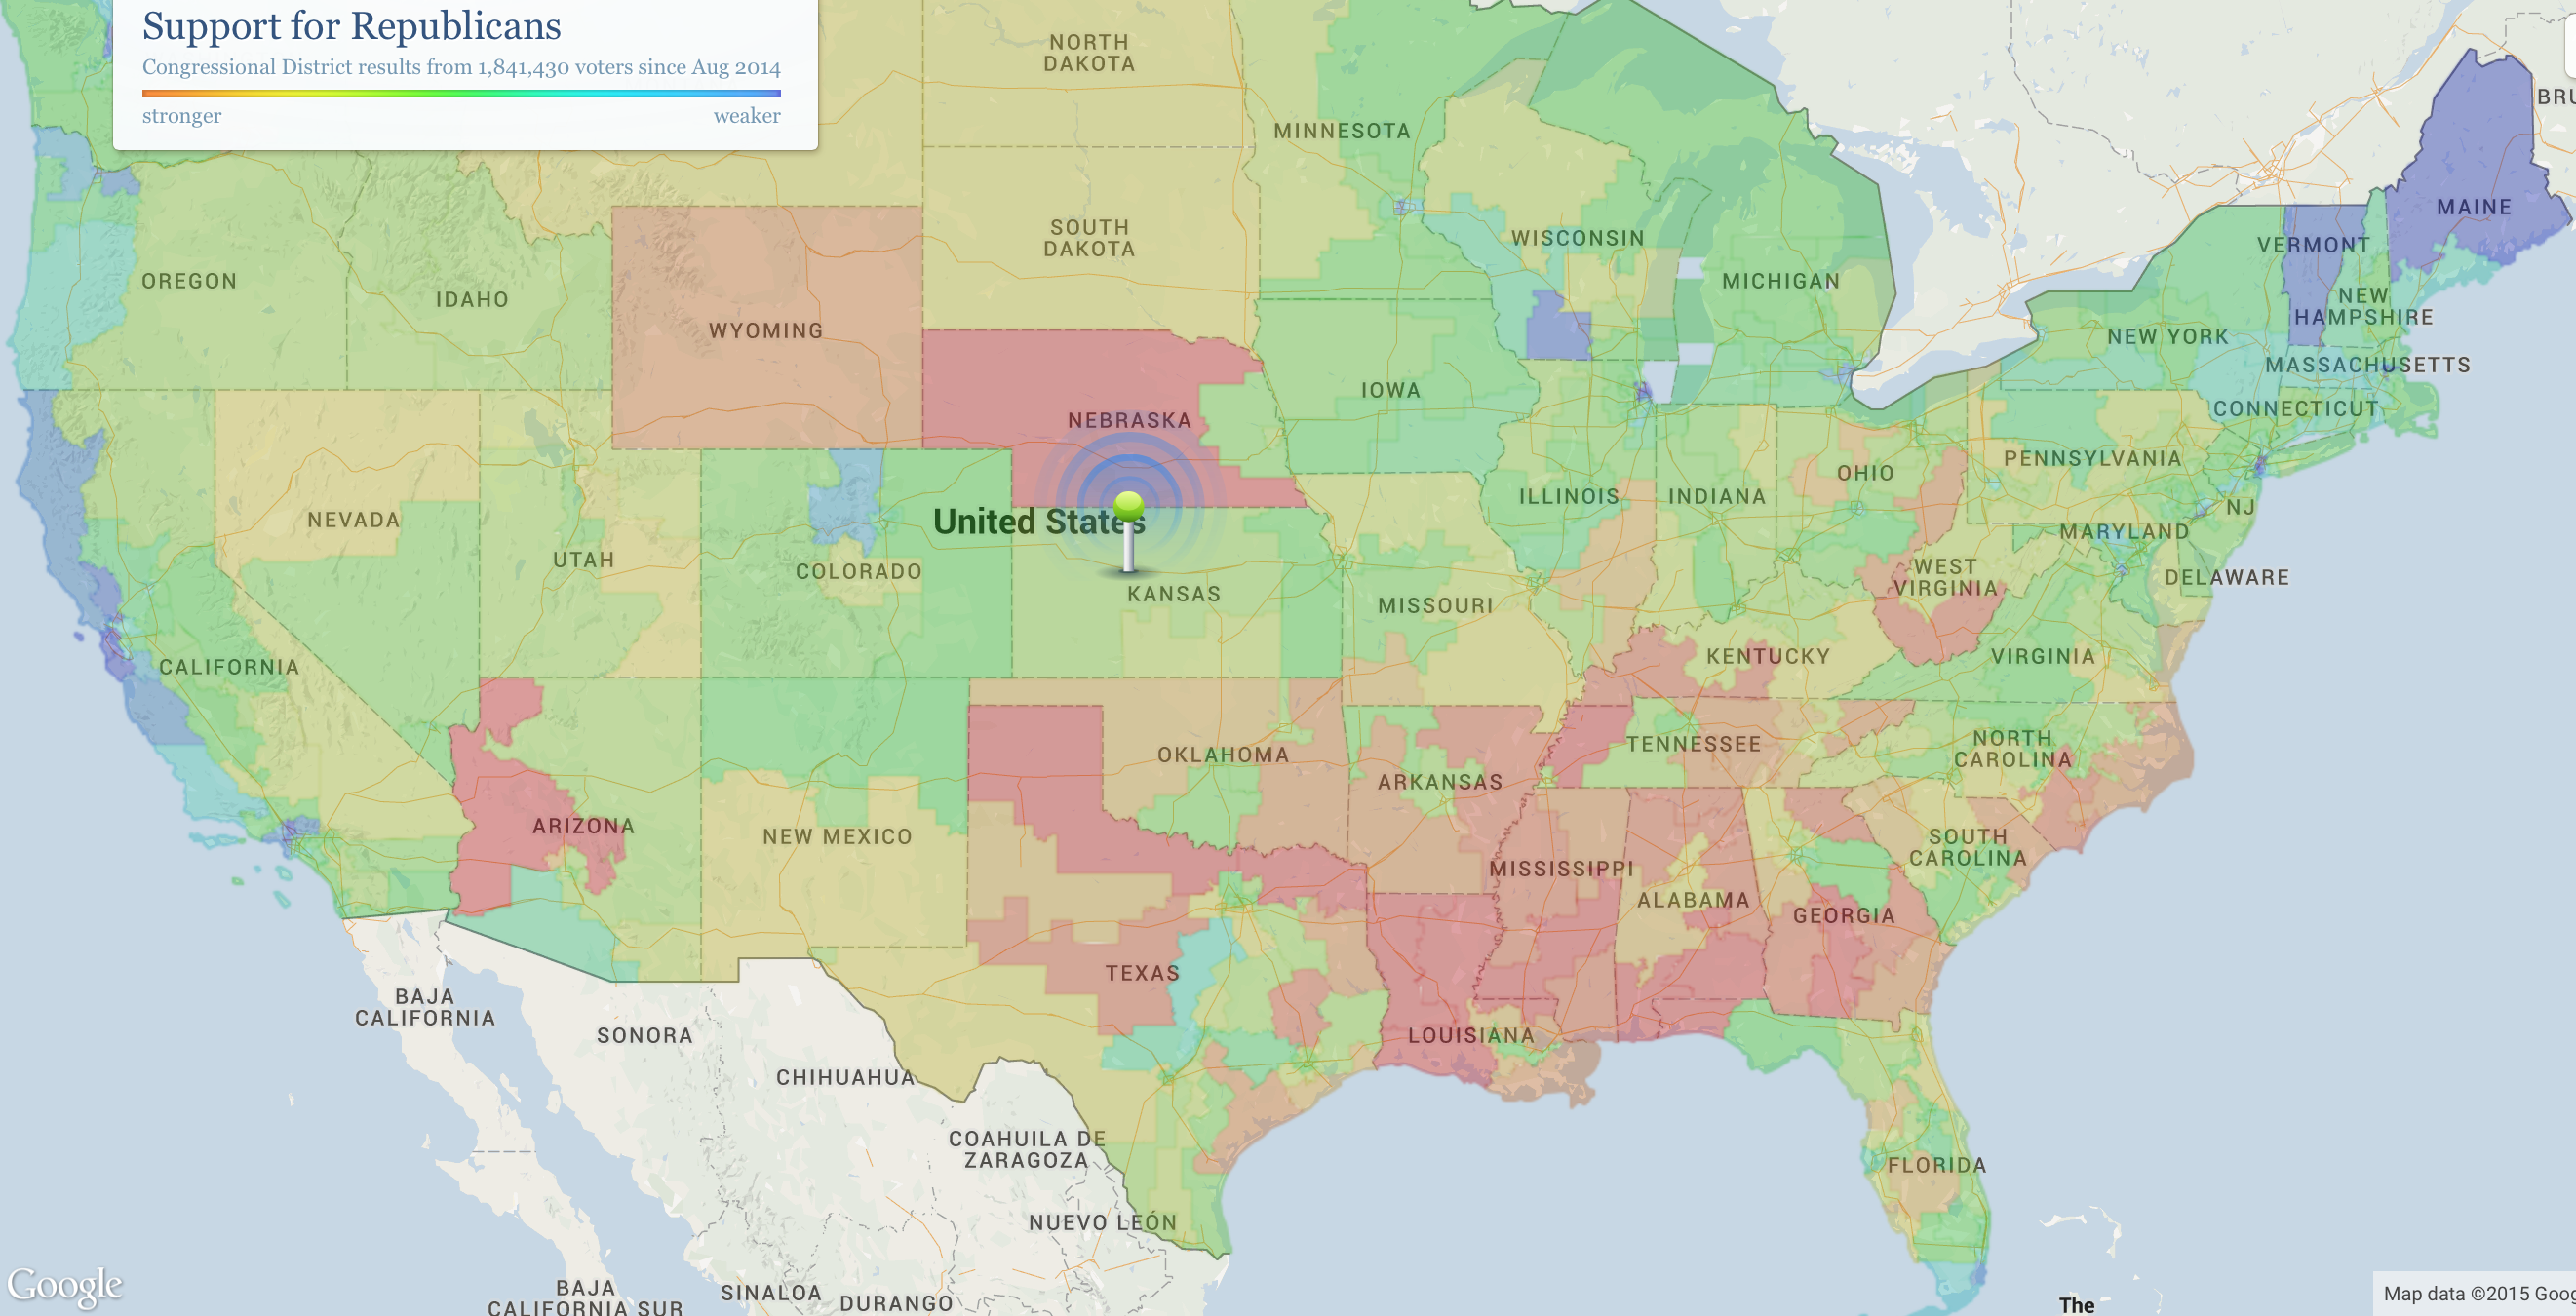
The deep discrepancies in decibel levels however bears little clear correlation to the current mosaic of political preference across the continuous forty-eight, however Lamarckian one would like to be about the relation between collective preferences and aural environments. Despite a tendency to link weaker support for Republicans with louder areas of greater ambient noise, the data just doesn’t bear it out in full at all: some of the reddest areas are those register considerably greater decibel levels. (Low support for Republicans in Maine contrast with its predominantly low levels of ambient sound; noisy areas of the South are pretty darn red, despite strikingly diverse levels of ambient sound registered in those states; noise-levels in California’s central valley are roughly equal the blueness of its coast.)
The narrative that the soundscape implies is far from rosy, however. What seems most frightening is the lack of any clear map of the future penetration of high decibel levels across much of middle America. Along the frontier of the decibel divide, much of the nation’s center appears flooded dark yellow; Denver, St. Lake City, Las Vegas and Boise seem beacons in an expanding aural frontier, burning bright already in Seattle and Olympia. The registration of these ambient sounds include not only vehicles, but from factories, radios, sirens, televisions, construction sites, trains, or mechanically generated sound of any kind, registering the range of overlapping sounds at any space at any time, in a manner more like Zefrey Throwell’s 1,000-car-horn symphony than the heterogeneous ensemble of percussionists György Ligeti enlisted in his Grand Macabre.
But the origins of the shifting soundscape in the nation might be better tracked through the appeal of the Good Roads movement of Charles Henry Davis, that industrious Quaker who lived in South Yarmouth, Massachusetts, but founded the National Highways Association in 1911, promoting the hope for an interconnected National Highway System of 50.000 miles “built, owned and maintained by the National Government,” which while limited at that time to six great “Main Highways,” advocated an image of “a paved Unites States in our day” that has persisted. The benefits Davis saw in paved roads as an engine of economy that would raise the nation were more than only an infrastructure–“national highways will increase the wealth, the power, and the importance of this country as nothing else can do besides that which has brought civilization to the savage, wealth to the poor, and happiness to all–GOOD ROADS”–but an image of collective benefit. The continued promotion of their benefits, so removed from views of the benefits of preserving place today, actively promoted the benefit of the ideal of a “paved United States in our day.” Indeed, if all road maps were promoted in 1912 from South Yarmouth as useful tools that “will prove of inestimable value to the proposed national highways commission, and in addition will be of service in showing the people of each state how the national government can make use of their roads in the proposed plan” as of a piece with a bucolic vision of the nation.
 Davis, Good Roads Everywhere (1912)
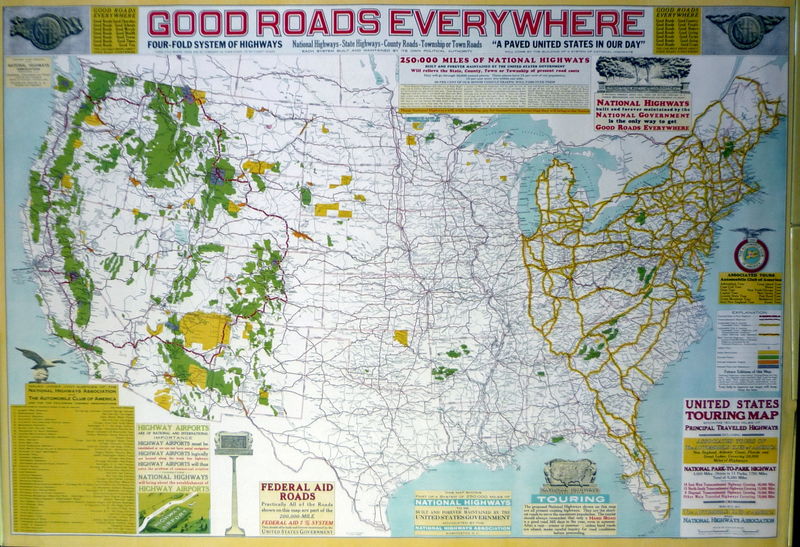
Maps boosted the image of a national system of highways, and indeed our sense of access to national space, from the 1925 promotional map that synthesized the roadways of the nation as an invitation to their exploration to celebrate the achievement of 250,000 miles of national highway–
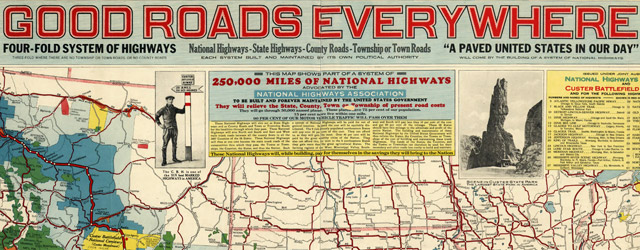
–to the expansion of the “Good Roads Everywhere” movement creating a “paved United States in our day” as if it were “peace in our time.”
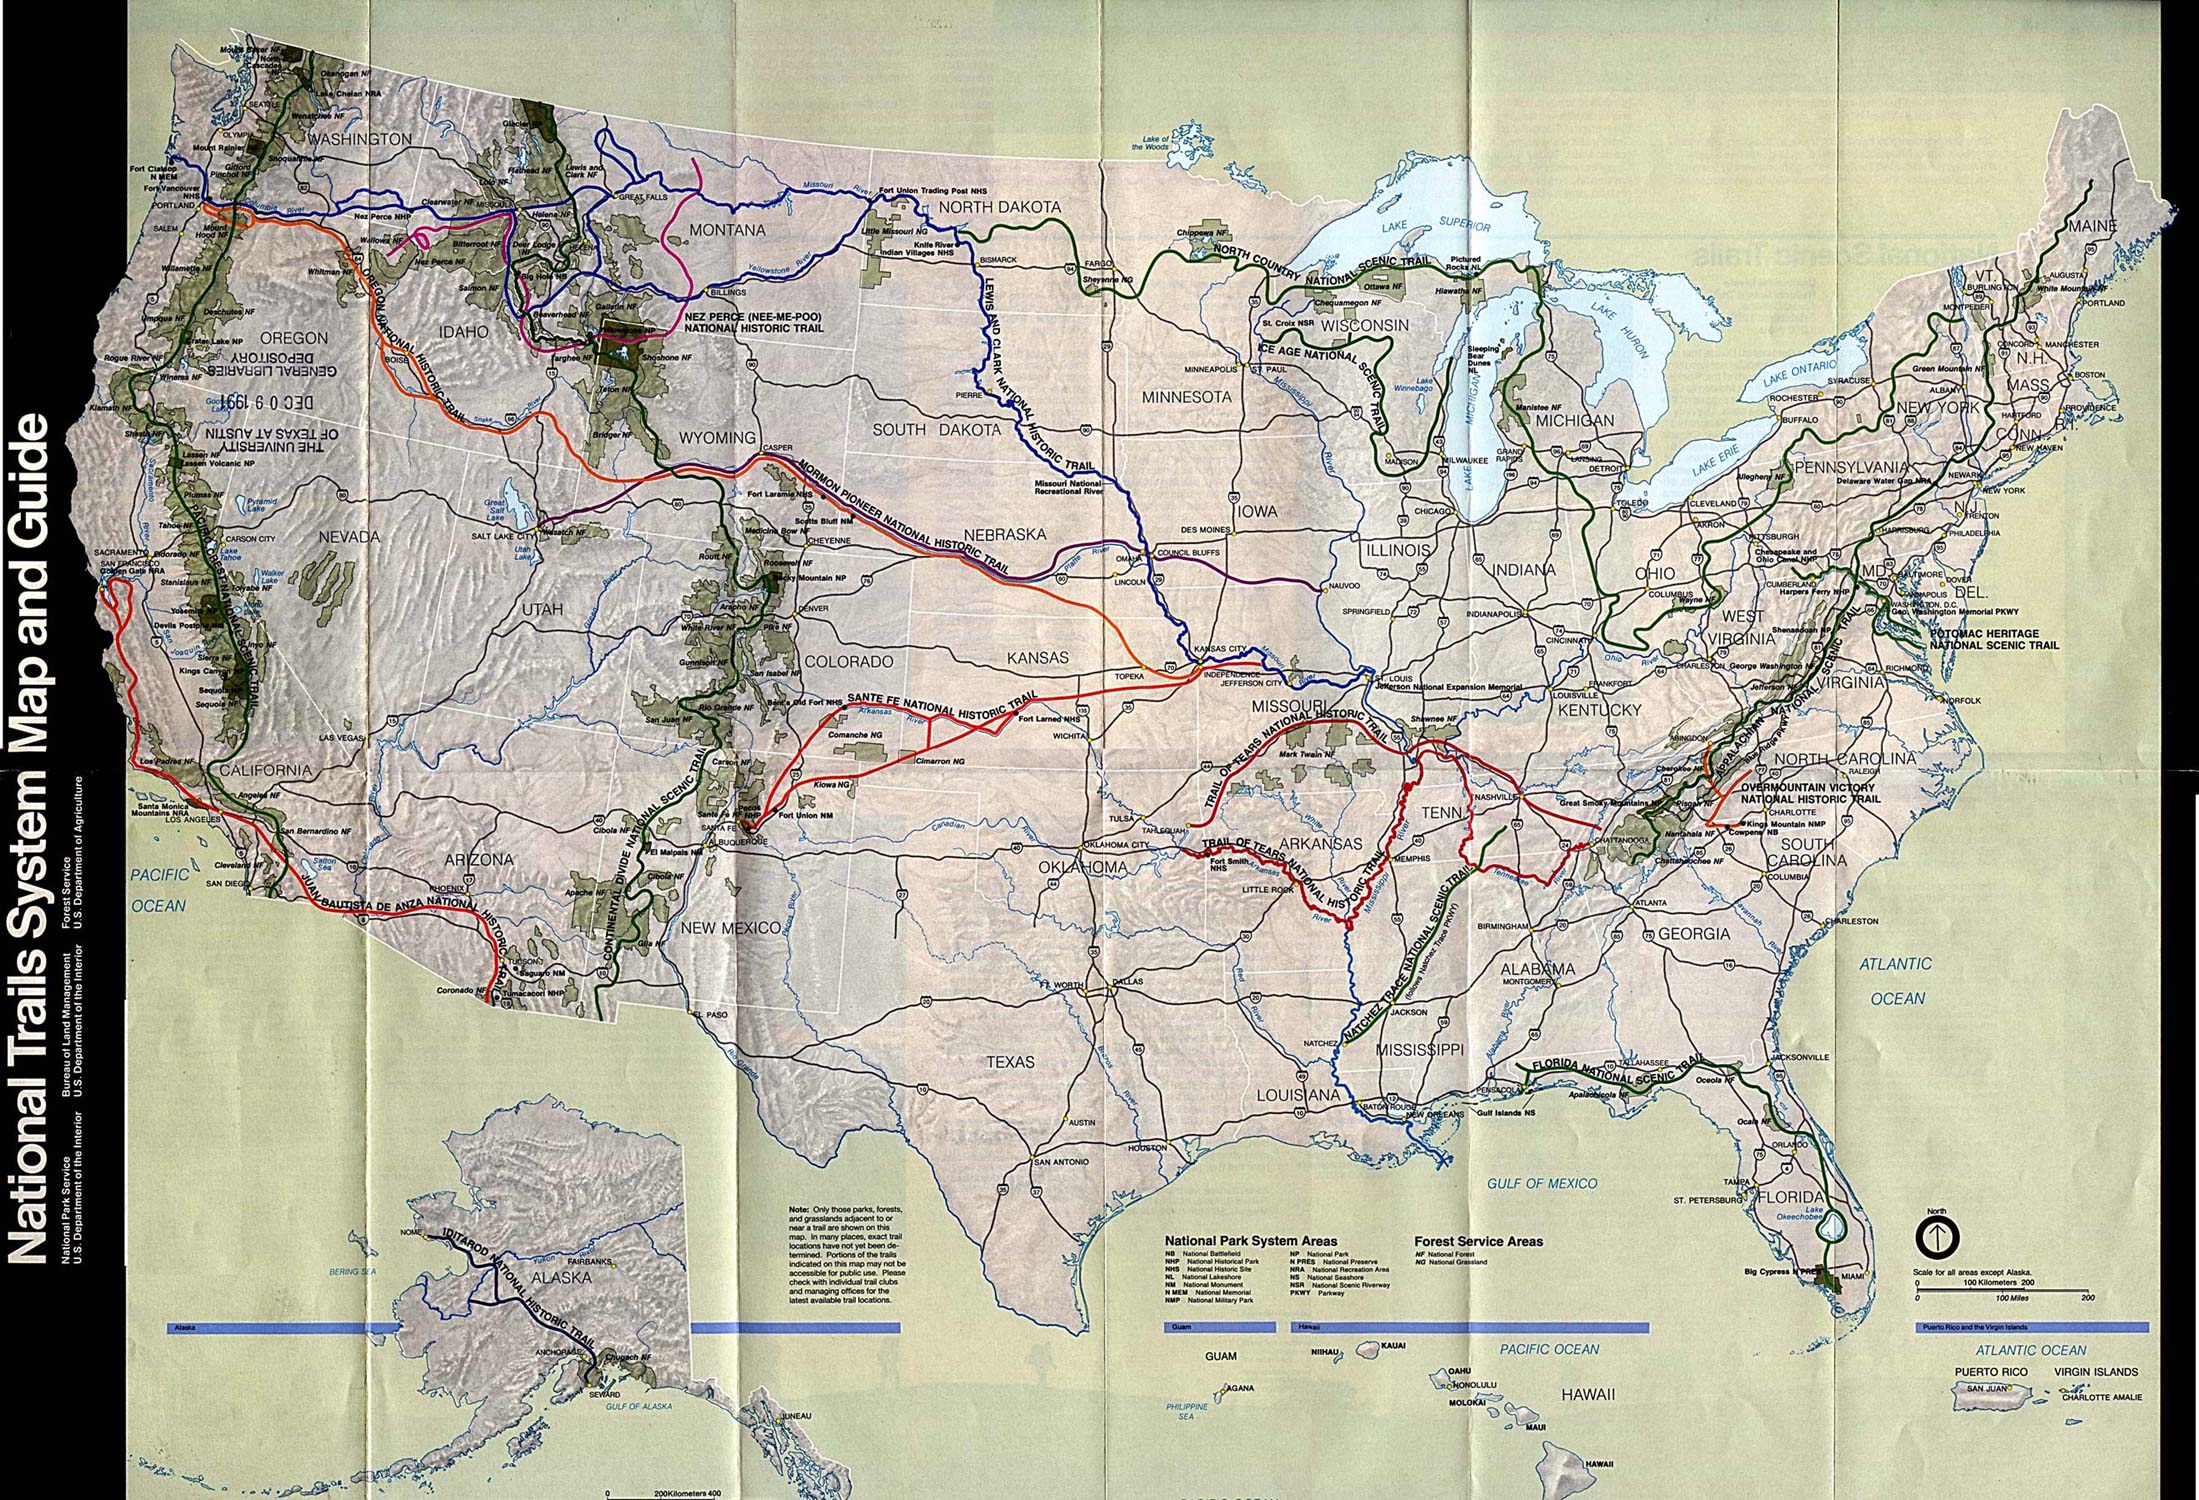
Looking at the nation’s soundscape, it’s hard not to be drawn to the chasms of deep blue where sound levels decrease. National Parks Services’ researchers took some shots when they compared these areas without background noise to the notion of traveling back in time to the sound-levels before Columban contact–on their apparent ignoring of the dense population of the continent before its “discovery”–one might see it as the sonar landscape Lewis and Clark experienced with the collection of animal trackers and Native Americans which composed the Corps of Discovery, traveling down the Columbia river or pausing in their portages: these are the areas distinguished with a sound level of lower than twenty decibels, areas where one can access a pristine auditory experiences characterized by the near-absence of the background noises that we are tempted to screen out of our auditory experiences,–and against which would stand out the perception of local wildlife.
The attractiveness of these seemingly pristine places not only provides a compelling advertisement for visiting national parks during whatever summer vacations one might have, but is a compelling soundscape of a world not likely to return, where decibel levels fall far below the fifty that almost seem low for urban areas, the deep blue recalling something like the cold of oceans’ depths. Created by the National Parks’ Natural Sounds and Night Skies Division, it reflects their mission statement to create an inventory of sound that seeks to preserve “acoustic and night sky environments unimpaired for the enjoyment of future generations,” Fristrup worries, and provides something of a watermark on our aural environments, but it is also intended as a diagnostic tool to measure the degree to which manmade noises affect owls and bats who depend on locating insects to find food–the somewhat synesthetic record renders an acoustic environment married by bright yellow splotches and sulphuric streaks, and ubiquitous noise levels comparable to hearing a washing machine churn from a distance of three feet away.
The ever-present scars of unwanted sound spread aggressively in almost radial fashion from major population centers and seem diffused across many the rural areas of the country. The maps suggests the auditory compromises created by the road network which generates ever-present background noise across the continent’s more inhabited areas, even if the algorithm used to generate it discounted traffic, with non-human made sounds of wind and water. Rather than present a watermark of sound levels, the map bodes poorly for the growing levels of volume in years to come. If much of this noise-generated hearing loss perhaps on account of noise-levels artificially generated in iPods and MP3 players which funnel amplified sound into directly our ears–and which may have helped elevate the number of five million 12-19 year olds who have compromised hearing thresholds, according to Dangerous Decibels–a site which is full of tips on living with hearing loss and the risks of noise-induced hearing loss–the desensitization to environmental sounds that the map charts creates a landscape where even those without Noise-Induced Hearing Loss (NIHL) have a compromised relation to their environments.
But the map suggests the changing nature of outdoor hearing for most populations, compromised by the rise of background noise, and the deep penetration of what used to be considered urban sounds of mechanized movements across much of the country.
Reading the stark topography of sound levels across the lower forty-eight, one is indeed almost instinctively tempted to run into its scattered pockets of deepest blues: these seem the safest areas of respite, as one shrinks from the bright incandescent yellows of even a tolerable amount of ever-present background noise–maybe not to the deserts of southwest Texas, but if not to the national parks bordering California, in the Cascades, the Colorado Plateau, Yellowstone National Park in Wyoming, Dinosaur National Monument between Colorado and Utah, and in the Great Basin. (It’s perhaps not a coincidence that some of these ecosystems, many home to Native Americans, were to be preserved “from injury or spoliation” by the National Parks, preserved thanks to Carl Shurz, David Brower and Howard Zahniser. Is the aural intrusion not a deep form of injury?)
One might as well get out a paper map of the greenspace in parks to correlate them with the deep blue lakes of silence . . .
It is almost difficult to imagine the experience of those deep blue areas of silence today.
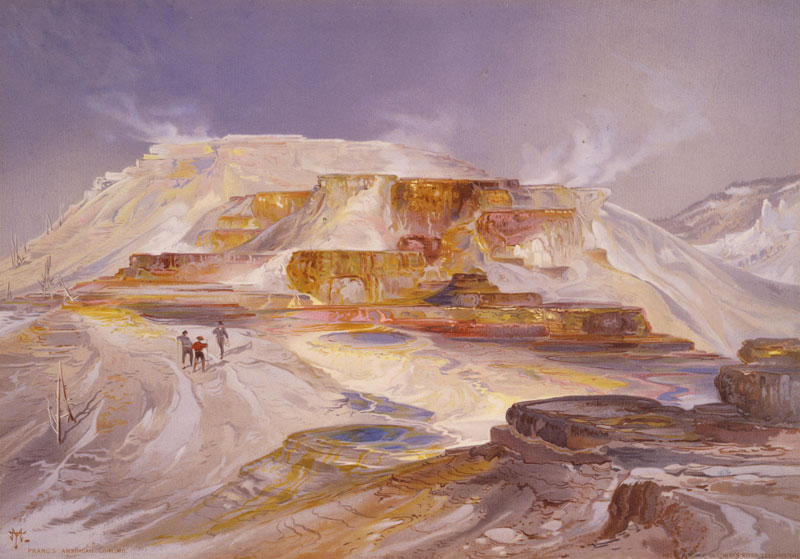
The expansive chromolithographies of Thomas Moran depict deeply hidden, inner resources of nature in sites such as the future Yellowstone or Zion Park, preserved from industrializing life of in ways that raised interest in the hidden landscapes of the United States, after he had accompanied Ferdinand V. Hayden on the 1871 Geographic Survey of the Territories, in ways that created one of the first romantic images to produce a popular movement for the protection of a landscape as undisturbed. One is struck in Moran’s monumental landscapes by how these awesome environments dwarf their human visitors, arriving in what seem uninhabited lands, far from the noise of railroads or cities in the industrializing United States:
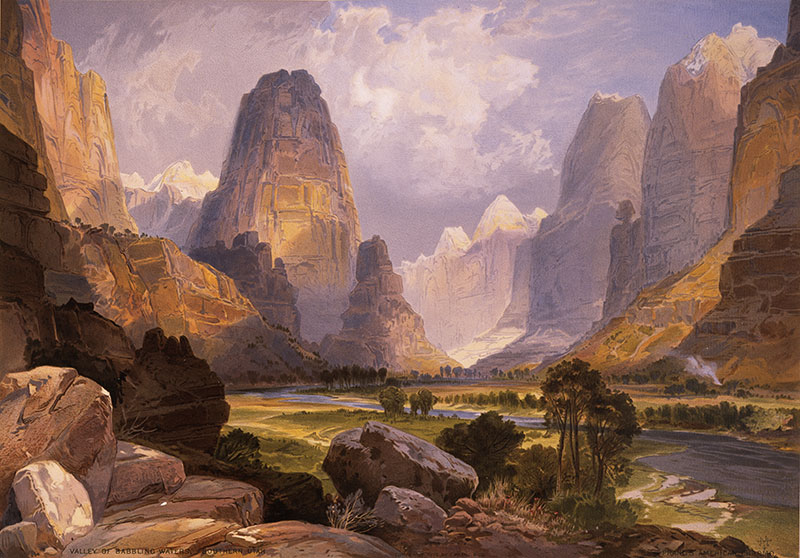
Thomas Moran, “The Valley of the Babbling Waters, Southern Utah” (1873) 18.71.14
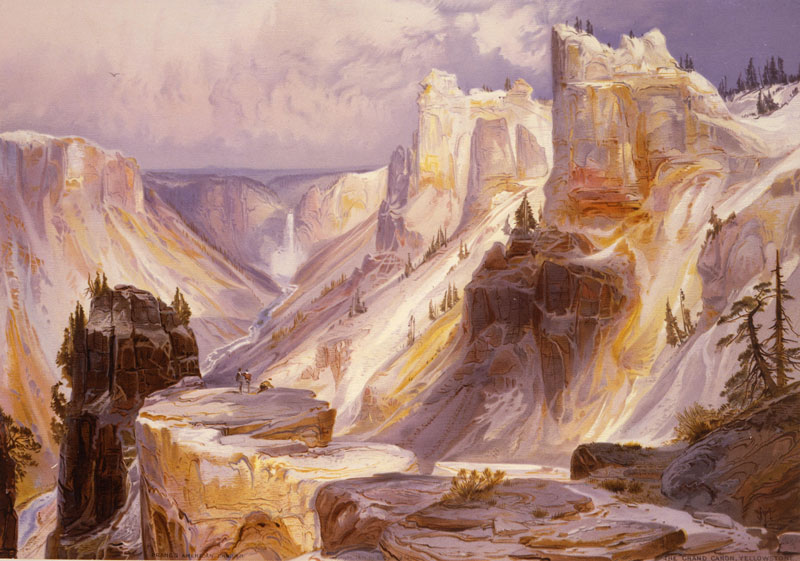
Thomas Moran, “Grand Canyon of the Yellowstone” (1875) 18.71.8
These are the ideals of We now look at the romance of arriving at deep blue spots in the algorithmically generated soundscape, far removed from Moran’s monumental renderings of geographical formations that first communicated a sense of the natural majesty of the western United States to a large audience of viewers that communicated the wonder of a landscape he saw as both untouched and pristine, in contrast to the ever-present ambient noise that seems not only inescapable in remote regions of Oregon’s Crater Lake National Park but all but inescapable in much of the U.S.
But the levels of noise pollution that illuminate or almost incandescently light much of the country marks the encroaching of an auditory anthropocene from which there will be no turning back, and which has already altered the landscape as well as soundscape of the country. The spatial collation of audio registrations finds most people live in environments “where night skies and soundscapes are profoundly degraded, Fristrup notes, describing the extent of both sound and noise “pollution” as almost spanning the continent, where median background noise plagues most, out of a desire to “conserve natural sensory environments for future generations” registers his deep and abiding sense of loss and the inevitability of a landscape of increasing auditory degradation that could bring a generation of “learned deafness” destined to dull one to the very soundscapes National Parks seek to conserve–and the notion of such environmentally provoked desensitization to sound seems backed by the datum that some 10 million people in the United States were judged, in 1999, to have permanent hearing loss from noise or trauma. Are we becoming increasingly hard of hearing or deaf, or in danger of slowly losing a sense by which humans have long interacted with the world and gave meaning to it?
The argument has had special resonance–no pun intended. The map that was quickly shared upwards of 10.9 K times record penetration of high decibel levels (above 40) across much of the country’s inhabited land–and the rarity of those deep blue chasms that seem to almost fall through the map. Although the idea that they record the sound environment of the country before Columbus is doubtful, and not only because of the folly of thinking that it was not inhabited before 1492, the absence of industrial ambient background noise over a level of forty decibels is no doubt a pretty modern creation–though anthropocentric presumptions that the noise be generated by humans, rather than animals–stampedes of buffaloes?–seems more unwarranted. But the map based on measurements of midsummer decibel levels is a unique map of how we inhabit the land, and a nice record of what we might mean now by the “inhabited world”–or ecumene. It is a record, perhaps, of how we have chosen to inhabit space, and the ways that we have chosen to inhabit it–the landscape scarred with sound bizarrely analogous to the barren scored and spotted pock-marked lunar landscape, and the connotations of un-inhabitability it inescapably provokes in evoking this surface without life.
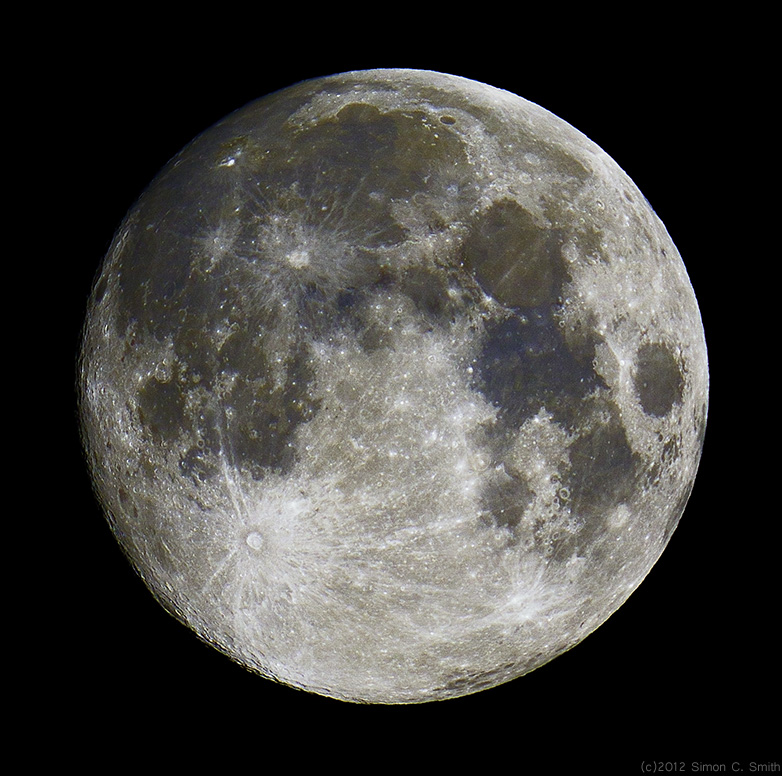
The sterile landscape of the moon is an odd choice of comparison. The worry that we may be facing the rise of a “deaf generation,” unable to hear the world as men and women once perceived natural sounds, due the growing decibel levels of constant noise in larger cities, and not be able to hear or register the natural sounds in cities, and even National Parks, has led Fristrup to worry about the threats and healthiness due to increases in ambient noise and wonder if future generations might not even appreciate the sounds of nature in cities or National Parks. If such fears seem alarmist, they are reflected in the deep attraction most observers will have to the deep blue identified with tranquility–and with restfulness or even curl health–an association according with the profound healthful benefits of silence.
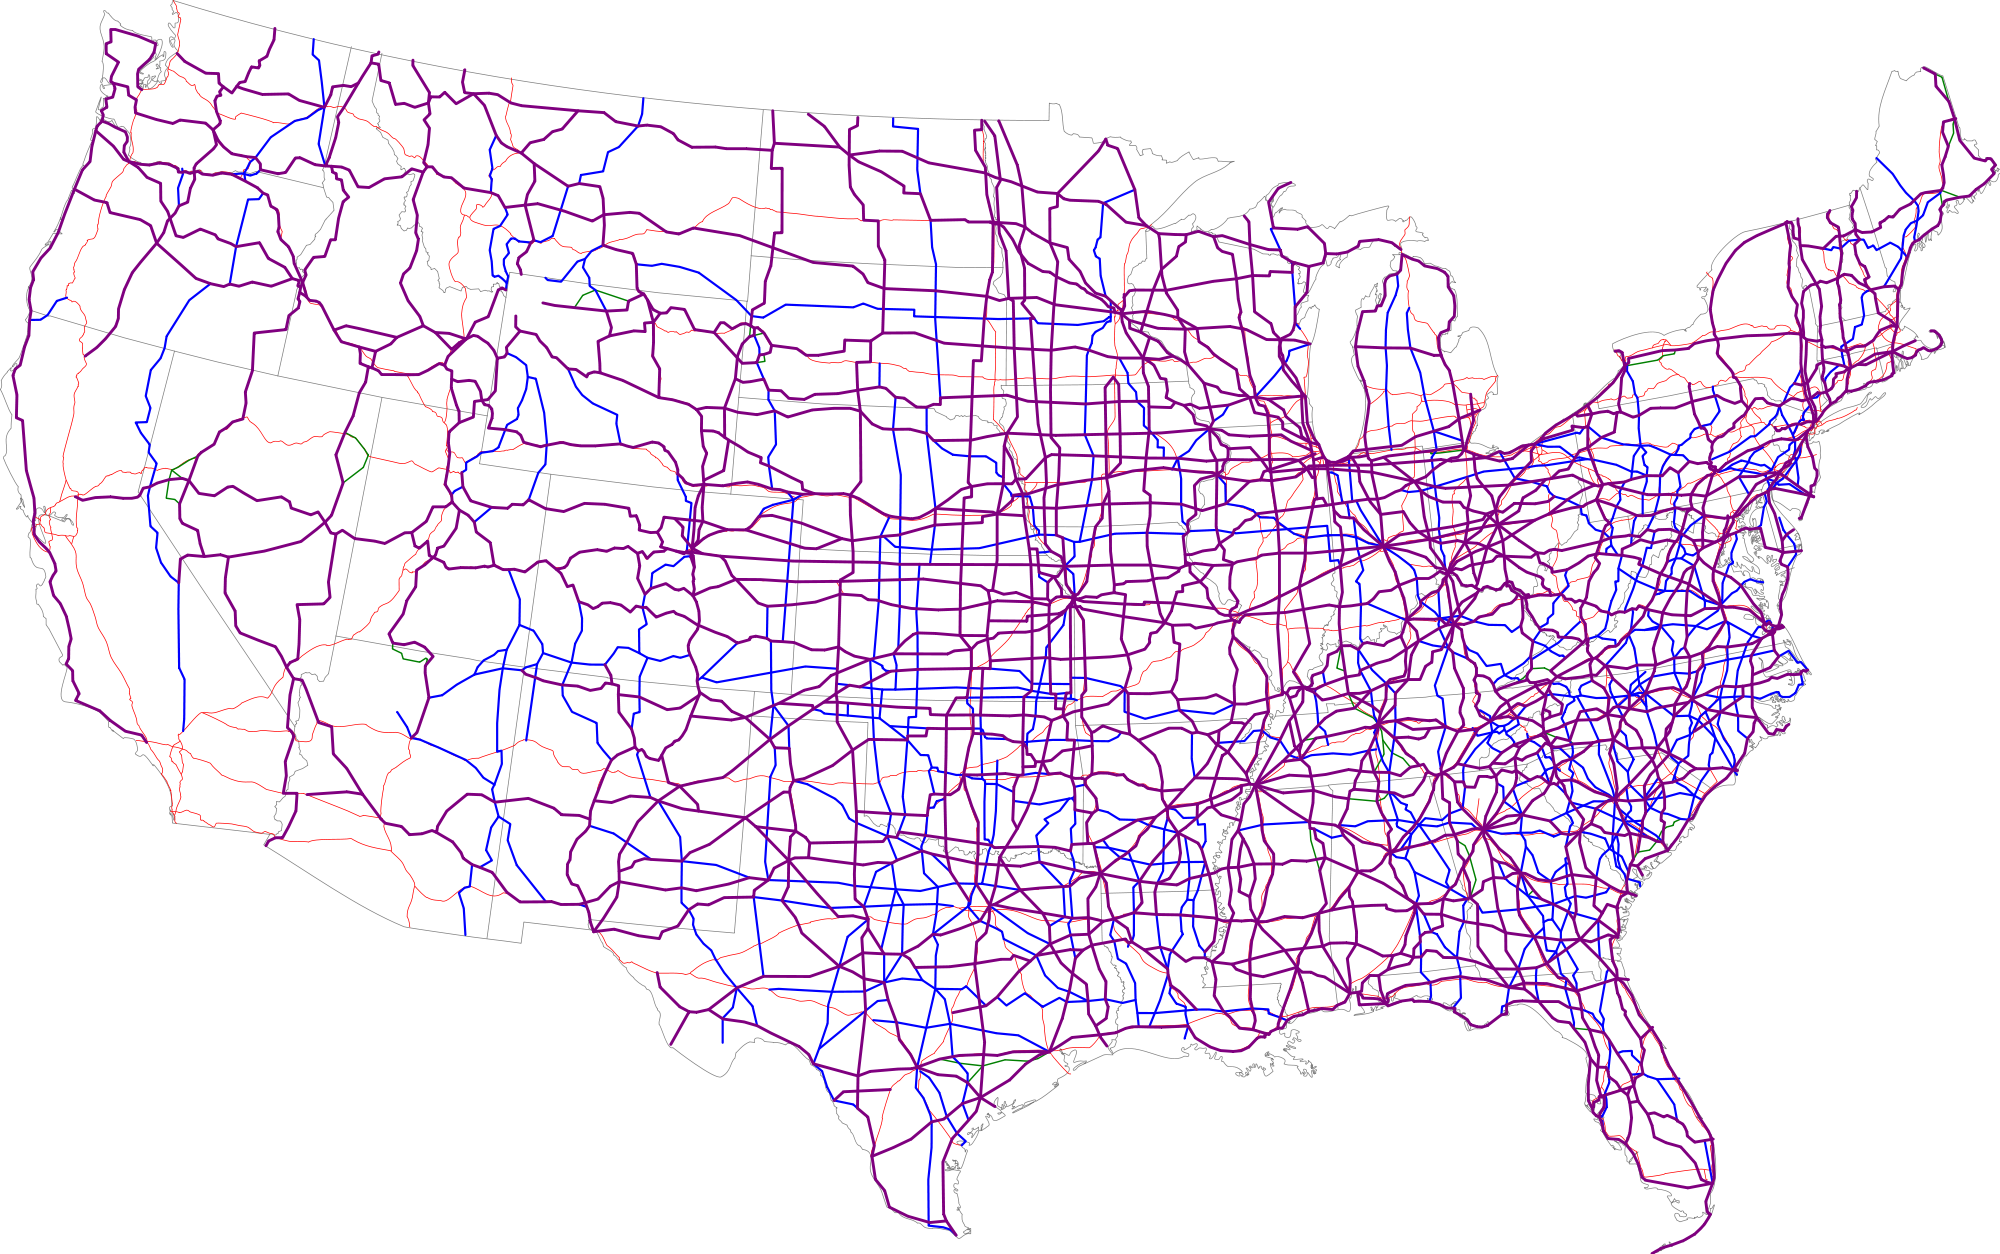
Fears of a growing disconnect with aural experiences makes the strong similarity between the scoring of the national soundscape and the lunar landscape somehow appropriate. For the scientific synesthesia that results suggests how we’ve filled the continent with sound, from jack hammers to jet airplanes to trucks to power mowers to daily traffic to sanitation trucks to bird-calls. The sonic landscape closely corresponds to the expansion of manmade environments across the continent, and ignore the level of noise that was made by earlier inhabitants. The measurement of strong levels of sound pollution claims to screen out the traffic of nearby automobiles, but is appears to echo the very network pattern of freeways and highways that traverse the country and link cities with one another, and were no doubt privileged sites of measurement; where few or no roads exist, it seems that regions of deep blue must perforce prevail–or at least that the grids provide a basis to generate noise: grids of streets even appear in the noise map, much as the splotches of bright yellow mark cities and sprawling urban areas that have made silence almost inaccessible for large shares of the nation’s populations without considerable geographic mobility, and moved all landscapes of deep silence far west, removed from traffic’s perpetual hum.
Wikipedia
Only in 1970, of course, considerably more open spaces existed across the United States, if one focuses on Interstates alone across the western states:

The apparent density of noise may indeed be partly explained by the density of the network of highways that course across the Eastern seaboard and much of the midwest.
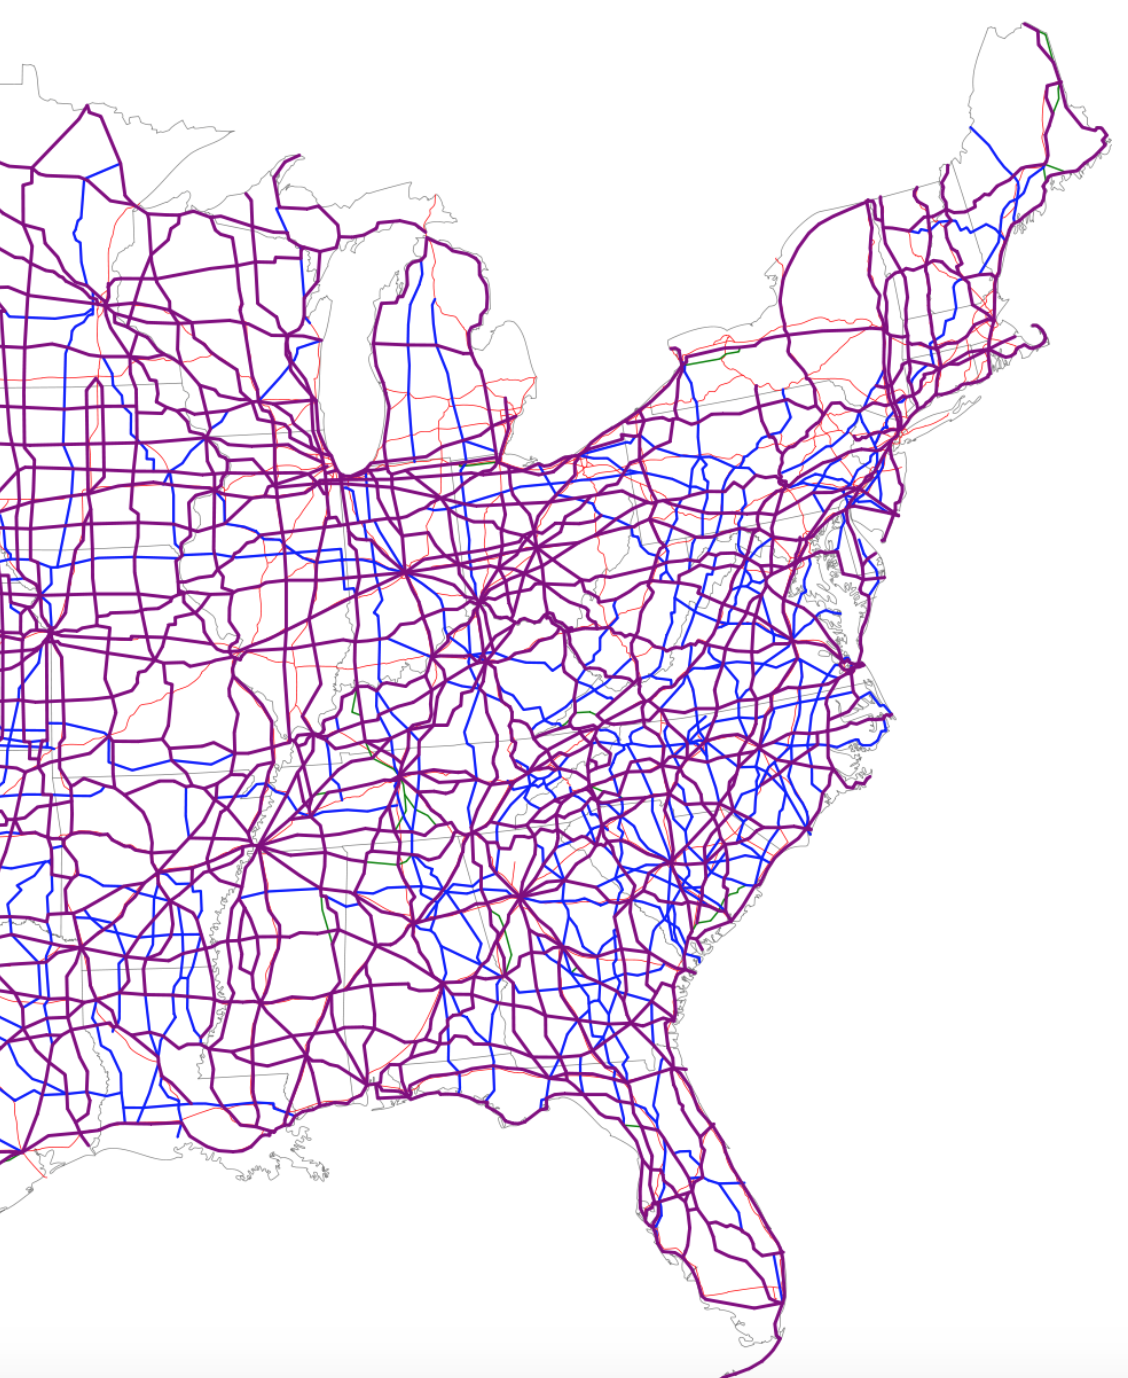
What might be called the “noisier half” of the United States shows an area of almost continuous noise pollution, where the “auditory horizons” have markedly shrunk in most places to but a few blocks of paved space–
reflects the very same region where highways define a distinctly different relation to expanse:
The expansion of the National Highway System across the nation is perhaps best rendered by a hand-drawn map that tries to project its future and the compromising of place that it implies, with an eye to the shrinking of the auditory human experience of place:
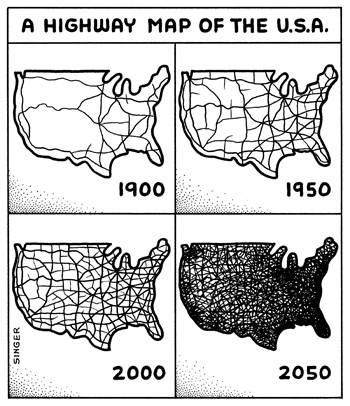
A Highway Map of the USA
For the congestion of noise, roads, and urban areas reveals an image of how we inhabit continental expanse. We might compare the division of the country, grosso modo, to the imbalance in the density with which McDonald’s restaurants are spread across the contiguous United States, shown here by illuminated dots that reveal the proximity of fast food restaurants across the land, sometimes suggesting strikingly similar highway paths, and no doubt mirror population trends, and indeed the density of businesses:
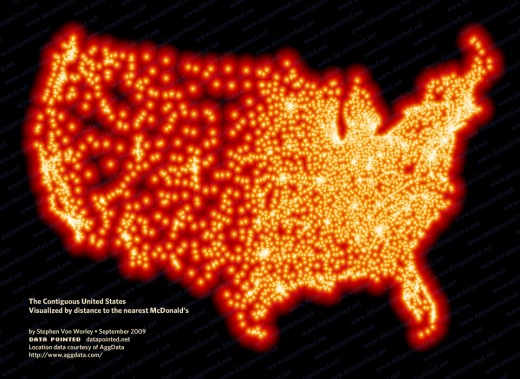
Stephen Von Worley
Does space tend to collapse in interesting ways once one is less able to sense sounds? Such levels of noise pollution offer a sonorous residue or acoustic remainder of how we have come to inhabit the world’s environment and to remake it, and register the arrival an auditory anthropocene which earlier maps have often been hard-pressed to detect.
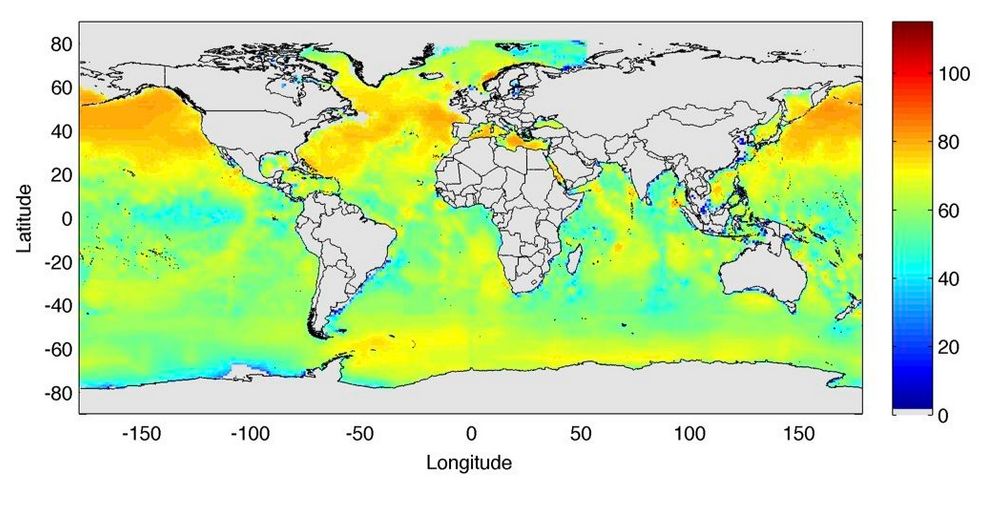
As much as being confined to the United States, the prospect of such elevated decibel levels in areas of dense population and the modern humming of transportation networks across the country find a parallel in the noises of the global traffic networks we have created in the seas. Indeed, the oceans seem increasingly characterized by constant presence of such noise recalls the “background hum” of oceanic shipping lanes that resounds across the oceans, by modeling a global soundscape seeks mapping the range of sounds ships create in transatlantic voyages, that seem the material reminder of the increased intensity of a global network of shipping lanes. Such sound levels, to be sure, often obscure the cresting of waves, with the upshot of radically compromising the auditory experience of the ocean for its inhabitants–especially imperiling animals that use sounds to communicate, cetaceans from whales to dolphins, in ways that may mislead the sonar skills they have evolved to map their own courses underwater, in ways that create more than auditory interference with how they experience space. And with noise traveling some 4.3 faster in the watery medium than in air–and traveling at an unchanging intensity over considerable distances–the gigantic impact of large-cargo vessels that generate more noise than we would often permit onshore from constantly running diesel engines creates considerable ambient noise to which different marine creatures are especially vulnerable.
A map of the auditory intrusions of passenger vessels alone that was recorded and released by NOAA based on anthropogenic noise of cruise vessels alone suggest a shifting in the oceanic environment:
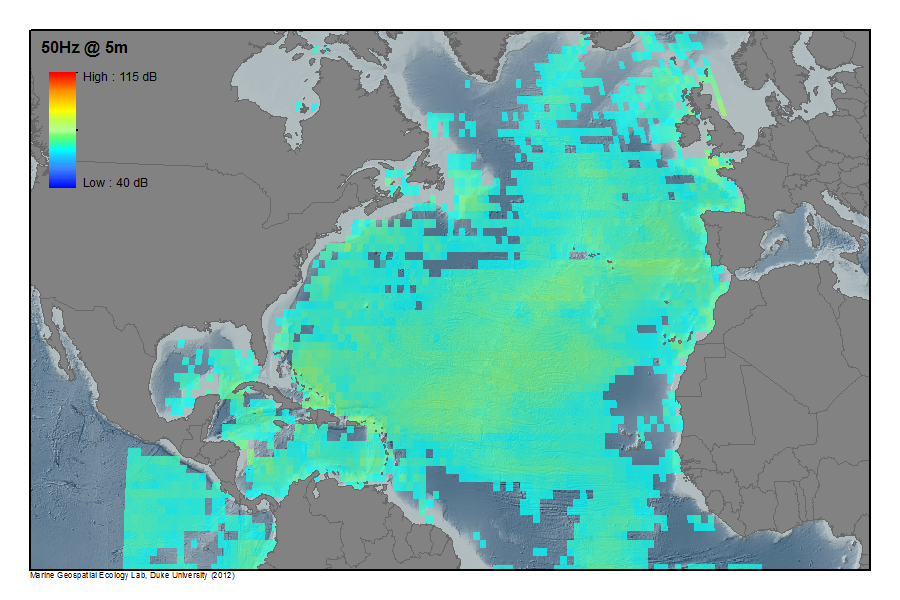
Yet the spectrum of noise from the chronic levels of noise modeled from larger commercial vessels was far more chronic:
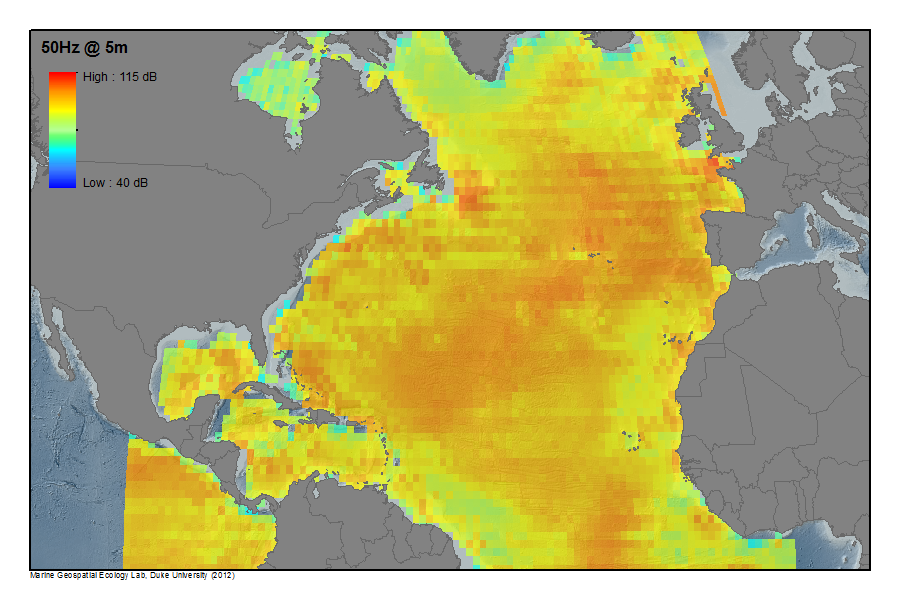
And when summed, the picture that results is of a radically sonically altered and disrupted environment, apparently in ignorance of the disturbances that they create for actual (or any) ocean populations:
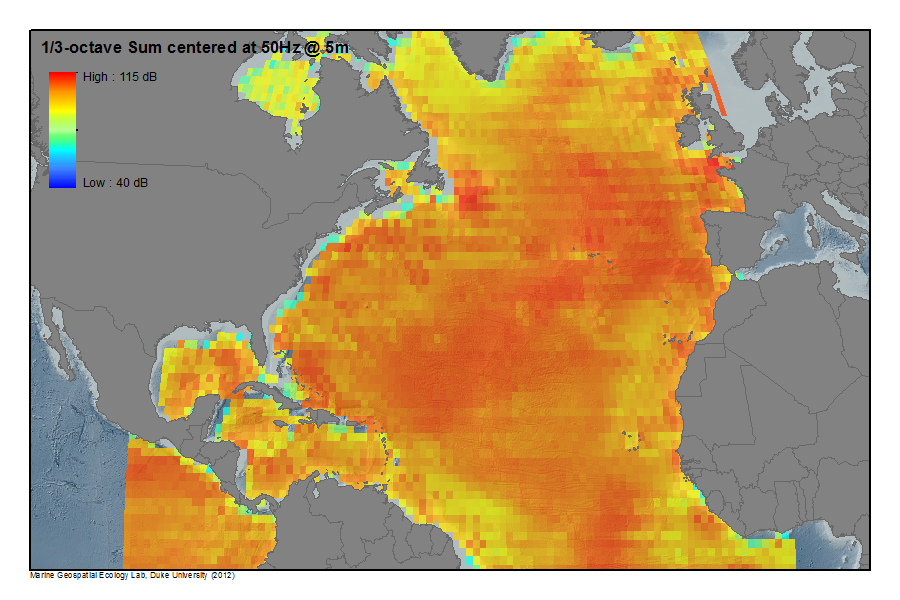
The map below registers sounds that extend to a depth of 650 feet in a similar color spectrum map–which doesn’t include either seismic exploration or Navy sonar noise that add considerably to the range of ocean sounds that obscure today’s songs of humpback whales. Indeed, if whales often base their communications over expanses of hundreds of miles through their song, whale space has undoubtedly against such background noise in a a sea with startlingly few areas absent from auditory interference. Such changes would not only affect the cetacean populations of marine mammals as they navigate underwater transit–if von Uexküll suggests that whales are attuned to other worlds, it might be important to contemplate what they make of the ships’ apparently unavoidable background sounds, or whether they accommodate to their presence.
 NOAA
NOAA
If one goes to 200 Hz, a slightly different picture of the local variations in background hums emerges:
 NOAA
NOAA
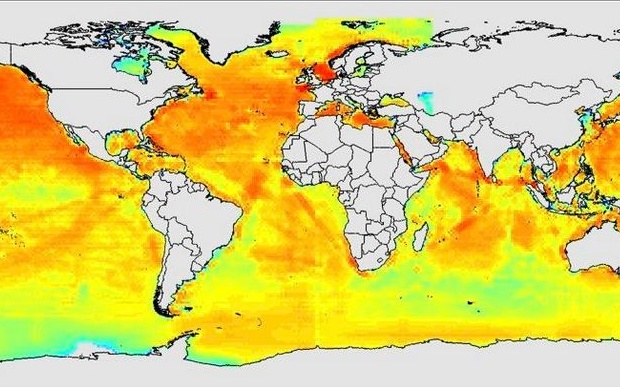
But what might be considered more broadly is the very difficulty of erasing the imprint that such ships that travel across the seas exercise over the entire marine environment. The sonorous surroundings characteristic of the oceans were earlier mapped at 400 Hz and a depth of fifty feet by NOAA in 2012, from passenger ships, commercial ships, to seismic surveys in an annual average, present a similarly pronounced offshore acoustic disturbances and an even more pronounced augmentation of background noise offshore, as if hidden from landlocked observation stations, as if ships’ engines are only started at full throttle after arriving in the open seas, where ship captains or automated pilots crank up their speeds and plow full speed ahead:
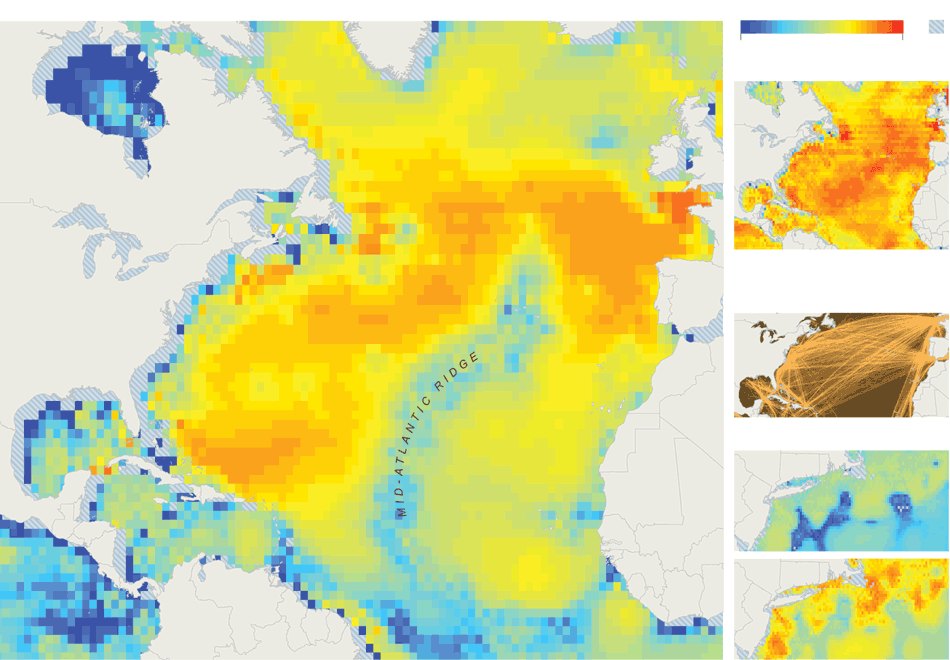 NOAA Underwater Mapping Sound Field Mapping Working Group/HLS Research/ NCEAS–Details of North Atlantic Shipping and local noises near Long Island–from the New York Times
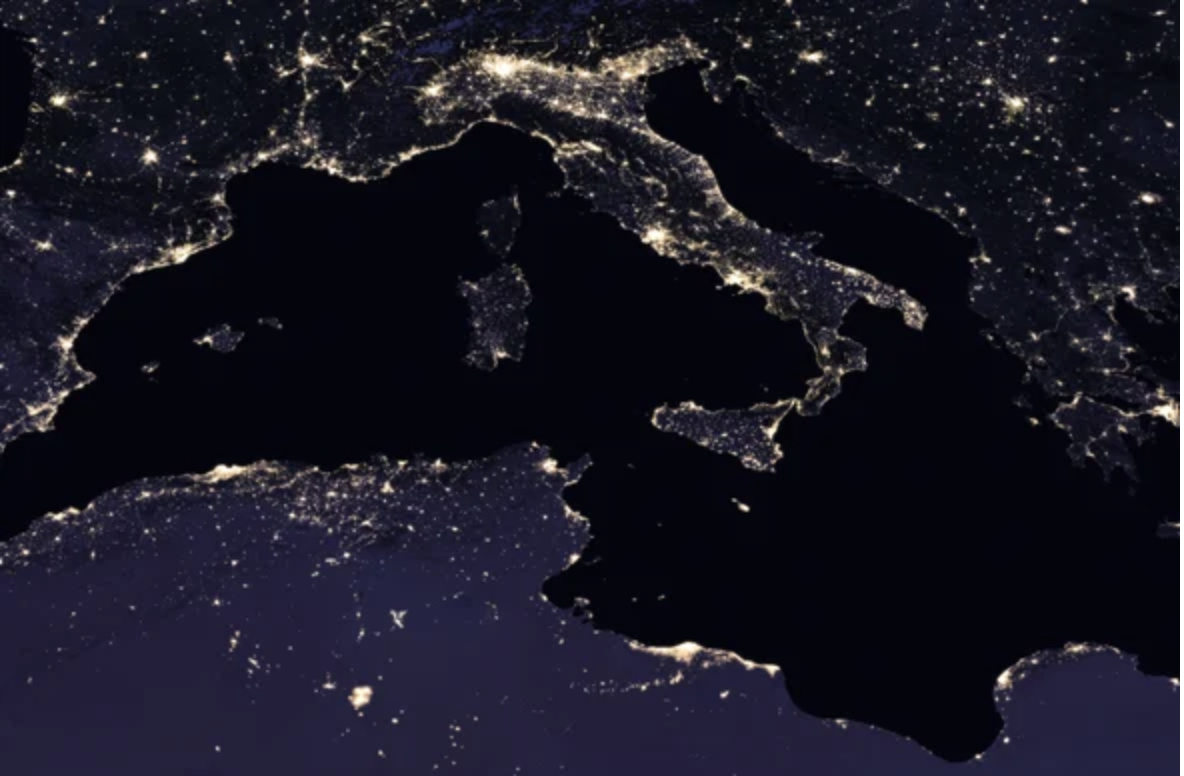
The rumors of transatlantic voyages notwithstanding, it is somehow wonderful to move from the noisy oceans to their landlocked counterparts.
The deep blue sites of relative silence, often confined to the areas close to the coast, may indeed obscure the extent of noise we have created far out at sea, far from the increasingly noisy shore, where we cannot hear their hum. The shifts in the national–as well as the global–soundscape makes one wonder whether, in obscuring some sounds or making other sounds inaudible, one is not changing perceptions of space in ways that the great majority of data visualizations cannot register. But both present us with digitized images of sound-levels so strikingly ever-present that we can almost hear them resonate across space.
Like the deepest blue spots on the sound map of the United States, they mark the rare areas of respite in an every-noisier world.

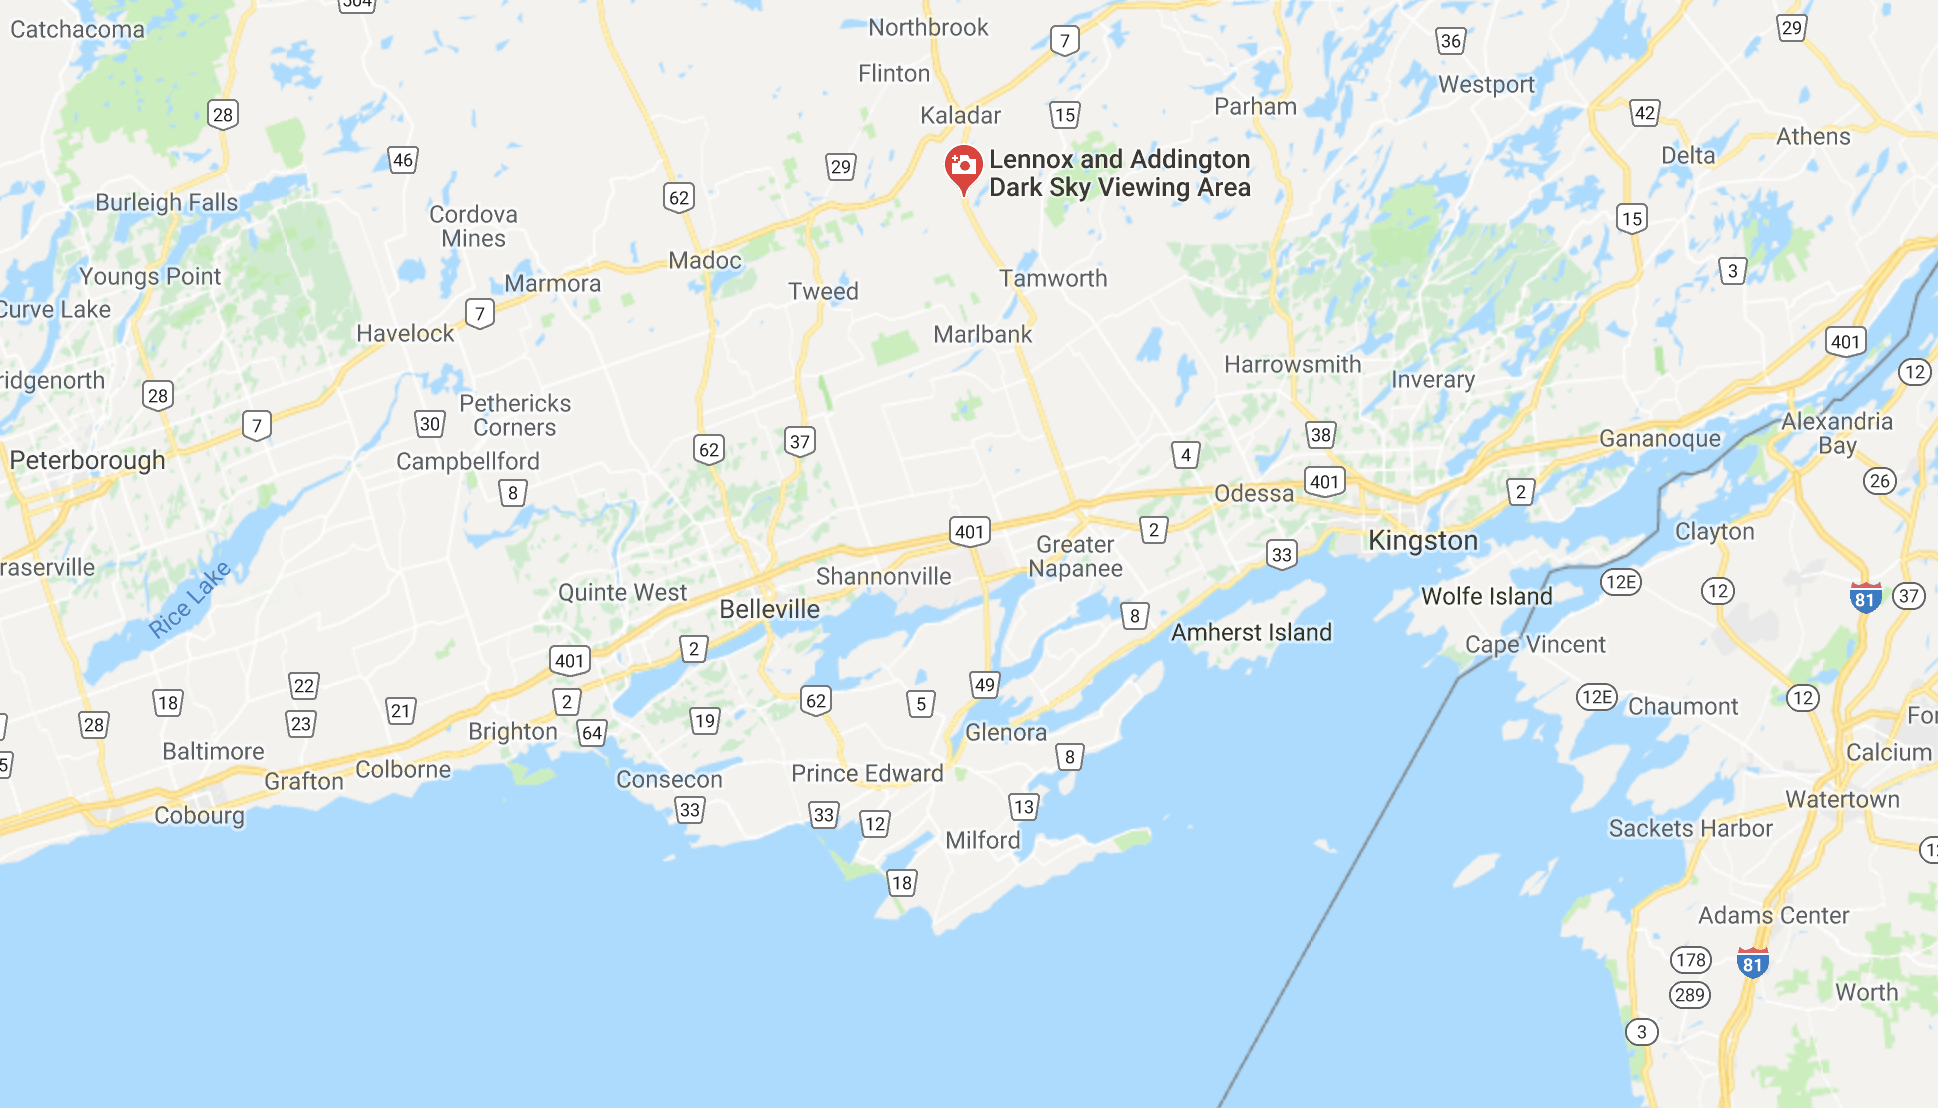
 Lennox & Addington County Dark Sky Viewing Area
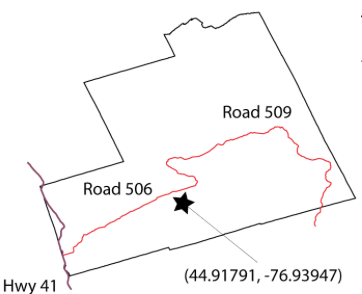
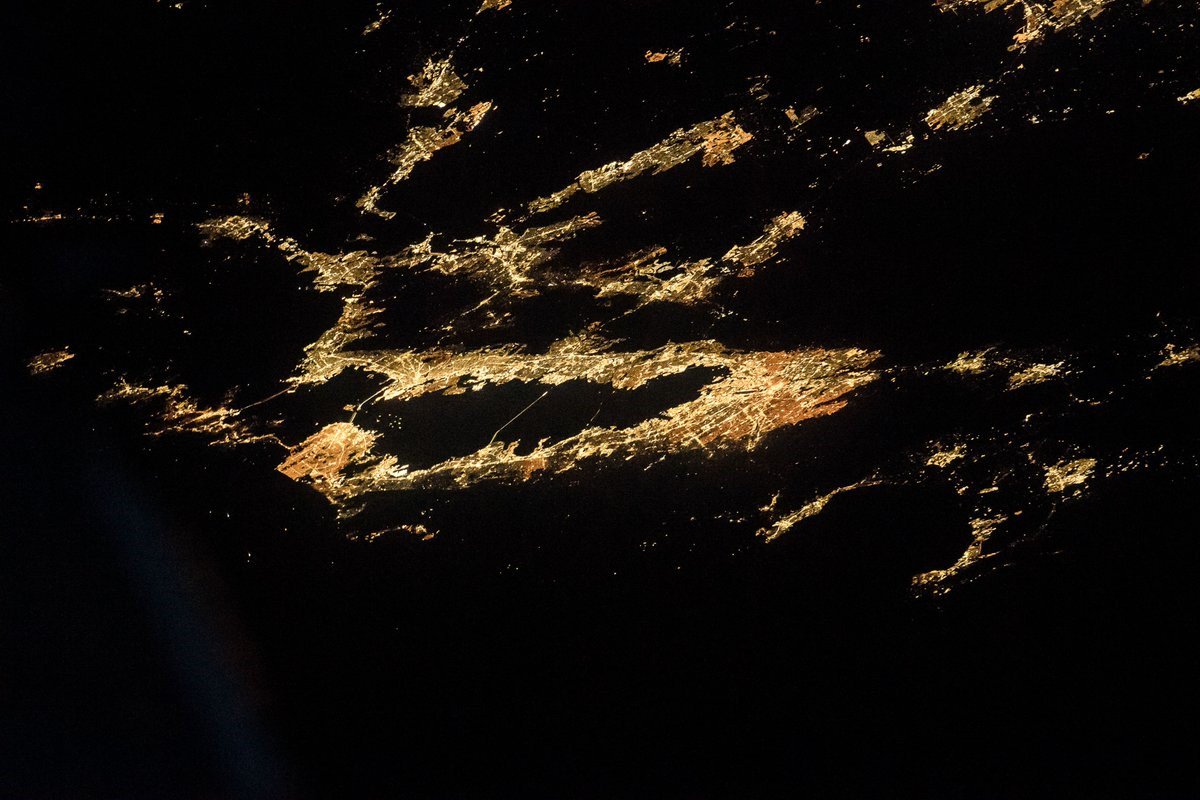 Randy Bresnick/@AstroKomrade
 Ammon and Ryan Bundy/
 Rick Bowmer/AP


