Tag Archives: agriculture in America

The New Arid Regions of the United States

The southwest and states east of the Sierras magnify the effects of global warming in the intensity of their aridity. But global warming reveals a new relation of regions to overheating, and reveals the depths of inflexibility to accommodate water scarcity, as well as the tragedy of its effects. As aridity of the soil and reduction of groundwater reaches unprecedented scales, our passivity is accentuated as we are suspended before maps that try to visualize unprecedented aridity magnified by global warming and its magnifying effects.

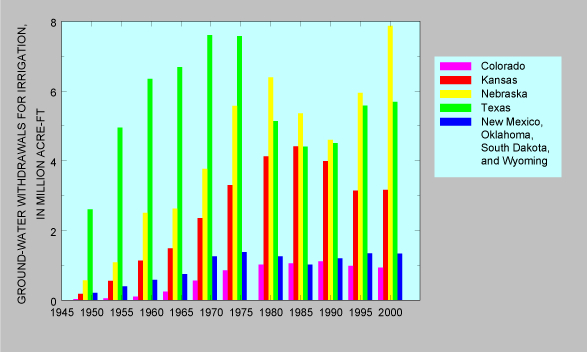
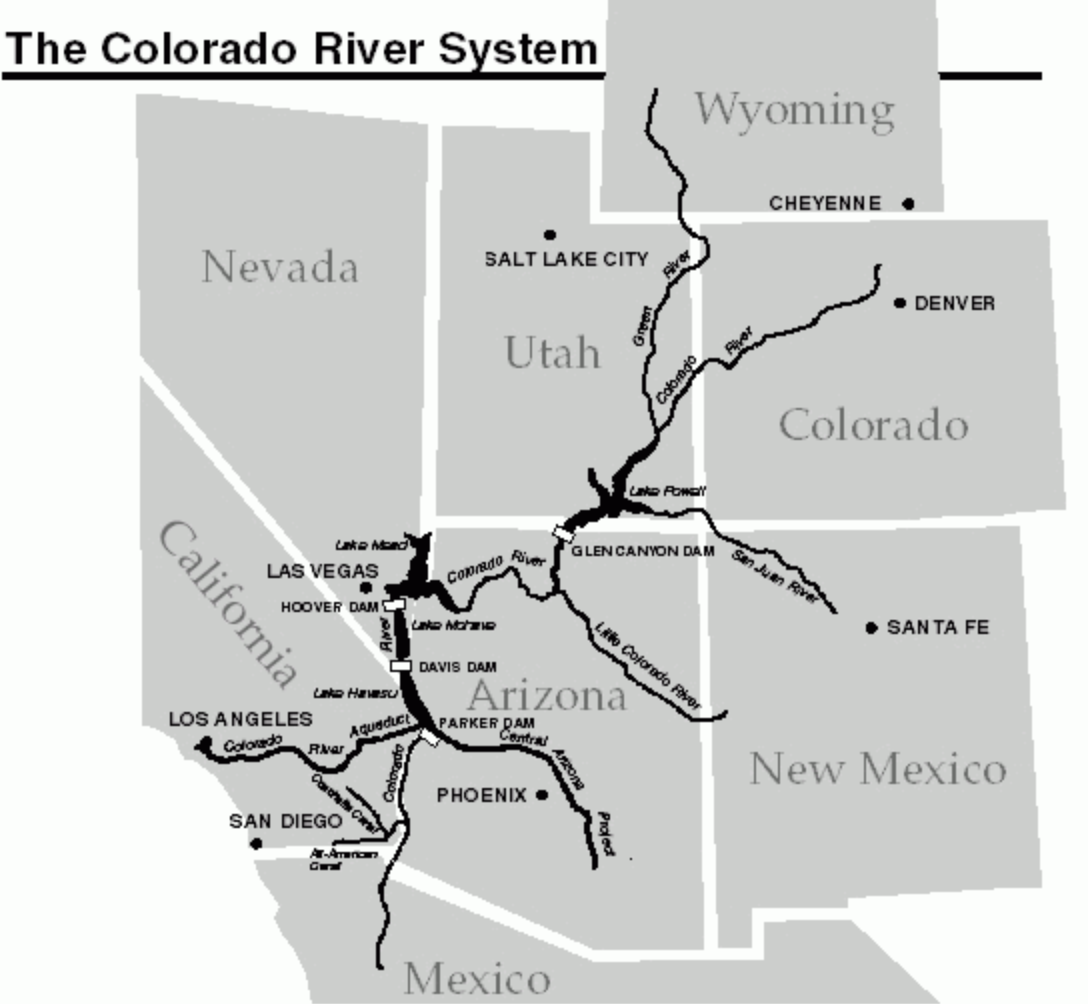
For the cascading effects of warming on the land and environment might be mapped in ways that cannot essentialize the greater “aridity” of the region, but the effects of increased aridity of soil, air moisture, and dry air on a region that we have remade into a region of food supplies, agriculture, and livestock, but, beyond, on hydropower. While the Colorado mountains long provided an effective basin to gather rainwater for western states that have been funneled to state reservoirs for agricultural irrigation, the man-made irrigation networks were drying up as the snowpack determinedly fell, and warmer temperatures evaporated what snowpack fell.

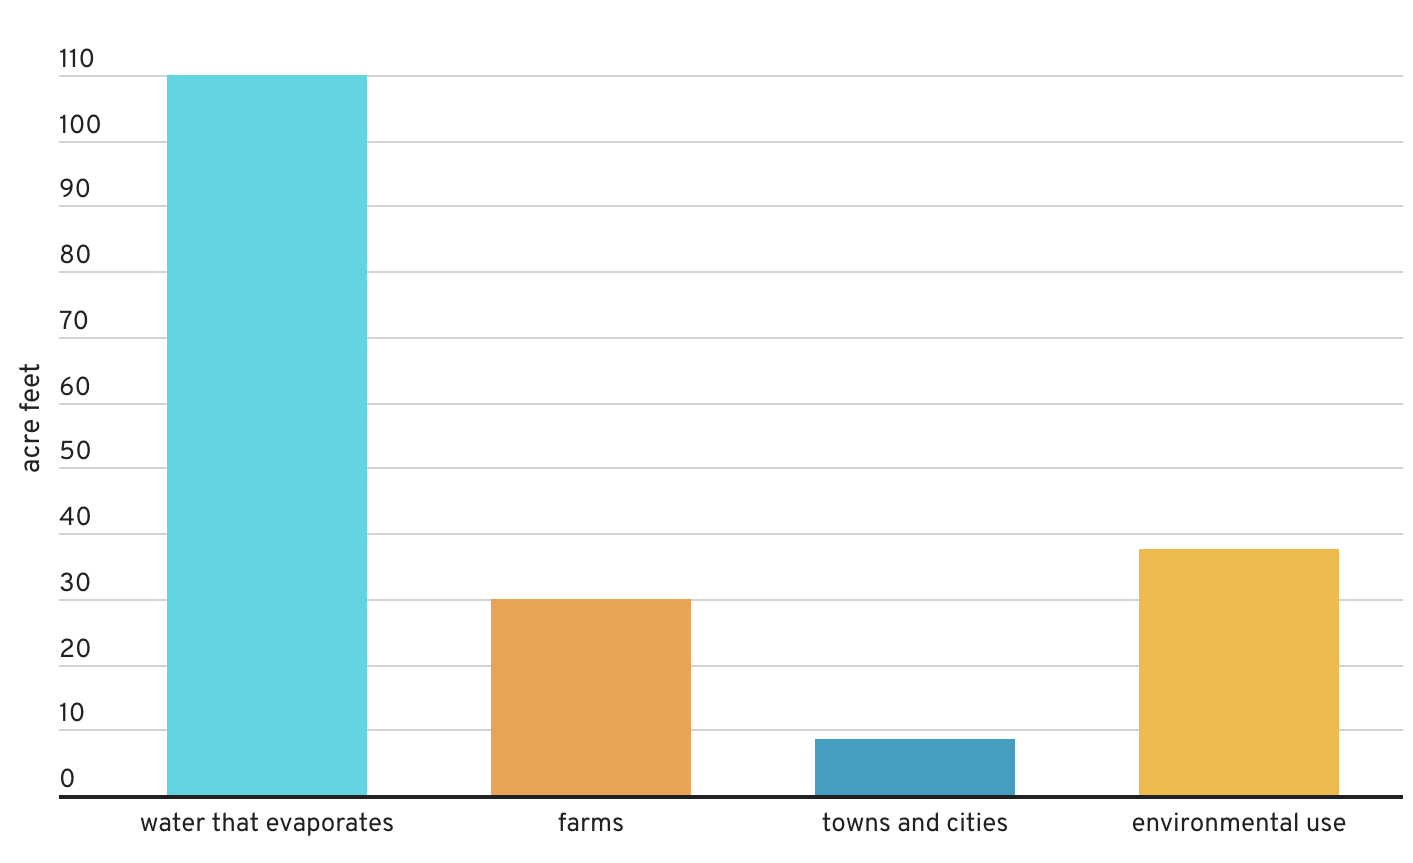
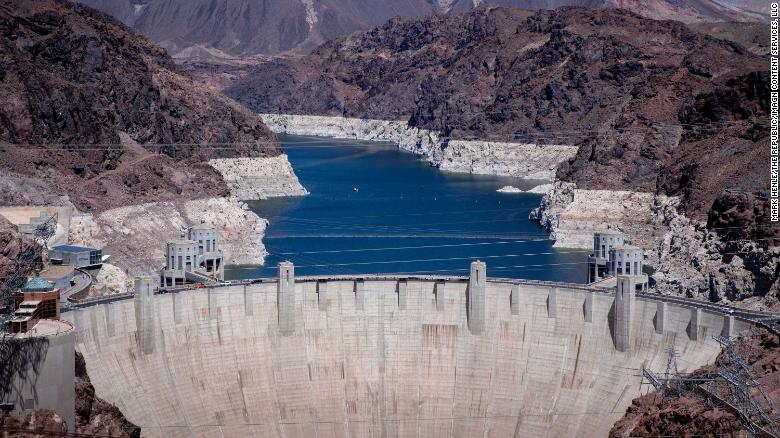
The logic of this longstanding pattern of appropriation of water from across the Colorado Basin was in a sense begun with the Hoover Dam, but was, writ large, organized by very process of appropriating water rights to redistribute water that had been enshrined in California from the turn of the century, circa 1914 and the policies of filling reservoirs to redistribute water rights. While we have considered appropriative water rights a distinct feature of how water is redistributed unique to the Golden state, the appropriation of water rights by reshuffling of water in state’s now precarious supplies how diverts over 99 million acre feet of surface water diverted along the Sacramento and San Joaquin Rivers to farmland, created a powerhouse of national agriculture. Much of the 75 million acre feet that flow from reservoirs across the state evaporates before it arrives at crops, however–far more that actually reaches the farms or cities.

–and the growing heat of the Great Plains have likewise diminished surface flow of the Colorado Basin already reduced by diminished rainfall. The increasingly warmer atmosphere of recent years has created a new “Arid Region” of the United States, of even greater aridity than when it was first mapped by John Wesley Powell in 1890, and the renewed aridity of the region not only challenges the calculus of water distribution according by appropriative rights that is structured by the Interstate Compact, but the very logic of redistributing water.

The past two decades have seen the departure of seven trillion gallons from Lake Mead, the largest reservoir on the Colorado River, holding rainflow from the Upper Basin before it crests the Hoover Dam. The drop will trigger hydrologic stresses across western states, as ever ever-increasing amounts of water are sucked up into drying out air and atmosphere, requiring more abundant irrigation of croplands and grazing grounds. This new and expanded “Arid Region” suggests a return of the repressed, returning at even greater scale and aridity to haunt the nation by a lack of groundwater again.

Evapotranspiration Rates in Colorado River Basin, Landsat 13

that is not to say it ever left. But the solutions of diversion have been undermined by the cascading effects of climate change and increasing temperatures, across an expanse of irrigated lands where water from the Upper Colorado, as from the western slopes of the Sierra Nevada, are funneled to cities, farms, and irrigation projects, and used to generate electricity. Even as Californians and westerners face the threat of further fires more destructive than any in recorded history–potentially enough to energize an implausible recall effort in the state of California–we face the problems of managing not only historic drought, mandated energy shortages, reduced water supplies. The climate crisis appears to have provoked a deep crisis in leadership, but one without easy means of resolution.

The most improbable political candidates–global warming skeptics after Donald Trump’s heart–have argued drought, wildfire, and electrical storms reveal Gavin Newsom’s lack of leadership, even as they stridently object to aggressive climate legislation aimed at emissions reduction as restraining the free market business,– preferring a free market approach for all climes that would be the laissez-faire redistribution of water to the highest bidder, monetizing a scarce resource to consolidate financial profits and gain in response to diminished water supplies.

As more water is being released from Upper Basin reservoirs to make up for the shortfall in Lake Powell, but the shortage of water in Lake Mead–the largest reservoir in the United States–to less than 40% capacity by 2022 will mean reducing water for lower basin states like Arizona of 812,000 acre-feet, Nevada–by 21,000 acre feet, and Mexico, by 80,000, that have led to the call for new “water markets” to be created across the western states. Indeed, even western states no longer carry the brunt of increased use of freshwater for irrigation–

High Country News

–the demand for conserving water in agriculture is increasingly incumbent on western states, so much so that the shift to less water-intensive crops–like California’s almonds–at a time when many crops require more irrigation, and a shift toward fewer acres of pasturage for livestock–good luck–have become a necessity. Increasing the efficiency of irrigation systems is necessary–ending customs of flooding fields, increasing drip irrigation, center-pivot irrigation, or micro-irrigation, in a New Deal for agriculture, even regulating irrigation systems before water markets price rural communities out of their accustomed access to freshwater. The increased trend toward shifting the distribution of water by “water markets” from lower- to higher-value use is dangerous for farmers, and indeed all rural areas, but also for the western ecology, as it would be the most difficult to preserve water in rural communities or farming areas less able to pay for pricing of water for higher use-value, although they currently consume over 70% of the water in the Colorado basin, or encourage sustainability in regions that are increasingly facing realities of sustained drought, if not megadrought of unprecedented intensity.

United Stated Drought Monitor for Western States, October 2021

Yet the systems of allocating water from the Colorado River by a system of dams, diversions, and canals have led to broad calls to end further projects of water diversion, as the diversion of water to western states may be drying up itself by up leads to calls for new policies of allocating water, not based on the highest bidder, as the river we have made increasingly mobile across boundaries will be divided or redivided between agriculture, urban use, indigenous Americans, and land trusts, as we are in need of redefining the working basis for conserving the redistribution of water rights beyond capture and diversion, and outside of existing water markets and appropriative water rights within states. While the Bureau of Land Reclamation has run the reservoirs, dams, canals, and hydroelectric plants and contracting with individual districts, a broad reconception of practices of regulating water markets, allocations of water, and costs of large-scale water diversion, as demand for water outstrips supply.

Yet as increased farmers are withdrawing water from the ground, or from rivers, from California’s Central Valley to the Lower Colorado River Basin, in Arizona, New Mexico, and Nevada, the need to reduce the eighty percent of water dedicated to agriculture across the west will demand new practices of conservation, beyond what John Wesley Powell mapped, in 1880, when he advocated new practices of land use, as climate change increasingly destabilizes the Basin, including the thirty sovereign Native American tribes along the river basin. The need to manage demand and riverflow that will begin with the start of the “Tier One Shortage” from 2022, will introduce new rules on water-use and supply that stand to reduce the amount of water flowing to Arizona by a third. Water diversion from the Colorado River has transformed the land west of the hundredth meridian by re-engineering its flow to make the “desert bloom.” Yet the recent dramatic reduction of rainfall, river flow, and increased aridity of the lands, leave us contemplating the viability of relying on water diversion.

John Wesley Powell, “Arid Region of the United States, showing Drainage Zones” (1880)

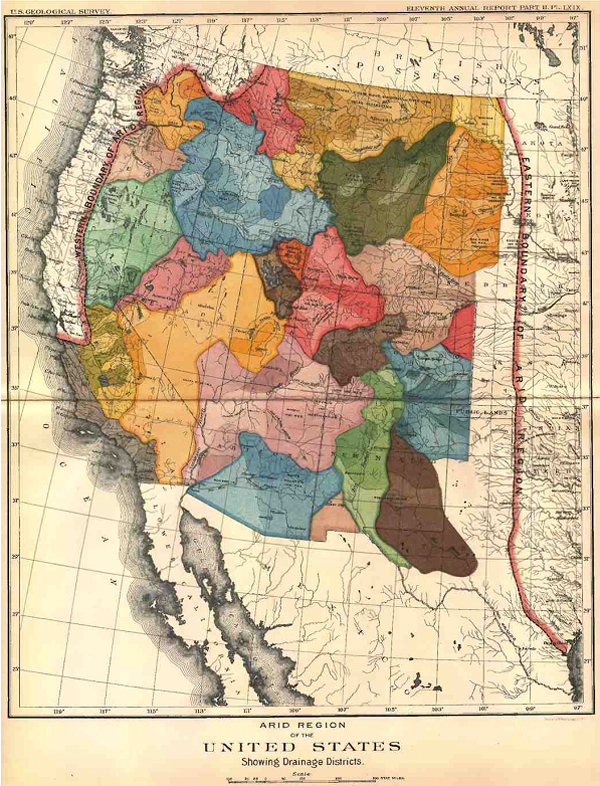
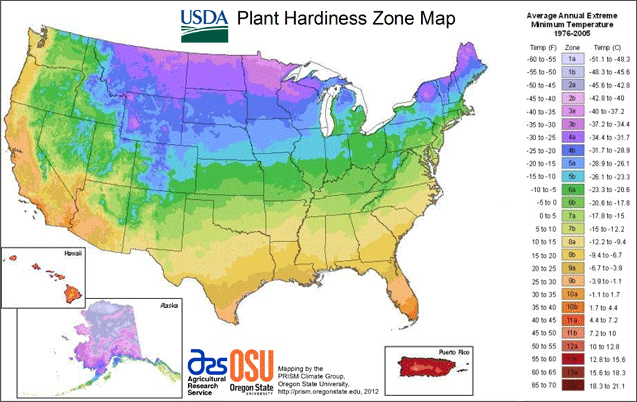
The new arid region is reflected in weather maps, but will be a region of radically reduced piped water and a new landscape of hydrologic diversion. If the “Arid Region” was mapped in earth-tones of clear distinction as a cautionary way by explorer and geologist John Wesley Powell, to alert the government to the distinct climate of lands west of the hundredth meridian, the recent area is both based on more detailed and specific remote sensing records, often from satellite observation, but suggests a far more complex area to manage.

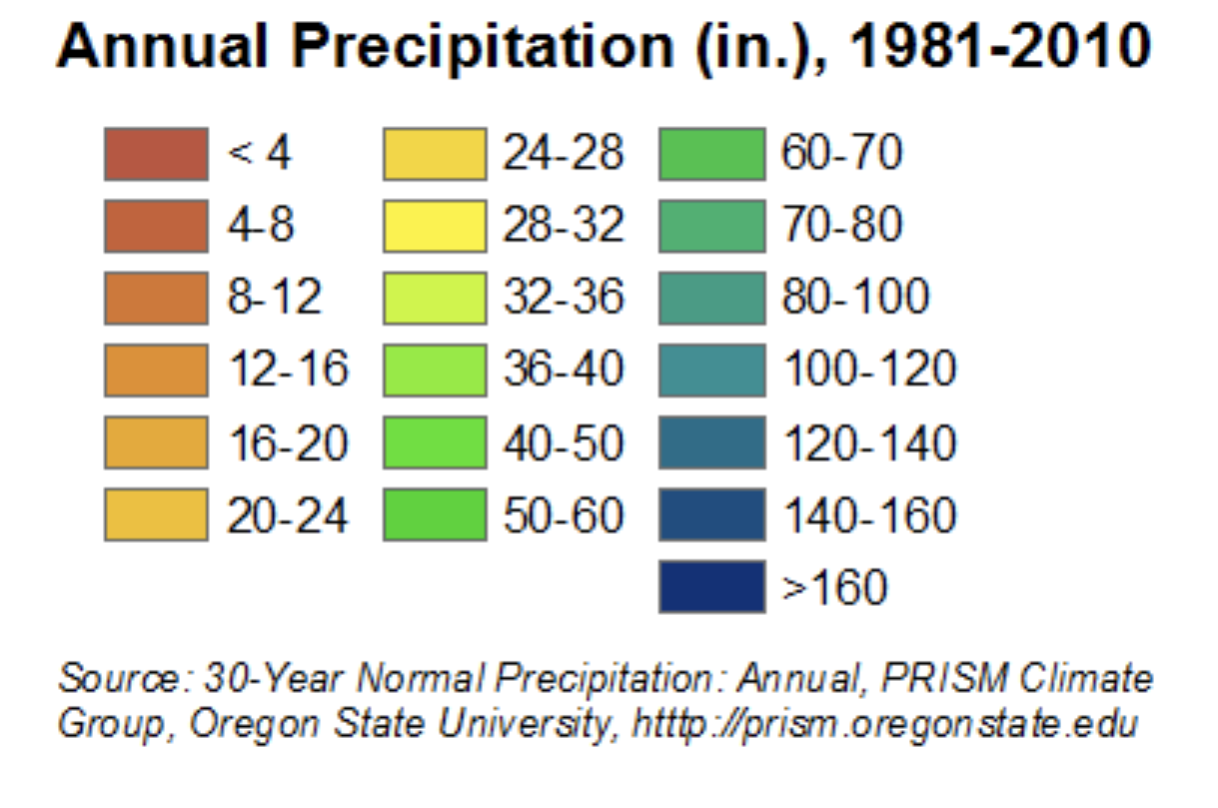
For the western states are linked, both by projects of water diversion, and by hydropower, to a region where rainfall and snowpack has declined, and far less water enters into the river-flow of the rivers whose diversion allowed the expansion of agriculture and livestock across the western states. Due to global warming, the earlier “arid region” expanded, returning bigger and better than ever since it was described as extending west from the hundredth meridian by John Wesley Powell, in one of the foundational maps of climate aridity. In today’s parched California, dangerously low levels of rainfall across the central valley seem to belong to the Arid Region. But we have hardly come to terms with its new expanse or migrating edges. The “lands of the ‘Arid Region'” that Powell had hand-colored with earth-tones to communicate the dramatically falling rainfall west of the hundredth meridian long ago mapped a biting response to the eagerness of homesteaders to Go West, cautioning about constraints on water-rights that division by states–rather than drainage districts–would bring. If current rainfall maps of USDA or EPA seem to engage in dialogue with Powell’s old polemical cry, the limited traction of mapping policy against increased pressures of climate change place most maps in a sort of Scylla and Charybdis, located not in the Straits of Messina, but the scissors of decreased rainfall, rising temperatures, and lack of groundwater retention.

1. The problems of managing water rights and ensuring flow are now far greater than what Powell’s creative palette of before the fact overlays even imaged was able to depict, and was a puzzle beyond the interlocking pieces of drainage districts that he–as if akin to the first puzzle-boards composed of hand-painted maps, as this forty-nine piece puzzle map of ca. 1849, painted by Kelly & Levin, of the similar region, that curiously compressed the western United States. Was Powell’s map indicative of the difficulty of solving the puzzle of allocating water resources across arid western states?

Puzzle “Map of California, Mexico, Texas and the United States,” ca. 1849, Kelly & Levin. Boston MA

While the puzzle pieces rarely echoed the shapes of individual states, undoubtedly because o the difficulty of their cutting the contours of states, the puzzling of how the rivers of the west would align with states in this roughly contemporary 1880 Milton Bradley map-puzzle, an “Outline Map of the United States,” posed by including light blue rivers across a map with little sense of varied topography.

ca. 1860, M. H. Traubel, Lith., Philadelphia PA/American Antiquarian Society

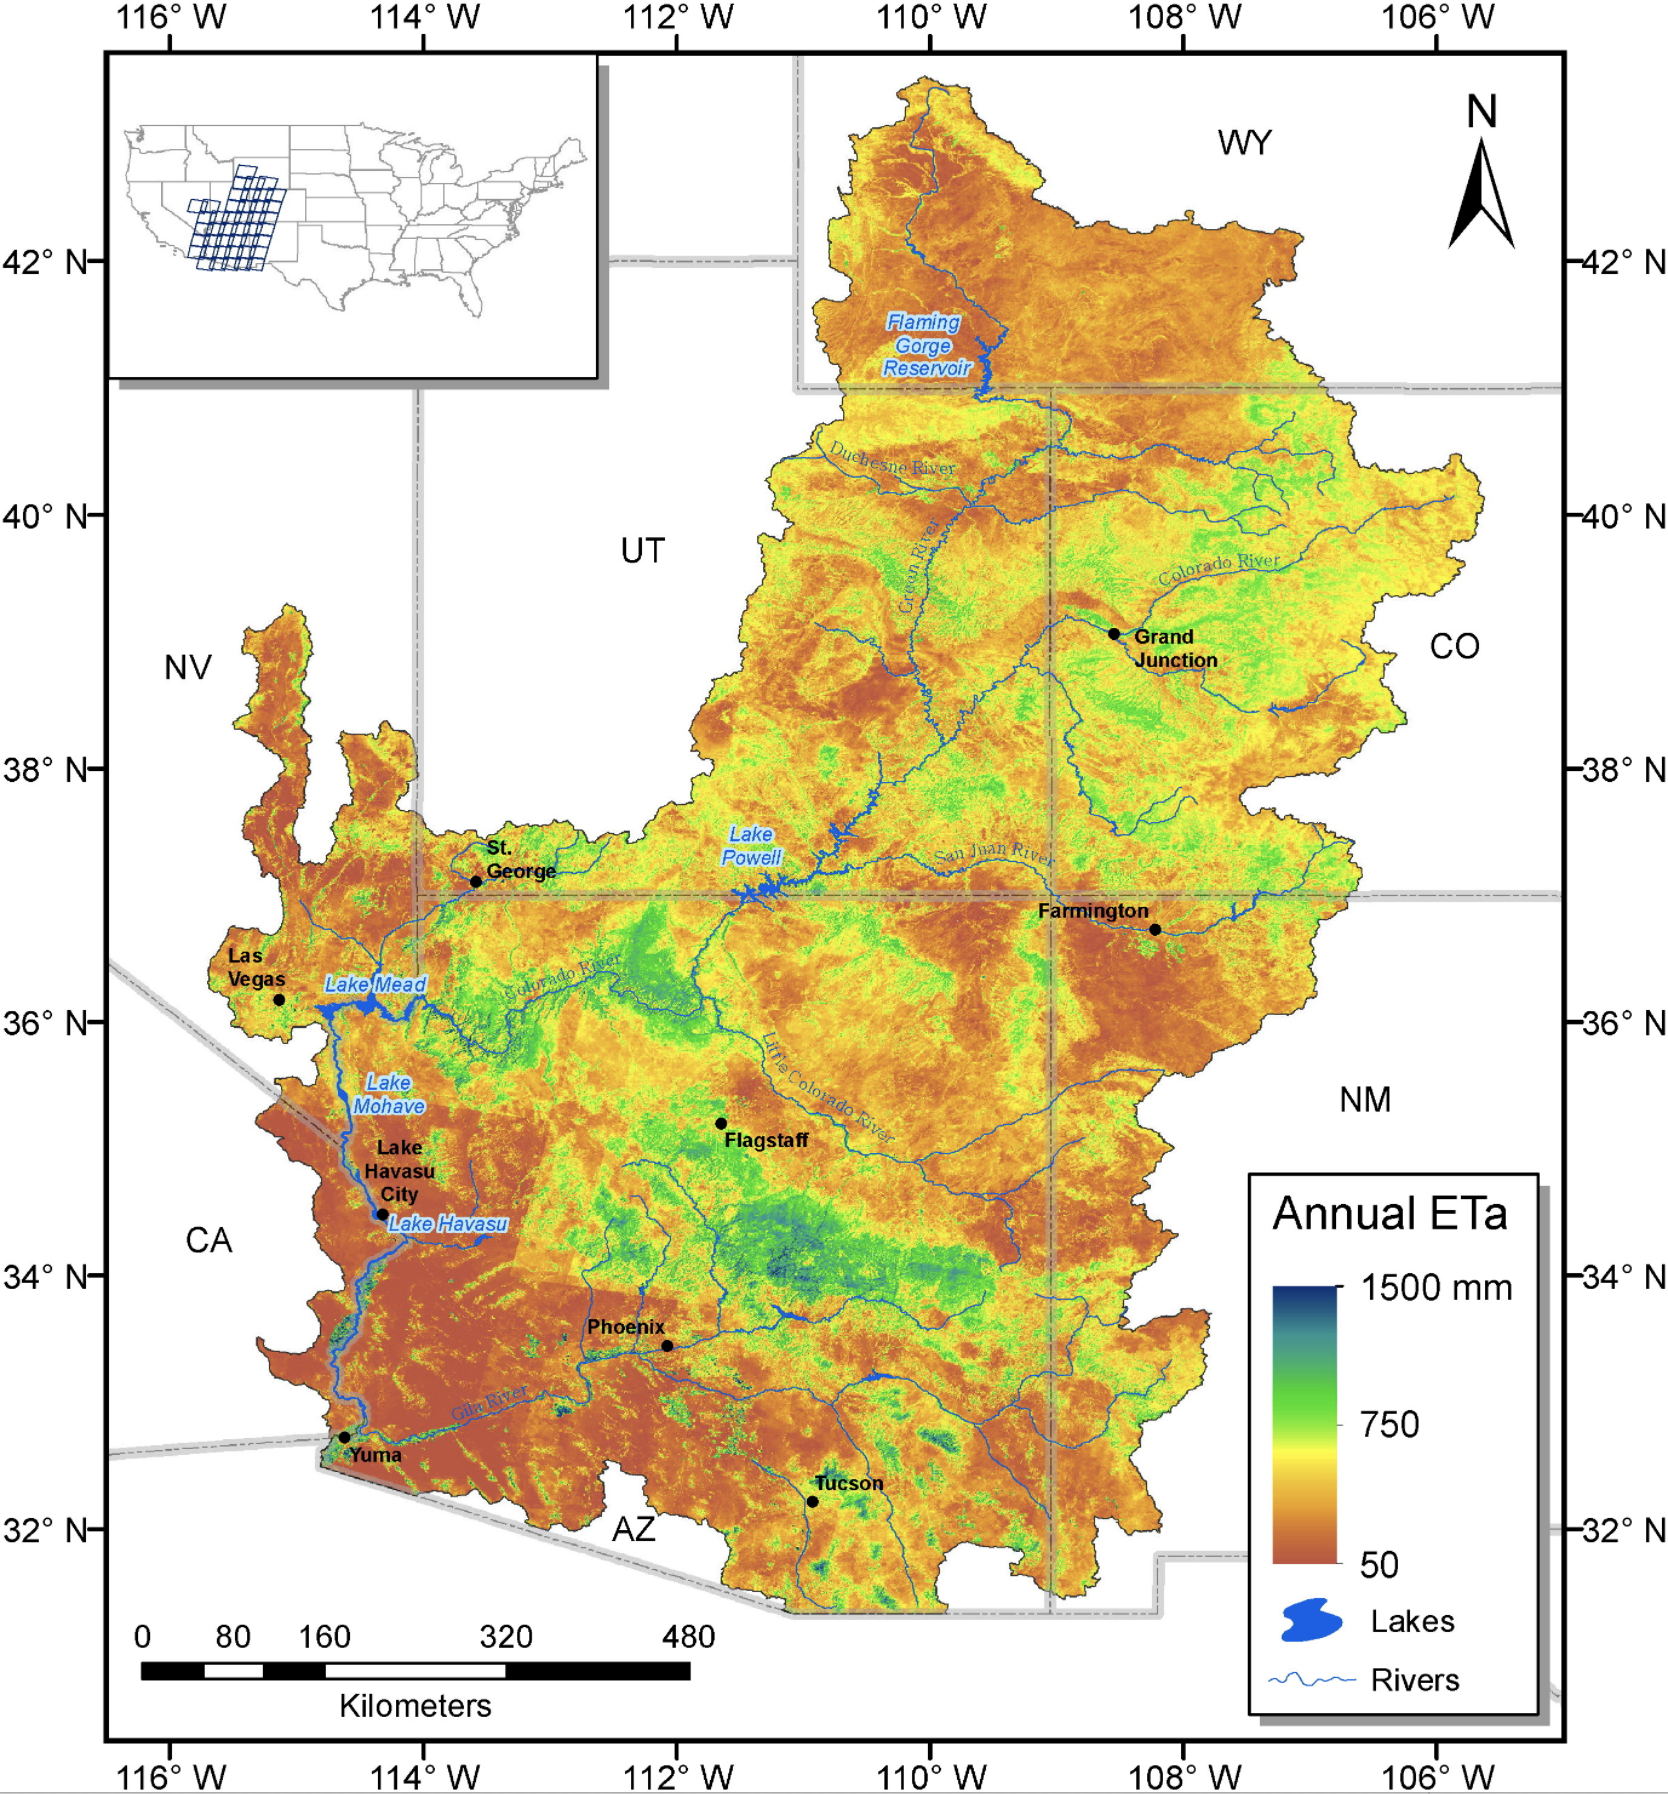
In contrast to the resolution of assembling individual pieces of a map of fixed bounds, the expanded arid region mapped by remote sensing spans a farther territory and expanse, and raises deep questions of access to water or even soil moisture in a region that developed as an agricultural breadbasket and locus of husbandry of livestock.

The growing puzzle broached by how the water supply of the west will be reassigned is rarely faced or addressed, although it is ruminated upon as the sub-text–or super-text?–of terrifying maps of rising aridity and low rainfall across the western states, that magnify a new “arid region” with less clear suggestion of an outcome of land management but pause before the cyclically compounded effects of rising heat, low soil moisture, limited run-off, and the specter of drastic irrigation cuts.

Current remotely sensed maps use far less clearly set boundaries or edges of water-shortages, but pose similarly pressing puzzles of how to resolve the appropriative logic of water rights, as drought intensity reduces the water that once flowed from the “upper basin” of the Colorado, feeding the river and redistributed water, and even more surface water is lost to evaporation.

Snow drought is worsening the American West's water woes | The Economist

The puzzle of hydrological access to land-water has become so curtailed across western states, that increased pumping of groundwater risking depleting aquifers by draining vital aquifers, irreparably damaging rivers and riverine waters. The New Arid Region, afflicted by far more aridity and low soil moisture than at any time, parallel to increased global suffering of warming and increased heat, the persistence of private water “rights” to agrarian expanse stand increasingly on a collision course with global warming throughout the new arid West in ways we have yet to address, even as we recognize that we are facing a climate emergency of the sort without precedent in modern memory.
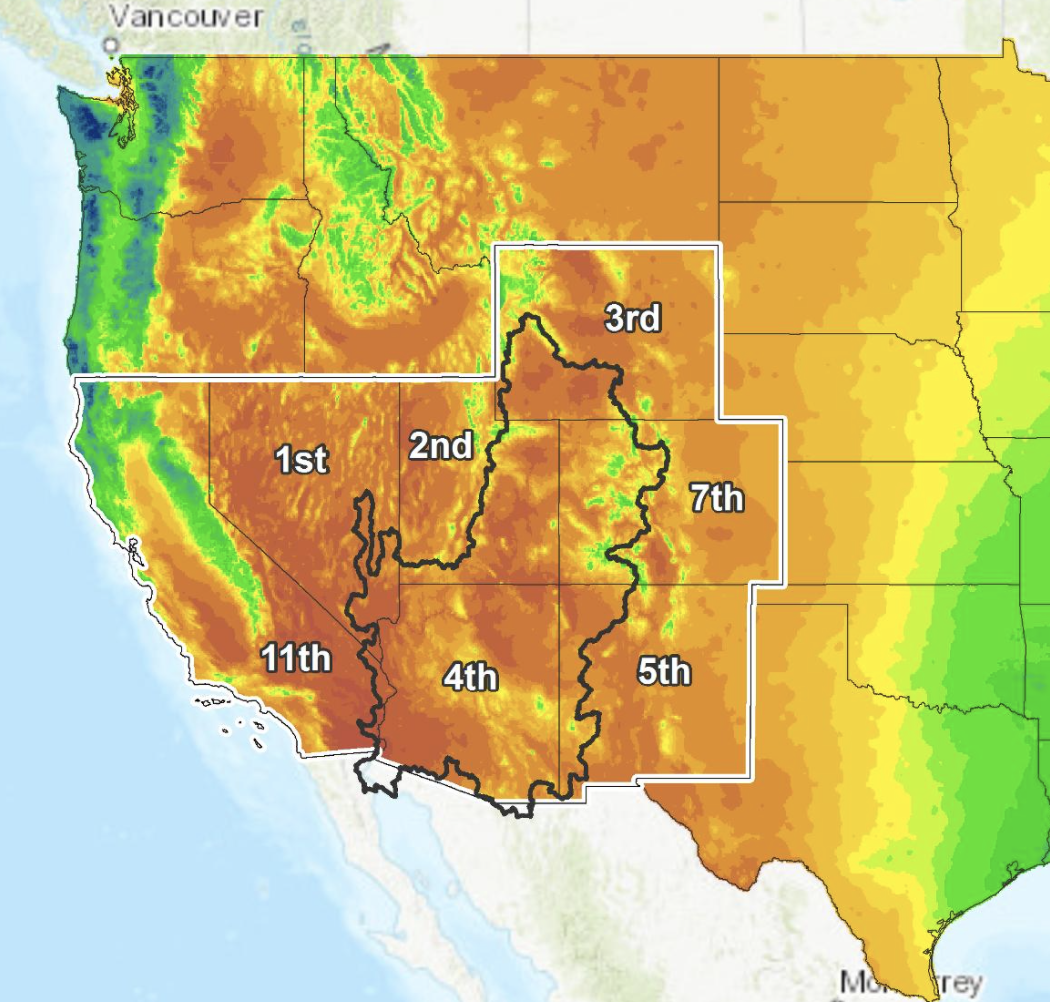
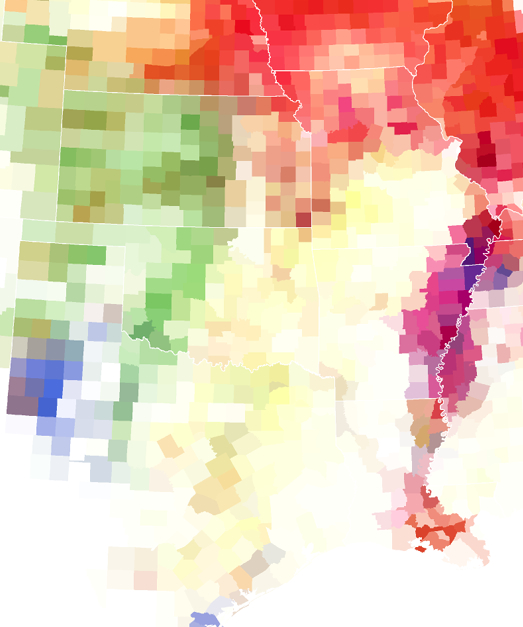
2. No single visualization can, perhaps, adequately come to terms with the unprecedented aridity of the recent years. For no visualization can fully capture the cascading and magnified effects of declining water and soil health, and their effects on ecosystems, as much as on livestock or irrigated crops: the distance from reduced irrigation and new climate specters demands an intensified map. But the terrifying nature of the intense aridity of western states in part lies in how we have seem to forgot the semi-arid nature of the region. The deeper effects of a drying out atmosphere were evident in the huge deficit in water vapor in the past decade during the “fire season” from August to September, dramatically unlike how fire fighters navigated the same terrain in previous decades, when many fire containment strategies were developed and many active firefighters had trained. The map is one that should raise immediate fears of the loss of a landscape of future irrigation, and the need for tightening agricultural belts and shifting our conceptions of food supply and water budgets–as well as the same landscape’s increased combustability and inability to manage or control by an old playbook.

Decreased Water Vapor Present in the Air in Past Decade from Two to Three Decades Previous

The previous month has brought an even more pronounced record of drought across the Upper Basin of the Colorado on which so much hydropower relies, as do other schemes of water diversion.

US Drought Monitor for Colorado River Basin, September 23 2021/Brad Rippey, USDA

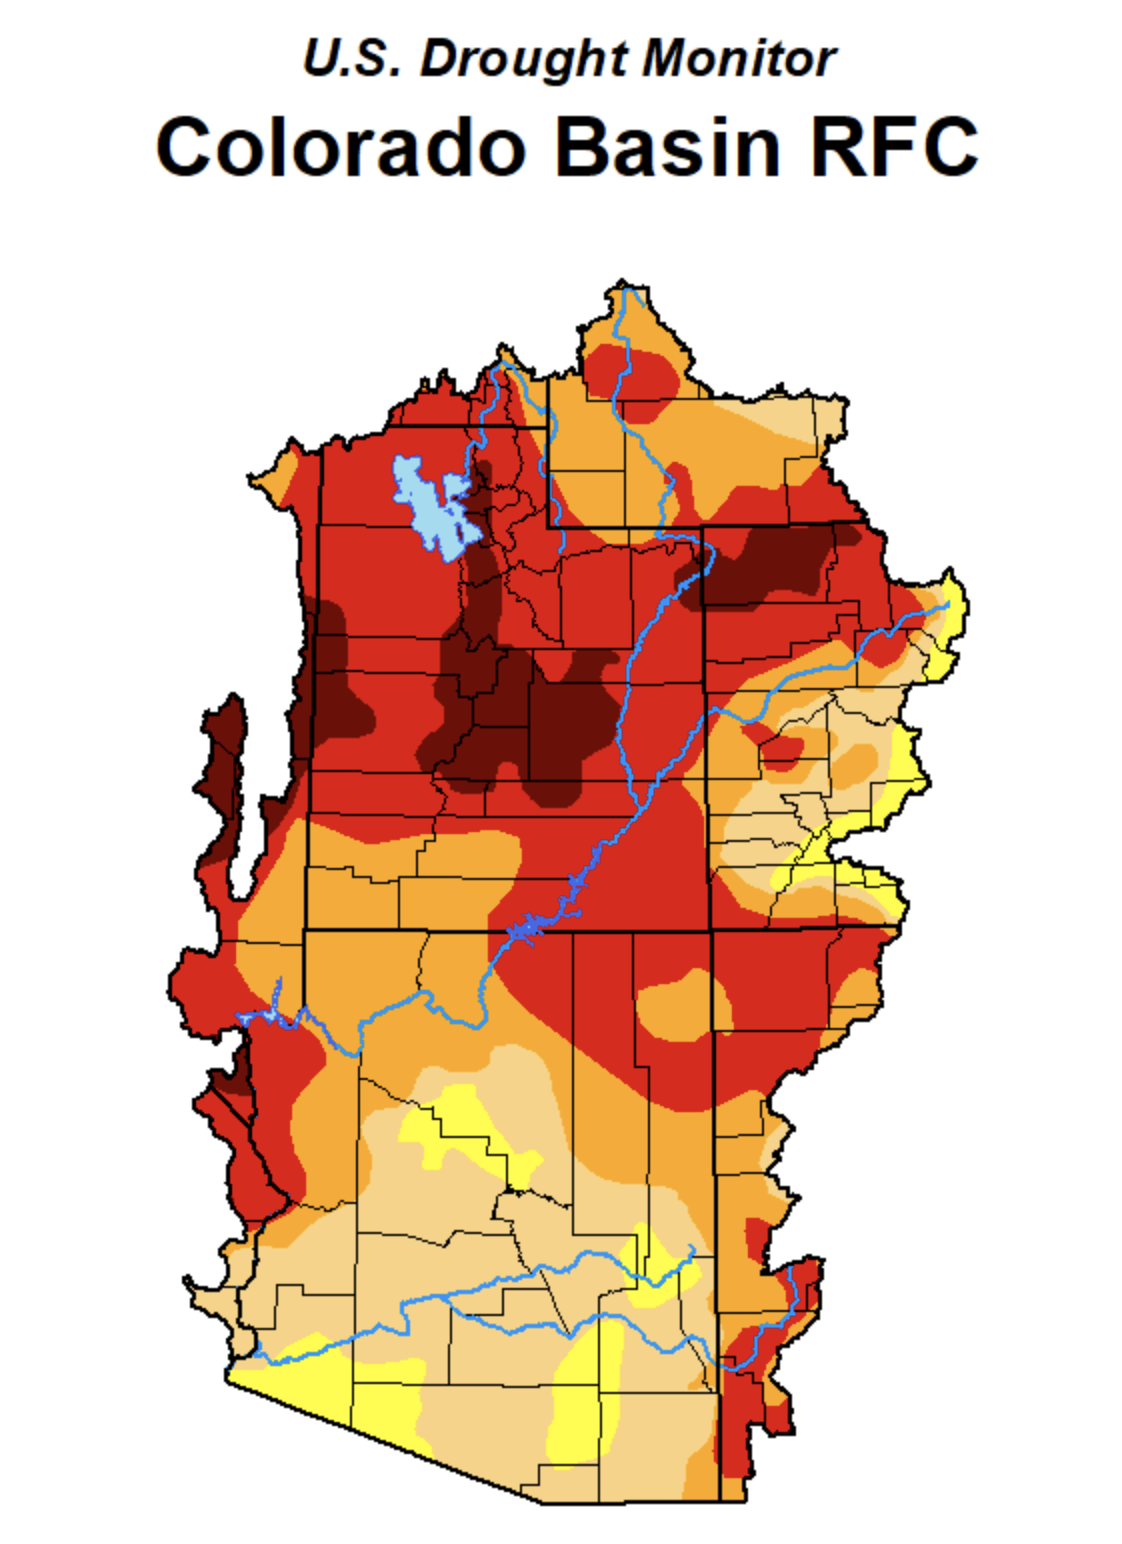
The revelation of a new intensity of exceptional drought in many pockets of the Upper Basin of the Colorado River presses the bounds of how we imagine dryness, aridity, and their consequences, even as we rely on older methods of fire-fighting, and fire-prevention, and outdated models of water diversion and energy resources.

The historical denial of what John Wesley Powell had already called the “Arid Region” west of the hundredth meridian, has become a snare for ecological disaster translating into a process of the drying out of long-irrigated zones, with consequences that the nation has not been able to comprehend–and demand a New Deal of their own to replace the diversion of water and generation of energy in the Hoover Dam. Or have we forgotten the intensity of a differential of climate, soil moisture, and increased aridity that Powell long ago mapped in order to illustrate the new regime of government its unique atmospheric conditions it would require, using his uniquely designed palette to hint at the best way to organize the region of water scarcity according to the units that its drainage districts–rather than the state lines surveyed by latitude and longitude?

John Wesley Powell, “Arid Region of the United States, Showing Drainage Districts” (1890)

Powell had explored the canyons, rivers, and plains, as he addressed the Senate Select Committee on the Reclamation of Arid Lands in 1890, he crafted an eloquent seven-color map of rich earth-tones to impress readers with the sensitivity of the region’s texture and urge restraint for expanding the westward flow of homesteaders with hopes to make the desert bloom. Indeed, by circumscribing areas for which sufficient water in this “Arid Region” would be able to providently allow future settlement, Powell neatly divided areas for settlement in a region by hydrographic basins collecting sufficient rainfall for farming. Whereas rainfall maps of previous years mapped a blank spot of water scarcity, Powell hoped to direct attention by a devising a map of the region’s subdivisions that called attention to its soil quality and decreased moisture, focussing on its distinctly variegated terrain in ways foreign to Senators in Washington. Powell hoped to convince who were removed from the region to acknowledge the commanding constraints created by these drainage districts for all future agricultural development and settlement–an unpopular position that ran against the notion of allocating free land in an age of expansive homesteading. If the image of a “drainage district” was foreign to existing state lines, Powell’s image of an “arid region” long haunted the geography of the American West–and contributed in no small part to the subsequent reengineering of the waters of the Colorado River.

In light of the dramatically increased aridity now endemic to the western states, Powell’s map gains terrifying relevance as western states enter severe drought, placing the breaks on once-expanding developments across western states. Powell’s map articulated a historical vision of the limited infrastructure of water in the American west. While the technologies of irrigation that allowed such a massive project of damming and canalization only later developed, did his map inspire the need for a project of such scale as a better model of land management? The intensified aridity that afflicts the western states responds not only to low levels of rainfall. We continue to hope groundwater depletion that afflicts the lower basin won’t extend to the Upper Basin of the Colorado River that has captured water on which so many farmers rely–and thirty-five million north of the border and three million living in Mexico depend, across its Lower Basin. The escalating megadrought has created pressures across the overpopulated west that the water-sharing model Powell proposed for drainage districts cannot resolve, but the distinct forms of water management he advocated have been forgotten, as the declining water level on the Colorado River seems a time bomb as its waters have fallen so far below capacity that while the waters that drain from the Upper Colorado into Lake Mead, the largest reservoir in the western states, are only 37% full, and Lake Powell stands at 34% capacity. As less and less water enters the river system of a drying-out west, the future of the river on which so many rely for irrigation and energy is all but uncertain.

The water-level of Lake Mead, the largest reservoir in the US and a critical source of water for millions across the Southwest, has fallen 140 feet since 2000, a third of capacity.  Can we come to terms with the increased aridity across the west that the drying out of the Colorado River may bring?   The western states are haunted by the return of the "Arid Region" John Wesley Powell once mapped.
Lake Mead, May 2021

Demand for water in the upper basin and older technologies have meant far less water reaches the lower basin, but what does has been redistributed across western states–absolutely none reaches the ocean at the river’s old delta. Supplies of surface water and groundwater barely provide for the border region, as the overdraft of the basin’s aquifers have made trans-border water management a crisis often overlooked in favor of water management north of the border. As unprecedented soil aridity currently seems to run off the rails, after three summers of no rainfall have depleted soil moisture, may remind us how we have missed the lesson of Powell’s map of instilling new set attitudes toward the land, as the volume of riverflow consistently dropped as it crosses the Mexico border since the filling of the Glen Canyon Dam.

Does selective amnesia underlie how we map the drying out of the west? Most data vis of rising temperatures and low rainfall across the western states is already magnifying and escalating the effects of unprecedented heat over twenty years in a deeply melancholic vein, daunted by the scale of dryness across such an interstate expanse, and passive before an absence of atmospheric moisture that seems a modern casualty of global over-heating. If we were already “living in the future” in California’s frequent and increasingly extreme fire regimes, the multi-hued data visualizations electrify the landscape–and not with power or hydro-energy, but by the all-too familiar color ramp of the extremes of climate change we have been trying hard not to normalize. These images chart a landscape that has gotten away from us, outside seasonality changes, making the American West a cautionary case study for global climate change inspires melancholy.

The additive logic and graphic syntax of maps, long before the separate map-“layers” that accommodate information from GPS, provided a basis to define the fungibility of water and the emergence of “rights” to water across the Arid Region, enabling the idea of governing the transference of water and water “rights” across the region, that separated water from the landscape and environment. The flow of water had long been understood and reconstrued in the west by a logic of irrigation needs–and the “rights” to unpolluted water for livestock raising, pasturage, and agricultural needs of land owners–that was removed from conserving groundwater needs. The increased nature of the fungibility of water as able to be transacted across basins, state lines, and counties reflects the legal fiction of considering water as a “good” tied to the needs of property owners, that, long before global warming, had already sanctioned the removing water from the ground.

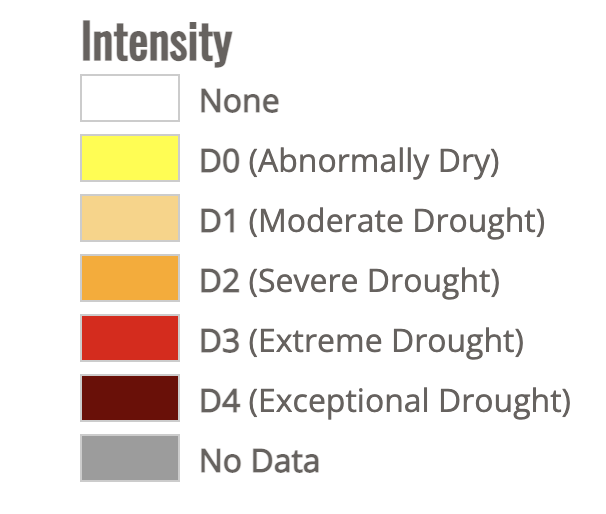
If we use metaphors rooted in temporality that try to come to scale with the new era of global warming that cut down and perhaps minimize the era of water scarcity. in which we are entering–“heat waves,” for example, that broke records in states from Washington to Idaho in June and July, breaking or matching records of hot temperatures, the levels of aridity that have allowed the ground to grow arid and degrade have not only led to a spate of western wildfires, but have changed the levels of soil moisture over the long term in ways we have difficulty to map in the scale of our weather maps, or even the maps of the U.S. Drought Monitor, as the cascading influence of such unprecedentedly dry conditions–where stresses on river water create extraction of groundwater that stresses aquifers and groundwater supplies–can be scarcely imagined, or confined to the conventions and color ramps of weather maps.

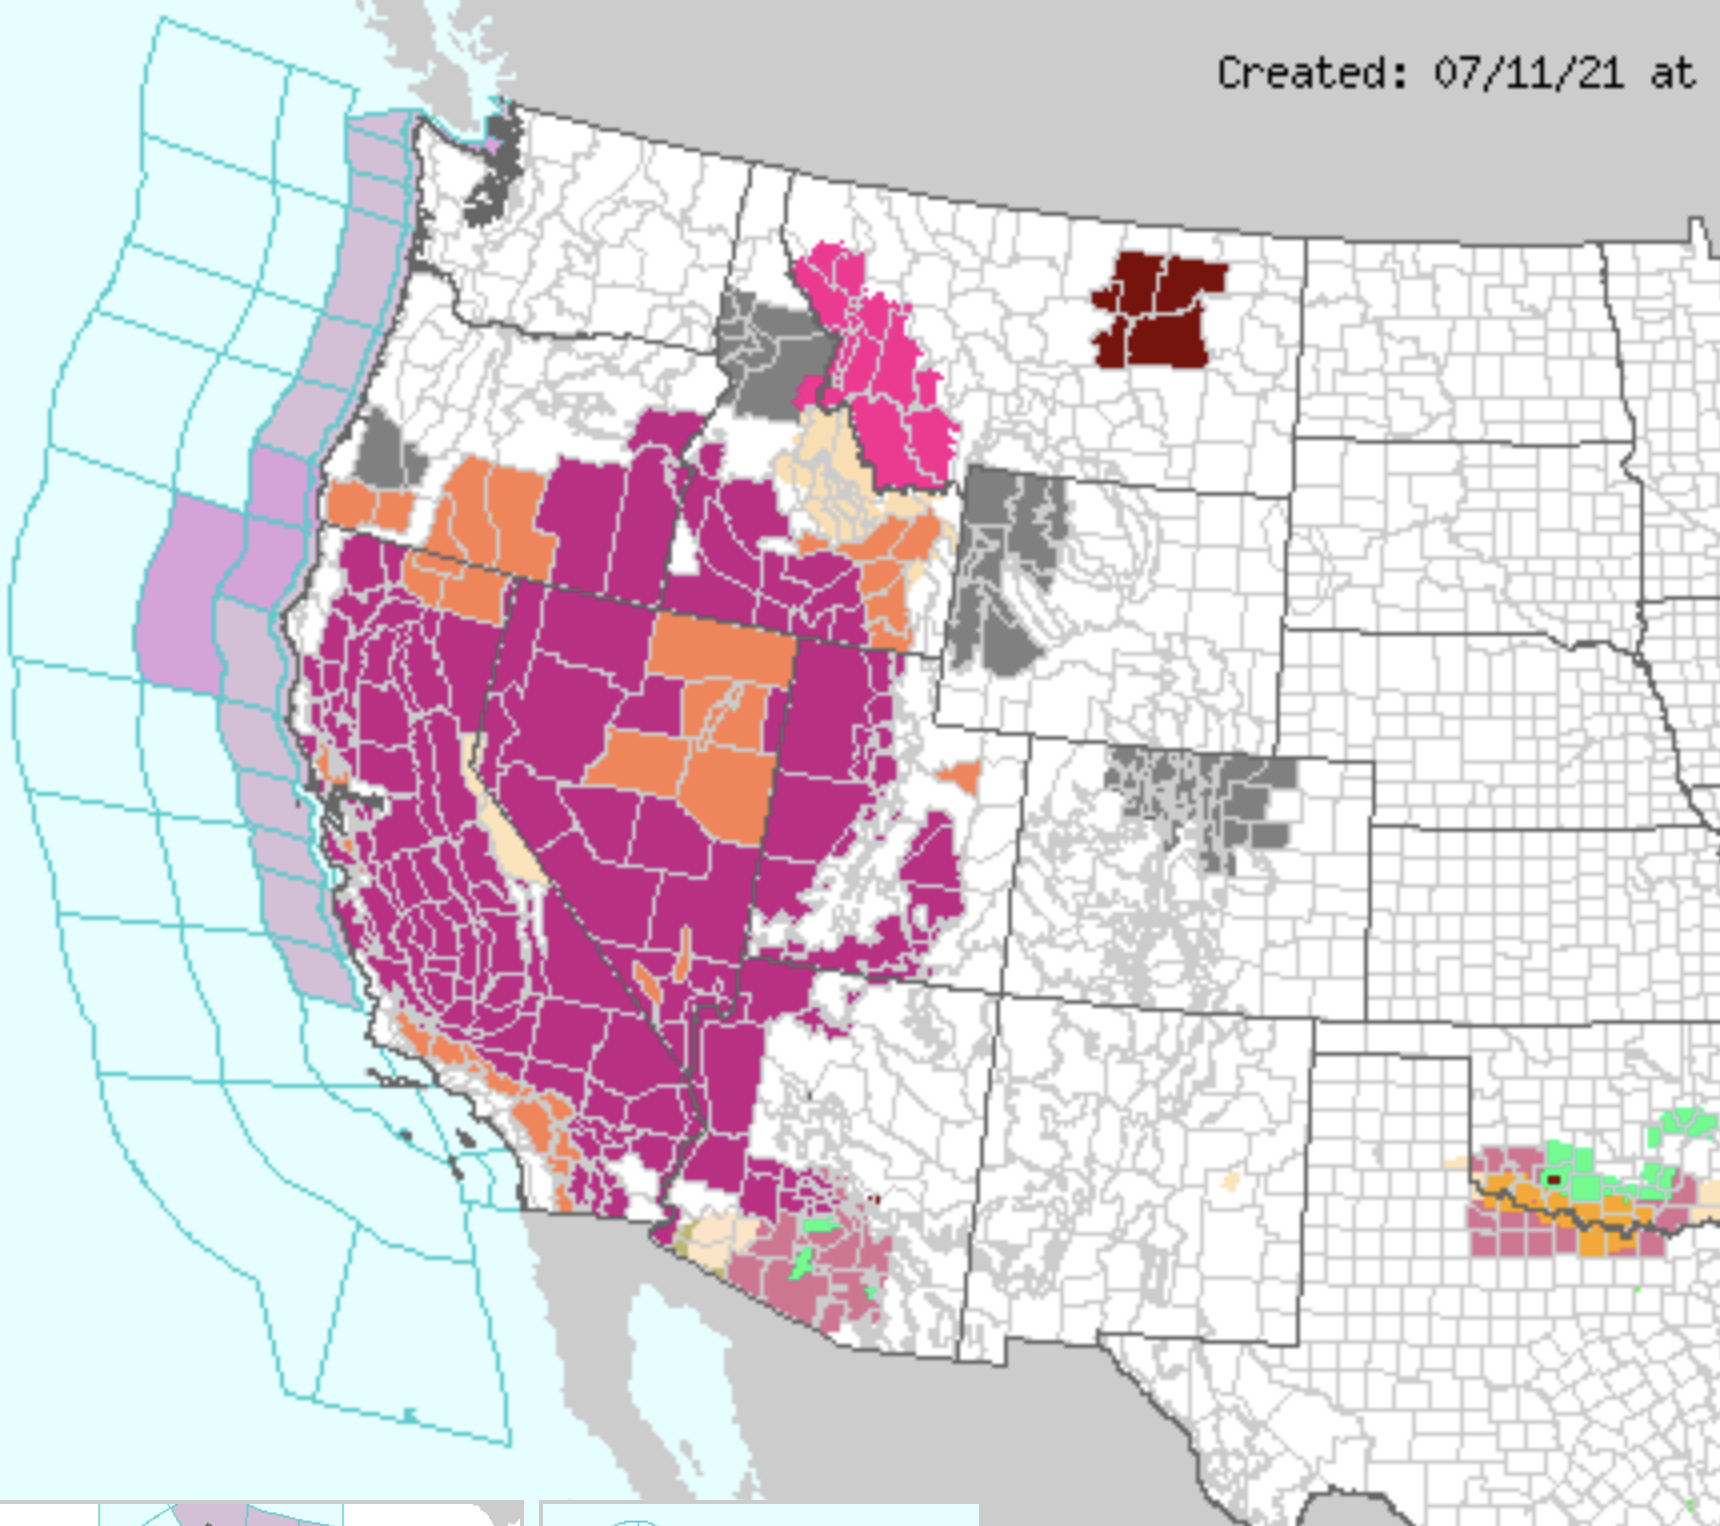
We have struggled for decades to process the cascading effects of waves of unprecedented heat that over time have produced a drying out of soil and reservoirs over the past twenty years, resulting in an expanded and far more destructive fire season and parched lands whose effects we cannot fully come to terms or comprehend, as we have not seen or experienced the extent of dryness of subsoil, soil, and low rainfall which the US Drought Monitor seems to have mapped, as drought expanded not across the entire Pacific Northwest, from Oregon to Idaho, or 86% of Idaho–by the land’s combustibility, impossible to read without premonitions of lost forests–including old growth forests–melancholic fears more than tinged by an acute sense of a lack of agency.

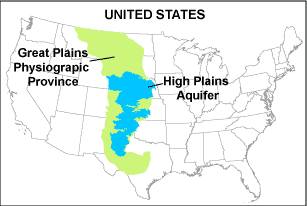
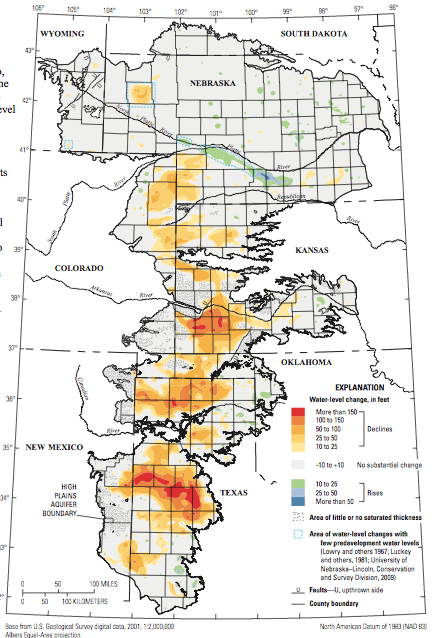
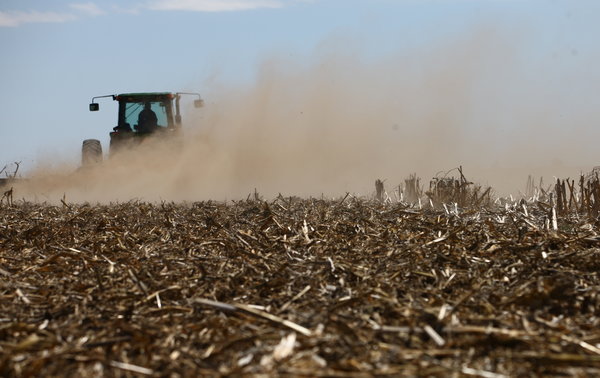
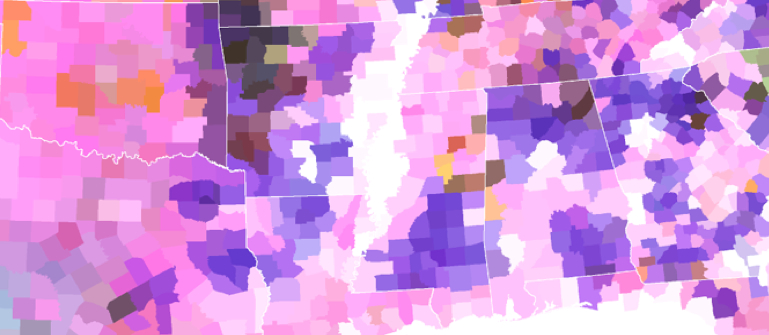
The sense of struggle with an absence of agency–at the same time as an almost moral urgency–reflects the difficult to process such absence of water as a landscape we have inherited from the rapidly accelerating dynamics of climate change. The history of the increased aridity is all the more poignant as a source of melancholy not only because exceptional drought was the standard before President Trump, and a national emergency before his Presidency. We have failed to register this national emergency with the same immediacy, even as the theater of the border was magnified in disproportionate ways in public discourse on migration. The sense of melancholy is compounded as the map seems haunted, if only tacitly, and perhaps without acknowledgment, by the fact that the head of the USGS in 1890 admonishingly illustrated virtually the same basins now suffering severe and moderate drought as distinguished by semi-aridity–if the current levels are nothing like those faced over a century ago, when the transition of public to private lands. We have recently mapped the substantial threat of increased aridity to the Great Plains–less than a tenth of whose croplands are irrigated–where farmers depend entirely on rainfall to grow soybeans, sunflowers, cotton, and winter wheat, the fear of greater “dry spells” as anthropogenic emissions drive decreasing rainfall and groundwater reserves–a term that tries to convince us they are not permanent–led red flags to be drawn in broad brushstrokes in those states, where extreme and exceptional ‘drought’ .
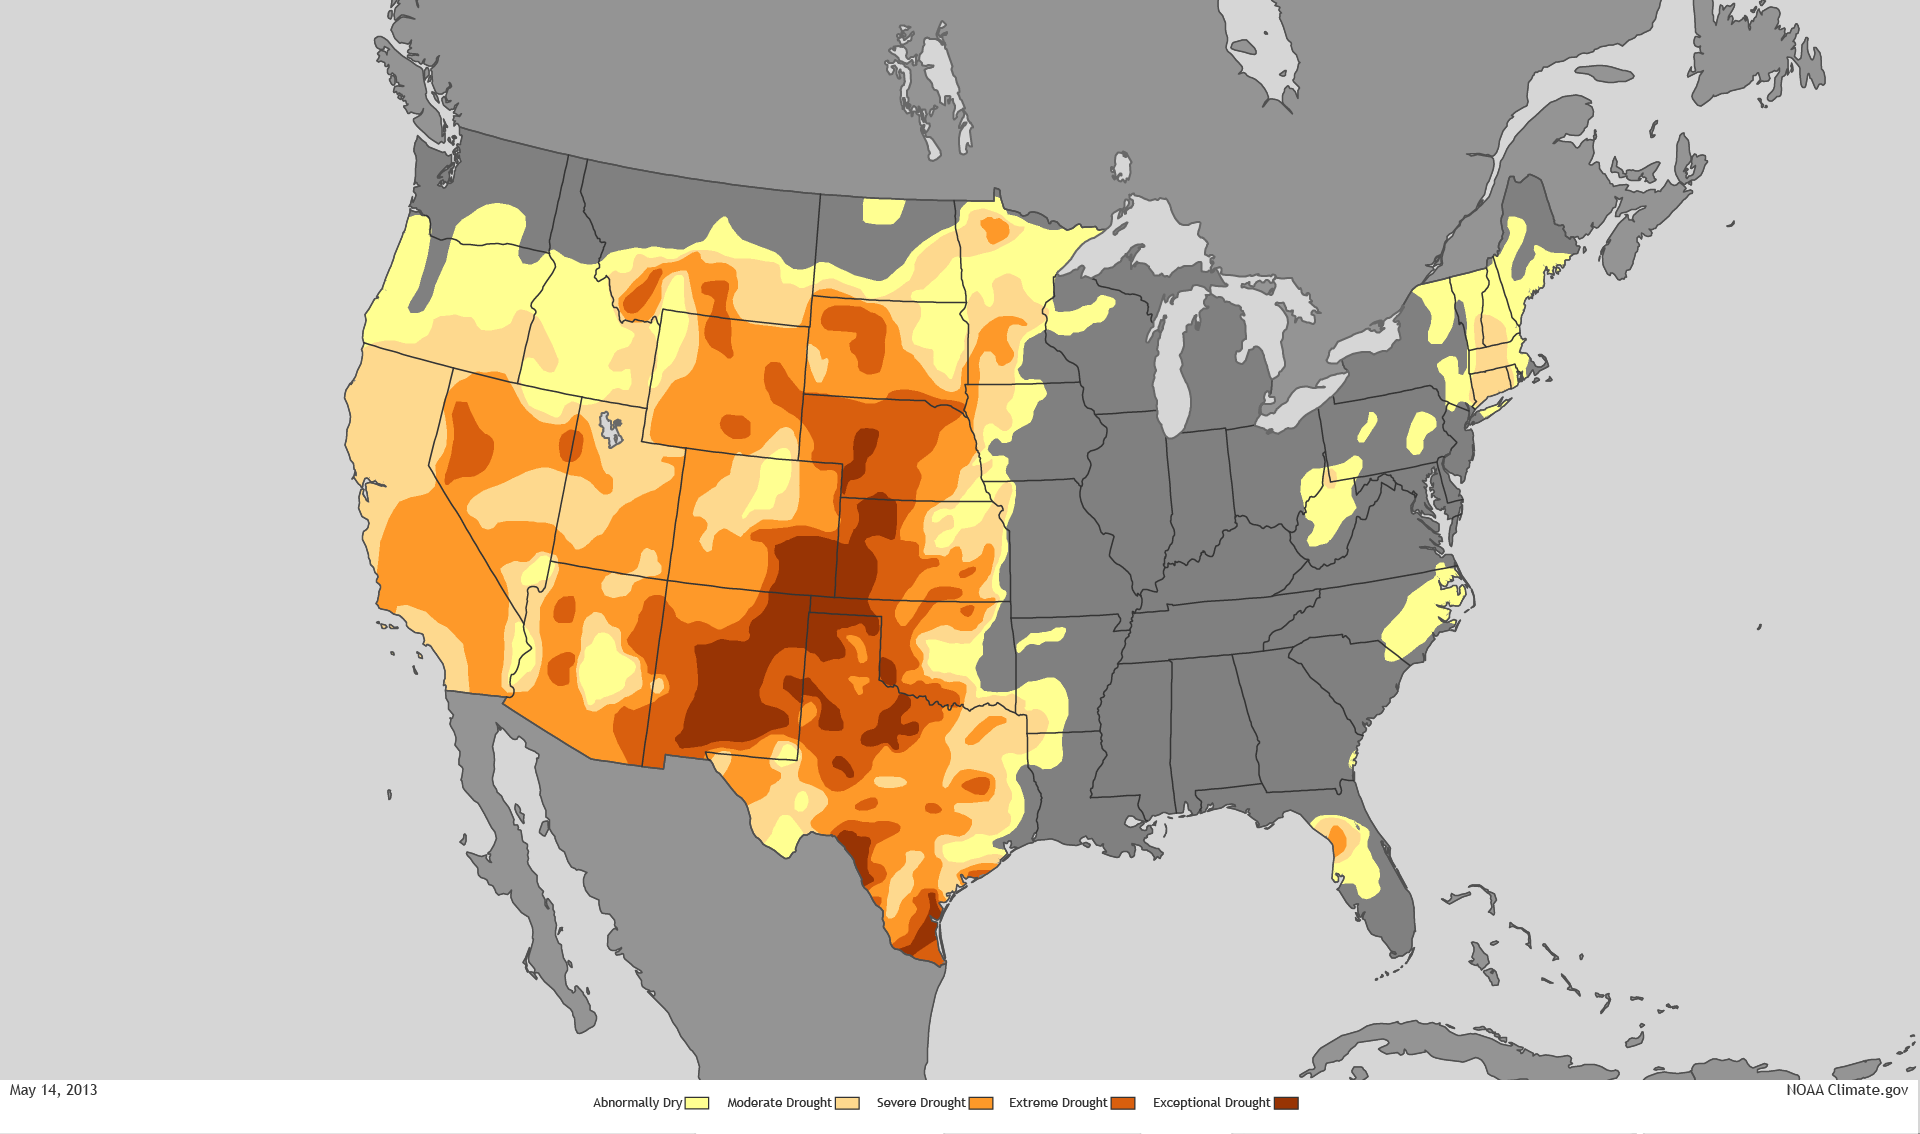
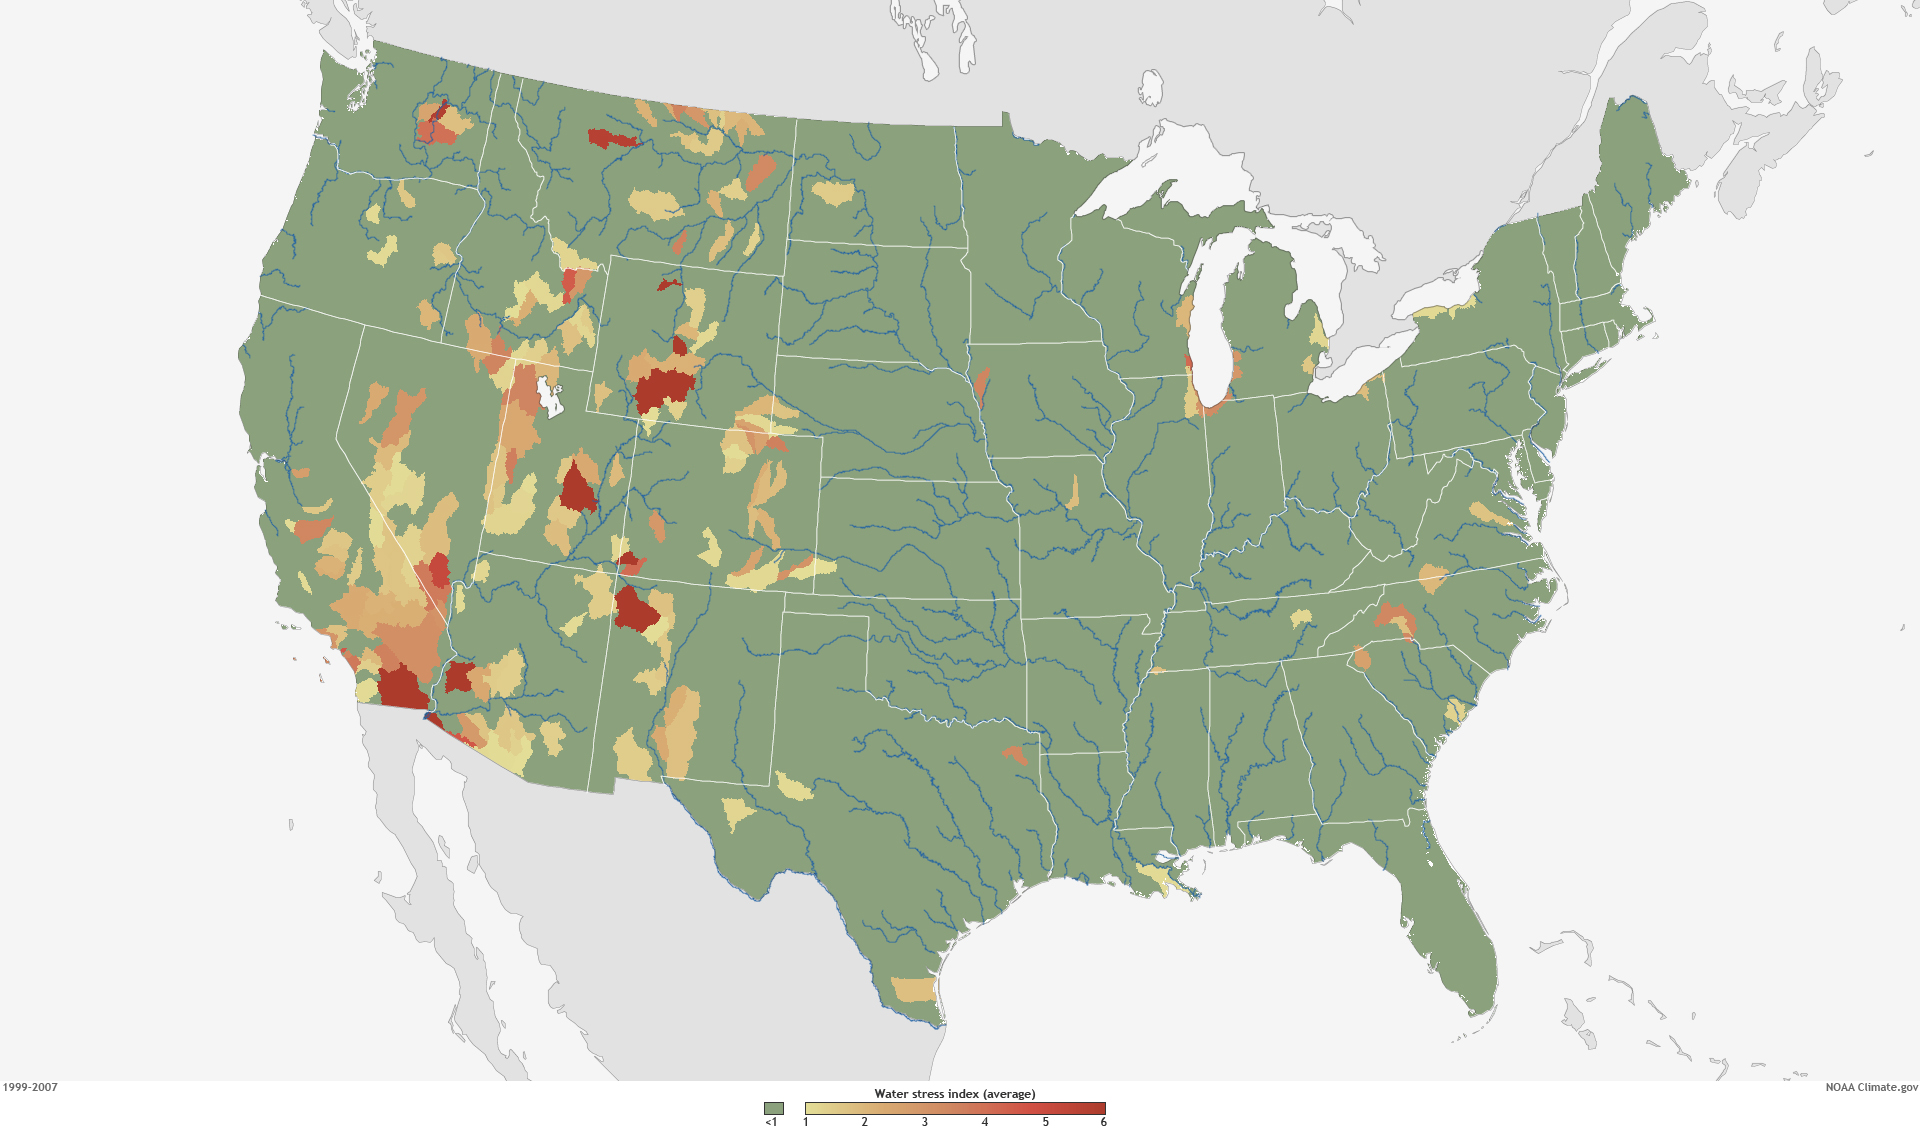
But climate change has created a new concept of “water stress”–stresses best be pictured not by the isotherms of weather maps, but the watersheds and drainage districts that were the basis of Powell’s revolutionary map, and matching the very region of the Arid Zone where the soil scientist Powell turned viewers’ attention to the crucial index of ground and soil moisture, the true determinant of the future of agrarian settlement and the future of food. The regions determined of greatest future stress were the very basins that Powell mapped, and suggest the relevance of his map, as well as his caution of the difficulties of governance in an area of severe water stress-stress being understood and indexed as a relation between supply and demand, as well as rainfall, in national watersheds.

3. The “Arid Region” of the Untied States had been austerely and admonishingly described by John Wesley Powell as a geologist to caution against the administration of its future settlement with a level of clarity that reveals his Methodist upbringing. It is hard to know how clearly we can ever parse aridity, in an age when rising temperatures have unremittingly drained soil of water. As if informed by a deep respect for the map as a clarity of record, possessing the power to reorient readers to the world by preaching a new relation to the land, Powell had placed a premium on cartographic form as a tool to re-envision local governance–and prepared his striking eight-color map of the limited rainwater that arrives west of the hundredth meridian, the eastern border of what he baptized as the Arid Region, an almost zonal construction akin to a torrid zone.

The imposing title of this reclassification of the interior of the United States revealed Powell’s own keen sense of the map as a visual record of the territory, whose transparency as a record of the quality of the land would be a basis for all discussion of settlement. Powell parlayed his own deep study of the geography of the Colorado Basin to query the value of parsing the administration of water rights by state lines in 1890, convinced of the need to oversee later apportionment outside the jurisdiction of the arbitrary boundaries of western states, but joined them to his sense of duty of preparing a legible map of striking colors to convey the constraints and difficulties for its future settlement– not only by the scarcity of the threads of rivers curled against its topography, but the few watersheds.

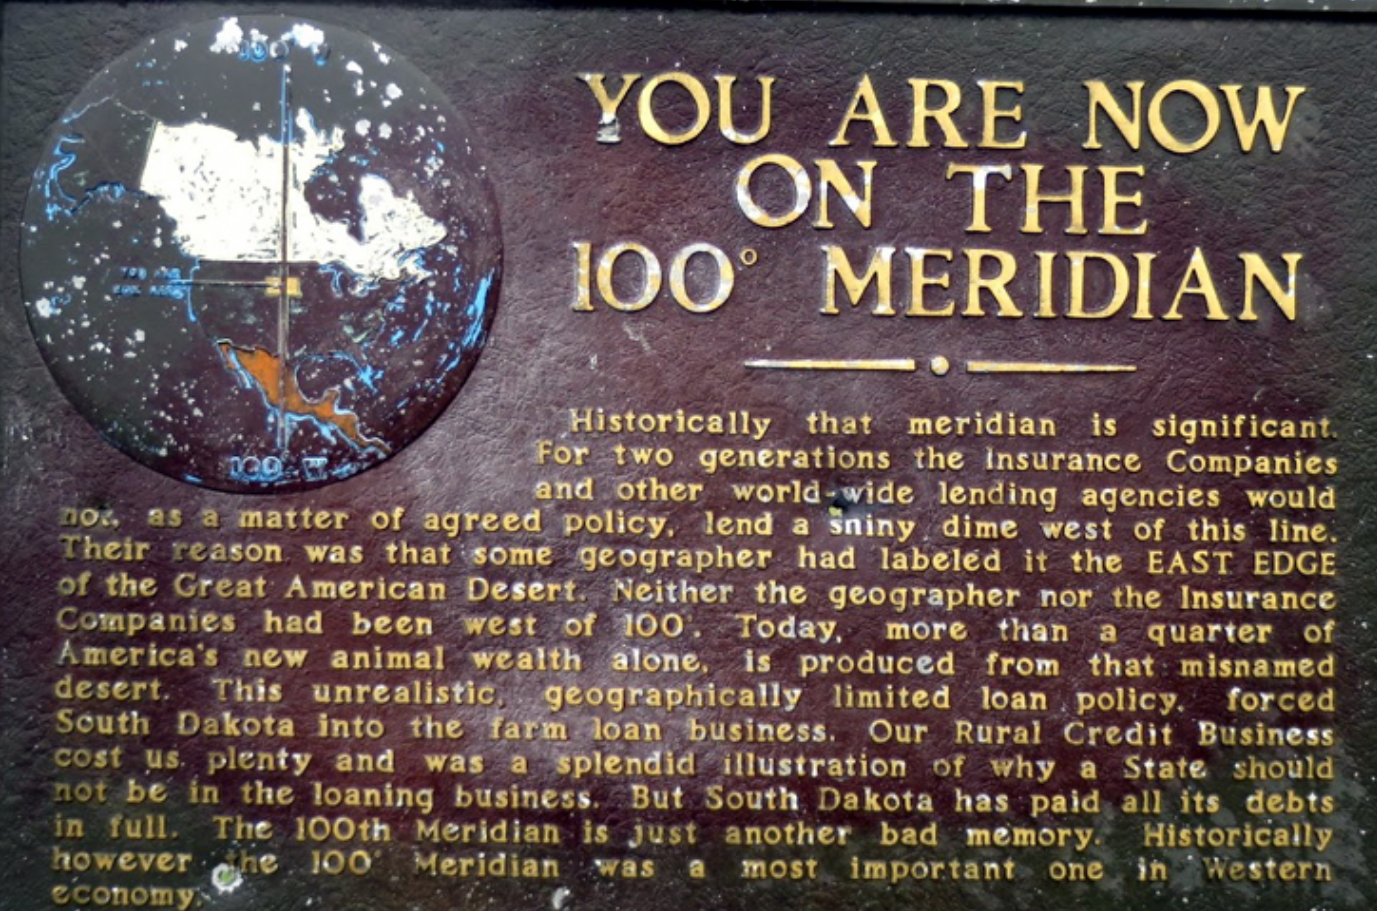
Powell trusted the map might mark the opening of the “Great American Desert” in order to alert the US Congress that the dry lands west of the hundredth meridian was a divide. Even if the meridian no longer marking as clear a divide of reduced rainfall, as we confront the growth with unprecedented degree of global warming of a parched west–both in terms of reduced rainfall and declining soil quality–it may serve as a model for the map we need for the future governance and administration of already contested water rights. Powell’s place in the long story of soil quality reflects how neatly the American west as a microcosm of global warming is rooted in the conversion of public lands to private ownership, into which warming has thrown such a significant wrench.

Arid Region of the United States, Showing Drainage Basins (1890)

For the Arid Region’s aridity has since been unremittingly magnified, producing a region more arid than we have ever experienced and struggle to find an adequate color ramp adequate. But we would do well to try to map the forgetfulness of that arid region, even as we confront the quandary of the stubborn continuity of sustained dryness of a megadrought enduring multiple years, compounding the aridity of the soil, and multiplying fire dangers–and the conditions of combustibility of the region–far beyond what the west has ever known or Powell imagined possible. If aridity of soils and poor land quality has spiraled out of control due to “global warming,” raising questions about the future of farms and livestock, the absence of groundwater and surface water alike, global warming demand we shift from national lenses of water shortage to beyond American territory,–but also to discuss the warping nature of national lenses on the remaking of the sediment of the west–and Colorado Basin.

The difficulties of parsing river-flow by “states” as helpful political aggregations for future settlement was rebutted by the map, which sought to direct attention to the aridity of the ground’s soils to orient its administration in a region where water was destined to remain front and center on settlers’ and residents minds for the foreseeable future. The subsequent attempt to jerry-rig the question of scarcity of water by entitlements that rely on re-apportioning unused water escaped the constraints Powell located in the basic common denominator of groundwater.

As much as the region needs to be mapped outside a national context–despite the national nature of climate tracking–the hope of revealing imbalances of the drought indeed exist across borders, and impact water-sharing agreements, much as the smoke from recent northwest fires has traveled across the Pacific northwest. National territory is as meaningless an analytic category for global warming, or water scarcity, which, this blogpost argues, exists in a global contest of migration, as the migration or transborder transit of fires’ smoke.

4. The conditions of aridity that Powell described in the Colorado Basin and its neighbors offer an oddly productive image of the dryness of the ground, in an era before irrigation, that may be useful for how we can come to terms with the fear of a suspension of irrigation across western states. But it is as if the very definition of aridity was forgotten, as infrastructures of irrigation have re-mapped the region that John Wesley Powell in 1890 mapped as an area of difficult agrarian settlement, as farmlands of agrarian fertility and wealth. Powell proposed to view the “arid region” of the United States east of the Rockies with a clarity approaching scripture in a powerful eight-color map to instructively show how limited water constrained settlement of the region after surveying the Colorado Basin.

Powell probably imagined his map in somewhat revisionary as much as rebarbative, reorienting attention to the dry nature of the soil of the semi-arid region of the Colorado Basin by parsing it in areas by which the availability of water constrainted the settlement of the “open” government lands of the west, obscuring that they were seized from indigenous, to correct the mythic geography propounded by official state-sponsored geologists. Unlike Powell, most state geologists had boosterishly endorsed a site for future pasturage, to be enriched by unknown artesian springs, and ripe for settlement by homesteaders, and Powell’s map posed a more tempered image of resettlement that would obey the laws of the availability of water in the Colorado plateaux and other regions he knew so well, cautioning against the encouragement of settlement and sale to prospective farmers in ways that have improbably made the map something of an icon of conservationist thought. Against promise of prospective bucolic lands of pasture, the dry colors chasten viewers by communicating scarcity of water of drainage basins.

The arid region that Powell correctively propounded was long inscribed in the psycho-geography of the United States to be forgotten, but the arrival of irrigation infrastructure allowing irrigation of western states continues to inform, even in our own era of global warming, the return of the boosterist sloganwhere water flows, food grows,” that is still raised in Northern California’s San Joaquin Valley, to protest “cuts to farmwater” in the recent order of an “emergency curtailment” across rivers of the Sacramento-San Joaquin Delta watershed — essentially the entire Central Valley. The recourse to an engineering “miracle” of making water flow uphill and redistributing more water from reservoirs contest calls for conservation–and only demand the further construction of dams, reservoirs, and water storage for better irrigation. The very promises that the flow of the Colorado River would irrigate lands, that made good on the promises made to homesteaders by describing the region to settlers as a New Canaan, where the growth of future streamflow and even rainfall that had never been documented, would make it suitable for the expansion of animal pasturing and farming, suggests a mythic geography of timeless bounty has replaced its actual conditions.

Friant-Kern Canal Flowing past Kern Dam/Septmeber 2020, Eric Paul Zamora, Fresno Bee

The mythic geography led to a rewriting of America’s irrigation infrastructure that in itself may be one of those pieces of infrastructure just no longer adaptable to extreme climate change. And as we face the scale of the national emergency of water shortages about to be triggered by falling reservoir levels, the crisis of using and recycling water, and the inefficiency of desalination plants of riverwater and groundwater, on which the world currently relies–and were predicted by the US Bureau of Reclamation back in 2003 to provide a “sustainable” solution to the dwindling water provided by the Colorado River, which had allowed the unexpected expansion of the settlement of western states. While desalination plants currently generate worldwide over 3.5 billion gallons daily, with 50 million gallons produced daily in Carlsbad, CA alone, desalination plants in one hundred and twenty counties, only half using sea-water, its energy expense justified as Colorado River decreased, promoted as a “sustainable and drought-proof water supply in Southern California” in an era of climate change, as if to calm our concerns at the dramatically decreased groundwater of western states.

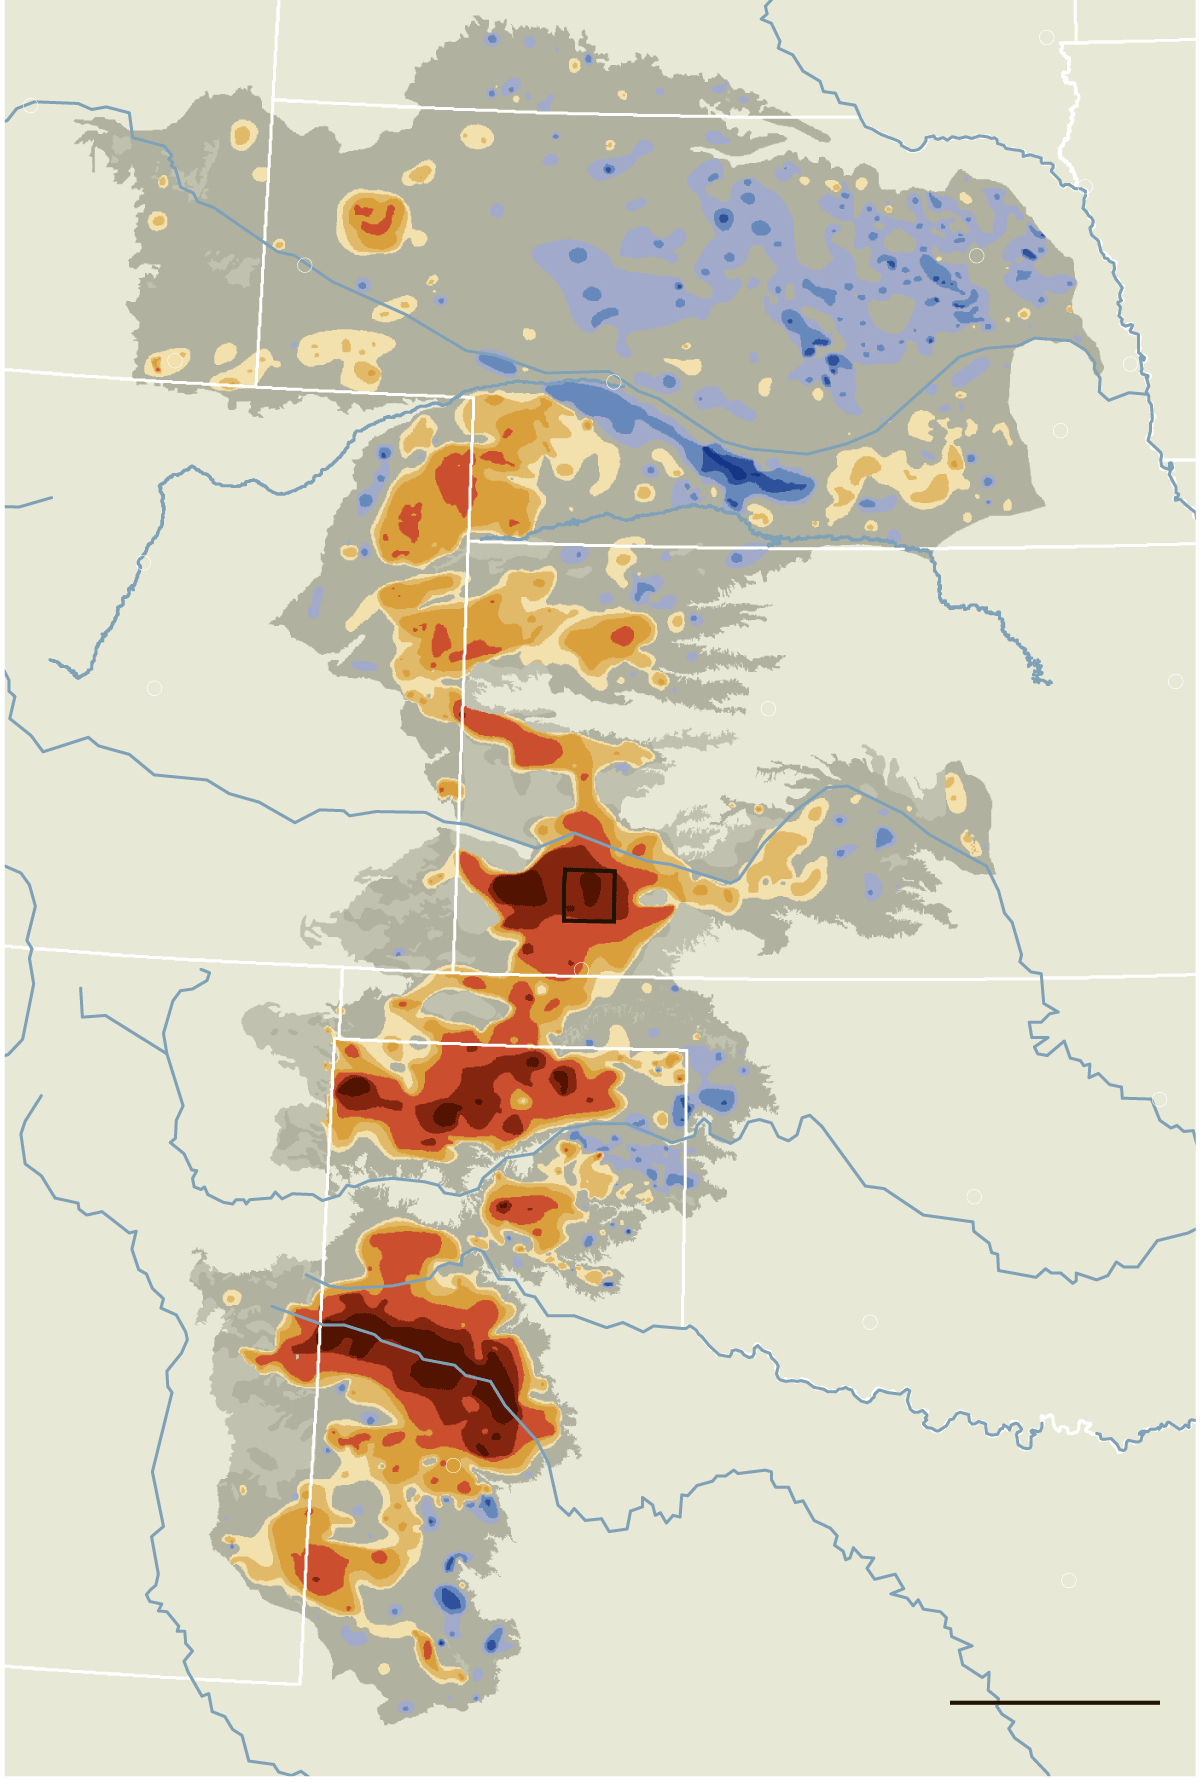
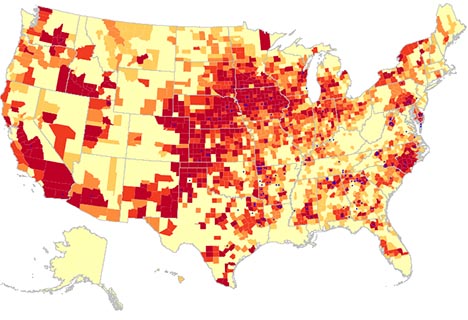
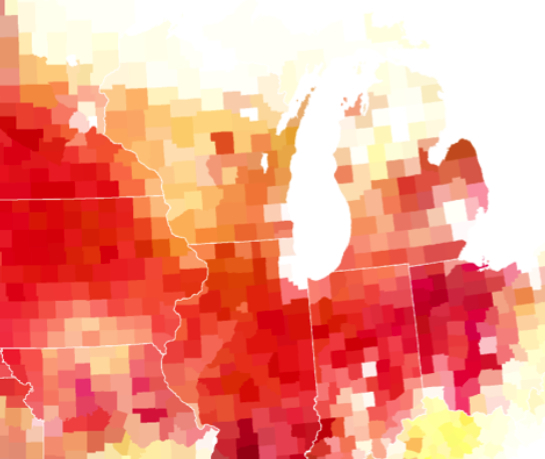
Reclamation scientists assured the nation in 2016 of future recharge in the Upper Colorado Basin would offset temperature increases in their modeling scenarios through 2099, projecting basin-wide precipitation, the fears of the persistence of a mega-drought of extreme aridity with little recharge that may last decades has left fifty-sevens million living in drought conditions across the west according to the U.S. Drought Monitor, that has brought a new era of mega-fires. The thin blue line of the Colorado River is but a crack or thread coursing through a combustible landscape in this recent map of the expansion of unprecedented extreme drought in western states from National Geographic:

For all the disturbing and disquieting elegant if terrifying spread of deep red isotherms in Riley D. Champine’s map, the consequences of such exceptionally below-average levels of precipitation and aridity are difficult to comprehend as cumulative and deep in our nation’s history, as well as the effect of man-made climate change.
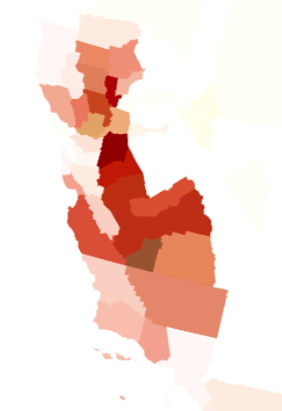
The utter saturation of this data vis of growing dryness of a region where rain far below previous norms fell forces the viewer to process an undue range of measures of aridity that they must struggle to process-if the deep orange and reds approaching emergency warning to suggest that surely a climate emergency is at hand. The absence of text in the visualization invites viewers to acknowledge they stand an eery remove of familiarity with an irrevocably landscape, posing unspoken if also unanswered questions about hydrological infrastructure in the Colorado basin, and greater west, that all but erases the geopolitical formation of this landscape–interruption of a rich color ramp at the southwestern border compartmentalize the large-scale decline in precipitation apart from national categories; but the danger lies in its focus on the economically developed north, more than the global south, as if it lacked adequate resources to prudently respond to groundwater shortages, but as an emergency for the developed world.

The focus of the climate emergency is on a large scale, daunting the possibility of individual response, but focussing on prudence at a local level, even if its scale is not defined, questions whether state politics can even resolve the intensity of the dilemma of declining rainfall levels below a thirty-year norm, a deviation on so broad a scale to be impossible to process save in local terms, but that omits the way the basin has been engineered as a site where groundwater now all but fails to accumulate, increasing the basin’s deep aridity more than the color ramp reveals.

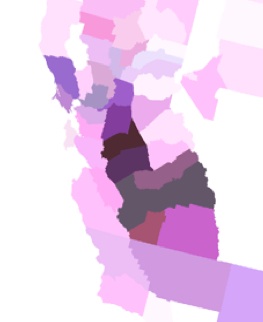
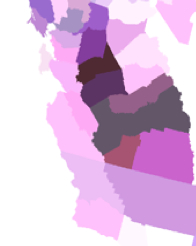
The trust that Powell placed in his maps stand in sharp contrast to the “purple” coloration of regions of extreme heat introduced across western states to suggest so many “red-flag” warnings of excessive heat. In a year already tied with 2017 for receiving “excessive heat” warnings from the National Weather Service, already in early summer at a rate that is increasingly alarming, purple designates the need for caution when leaving air-conditioned environments, and suggests the booming of electric cooling across the west: the metric of a prediction of temperatures reaching 105°F for a two-hour stretch has paralleled the debate in Washington on infrastructure spending that suggest a similar disconnect that Powell confronted when he tried to describe the need for constraints on planning settlement west of the hundredth meridian in 1890.

Four Excessive Heat Warnings issued from late May 2021 have introduced yet a new color to prominence in National Weather Service maps, the new deep purple was introduced in weather maps in 1997 as a venture of the NWS into health alerts; rarely used in other weather maps, which in recent years have shifted from urban areas to large stretches of the nation, shifting from a use of red to designate high temperatures to purple to designate risk of triple-digit temperatures, especially in man-made surfaces like asphalt (able to rise to 170°-180° Fahrenheit–territory of third-degree burns–or cars which can rise thirty degrees above air temperature.

Heat Advisories, July 11, 2021/National Weather Service

During the decade before 2003, the water-level of Lake Mead had begun to decline precipitously, inaugurating a historical decline that led it to fall to but 35% of its storage abilities. While the decline was not more precipitous than the two earlier declines in its water-levels in the reservoir from the mid-1950’s and mid-1960’s, the current decline in storage capacity of what is the largest reservoir of water in the United States has raised the unthinkable and unimaginable arrival of water cutbacks, as Arizona’s share of the Colorado River’s waters will be reduced by 7%, and Mexico–where the Colorado runs–will lose 5% of its share, in a scenario never foreseen in the dam’s history, but that reflects the increased aridity of the watershed from which the Colorado River draws. The decline to 1,075 feet in the reservoir’s depth that triggered the Tier 1 reductions in flow may only be a harbinger of the arrival of future Tier 2 reductions, should Lake Mead drop to 1,065 feet, as is expected in 2023, and raises the fear of a Tear 3 reduction, should the lake level fall below 1,025 feet, reducing the water allocated to western cities. In ways that the infrastructure of irrigating the Arid District of the United States could never have foreseen, the arrival of the driest period that the basin has ever experienced in 1200 years has brought longer periods of drier weather without rainfall that have reduced the riverwater that fills the reservoir.

The declining level of Lake Mead plunged below average lake elevation of 1173 feet, by 2003, in ways that should have sent alarms across the west, were we not consumed by a war against terror. The Bush administration’s attacks on global warming grew, questioning the science of global warming and the dangers of increasing aridity. But the disconnect between the expectation for irrigation by the farming industry and farming states was dismissed, with global warming and climate change, as temporary shifts that wouldn’t alter the landscape of irrigation or river flow.

Robert Simmon, based on data provided by the U.S. Bureau of Reclamation

Continue reading

Leave a comment

Filed under border studies, climate change, data visualization, global warming, mapping global warming

The Arid Region of the United States and its Afterlife: Beyond the 100th Meridian

The map may not be the territory.  But it shapes one’s relation to the territory–and to the presence of water in the land, as well as the land itself.  John Wesley Powell had a clear idea of the importance of mapping the sustainability of his audience’s relation to the new nature of the aridity of the plains states and western territories in the 1870s, when he used his deep knowledge of plants and foliage of the region that was distinguished by a deeply fragile economy of water to try to convince the U.S. Congress of re-organizing the region’s settlement, in the face of increasing hopes for its development:   by bounding the area beyond the hundredth meridian west as the “Arid Region,” as if it were a truly unknown land, not subject to the practices of surveying rectilinear boundary lines that the had extended west along the Mason-Dixon line, Powell sought to convey a better understanding of the permanence of drainage zones of the region as the best possible ways of understanding and planning its process of settlement in the way that would be most helpful to future residents, boosterism of the importance of young men going west to find futures notwithstanding.

Indeed, the mapping of how the “Arid Region” of the United States could be settled by John Wesley Powell created as the second Director of the United States Geological Survey, a post he held from 1881–1894, but which he had first expansively described in 1878.  The United States Congress followed Powell’s recommendation to consolidate the western surveys into the new U.S. Geological Survey, and he long sought to create a map capturing the fragile water ecology of the American West.  The completion of his classic report on the region first suggested a new relation to the distribution of water in the region in ways that would best serve all of its residents, and in his later map, he tried to articulate so clear a relation to the region’s future settlement.  Powell’s view on the need for systematic irrigation of the region stands in almost polemic relation to the place that the western states held in the spatial imaginary of the Homesteading Era:  indeed, his insistence that led to the charge to undertake a systematic irrigation survey of lands in the public domain of the wester United States in 1888, long a topic for which he had agitated, and his map of the region reflected a demand to integrate a topographic survey, hydrographic survey, and engineering survey of the region.  Perhaps the map offered a new sense of the territory, if “territory” includes the waterways that would be able to adequately irrigate all open lands.

Arid Region of US

For the reception of Major John Wesley Powell’s attempt to map what he called the “Arid Region of the United States” reveals both he difficulty in mapping the relation of water to the land, and the appeal that a piece of paper might gain over time.  The detailed map provided something of a ground plan and register of how the arid region might be best inhabited, and of the relation to the land and landwater of a region’s inhabitants.  And it provides an early recognition of problems of water management and distribution in the western states–captured in its naming simply as the “Arid Region” as if to set it apart from the plentiful water in other regions–that later eras began to appreciate in ways that Powell’s contemporaries were less able to see in his ambitious attempt to reorganize the management of its regions around its multiple inland watersheds that he had hoped to canalize.  For Powell’s ambitious 1890 remapping of lands west of the 100° meridian in the United States tried to encompass their unique aridity and to pose a solution for its future inhabitants with special attention to its drainage districts–as discreet riverine watersheds.

Arid Lands Reservations
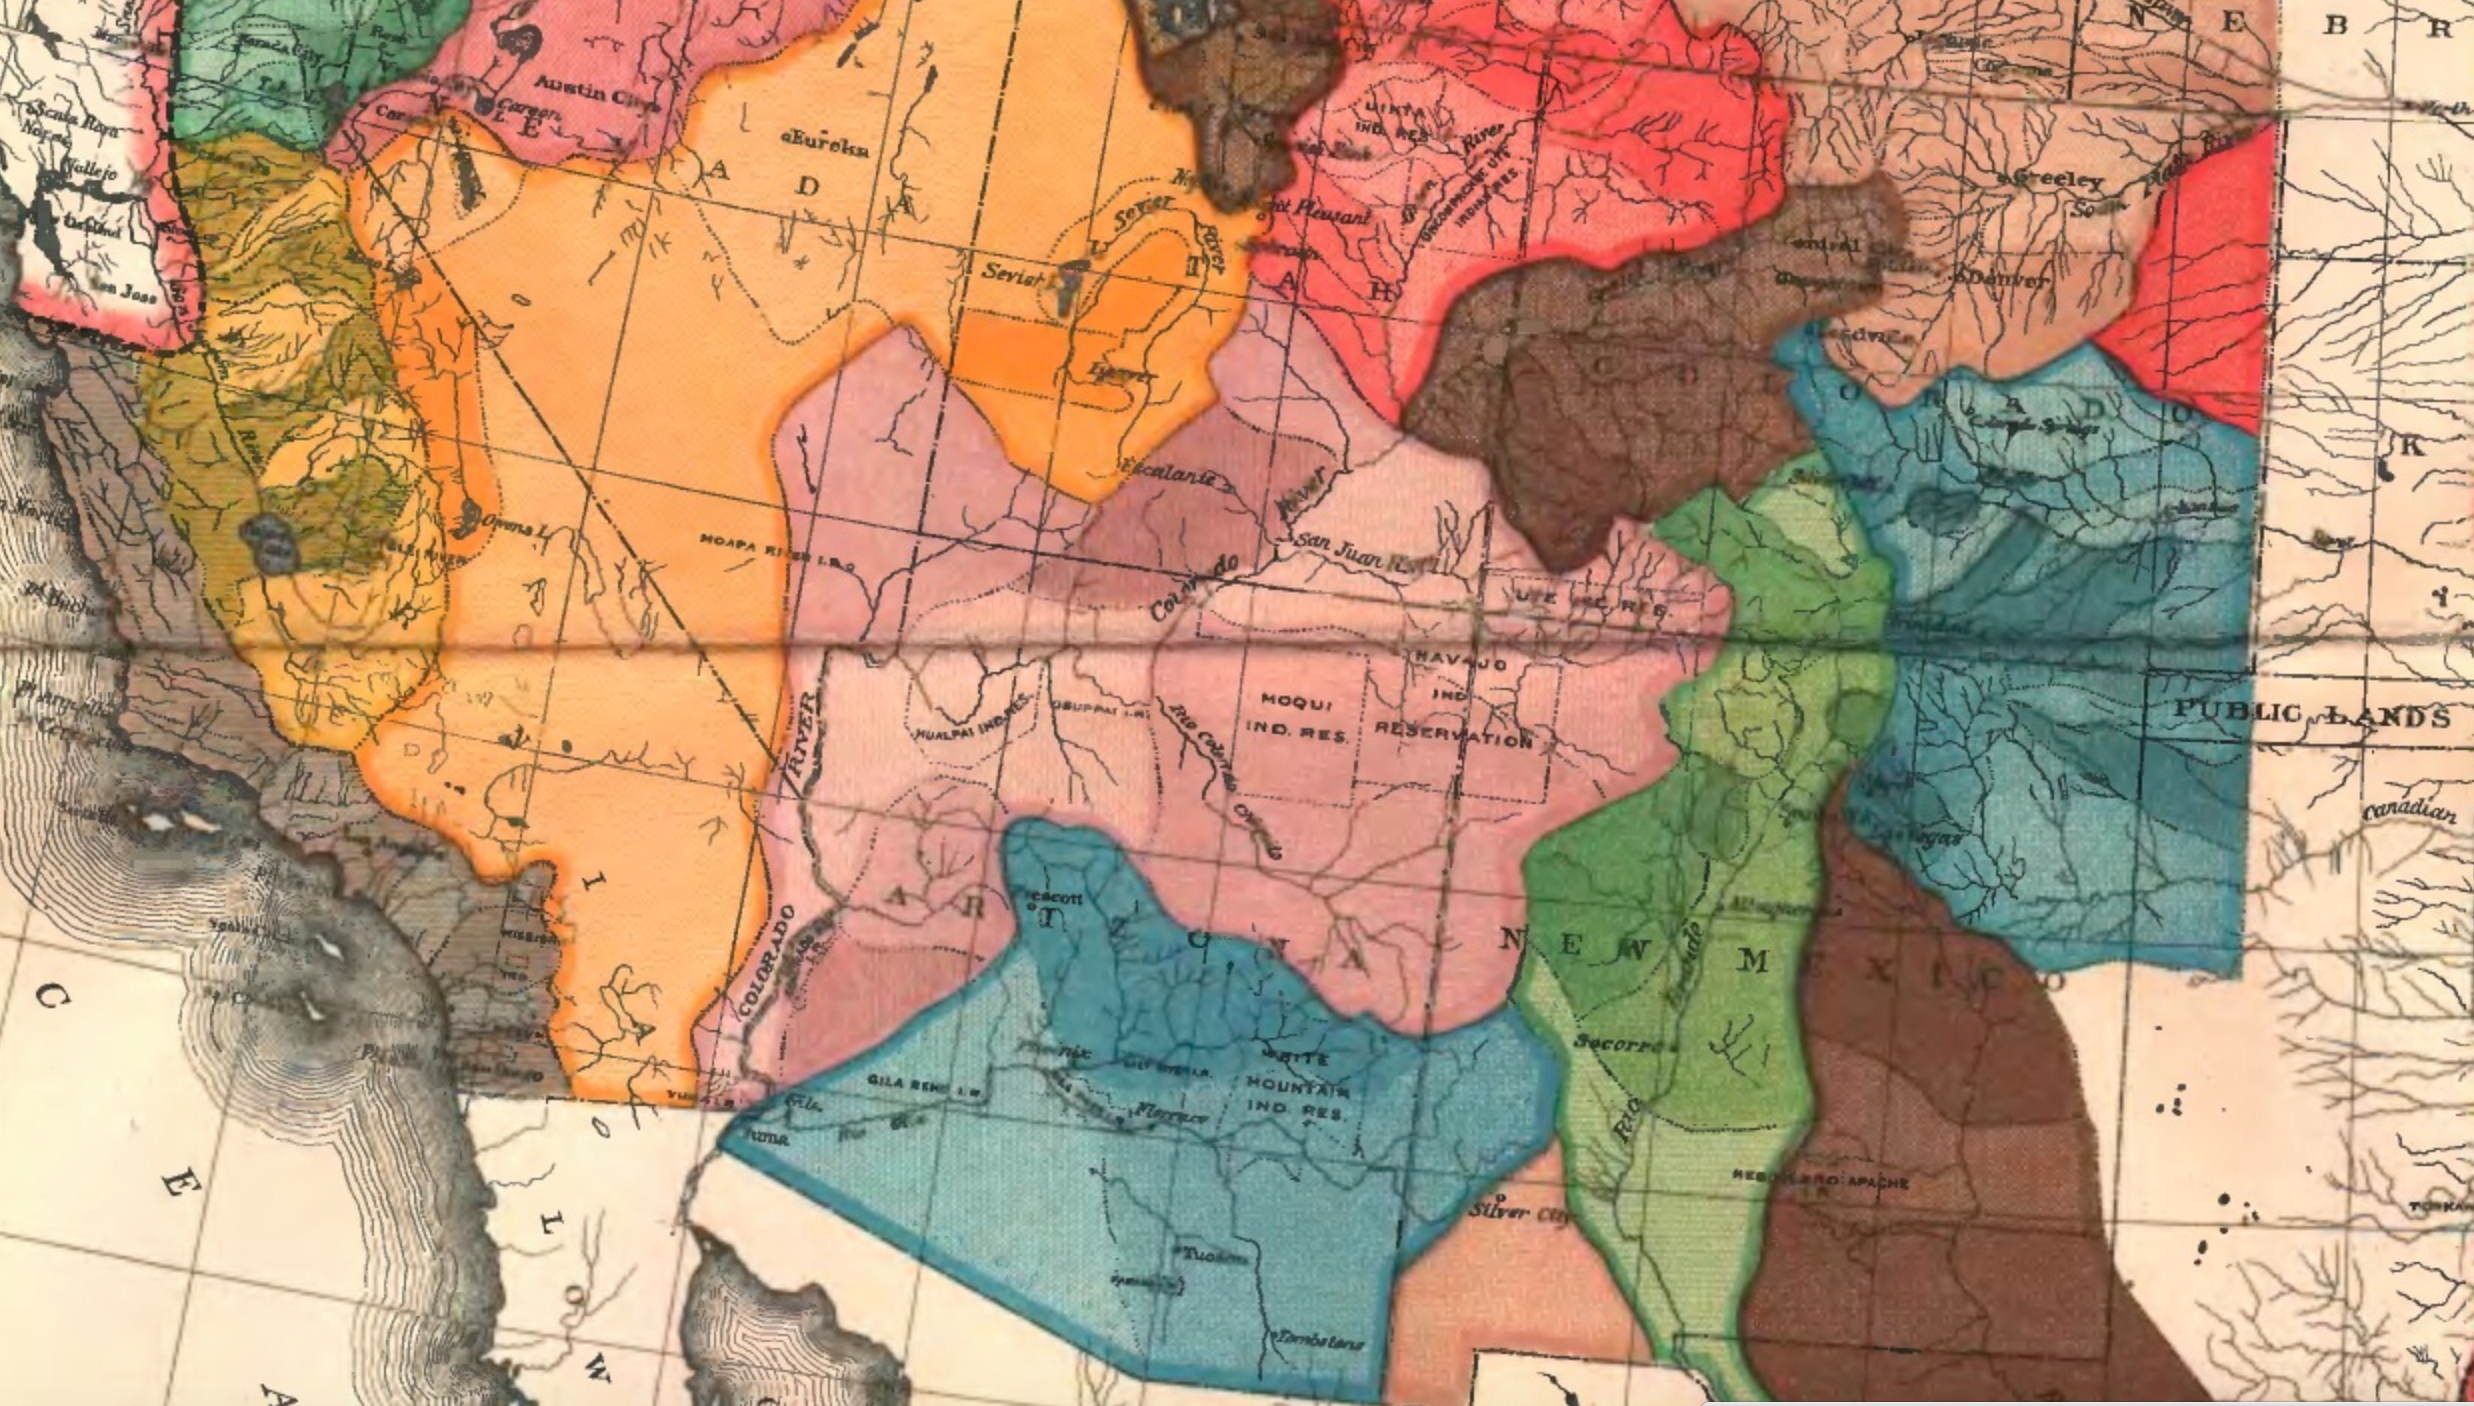
Arid Region of the United States (1890); detail
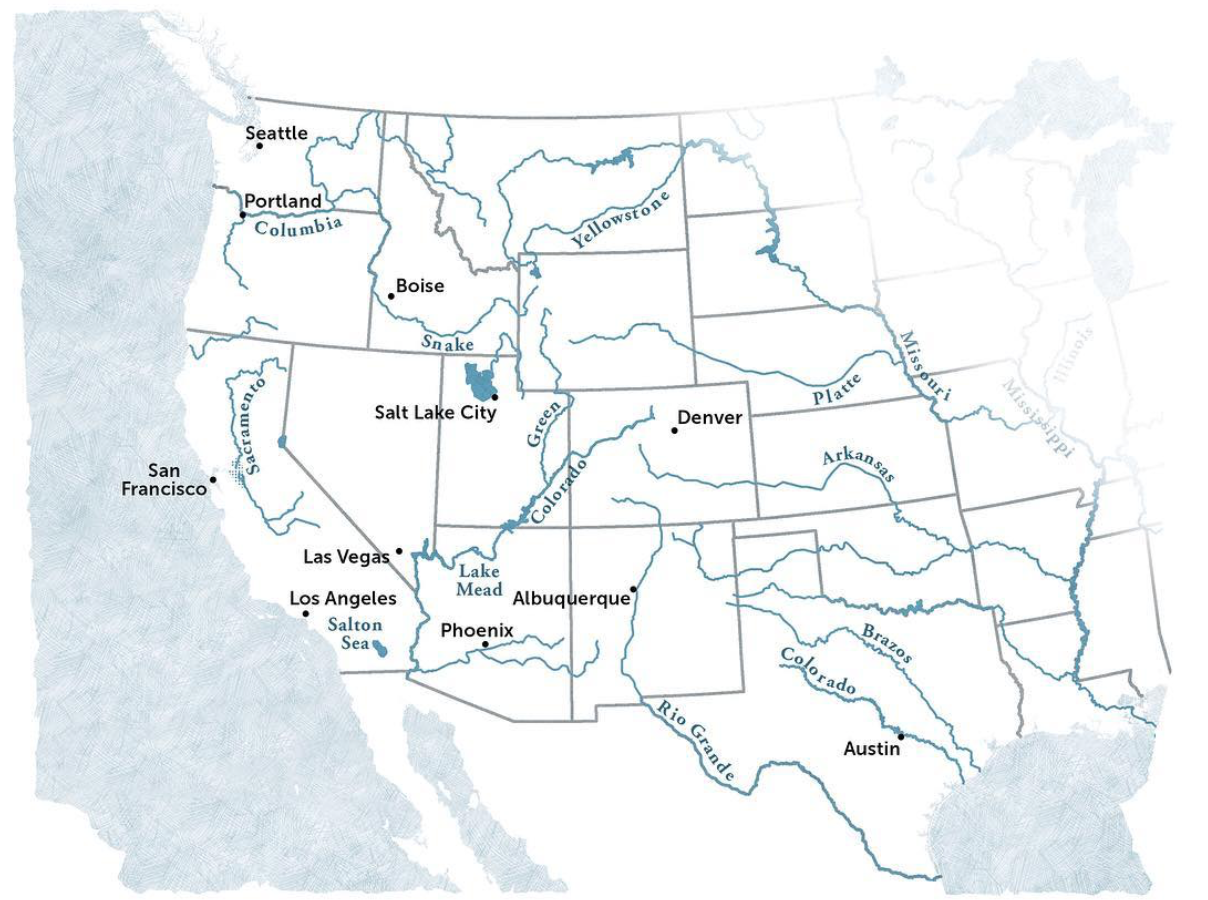
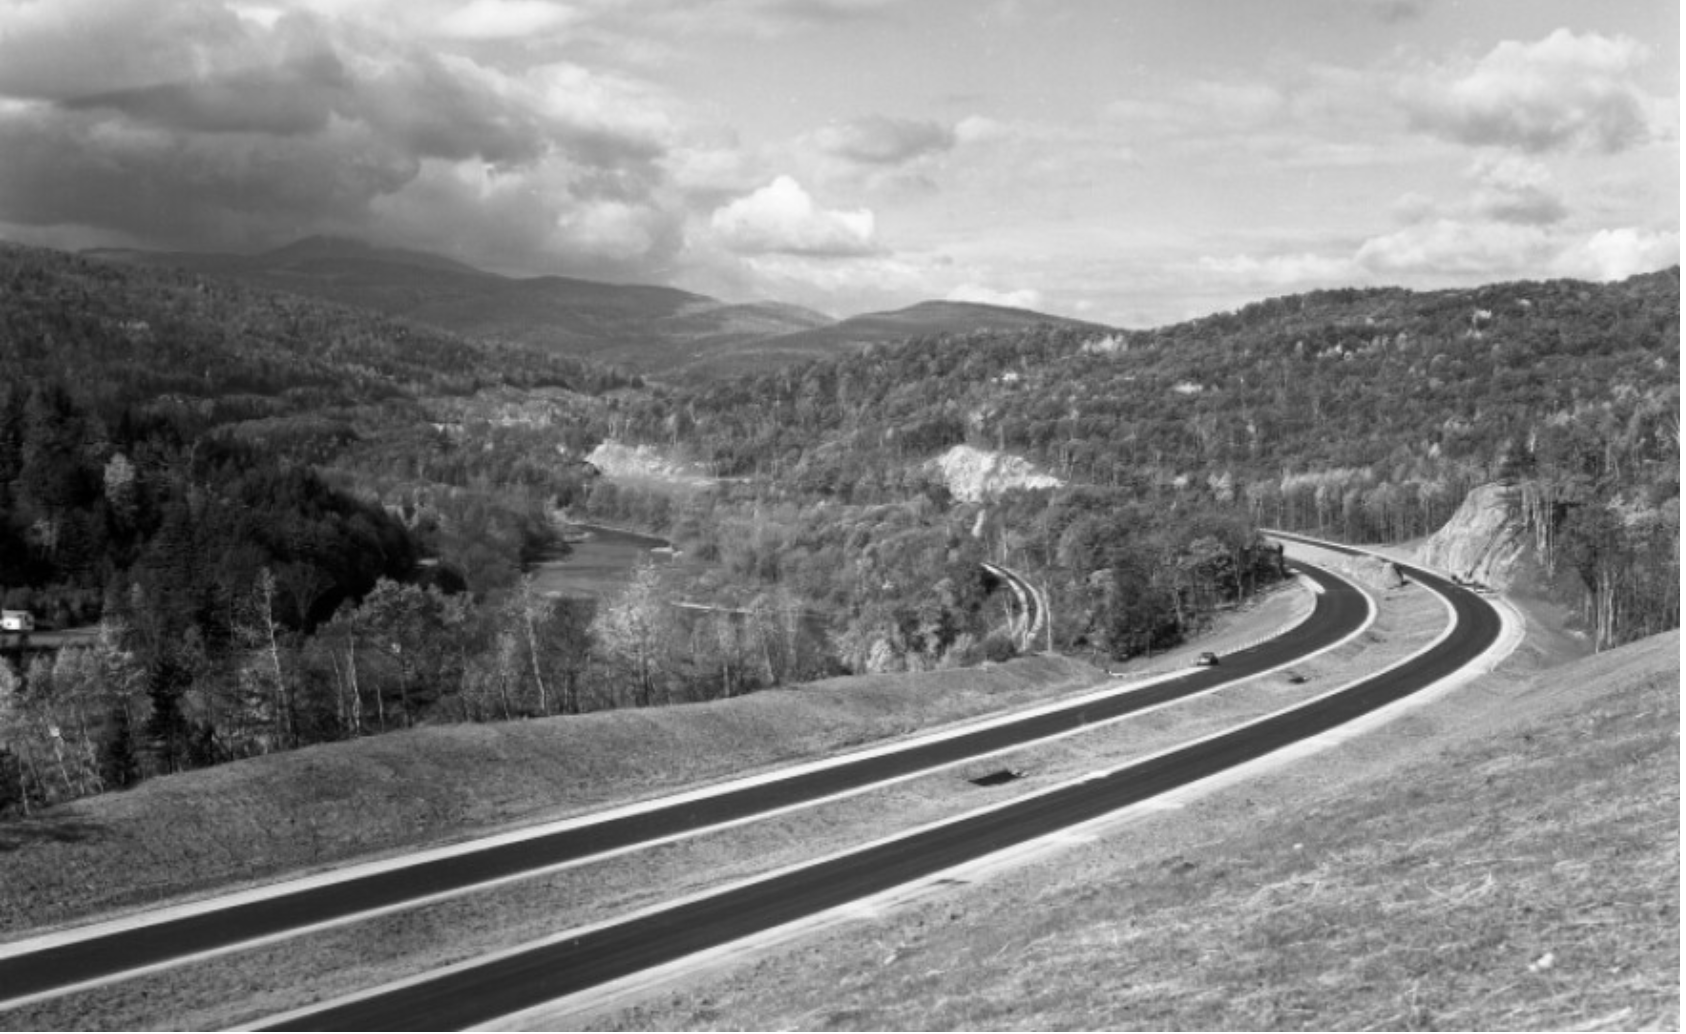
The best practices that motivated Powell’s map as a basis to orient the government to the land’s groundwater.  The distinctive scarcity of water in the western states became evident in a time of sustained drought, giving unexpected currency to how Powell’s map reoriented readers to the “Arid Region of the United States.”  The brightly colored map to which the explorer, geographer, and anthropologist not only dedicated an extreme amount of attention in his later life, and of which he became something of an evangelist, suggests a early recognition of the scarcity of water and its management, in an era when there is a specter of considerable anger around poor practices of water management in much of the western states, tempered by an expectation that groundwater would be available for farming and irrigation.

The rivers in the United States are quite widely distributed, leaving much of the western plateaux at a distance from riverine waterways–

Western Rivers.pngTim Sinott

–and the image of Virgin Land so deeply ingrained across that regions settlement that its unique character of low rainfall and widely dispersed water sources was erased in the spatial imaginary which replaced the detailed map Powell of the administration of groundwater in the western states that Powell had created with his surveying team as a guide to the region that he knew so well, and which he sought to communicate when he became second director of the United States Geographical Surveys (1881–1894).  The governmental office did not give him authority to organize , but to create a new map that might better organize the nation to the lesser rainwater in what was known as the Great American Desert.  For Powell attempted to re-orient homesteaders to the imperative of western migration through the map, by organizing water administration and the future prospect for canalization in order to grow prospects for the irrigation of the region and its future farmlands that have considerable ethical power to speak to us today.

Continue reading

1 Comment

Filed under arid region of the United States, data visualization, drought, environmental stewardship, water management

Sleeping Roads, Ancient Highways, and Paper Towns

What’s the significance of names on a map?  Do they register roads that belong to the territory or only reflect continued use?  What sort of authority does a mapped road, byway, or highway retain in common law–and for how long must it be recognized as a road?  The existence of place-names and routes on a map have become an increasingly contested way to preserve a sense of place, and the survival of the “sleeping roads” of Vermont, the “Class 4” roads that are not maintained by towns, even if some receive some limited maintenance, suggest a historical network of the past, still partly visible and indeed rarely used, but providing a vanishing network of the past inhabitation of rural space and its organization before the introduction of the interstate system.

“If you walk down that road,” a Vermont farmer gestured at the end of Lavender Road in Central Vermont, “it’ll be like you’re walking into the past.” Meaning that the flat stone walls bordering the path, now overgrown with ferns, fallen logs, exposed granite, and an abundance of mushrooms and twigs, not to mention suspicious looking poison ivy, was an earlier system of land management and division, as well as an earlier route of access among the private property that divided Central Vermont hills, Long before I-89 ploughed through the countryside of central Vermont as a central artery of automotive traffic, cut through dark bedrock of metamorphic Cambrian and Ordovician eras, seizing thousands of acres across the state and displacing houses and farms, the roads we now see as arteries that cut through old forests and Silurian and Devonian metasedimentary rocks displaced the roads that once defined travel, reducing once luscious habitats of oak forests to the veils of Potemkin forests. Those illusory strips of six to ten trees deep to create the illusion of forest for tourists and motorists on the highways that cut across New England, vestiges of an earlier arboreal ecosystems living only in the minds of motorists on paved roads from which they rarely deviate or depart.

 
Two Thousand Acres Seized to Make Way for I-91/Vermong State Archives and Records

Newly Paved Interstate Curves through the Waterbury/Middlesex region, circa 1960/Vermont Historical Society

The very same roads that are no allowed to afford prospects of the fall foliage for which the same landscape is so well known were, of course, creations of an earlier area of land-movements and massive landscape shifts. What roads lie beneath them? How can they be seen or even mapped?

6K stock footage aerial video flying over interstate 89 through colorful trees  in autumn, Sharon, Vermont Aerial Stock Footage AX150_453 | Axiom Images

Interstate 89

The survival of so many earlier “sleeping roads” are increasingly threatened in an age of the road. The increased division of the long predominantly rural state on property lines, driven by a  market of construction threatens to obscure local knowledge and a long-valued sense of place that the cutting of highways had long altered. If the preservation of dirt roads without much gravel in Vermont towns was an early development, which contributed recently to the real fears of erosion with flash floods and inundations, the drainage problems of the considerable number of municipal roads in the state have remained largely unpaved–about 75% in 2018, of municipal roads that comprise some 70% of total road miles–the problem of best drainage practices are an inheritance of the longstanding protection of the states rural character in its towns. But the landscape of the interstates brought a deep local resistance to the remapping of interstates and federal roadways that Vermont towns were quick to protect their local character in keeping with a longstanding agrarian economy, rooted in pasture and the production of cows’ milk. 

Yet the increased presence of paved miles, even despite the increased danger that the state faces from stormwater damage and erosion in cases of increased stormwater and river inundations, has threatened the value of local roadways. The rapidity with which many roads were re-graveled, and provided with new culverts, ditches, and drainage systems after they washed out in the massive rains of the summer of 2023 led to a sense global warming as the latest threat conspiring to wash out the old lattice of historic roads in the state, and a quick and rapid defense of the local roads that were so much of the tourist industry depends. The deep sense of injustice in the prospect of loosing the legal status of “ancient” and long-pathways preserved in records of in local townships face possible obliteration in the legal memory as such unpaved roads–often more tacitly known than still used for commerce–are going to be reclassified.  Indeed, as the state’s legislature has decided to reclassify common law roads to homogenize property records across the state, the outburst of local mapping seems not an act of antiquarian obscurantism, but a defense of local knowledge in an age of globalism and satellite mapping, where few of the older roads might appear from the sort of satellite-based mapping systems on which we increasingly depend.  While many of the “class 4” roads might be sought out by mountain bikers, eager for off-road experiences, or back roads where they can snake around mountain farms, but only maintained if deemed necessary for the public good. Yet the rediscovery of these “ancient roads” that are still able to be found on some edges of historic farmlands open up prospects of the topography of the past, evident in the gaps between tree tops and the old stone walls of the edges of the pathways, rather than their navigability or use.

The plan for a massive reclassification of “ancient” highways on the books but actually dormant in much of the state of Vermont may be a pro-development land grab, but suggests that the struggle for designating once common lands as private property (and resistance to it) are waged on maps.  The recent promise to reclassify registered but unnamed byways in the state–a mass of roads which were at one time used or previously surveyed as common-law byways, but have since fallen out of use to different degrees–has unintentionally generated a set of local storms about public memory.  In a state where many current town roads remain unpaved, and many more have faded into the largely forested landscape, their traces still in evidence in the midst of a somewhat bucolic space of passage, tree growth impeded by the stones and often muddy road between old flat stone walls that had once been built to separate famers’ bow long overgrown fields.  

The drive to reclassify the diversity of unpaved roads and common law byways once preserved in local jurisdictions reveals the rise of property development for whom the retention of old systems of spatial classification obfuscates the exchange of private lands.  And if the preservation of old farmlands in Vermont provided a rare historical perspective of longue durée for early twentieth century historians as George Perkins Marsh, who rote long before the rise of environmental history or of the Annales school focussed on land management practices as a lens to observe long-term changes in social history. And in a fascinating illustration of how local collective mapping practices provide a unique point of resistance to mapping software systems that are primarily oriented to paved space, rather than the commons, or, as it is now known, the closely connected right to wander.

The Vermonter developed a broad history of the dialectic relations of what we call the Anthropocene between “man” and “nature” avant la lettre. He dis so out of a deeply American vantage point on world history, as he contemplated the “destruction wrought” on his native state’s local landscape in 1864, about twenty years after Henry David Thoreau lamented the presence of the intrusion of railway lines in the idyllic space of Walden Pond. He offered a global perspective that took its spin from his deep impression by the effects of the retreating and shifting landscape of Vermont, where he had been born in a farmhouse, the vantage point from which Marsh defined his perspectives on human destruction of the global landscape.  After travels in Italy and study of the deforestation Mediterranean basin, he bemoaned that the case of Vermont’s loss of native trees as a similar global historical shift of consequence; in the introduction of his massively learned work, Marsh affirmed that “The earth is fast becoming an unfit home for its noblest inhabitant, and another era of equal human crime and human improvidence . . . would reduce it to such a condition of impoverished productiveness, of shattered surface, of climatic excess, as to threaten the depravation, barbarism, and perhaps even extinction of the species.”  In his metahistorical masterwork, Man and Nature, Marsh contemplated the “wide a circle of disturbance we produce in the harmonies of nature when we throw the smallest pebble into the ocean of organic life” and watch it send ripples across the surface of a body of water, offering one of the more prescient images of the cascading effects of anthropogenic change in the Anthropocene.

Vermont’s deforestation was so accelerated and traumatic in scope that–long before the expansion of its interstate that destroyed farms, homes, and an agrarian economy–the state offered an important perspective for articulating an early environmental vision of the planet’s dire state that in 1874 Marsh found it to carry “the force of revelation.” As immersion in the resettlement of dustbowl refugees prompted historical reflection of self-made environmentalist Clarence Glacken, about man’s relation to the habitable environment; his experience of resettling refugees forced from farms by a lack of rain prompted sustained reflection on the relation of “man to environment” that resulted in the synthetic surveys he taught in the 1950s, which culminated in Far From the Rhodian Shore, a compendium of classical to enlightenment thought that was in the course of being complemented by a second volume when it appeared in cloth in 1976. If Glacken viewed the interaction of humanity and the environment as a baseline for humanism, the devastating experience of deforestation provided for Marsh a baseline for the dangerous rewriting of relations to the natural world; the scale of the deforestation witnessed in Vermont as a circumscription of access to natural worlds provoked a terrifying resonance with the deforestation of the Mediterranean he witnessed, leading him to view environmental change as a altering one’s relation to the world, when the logging industry clearcut oak, birch, below 2,000 feet in a massive harvesting of wood, producing 375 million board feet of wood by 1889, and leading the treeless slopes of Mt. Tom near a town known as “Woodstock” to experience massive soil erosion with hard rains that it altered its shape in Marsh’s own line of sight. His own reflection on “man [as] a disturbing agent” able to turn natural harmony to discords wherever he arrives generalized the land-altering consequences of clearcutting without constraint as a force of history: and whereas metahistorical interpretations of Hayden White and others may smell of the libraries where men like Michelet, Burckhardt, Marx and Vico worked, we might well map the alteration of lived environments provided the optic by which Glacken and Marsh structured pessimistic historical dialectics of their own.

A log drive on the White River
Log Drive on the White River Near Sharon, VT/Vermont Historical Society

The massive rewriting of Vermont’s once rich arboreal landscape by the 1890s was so extensive to alter the economy of the land and man’s relation to it. The scope of devastation was not without resistance as the old map of a relation to landscape was preserved, in no small part by th donation of a Middlebury legislator who incarnated local ideals of environmental stewardship by decrying devastation of “timber butchers”: as soil erosion was devastating local tourism, legislators founded a Forestry Commission, similar to the Board of Agriculture, leading Middlebury legislator Joseph Battell to act preemptively to purchase and donate a thousand acres of forested land comprising Camel’s Hump, Bread Loaf Mountain, and other peaks of the Green Mountains to the state so that they preserved their form–and later donated lands from Hancock to Fayston, to his alma mater, Middlebury College, a land grant that provided the nucleus of the broadleaf trees in the Green Mountains National Forest.

If the extraction of wood from the state’s lands reshaped the soil as the cutting of trees on many hills was accompanied by rise in quarrying to mine slate, granite, marble, and copper; often, smelting left wastelands behind in place of forested lands–leaving old growth trees to act as wayfinding signposts for a drivable road network created on cleared land, paved or graded to allow increased automotive traffic unsuited to dirt roads from 1908.

Did not the rebuilding of paved roads as Interstate 89 not encourage the growth of a fossil fuel economy in the 1960s as it cut across once forested terrain, forcing the vision of Marsh’s coherent landscape further into the receding past, as automotive space shifted the function, use, and scope of a local infrastructure of roads?

The back of this 1964 photograph reads, "Unvailing [sic] of new gas signs on I-89." An exhibit at the Vermont History Museum features historic photos from before, during and after the construction of the state's interstate highway.

New Gasoline Station Signs placed along Interstate 89 (1964)/Vermont History Museum 

The local resistance to such a reclassification of roads in the rural state, which has attracted its share of fierce defenders of the local rights of communities long granted precedents to federal or state law, make the proposed elimination of “Ancient Highways” from local law a matter of contention.  The proposed reclassification of a multiplicity of roads poses a problem of having ceased to reflect the sort of use of landscape that developers want to encourage and private home-owners want to ensure.  Given the shifting nature of land use in Vermont, where older houses are increasingly on the market, as smaller agricultural farms close and die out, a premium has developed for the clear definition of ownership without any liens or qualifications.  Hence the increasing tensions between local municipalities in the state and any move by state government to abolish roads they long oversaw.  In a sense, the increased interest in helping demand for fungible residential properties that can be sold without qualification have run up against the multiplicity of roads that have continued to remain on the books.

As the real estate market in Vermont seems poised to heat up in much of the state, and smaller towns face a demand for brisk sales and a large pool of properties arrive on the market, the state seeks to remove any obstacles to development or become notorious for arcane property laws, remapping the “ancient” roads of Vermont opts to treat them as ancient, and, far more than unpaved, not part of its future landscape.  Yet the quilt of county regulations of roads that existed for most of the eighteenth century and was retained in most local maps before World War II reflected a local landscape of counties and townships rarely challenged before the arrival of interstate federal highways across the state during the 1970s, erasing the varied paths, trails, and common-law roads, long overseen by local city Selectboards and regarded as parts of the local landscape.

A Quilt of Counties
Continue reading

Leave a comment

Filed under anthropogenic change, antidepressants, GIS, GoogleMaps, the commons, Vermont

Aquifers/Monocrops

Recent news of the quite devastating dwindling of the High Plains aquifers sent me back to how William Rankin charted the uneven distribution of monocrops in the United States.   For the authority with which maps render a depletion of High Plains aquifers as an “underground pool drying up”–as if it were a record of nature, intensified by global warming, echoed in the discussion of a dwindling or disappearance by the time  the aquifer that runs from the sands of Wyoming reaches Kansas and the Texas panhandle, leaving farms without the groundwater on which their livelihood depends.  Although long characteristic of the nation’s landscape, the underground water that feeds the high plains long taken for granted to dry up–in ways that challenge mapping tools or a reliance on cartographical practices as tools explication.  How much this has been intensified by increasing temperatures of summer months, maps reveal the extent to which the depletion of landwater has been exacerbated by agribusiness and the dramatic unsustainability of irrigating subsidized crops from an aquifer that is, due to evaporation, rarely recharged.

Most maps of aquifers’ depletion effectively minimize the impact of patterns of human inhabitation on the plains–if only because they don’t register how nature no longer exists as an autonomous category, or how all maps represent the human shaping of a “natural” record.  The authority of the map erases the effects of inhabitation, or the very agricultural practices that much of the same article describes of an intensification of irrigation across the region, uniformly distributed without regard to the level of the water-table.  They naturalize the presence of water in the ground, as, most simply, by coloring the aquifer’s expanse by a uniform blue, as if to render a plentiful underwater sea readily accessed by drill.


High Plains Aquifer


The shifting water-levels of the irrigation have however shifted the availability of this hidden underground reserve challenge us to use map to expressing the dynamics of its depletion.  Use of the Northern Great Plains aquifer system for irrigation has long consumed over half of underground aquifers:  irrigation of lands in Wyoming and Montana regularly feeds the aquifer system itself, as excess irrigation feeds the aquifer itself in those states.  Yet water-level monitoring in the High Plains aquifer led to increasing declines in its level from the start of its intensive irrigation from 1950, and has most recently led to the failed search for new wells in its southernmost reaches.

The long-term decline of water levels have been concentrated further south in its almost 112 million acres for at least five years.  The mapping of water-levels revealed a decline of almost 100 feet by 1980, when the irrigated acreage used for agriculture most dramatically grew from just over 2 million acres to 13.7 million.  In the high plains, unlike the great plains, the aquifer itself was rarely restored with water withdrawn from pumping and wells, and an expansion of the demand for water from agrarian land-use led to a single-headed search for extraction even if little water was to be had.  The gradual draining of the southernmost aquifer was in a sense long known:


Water Level Declines

The recent chronicling of the transformation of fertile plains into dust by the New York Times stands at the end of a depletion already mapped by 2009:  if the compelling article painted a somewhat passive picture of the depletion of the aquifer that has so shaped the American landscape, the problem of mapping water and crops lay in the implicit tone of a naturalization of water-loss–whose effects nicely intersect with fears for the effects of global-warming–whose ‘news’ may exist in its delayed economic impact on farming, rather than on the absence of warning signs.   When Ashley Yost told the reporter Michael Wines “I’ve raised 294 bushels of corn an acre there before, with water and the Lord’s help,” he grouped water with the divine assistance, as if it didn’t come out of the ground.

The combination of landscape images of the effects of a parching of agricultural fields with a set of regional maps threaten to naturalize the changing hight plains landscape and minimize the ways in which all maps pose arguments–as much as Matthew Staver’s striking image of arid corn fields–because they fail to register the dwindling as the effect of their practices of inhabitation and a changed dynamic of water-use.

PLAINS-articleLarge-v2Matthew Staver

The recent drop of the aquifer of some four and a quarter feet in Kansas from 2010-11 is a call for alarm not only as a “lack of water”; the drying up of landwater during the summer months has led to a dramatic decline in the amount of corn cultivated in that state that reflects a failure of agrarian planning and a concentrating of water-resources in monocrops–as much as the depletion of an existing water reserve in a uniform fashion over time, accompanied by an expansion of water-hungry crops such as corn, beside others like wheat, in the region–not to mention the raising of livestock on water pumped from aquifers.  The destructive intensity of the drainage of water that never returns to the aquifers lying deep below rest on processes of extraction and irrigation to a degree that can never be replenished never lay in the individual farmer.

I’ve discussed Rankin’s maps that speculate on the consequences of the uneven distribution of crops and land-use in an earlier post.   The correspondence of that aquifer to large corn monocrops they’ve been used to supply is striking when one maps the expansion of corn as a subsidized crop across the nation.  What amounts to a submerged sea and had long seemed an unending resource of underground feeding supply has finally begun to exhaust itself–with disastrous consequences for farming communities who depended on its supply as if were a cash cow to irrigate less than fertile lands in the former dust bowl.   Corn monoculture was facilitated and undergirded by the unsustainable illusion of irrational abundance of an unending supply of underground springs.

Rankin's Map of Crops

Although the patchwork of intense corn-farming may not be dominant in relation to wheat (shades of green) or silage (yellow), the intense patchwork of corn-cultivation in an area not particularly rich in water-sources suggests the ill-effects of agricultural subsidies on the distribution of natural resources.

patchwork of tan

The tan patchwork reveals a depletion of landwater in the very region a region that the New York Times singled out as revealing the adverse effects a dwindling aquifer had on farmers’ productivity.  The ill-effects of sustained drilling in vain attempts to force underground water to rise in pumps range from the depletion of the region’s water-level to the survival of crops.  But its maps conceal a story of the depletion of resources across the plains with the increased reliance on pumps.  The difficulty to pump water grew further south extract demand grew to feed central-pivot irrigators to drench crop lands so as to enable them to remain emerald green and fertile in spring and arid summer months, at the very time that the intense sun dries them, the terrain maps present the present consequences of irrigation practices as the new nature of the plains.

The map that shows a “drying up” of hotspots on the paths of underground aquifers is a map of the future of US agriculture.  But the dramatic dark-spots in the area of north Texas and Kansas, the edges of the underground aquifer and the areas of new corn farming, demand to be further unpacked.


Hot-Spots of Aquifers


Indeed, the extent to which the cultivation of corn as a dominant monocrop maps onto the depletion of the once-plentiful national aquifers in Midwestern states recently in the news, as the regions whose agrarian geography was defined by big center-pivot irrigators–temples to the belief of infinite water-extraction and the plenty of crops–have been able only   to water circles of diminished radii as the aquifer has declined. Yet if “up to a fifth of the irrigated farmland along a 100-mile swath of the aquifer has already gone dry” at the same time as summer temperatures have risen, we need to accept how much of it was forcibly extracted by men hungry for cash.


Htospots from Kansas to Texas


The maps of this water-depletion reveal the need for revising the expectancy that regions of Nebraska, Kansas, Oklahoma, and Texas that occupy the High Plains Aquifer of North America.  What amounts to an submerged sea and had long seemed an unending resource of underground feeding supply has finally begun to exhaust itself with disastrous consequences for farming communities who depended on its supply as if were a sort of cash cow that could be used to irrigate already fertile lands.  The question is in part how such agricultural practices can change.

The correspondence between corn and landwater gets scarier when one notes the  intensity with which aquifers had begun to be drained by ground-water withdrawals as early as 2000 to nourish the spread of thirsty crops such as corn that have led to increasing reliance on unwarranted extracting of groundwater.
Ground-Water Withdrawals 2000


The dramatic rise of irrigated acreage in this region maps onto the epicenter of a devastating dwindling of the plenty of aquifers in Texas, Nebraska and Kansas–and onto the period corn was subsidized:


Irrigated Acrage


The steady rise of ground-water withdrawals for irrigation was particularly dramatic in the 1990s for Texas and Nebraska, and the decline in regions like Kansas may have already been precipitated by a draining, as much as a drying up of, aquifers:


Ground-Water Withrdrawls for Irrigation

1 Comment

Filed under agribusiness, agricultural subsidies, agriculture in america, groundwater, High Plains Aquifers, mapping ground-water withdrawals, Mapping Water Depletion, monocrops, monoculture, water table

The Way We Eat Now: the City and the Farms

The impacts of radical over-specialization of agricultural lands in the United States on our food supplies is only beginning to be mapped with the critical eye that it deserves.  With the intense expansion of ‘mega-farms’ jumping some 20% just in the years 2005-7, their expansion of subsidies, and an intensification of the quarter of vegetable production for animal feed, the notion of agricultural stewardship has been replaced by an artificial market and explosion of selective crops.  Is the notion of an agrarian space indeed itself a casualty of this new use of farming in a land of the death of the family farm?  Is this the end of an ideal of cultivable space, or does it push us to seek to imagine a new relation to the land?  It is indeed striking that until fairly recently, the ancient term ecumene or oikumene described the inhabited (or inhabitable) world with reference to those lands able to be used for agriculture or pasturage. 

The extreme “specialization of the agrarian landscape” William Rankin recently mapped offers visualization of data from the 2007 Census of US Agriculture:  the maps charts variations in crops and animal pasturage in each county of the country, each of which are colored by the gradations of four to five major crops or farmed livestock in the United States.   The selectivity of farmland use it reveals captures the effects of this expansion and maps the consequence of that dramatic expansion of mega-farming in the Bush presidency of those years, in response to selective subsidies of corn and soy:   the color-coding of individual crops provide a snapshot of the proportion of land devoted to each subsidized crop (soy; wheat; corn; cotton; vegetables and fruits or nuts) that  raise to raise big questions about our limited foodscape and suggest the degree to which farm subsidies inform land-use in desirable ways.

Even more striking than the limited regions of land used for farming in Rankin’s data visualization is the creation of the zones of land dedicated to wheat, soybeans, silage and corn that rarely if at all overlap, where over 50% of county land is dedicated to soy, a solid 40+% is dedicated to wheat, or over 60% to corn.  This is not only a map of agrarian distributions, but a the creation of a new attitude to agricultural space:  indeed, Rankin’s map helps us see the distribution of croplands in the country less as something that occurs on a flat surface, but in itself creates a new familiarity with space, and a relation of our food supplies to space, as much as a form of “geographic” knowledge of how events occur on the map.  For the sequence of maps chart a shift in the American foodscape, where we revise how we imagine agricultural space, and as creating a new notion of our agrarian space, rather than as changes that can be mapped or occur on the two-dimensional distribution of mapped space.

Rankin’s set of three maps of the national foodscape are not historical per se, but suggest a metageographical narrative of how attitudes to land have changed in their spectrum of such scattered colors.  They chart an extraordinary degree of remove from local intake, distribution or demand.  The distortion in this agrarian landscape is of course enabled by a huge transport industry, moving the wheat grown in the central band of the US from Iowa or Nebraska to Oklahoma, corn from Wisconsin to Iowa, to the soybeans so densely grown across South Dakota and Iowa to Indiana and Ohio.  Although continuity and coherence as the central properties of terrestrial maps, an absence of continuity in the concentrations of crop cultivation suggest a skewed relation to the land–the maps undermine the very notions of continuity and coherence that defined maps of national territories–using maps to raise questions about food supplies.  All the silage in across the Eastern seaboard in the country seems to derive from the local profitability of livestock products, show a nation almost drained of agricultural productivity, and relocates fruits and vegetables to ribbons on both coasts.

The consequent de-coupling of food markets from growing habits inverts Thomas Jefferson’s ideal of a yeoman farmer who planted crops for his own needs, out of the conviction that those “who labor in the earth are the chosen people by God.”  The Jeffersonian ideal of stewardship,rooted in a contractual relation of a responsible servicing of the land, rested on “good practices” of land management through rational skills of crop rotation, terracing to prevent soil erosion, promoting the diversification of varied crops, and surveying of land, from advocating a regular seven-year cycle of regular crop rotation that follow corn and wheat with a variety of crops, including turnips, clover, vetch and buckwheat.  He pioneered innovations that would increase the conservation of resources as well as crop yeild, including deep contour plowing, turning the ground far beneath the topsoil, and terracing to prevent soil erosion.  And his quest for variety and diversity for the agriculturalist no doubt encouraged him to introduce eggplants, brussels sprouts, rice, chestnuts, cauliflower, nuts and olive plants to the country–Jefferson imported 170 different fruits and 330 vegetables in the period from 1767 to 1824 to diversify the nation’s agriculture.  Jefferson was vigilant in advocacy of agricultural stewardship and famously wrote Washington with dismay in 1793 that “we can buy an acre of new land cheaper than we can manure an old one.”

William Rankin’s three data visualizations map the remove of what we eat from where we grow, or where we grow and what food we buy, suggests the imposition of an artificial remove of growing and husbandry from urban life–creating a gap between the country and the city so great that we cannot say where the country is.  In mapping the geographical remove of crops from cities–and of cultivation and animal husbandry from centers of population, Rankin has charted the results of a dysfunctional division of land-use, in which the map transforms the territory, and almost precedes it, as the areas zoned for harvesting by agribusiness divorce local needs of populations from the large-scale farming and animal husbandry, not only fostering a lack of a uniform food-harvesting mosaic, but a super-regional specialization, as this map of the crops that are grown in individual counties reveal:  the disorienting nature of individual to food, and individual to agriculture, that results removes the production of crops from local demand or a topography of need.  Indeed, there seems little clear integration of the sites of growing vegetables or crops to a national market in local terms, as questions of national demand and pricing drive the redistribution of crops into what seem “hot-spots” of production, whose intensity of cultivation tries to keep up with the national need with an intensity that their concentration is unable to effectively sustain in the future.

The pronounced discontinuities in the maps of food specialization reveal a deep disconnect between food production and consumption, and the limited understanding of how reliant we’ve become on an unequally pronounced distribution of such basic needs as growing crops or raising chickens.

Rankin's Map of Crops

In this map, Jefferson seems to meet Baudrillard:  the maps does not simulate a world of rending to the land with clear coherence, uniformity, or indeed boundaries, but visualizes a range of databases that reveal the imbalance by which we try to create the illusion of a land of plenty in an era of few farms.  This map undermines the security of a healthy nation, beyond reconsidering the pathways or quality of food, to force one to ask how the foodstuffs produced in these spaces could be high quality.  Reading the map will salutarily ward of any temptation to naturalize this self-evidently artificial division of land-use, or naturalize the imbalances of select crops in regions– the six colors used in the map are, indeed, almost always distinct from one another in the above map charting variations in degrees of crop specialization.  The map is a  metadata visualization, and absence of any attention to continuity in the agrarian structuring of the land, disrupts the continuity of the iconic image of the map.

Like Jasper Johns’ 1961 Map, which re-inscribes the encaustic splattering of primary colors that distance the map from its iconic status:  the surface of Rankin’s maps distance observers from the nation, rendering unrecognizable the form of the territory, abstracting the surface of the map by revealing an uneven uniformity instead of a united whole and focussing attention on the unwarranted density of selective agricultural concentration on specific crops.

800px-Jasper_Johns's_'Map',_1961

If maps don’t define and distinguish national sovereignty, but are a range of widely diffused simulations, we need an actively deconstructive map to assemble our disjointed foodscapes.  The dramatic isolation of foci of planting of wheat, soy, and three intense pockets of cotton, the absence of vegetables from most crops across the nation is a reminder of the separation of how we inhabit the nation from agrarian land-use:  citizenship is disconnected from stewardship, or the illusion of stewardship is no longer possible to perpetuate in relation to the land that no longer exists as a coherent territorial entity.  The remove of crops from local use, and the injection of subsidies to promote specific crops in Midwestern states, but also in the Northwest and South, created intense pockets of over-intensification that with the growth of megafarms has produced, despite the temperate nature of the continent.

2012-hardiness-zone-map

Perhaps these distortions of agrarian landscapes is an effect of the markets being driven by international prices, or if a radical specialization is striking for its remove from what we eat, even if not all have heads of leafy lettuce and arugula salads on their tables:  crops like wheat and soy are farmed in mass in select places for massive milling and repackaging; local food needs are met by importing across the nation, if not scattered boutique farms or “farmers’ markets” that are not run by farmers but franchised, or run by men who drive hundreds of miles with diesel gas in order to perpetuate the illusion of a close relation to the fruits of the land to folks living on asphalt pavement and tar.  We use food to create our own illusions, drawing from mythologies of agrarian responsibility that history provides.

Thomas Jefferson rooted democracy in the relation of the citizen-farmer and his land, metaphorically equating that relation to the fabric of the nation:  “the greatest service rendered any country is to add a useful plant to its culture,” he argued, equating individual agricultural stewardship as a “service to the nation” that is “worth more to them than all the victories of all the most splendid pages of their histories.”   When Jefferson preached the gospel of the agriculturalist, farmers were central to a nation’s needs both for feeding the nation and as stewards of the nation’s agrarian wealth, rather than white-color workers or professionals.  And so he valued agriculturalists’ expertise in crop rotation, fertilizers, and agronomy as remedies to the perils of land-abuse and erosion of lands, and located the preservation of the wealth in the countryside and the value of good, arable land.  The concern that led Jefferson to increase the diversification of vegetables as fundamental to the nation’s health led the horticulturist Luther Burbank in the early twentieth century to perfect crops able to sustain disease and blight, by hybridizing fruits, vegetables, and legumes by cross-pollination in strains of increased tolerance–if not genetic diversity.

When Burbank redefined performance of crops by their productivity and survival rates, he redefined plants and vegetables as a malleable resource subservient to man, though without encouraging an over-specialization similar to what we see in today’s foodscape.  Burbank’s shift in the significance of the vegetable in the world underlies, in some fashion, the metageography of the current over-specialization spatial distribution of crops Rankin maps, as it removed proximity of the place of cultivation from the growing of crops, and removed crops from the local market place.  Rankin’s beautifully detailed land-use maps chart the radically uneven nature of the specialization of our agrarian landscape’s distinct fracture lines.  To judge by the deep pockets of specialization in Rankin’s maps by the variations in anima populations in individual counties, the thinning of farms extends not only over the deserts, but across most populated regions.  This over-mapping of different types of husbandry reveals a virtual segregation of chicken, sheep, and cattle, with other areas left curiously blank, in need as much of importing foodstuffs across county lines, despite the thin distribution of cows for pasture, and a large welling across the midwest and southern Eastern seaboard of pigs.

The image suggests a set of deep imbalances and a surprising disconnect between areas and a patchwork redistricting to meet and accommodate national demand in specific regions.  The thin distributions of light violet colors conceals pockets of intense specialization with a clustering of pigs and turkeys, but suggests the extremely rare grouping of a variety of meats by mapping the ranges of density in practices of animal husbandry across the nation.

animals2007_medTogether with other maps which were solicited and edited by Darin Jensen in FOOD: An Atlas, a project broadly discussed in two earlier blogposts, Rankin’s metageography is oriented to imagining relations between food and the land.  The maps discussed in earlier blogs were data visualizations, and less informed by GIS, and bore the trace of the cartographer’s hand.  But this map is in no ways removed from being an intervention on cartography as an art, if it is based on “big data” as a structural metadata visualization of variations in local databases.

The data distribution of crops, animal livestock, and the profits of farming registered in the Census of Agriculture reveals not only strikingly constrained areas for active agriculture, but the geographic remove at which farming stands from food needs.  It presents  a clear-eyed critical view of the benefits of locally sourcing food by inviting us to shift our relation to the currently lopsided nature of national practices of cultivated space, but also suggests the distorted nature of food map created by the limited intense cultivation of crops and husbandry of animals in select areas.  I’m interested in both the maps and the questions of human geography that the distribution of food in them raises:   during the growth of agribusiness and consequent pronounced localization of livestock, slaughterhouses, and tending of animals, and map an increased remove from the sources of our food.  With a lack of available local food, indeed, food is not only less nutritious, but removed from place in the manner that Jefferson had insisted.  In such a landscape of specialization, “No major city could ever source all of its food from local farms–not even those close to major agricultural areas.”  Not only are few farms profitable, but those areas farmed are farmed with an intensity of agribusinesses more market-driven than linked to local economies.

Indeed, the apparently unprecedented concentration of mono-crops–wheat and soybeans; corn; cotton–creates a disjointed landscape both removed from local needs and plugged into a national (and international) market and in which much feed goes to livestock–though, as we’ll see, in which livestock is not so profitable.  This maps reflect on the consequences of how constrained farmlands shape a collective geography that leaves consumption curiously disconnected from production, which faces markets that the individual farmer cannot understand, and indeed are more subject to international prices and agricultural protectionism than to actual needs.  The regional saturation of essentially businesses of food production reflects not only a death of local agrarian farms, but the impossibility of local crop variation in a landscape of regional concentration for foreign markets, animal feed, and available land.

These attitudes might change, if we accept how Rankin’s radical cartographies reveal the narrow divisions we’ve imposed on our agrarian landscape.  But they delineate deep challenges of our national foodscape from even Burbank’s era of a range of resistant potatoes, peas, corn, and various pitted-fruits, including plums.  No longer does agricultural needs of a territory shape the contents of the foodscape, and maps lose their reference to a fixed territory, but map a disconnect:  Baudrillard would note that the notion of a territory does not in fact survive the map.  The map might suggests some links between our distorted agrarian landscape to the political landscape, and not only in the government subsidies that many crops receive to grow at a distance from urban populations, or the diversion of water to allows intense crop cultivation of regions like the central valley.  From a nation of farmer-citizens in a Jeffersonian mold, our “red” v. “blue” state electoral topography may mask deeply market-driven divisions in agrarian resources.

The data visualizations suggests the little attention we dedicated as a society to the role of land to food, or to the path from farm to table; the intense cultivation of crops, vegetables, and pastured meat to restricted pockets of the country practically ensures the remove of our food from a provenance or site of origin.  Rankin’s maps provoke us to map our own individual relations to the origins of our food, and trace their path back from sites of cultivation to our tables.  His maps delineate the broader challenges of our national foodscape;  maps may enjoy limited authority or exclusive purchase to represent or contain such abstractions as the nation, state, or nationality, but provide a way to disrupt a world of simulations, where the territory does not precede the map.  Jean Baudrillard famously asked pointedly whether the nation’s authority can survive that of the map:  the coherence of the United States as a food-producing nation can’t easily functionally survive the unsustainable practices agribusiness has dictated, even if the market can sustain it for now.

The objective disassembly of a national space raises questions of the compatibility of current practices of land use are even compatible with a national space.  Indeed, rather than map the relation of food to population, one could argue that the map mirrors one of uneven agricultural subsidies, as much as food demand or land cost, and illustrates the bloated landscape those subsidies are creating in place of agricutlural variety:

indemnity by county

This can also be illustrated in relation to animal husbandry by mapping the local density of factory farms across the nation:

20101202-factory-farms-US

Rankin’s maps are of land-use reveal the effects of such subsidies for large farms in their “disjointed and lumpy space[s] of specialization;” they reveal a surface of farming where “few areas where different commodities are grown side by side” and radical concentration of cattle and livestock in specific areas, despite their thin distribution in the country as a whole.  The rather lopsided topography of sourcing meat and centering husbandry in massive compound farms suggests a sort of anonymity of their origins, less than healthy and less than nutritious, and suggests a mental familiarity with erasing the origin of foods, rather than considering the relation of food as a “good.”  The economic intense over-specialization to some extent ensures the virtual anonymity of  paths most foods take from where they grow to the table or the supermarket aisle.  This notion of food whose path from farm to table is devoid of specificity raises questions about as knowledge of the ability to distinguish food, as well as how its freshness is radically reduced in a system reliant upon quick transport. 

As agribusiness replaces the good household practices of individual agriculturalist moving foods from limited sectors of over-cultivation, subsidies define circumscribed areas of crops and animals–here mapped by the specialization of crops or the density of livestock in each county–and limit their profitability.  With the exception of some crops in the Midwest located near to cities or towns, in fact, a radical concentration of agriculture removes the individual’s dining room table from growing practices. Take, for example, the location of soybeans, marked by red, in some regions of the Midwest, that define a relation to the commodity outside the food that is actually consumed:

red crops--tghe sites of soy

The dramatic disruption between farms to urban foods and divide between local food-supplies and consumers to reveal a deep shift in our connection to the land.

While fundamentally data constructions, these maps give new sense to the materiality of the map, by providing a visualization not of expanse but suggesting some of the ill-effects of our own division of land-use.  Lest we naturalize the divisions created by this specialization of land-use, they map the stark divisions of  the origins of the food we eat poses compelling (and pressing) questions about the best way we might provide nutritious food to urban populations, and if we can economically sustain the current landscape of intense specialization of agricultural work.  One irony of this division of the agrarian functions is the illusion we are  healthy to invest one or two crops to one expansive region.  Indeed, this illusion masks dangers in segregating crops in the landscape and a fracturing of our relation to our food.  The widespread naturalization of one state or region as the center of corn or wheat, potatoes, vegetables, nuts, or cheese conceals an implicit consent to the current culture of specialization has segregated the production of meats, wheat, corn, cotton or grains in only place, in ways that effectively naturalize an impoverished practice of agricultural rotation:  by imagining certain states as lands of corn, wheat, or soy–as if crops were indigenous to a landscape–that erases the natural variety of an ecosystem by rendering it unrecognizable.

No clear sense of a landscape that provides nourishment for the nation remains, as agricultural “space” is itself dismantled as a uniform concept in relation to the nation.  Rankin’s cartographies map the extreme variations in the dedication of land to the intense cultivation of foods, plant and animal, and we might re-examine the silent segregation of an agrarian landscape through its consequent perils.  The database from the USDA that he has used reveal a concentration on crop monocultures and an agrarian centralization, à la Charles Taylor, of crop production.  Hopefully, we can use them to take stock of whether this is healthiest way to feed our cities and urban populations–to segregate or actually remove most cropland from sites of urban population.  As agribusinesses have concentrated the cultivation of wheat in a band in the central states stretching in regions colored bright green,  corn and soybeans in the yellow and red northern midwest, and fruits and nuts, the result is an increase in the remove from which our cities are nourished.  Populations stand at a remove not only from the sources of food, but of the most nutritious choices of food.

The high degree of scary fragmentation of US agriculture reveals a heightened specialization of food-sources between corn, wheat, soy, and nuts or vegetables.  The isolation of pockets of food production reveal an intensity of artificial over-specialization often removed from a national demand:   the segregation of centers dedicated to agricultural production from centers of urban life suggests a divide between city and farm.  Even more significantly, perhaps, than the divide mapped in electoral-map chloropleths between ‘red’ and ‘blue’ states, the severely localized distribution of crops maps a huge divide in expectations among Americans for freshly grown food possible of being sustained, and to the landscape of food-availability; while the food landscape cannot provide a deterministic explanation of party affiliation or patterns of registration, the distribution may map populations’ selective distribution in areas with greater access to locally grown food supplies–or their resistance to the  remove and distance from crops and an agrarian economy.

That is no doubt perhaps overly optimistic, given the huge role of agribusiness in structuring the landscape of food use, together with the subsidies of foods that they receive:  the monocrop concentration of corn, wheat or soybeans is conducive to bulk harvesting for sugars or bread, and shipping, if not to their redistribution from select centers of packaging.

Unknown

But the sad (unhealthy) result is a remove of most populations, or at least huge proportions of them, from the sources of their food. The existence of such a selective resettlement is less clear than the dysfunctional image it suggests of a fractured relation to the agrarian landscape about which it’s hard to wax poetic.  The rare concentration of fruits, nuts and vegetables in California, densest in the Central Valley and farmlands of Northern California, are the only dense areas of their dense cultivation, save Southern Florida, based less on climate or topography than on their remove from coastal cities, and seem to provide the only dense region of vegetable harvesting in much of the nation.

What does this tell us about the state of California?

How can one imagine this disjuncture of agrarian space from the national space?  The classical poet Virgil idealized the relation of Rome to its landscape and countryside in the era of Augustus, providing a topos of the idealization of landscape’s tranquility as the result of harmonious good government.  And it’s helpful to cite Virgil’s praise of the wealth of agrarian diversity in the Italian peninsula, too, because they provided a model of the metaphorical cultivation of a proto-national space.  When one looks at Rankin’s weird maps of a disrupted foodscape, where over half the country is without crops and blank whitespace; they’re as removed from Virgil’s bucolic agrarian ideal as they are from Jefferson’s–indeed, those two are far closer to one another than we can see in how we’ve divided the nation into zones of soybeans, silage, and wheat that only occasionally overlap.  There’s a huge contrast the dissonances in the food landscapes that Rankin mapped above to Virgil’s famous encomia of the productivity of the Italic landscape in his Augustan Georgics, where he evoked the transformation of a rocky Italic landscape through the benefit of Senatorial edicts and decrees to a land of “abundantly growing crops” and “sacred home of the olive groves,” now dotted with “many wondrous cities,/That so much toil has built” whose crops were “abundantly rich;”  the land, tended by the best techniques of animal husbandry and of agricultural practices, provided the ground to cultivate wheat, barley, spelt and vetch in alteration with Egyptian lentils “in accordance with the Gods.”

That bucolic image of the productivity of the land that is fostered by Senatorial decrees and oversight of a diverse but homogenous space stand in sharp contrast to the segmentation of pockets of subsidized divisions in an agrarian landscape subject to intense monocultivation that is to large extent both largely sponsored by agribusiness, and largely removed urban areas or demand.  Tending the Italic landscape drove wealth to the “tot egregias urbes,” so remarkably diverse and bountiful, of the recently united peninsula Augustus ruled–and whose relative riches outshone any other region in the world.  The current landscape of specialization has so narrowly concentrated to focus agrarian productivity into scattered agrarian blocks of a zoned farming industry that dramatically disconnected itself from urban areas–and reveals a disconnect of city and farm so stark one could scarcely imagine a tie between the two.

Agrarian diversity?  Well, the new space is just complicated to manage or understand.  We know it’s unwise to concentrate corn and wheat in one area with soybeans, as if they were a large monocrop, because this exposes them to disease; the concentration of fruit and nuts in pockets of the entire country is even more irrational.  The placement of production of crops at a remove from populations produces less nutritious food, and generates more waste.  Equally difficult to sustain is the containment concentrations of livestock animals in select pockets of beef for slaughter, whose concentration is likewise removed from areas of urban concentration.  Despite small areas of cows lightly scattered for use in pasture for milking across most of the country, concentrated centers of butchery define the country’s food map.  Something like one-third of arable crops are given to land animals, but the segregation of high-density livestock farming from local agriculture suggest a challenging foodscape which might be considered more creatively, even if there is never much animal harvesting in the desert:

Drive down Highway 5 to Los Angeles past centers of slaughter and beef production.  The extreme variation is stunning when one approaches the cattle farms in California’s Central Valley, and even more scary is how characteristic this is in our agrarian landscape, rather than an  extreme fragmentation of land-use for livestock:

Califronia Animal Density

Consider the localization of livestock in deep purple gradations in Rankin’s  chlorpleth reveal a national segregation of zones of butchery limiting availability of freshly butchered meat:

Central Valley animal production

What does this say about our relation to space?  Let’s look at the crazy topography of intense pockets of “cattle compounds” and “chicken farming” that might not be called husbandry which make a broad mosaic of meat processing centers in the poorer counties of the American South:

American South

This snippet is barely recognizable as a map, of course, or a record of space. Remember the pretty staggering numbers that the deep purples reveal in this key:

Animals-Legend

Mass-farming of course unprecedentedly removes food from its consumer, and removes the very idea that this need not be the case.  The inhumanity of concentrating chickens in the Southern United States is one concern; the remove of chicken farms from urban areas or human consumption is poignant: it finds counterparts in the chicken-farms of the Central Valley and Imperial Valley in California, which are something like a hub in the West Coast save from those in the northwest.  But at their highest points of concentration, we have managed to concentrate an amazing 70,000/sq mile.  (Cattle are densest in the Midwest, where we find 700 cows/sq mile at the densest parts; fewer turkeys are raised, but the greatest concentrations of 5,500/sq mile seems downright unhealthy.)   Leaving aside ethical morality, the map posits questions of food safety:  intense centralization of animals and consequently of feed supplies increase risks of contamination as well as exposing them to greater threats of disease.  With the trends to global warming, the dangers of locating agriculture in fixed areas of intense over-cultivation are even more pronounced.

Such data visualizations offer a database which easily slips from the eye.  While these maps don’t overlap, they suggest a joint-access data visualization that might offer a useful planning device.  They reveal mono-crop cultivation and intense concentration of the value of animal or agricultural products that impoverish the project of agriculture in much of the country and seem to reduce the value of either crops or the production of animal products in most US counties in the absence of their intensification.  More striking, perhaps, is the small degree which farming maps to value across the entire nation, uniting both animal and vegetable products, and the huge wholes of agricultural profitability in over one-third of the nation.  We supplement these gaps through the massive importation of foods, vegetables, and produced foods.  But the fact that it is rare for vegetable-growing to bring in a profit through most of the northeast suggests a topography of agriculture that few wold suspect; the profits are limited to the rich green areas dominated by the crops of soybeans and corn, as well as wheat, that are similarly scarily removed from many population centers. Despite the comforting green that leeches down the path of the Mississippi River, ; meat seems only profitable in Oklahoma and parts of the old South, sites of large concentrations of cattle- and chicken-farming.

Agricultural Value Map.rankin

The washed-out nature of large areas of this map suggests the low aggregate market value of product made in those regions; there is a surprising density in few counties where animal products provide profitable earnings.  This is, to be sure, but one sector of the economy; but it maps an important one:  the divides Rankin maps not only poses questions of how we see our land, or use resources but of how we imagine the remove of farmed land to a vital urban space–and indeed how economically removed agrarian practices have become from urban consumers across most of America.
crops2007
The lopsided  geography of land value creates an uneven distribution we all tacitly know but don’t acknowledge.  It is also a basis of land-use that is not economically sustainable.  One take away from Rankin’s series of visualizations of the discrepant distribution of agriculture is that at a time when we dedicate increasing attention to the construction and planning of urban space, rural agriculture might be better planned in concert with urban concentrations, and not only for reasons of health but as a matter of public policy.  We often need a map to reveal the artificial nature of what we naturalize.  All three data visualizations suggest that we’ve left agriculture to market forces alone, in ways that might not plan for future development; imagine the maps as overlapping public access databases we might use to orient ourselves not only to space, but to a more sustainable relation to the agrarian use of the land.  The needs for such a shift in orientation are not only for health, but economic:  it’s not possible to prognosticate from a map, but we can use the visualizations to raise questions about what would be the effects of climate change on districting agricultural land-use to specific sectors and types of crops;  the concentration of corn strains in one area, moreover, raises possibilities of adverse influences in the food chain of GMO strains, much as the concentration of both animal livestock feeding raises specters of tainted meat supplies.
The limitations and constraints of agribusiness are imposing, if familiar.  There has been some local pushback.  Discomfort with these constraints undoubtedly informs the recent retrenchment of urban gardening and even urban rooftop gardening across the urban United States.  Much as the growth of farmers markets may have encouraged or initiated widespread interest in centers of urban agricultural use within an urban landscape, as if to react to the marked remove of food-availability–as much as fresh food–from urban space, and the poor nutritional qualities of food that result.
What can we make of the local attempts to bridge the town and the country, either in the preserves of the new spaces in cities created at farmers’ markets, or the growth of urban agriculture?  I’ve gestured to the attempts to map both in Oakland in some previous posts.  Around New York City, a previously isolated urban space is surprisingly permeated by active green space.  The Parks Department in fact only owns less than half of the almost 500 community gardens measured by GROW NYC and Green Thumb in 2009, with sites to volunteer noted in blue beside urban greenspaces:
Community Gardens NYC region
How many are open to cultivation?  Over 20% of those highlighted in yellow are dedicated to edible plants:
over 20%
Or the similar emergence of community gardens in Portland:
portland gardens

The growth of San Francisco’s roof-top gardens, which was so quick in 2008-11 that the city changed its entire zoning code to permit urban agriculture from expanding in all neighborhoods of the city, led to a Renaissance of urban gardening, despite the relatively close access of the neighborhood and city to fresh food markets, not to mention an insatiable demand for local food:

Mapping the economy of rural-urban relations is a big project for the future, but perhaps it is even more difficult to plan to do so given the investment in a model of land-use that cannot yeild many positive long-term returns.

Leave a comment

Filed under Big Agra, croplands, Cultivable Land, data visualization, factory farms