
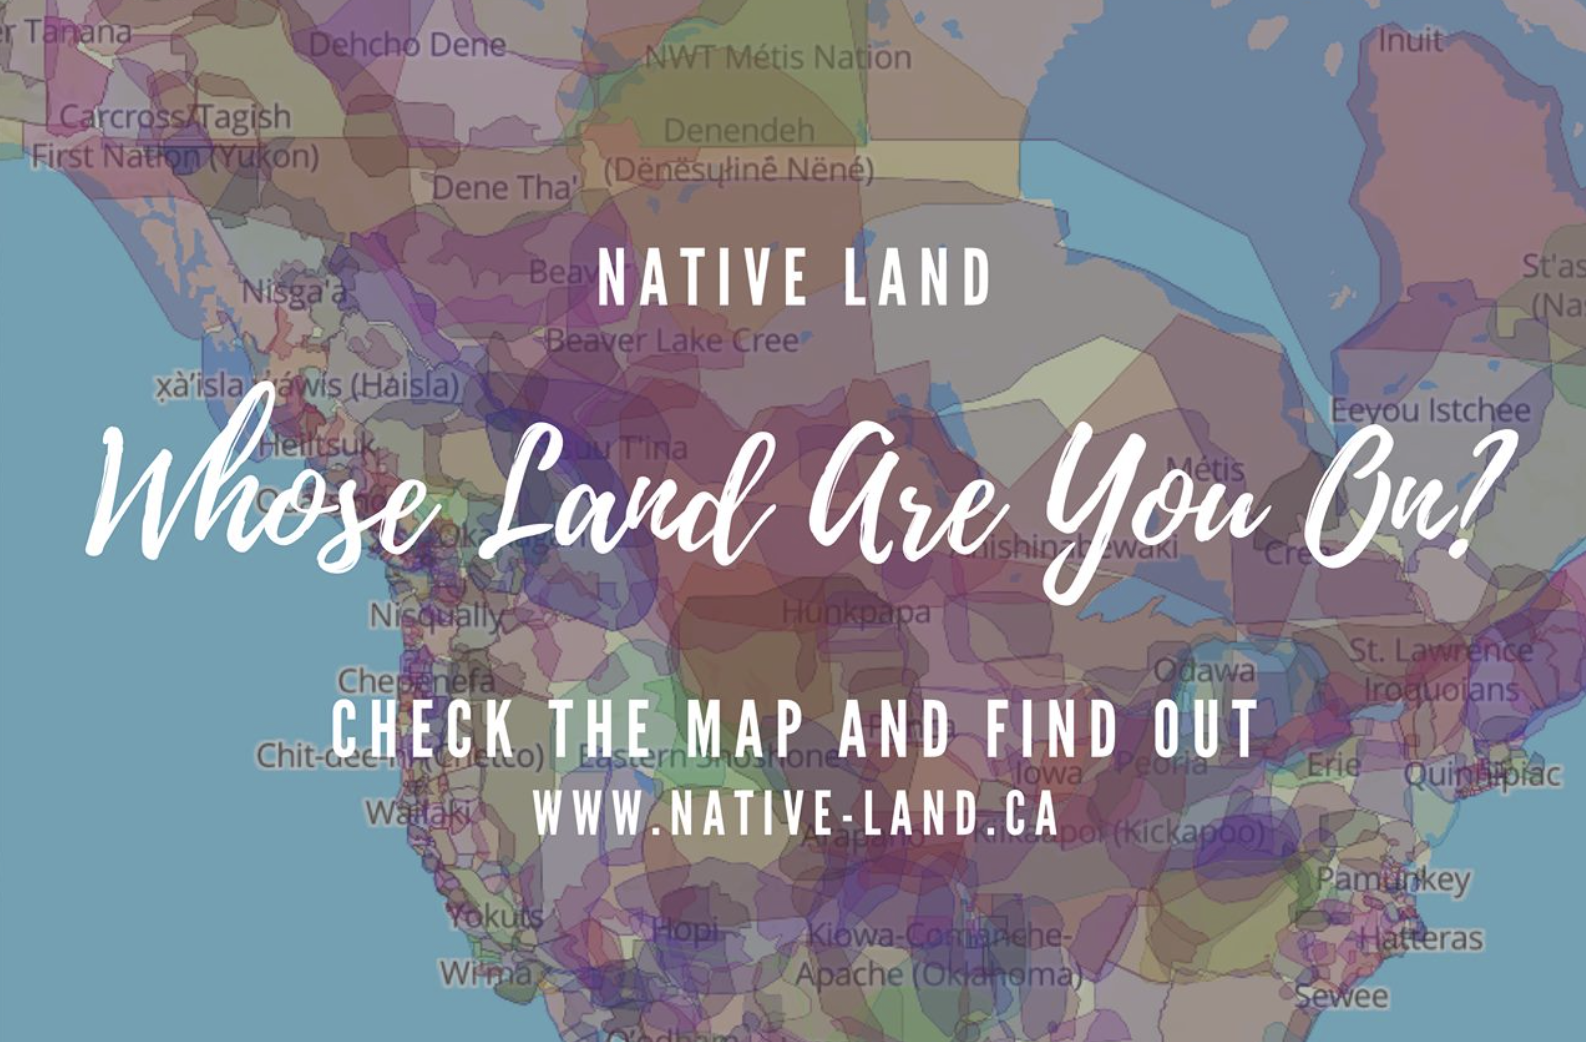
Geodesy has increased the number of claims by extractive industries through remote sensing, and especially over indigenous lands. Yet crowd-sourced tools of geolocation have also enabled a range of counter-maps of indigenous native land claims that have pushed back on how industries that have increased access to the resources buried beneath the very lands to which indigenous groups have ancestral claims. Indeed, powerfully innovative webmaps like Native Lands–previously launched as “Tribal Lands”– provide not only a new standard for cartographic literary, but to change ideas of property–as much as give vitality to ideas of property within a new cartographic medium. Indeed, if the original moniker of “Tribes” suggests a non-state actor, the enhanced claims to a public voice in “native” lands suggests an alternative way to stake property rights, and acknowledge and redress the multiple land “cessions” that stripped indigenous property rights.
Boundaries were an invention of the enlightenment, creating clear lines of personal property as well as national bounds. The blurred boundary lines offer an opportunity for ethical redress of the lost of lands indigenous have roundly suffered from the uninvited Anglo settlers of North America, a counter-mapping that is alive and well on web maps. The decisive choice to blur these boundary lines reflects the cartographic preoccupations with which the American government long has regarded indigenous inhabitants–not only as the governors of states and then the federal government forced migrations of tribes into areas that they viewed as “uninhabited,” but as late as 1877, when the Secretary of Interior deemed “there is some difficulty in drawing a line sharp between the California Indians and their neighbors,” who, Stephen Powers told his superiors, “shade away from tribe to tribe, from valley to valley, so that one can seldom put his finger on a river or a mountain-range and say that here one nation ends and another begins.” If landscapes were refigured as bounded expanse, the attempt to inject a sense of on-the-ground experience in maps is the goal of the open source mapping platform Native Lands–an attempt to integrate indignity into the platform of mapping itself.
The cartographic undoing of the primacy accorded to settled land and settlers’ claims is not only revisionary, but a new reality we have rarely seen–the cartographic inheritance of the first settlers of North America eagerly imagined extending land claims westward to the Mississippi River, encompassing the Great Lakes in their maps–

–as if the claims of land might continue to extend westward, across what was seen as tempting green, fertile, and unclaimed, if perhaps not uninhabited, unordered lands populated by the Outworks, Outagamis, Osages, as the Uttawais in upper Virginia straddling to New York, Iroquois or Six Nations on the edges of Pennsylvania and New York, Missasagos north of Lake Erie in a nominal Virginia, Twigtees of Virginia, Cherakees in North Carolina, and Algomkins on the borders between Virginia and Canada, and Creeks in South Carolina and Georgia nestled within the borders of existing colonial land claims, as if their relation to the land didn’t need to be mapped, and had no borders of settlement–or rights–of their own. “Illinois” was “expelled by the Iroquois,” and the contested borderlands, but the conception of wandering or itinerant landless groups was clear.

A New and accurate Map of North America, Drawnfrom the famous M. Danville with Improvements from . . . English Maps, London, 1771
The map was printed in London with the benefit of recent cartographic sources from French Jesuits as D’Ainville as an invitation to settle North America, promising open lands able to be surveyed and owned by future immigrants, and an early evidence of envisioning America as a land of wealth, the landlessness of indigenous was clear. It was a legacy, moreover, firmly lodged in our nation’s own cartographic imaginary, that has long understood indigenous as outside of federal bounds. Indeed, the mapping of properties in the North Atlantic for English Plantation Owners in the British Empire saw no place for the very indigenous who were figured so prominently in feathered headdresses in the map of North America’s cartouche.

Indeed, the original 1755 map for the Earl of Halifax and other Commissioners of Plantations baldly all but invited the staking of claims to property as there for the taking across the entire continent!

Map of the British and French Dominions in North America (1755), Library of Congress
The mapping of property by straight lines and tools of surveying had promised the opening of the entire continent, as if without any objections or interference from those inhabitants who lived on ancestral lands. If the same pastel color scheme is adopted, for new ends, in NativeLands.com, the maps try to undo the tyranny of cartography in opening up the continent. For disregarding or blurring of any boundaries is a way of disenfranchising indigenous from the continent, and denying that any territory existing among a peoples long cast as lacking government and having or claiming a title to land.
If one might succeed in mapping the inhabitants of a land continued to be seen as contiguous with an unbounded nature as better mapped by language groups than territoriality: even the largest of indigenous nations in the Central Valley of the state “have no common government, and not even a name for themselves”–just “a common language, with little divergence of dialects for so great an area as it embraces . . . but little community of feeling.” Rather than defend territorial boundaries, Stephen Powers noted in a North American ethnology Tribes of California, that tried to shoehorn indigenous into mapped states, tribes in the Sacramento Valley “believe that their first ancestors were created directly form the soil of their respective present dwelling-places.” Whether the language of borders and boundaries had been returned to in the expansion of the western settlements and the creation of reservations of bordered territories, already salient in newly mapped “Western territories” of the early nineteenth century, showing indigenous settlements in vague termsbeyond Little Rock, Louisiana, and the Kansas prairies.

The question of how to reconcile indigenous inhabitants of the new world with the tools of mapping states was.d long felt, an epistemological struggle, at heart, cast as a legal search to draw bounds on indigenous maps, less rooted in exclusive claims of property–the basis for western maps–or property laws. Rather than embody a “commons,” the long and tortured history of land sessions affirmed to native peoples, often signed under duress, without clear understanding of their consequences of what provided precedents for land claims, informed–or stand in uneasy dialogue with–maps of indigenous presence across North America, as rights of land use were marginalized from the 1830s, with the appropriation of indigenous lands sanctioned by the Indian Removal Act (1830). As the forced migration and approval of dispossession continued, Thoreau’s sought traces of indigenous inhabitation of New England–through the adoption and compilation of place-names and sites that he found of special significance to the nation–to push back against that Act, perhaps, as if to reclaim or restore symbolic awareness of that fast-fading past.
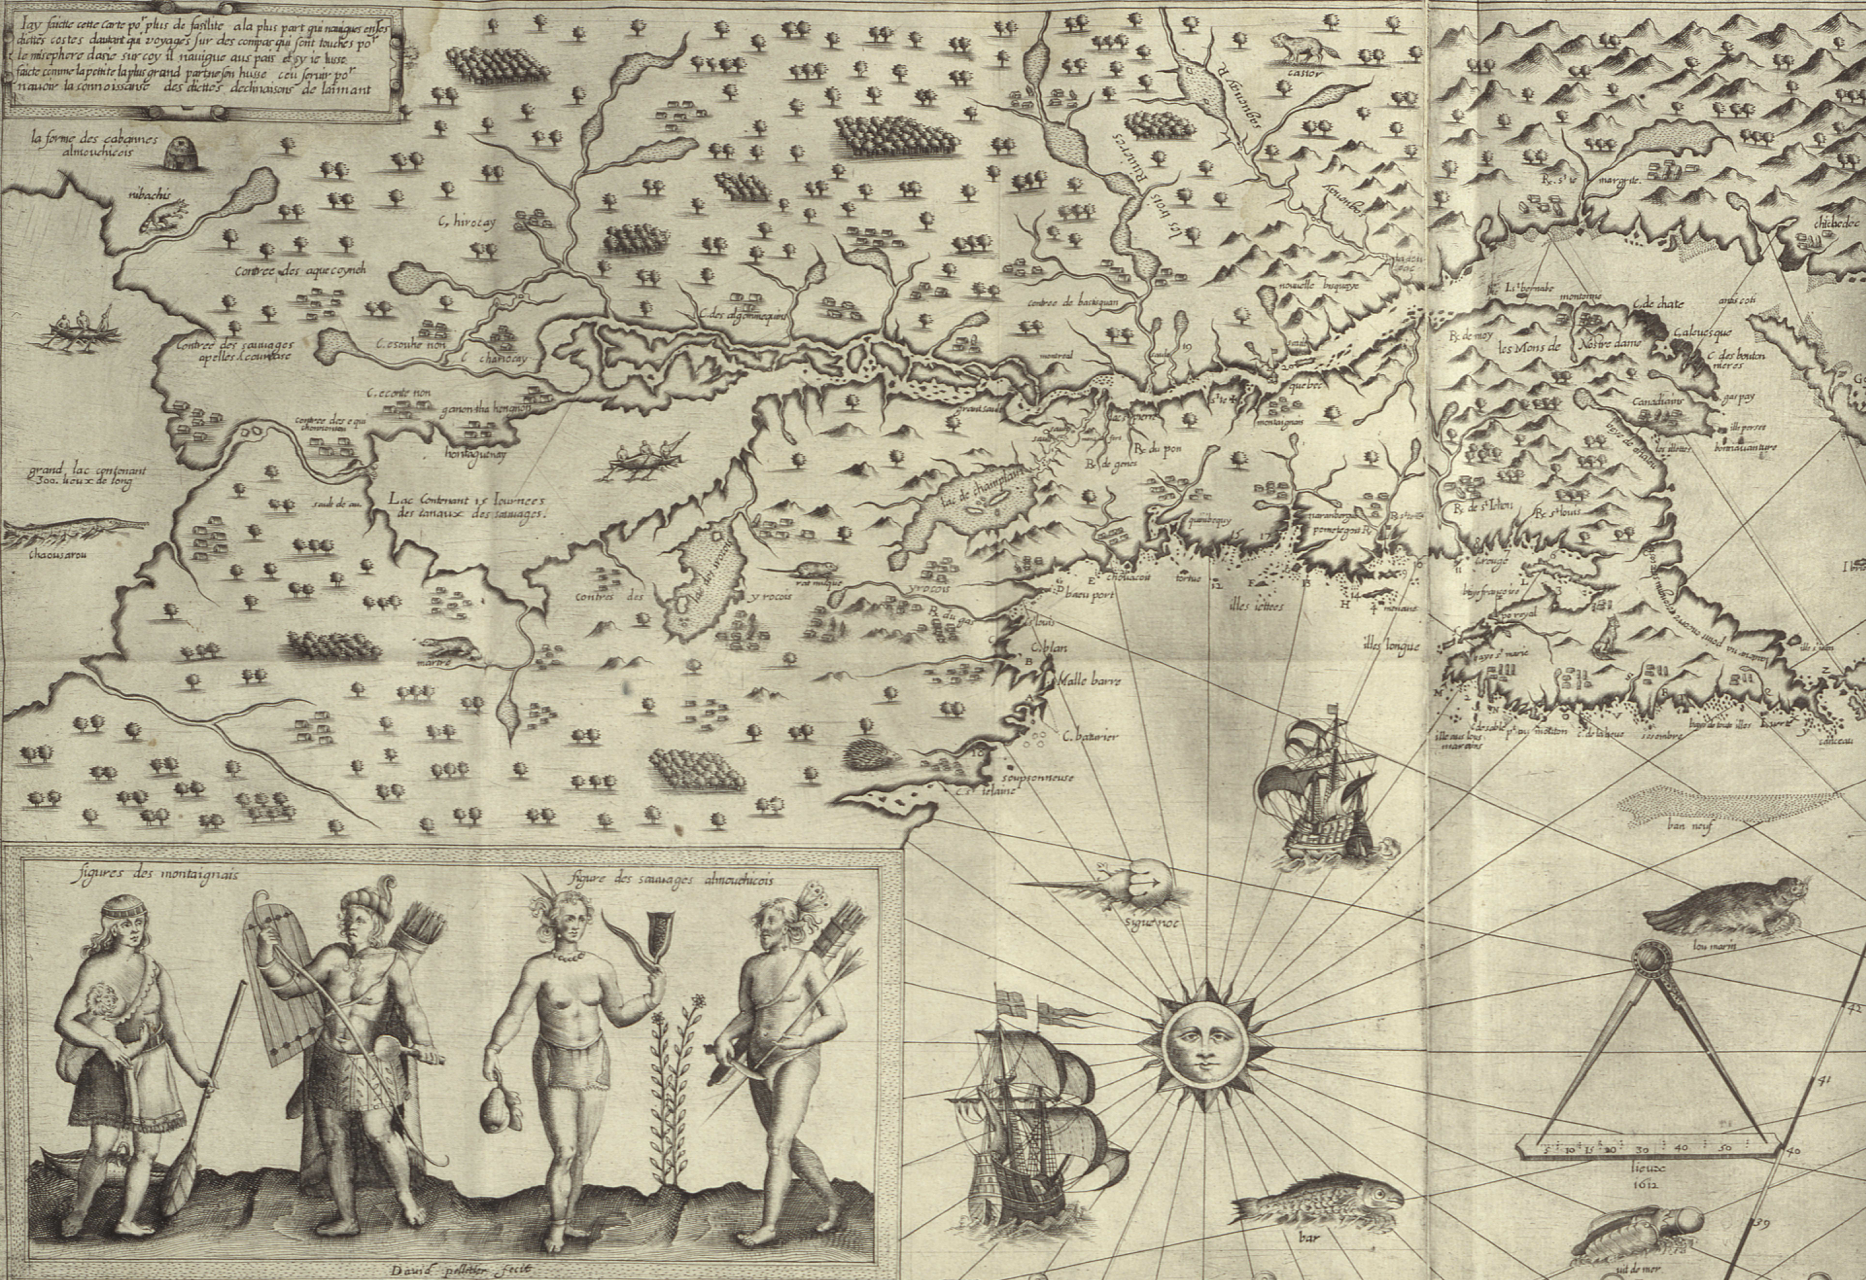
Thoreau returned eagerly to early maps, imagining an earlier era of cohabitation in the New World he imagined might be recuperated or intuited from Champlain’s 1612 “Carte Geographique de la Nouvelle France,” which he had idealized as capturing a moment of contact where natives were not yet mapped off a new national map. If Thoreau had little basis for creating blurred boundaries in his maps, NativeLands hopes to use online platforms to affirm the existence of precedents for the future, with the benefit of hindsight of the historical cessions that confined the indigenous presence of Americans into far more constrained territorial confines of current “reservations” and lands of indigenous governance–even in as small an area as Long Island, an area dear to Walt Whitman, who knew it as Paumanok in homage to its first inhabitants, and recognition of the early land cession of Algonquians resident in the region who in May 3, 1639, deeded the region to one Lion Gardiner of which the webmap shows a far more complex picture than Whitman rather idealistically and romantically imagined to derive from a historical document of the 1639 land cession signed by “Yovawan, Sachem of Pommanocc.”

Thoreau rather hopefully that he might access an accurate remapping of historical land-claims in his own native New England by an earlier print precedent. He viewed the early modern map as lenses to mediate an area of settlement before settlement and contact, soon after he had left his solitary retreat at Walden Pond. Although Champlain in 1608-11 only encountered the tribe he knew as the Armouchiquois while exploring the St. Lawrence River and Maine coast, he took far greater notice of their presence than the current federal government, or indeed the state of Massachusetts in its recently completed land surveys of privately held and public lands. Yet the historical map Champlain created of native peoples and fruits resonated with him as a deep tie to the land, leading Thoreau to retrace its contours to capture that primeval moment of real contact.
Clear designation of the past presence is oddly evident in notations of early modern maps, albeit outside of clear boundaries. Indeed, on the surfaces of many early modern maps, the capital letters of early colonial states commingle with the tribal presence of Shuman, usually mapped near the Rio Grande; Natchitoches, a Caddo-speaking people now located at the borders of Texas, Oklahoma, Arkansas, and Louisiana; the Cododaquio or Great Caddo on the Red River; Chicachas or Chickasaw of the southeastern woodlands, whose forced migration west of the Mississippi lost their ancestral lands in 1832; or Tchatas or Choctaw who once dwelled across what be came Alabama and Mississippi–or the Alabamans or Alibamu tribe, tied closely to the Coushattas, belonging to the Creek confederacy. These names, and others, legible on the map, as evident in the 1764 Atlas petit marine, were preserved in maps prior to American independence and sovereignty, can be seen as stylistic ancestors of the alternative forms of noting ancestral claims on web-based maps.

The growth of consciousness of ancestral land claims has promoted a need to accommodate property claims that had promoted a mapping of jurisdiction along clearly demarcated lines, ending or eroding indigenous land claims, and parallel the search for a new legal framework to acknowledge and recognize past claims of historical habitation that had been eroded by a treaties, land cessions from claims of collective possession, and fit a new legal language of ancestral lands often excluded from property law. After all, back in the famous if not canonic account of the Plymouth Plantation that the Puritan William Bradford wrote, the sites of Europeans were already firmly set back in 1650 on the “vast and unpeopled countries of America, which are fruitful and fit for habitation, being devoid of all civil inhabitants, where there are only savage and brutish men which range up and down, little otherwise than the wild beasts of the same,” perpetuating a quite distasteful image among Puritans–who saw the inhabitants as satanic in ways that are difficult to acknowledge–of lacking ‘civil’ grounds of inhabiting the selfsame lands, as well as being “cruel, barbarous, and indeed treacherous, . . . merciless [in their] delight to torment men in the most bloody manner.” The very first map that was printed and cut in the New World defined the theater of battle between settlers and Indians in New England, within the old boundaries of the Massachusetts Bay Colony, numbering each of the settlements that were attacked by ‘Indians’ in the French and Indian War, known as King Philip’s War at the time, producing a narrative map of the competition for the conquest of land that was prominent in settlers’ minds both in 1677, when it was first engraved in Boston, and when it was reprinted as one of the first works of Pendelton’s Lithography in 1826, as part of a broader history of New England.
The rather hateful image Bradford painted meant that hey not only lacked license to inhabit the lands by property rights, but constituted a civil danger for those settlers who colonized them–or arrived to set up commerce and trade on them. Bradford, who wrote the Plymouth Plantation history in the immediate aftermath of the Peace of Westphalia, inscribed the New World as an anti-Westphalian order of no boundaries, akin to a state of nature, but also left open the possibility of inscribing the landscape in a post-Westphalian order, an imaginary of boundedness that was divided by frontiers and mapped indigenous outside boundaries around exclusion, an imaginary of space that has continued to inform the cartographic imaginaries of indigenous from early anthropologists as Alfred Kroeber’s maps of Indian languages in California to today–not imagining the indigenous societies of the world to exist outside of and in relation to a bounded state or miniature mini-states. To be sure, Kroeber, an upper middle-class German Protestant born in Hoboken, New Jersey, imbued with the ideals of Boasian anthropology was of deeply rationalist bent, if a proponent of cultural relativism, was an unapologetic positivist, if, as his fellow-student Edward Sapir, believed the individuation of what Sapir called ‘linguistic stocks’ were distributed in regions that did not reflect anything like national lines and allowed a flow distinct from race: as Sapir suggested that structurally unified linguistic groups in aboriginal America might spread over like-minded cultural groups, rather than being isomorphic with cultural divides, and indeed mingle with one another and go to the same intertribal religious ceremonies, the groupings of language are historically rooted, not coinciding with divides culture or race, and not implying a nation–so much as rooted in a distinct setting–

Alfred Kroeber, “Indigenous Languages of California,” University of California, Dept. of Anthropology (1922)
–the divides of “native California” Kroeber mapped stood as a surrogate for the absence of laws, or of national belonging or identity. Sapir, born in Pomerania but migrated to the United States at 5 years of age, must have studied with the father of American anthropologists worked with Kroeber to map indigenous languages after finishing his doctorate in Native American languages, was soon employed by the Geographical Survey of Canada given his expertise in indigenous language families as the Athabascan, Algic (Algonquin), Uto-Nahuatl, Southern Paiute and Chinkookian language groups, providing some of the first authoritative “maps” of regional indigenous languages, enticed by the manner that indigenous languages shook traditional assumptions of the origins of language, and committed to the study of linguistic typologies distinct from race or ethnicity, collaborating with indigenous informants and setting his sights under Kroeber’s influence on the Yahi language between the Feather and Pit rivers in Shasta county, the language of Ishi, the “last wild Indian” who claimed to ‘have no name because there were no people to name me,’ or left to speak his name. For Sapir, a German Jewish refugee, the problem of the study of disappeared languages as linguistic groups was painful, but must have promised a sort of weird redemption.
The problem of mapping the presence of past indigenous remained on the front burner of native peoples. The difficulty of mapping the inhabitation of the continent outside of a Westphalian optic of fixed boundaries, by European concepts of territoriality and land possession, posed problems of the mapping indigenous presence of an epistemic dimension. The cession of land and territory, and the removal of land rights, have been cast in this Westphalian optic, networks of migration, trade, and sacrality or social spaces of the indigenous societies–and their relation to entities like rivers, lakes, or mountains, fails to translate into a syntax of polygons and bounded edges,–even if these are the edges by which property and parklands are increasingly understood. This has pose a problematic that Tribal Lands seeks to resolve. How can the multidimensional relation to space among indigenous be figured or mapped?
The problem of the plurality of land recognitions that NativeLands documents in its mobile maps across America document the complexity of native land claims in its web maps as a bounteous flowering of a multitude of local claims that seek not only to evoke the ancestral lands, but to show the wealth of inhabitants who, far from wandering, regard their claims to land as historical, and indeed were compelled to historically compelled to cede them. By the mapping of actual cessions and land claims, the wealth of material the mapping engine assembles offers a radically different nature of continental inhabitation–inhabitation that long antedated the Puritans’ arrival.
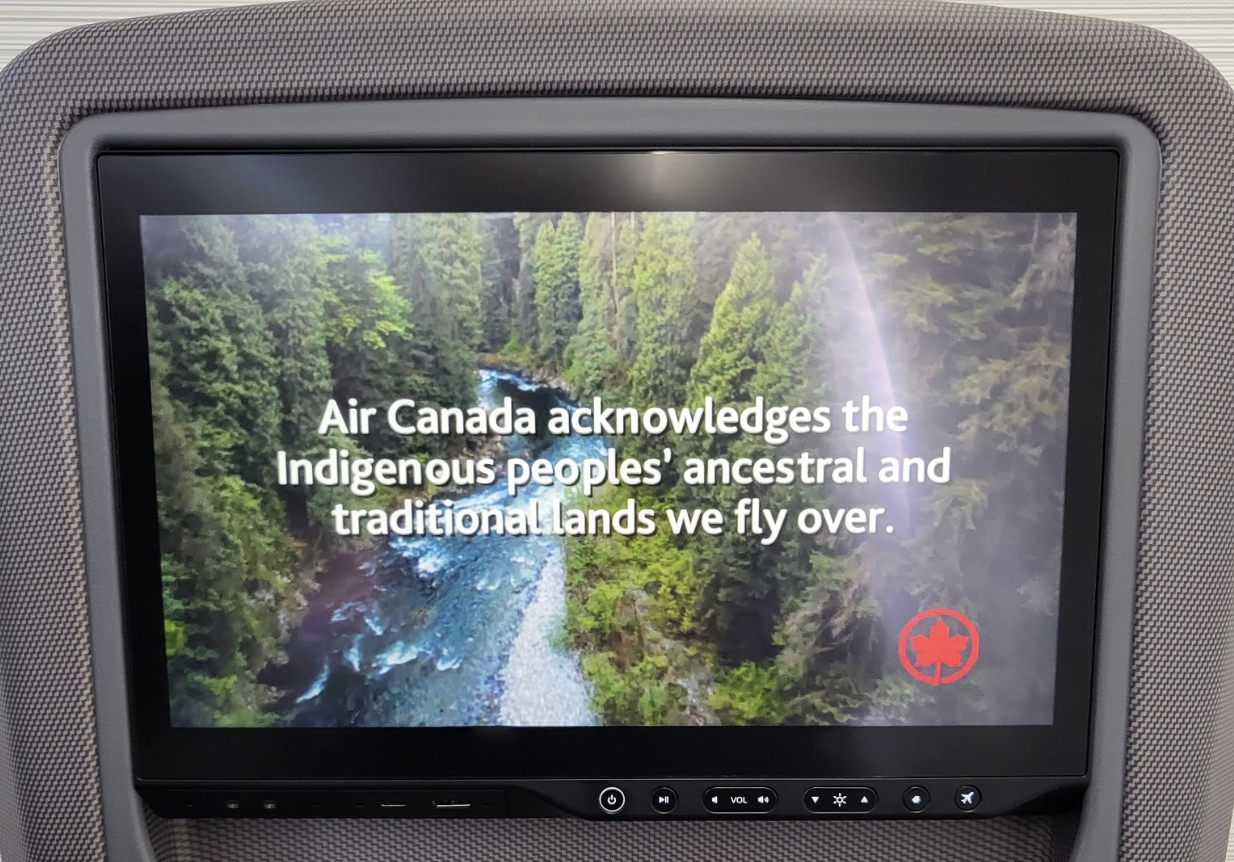
The rich range of pastel colors in these webmaps suggests the range of claims that we must, moving forward, be compelled to entertain and would do well to celebrate. Modern Canada constitutionally only explicitly recognizes three groups of aboriginal or indigenous–the Inuit, Métis, and generic “First Nations”–the multi-color blocks of native lands and historic “cessions” of tribal lands suggested a new understanding of how Canada had long celebrated its multiculturalism as a “mosaic” and not a “melting pot”–but showed the divisions of the land claims of a plurality of indigenous groups never recognized by Canadian law–and still quite problematically recognized in public acknowledgements of respect for land long inhabited by indigenous or “autchothones” proclaimed with piety by national airlines whose flight paths criss cross endangered boreal forests that tribes have long inhabited.
Air Canada went to pains the national company took at presenting a land acknowledgment in the form of a public announcement to all passengers, as if a remediation of the incursion of their airspace. But the video quickly turns to promote the airline as a platform for personal advancement that actual indigenous elders–if not leaders–embraced, affirming the cultural mosaic called into question if not challenged by the shard-like divisions staked on NativeLands, and its maps of historical land sessions. The flight over land seems to acknowledge indigenous claims to regions of pure waters and lands of a boreal forest, that maps an odd acknowledgement of indigenous presence from the air–paired with testimonials from Air Canada workers of native parentage attesting to longstanding fascination with the planes flying above over native lands and in airspace that was never properly defined–and the company’s commitment to secure these rights, as the major national company of state-run transportation.
–that suggest a respect traditions from the perspective of the modernity of air flight–as First Nations asserted data sovereignty over the lands they inhabit by a system of automated drones from 2016, to build a transportation infrastructure available to communities often isolated from infrastructure roads–and the notable fact that Canadian indigenous constitute the fastest-growing population in Canada, a notable fact of increased political significance, raising questions of the integration of their communities that could be reconciled with the historical transfer of land in the numbered treaties, 1871-1012, to transfer tracts of lands to the crown for promises that were rarely kept.
The odd status of indigenous lands in the nation puts the national airline of Canada at a unique relation to indigenous territories in recent years: while Canada’s divided system of federal sovereignty has begun to affirm aboriginal title in legal terms, and recognize autonomy of regions of indigenous settlement within Canadian sovereignty of the entire nation, the status of First Nation’s title are like islands of federal supervision in provinces, leaving national agencies like Air Canada, which reserves Parliament’s legislative jurisdiction over “Indians and lands reserved for Indians,” in an outdated legal formulation, a unique and privileged ties to lands of aboriginal title: the title of the nation is understood as parallel to and not in conflict with historical title of First Nations, which are incorporated into the nation as islands of federal sovereignty which still exists over the regions of the Numbered Treaties, which have never been legally dissolved.
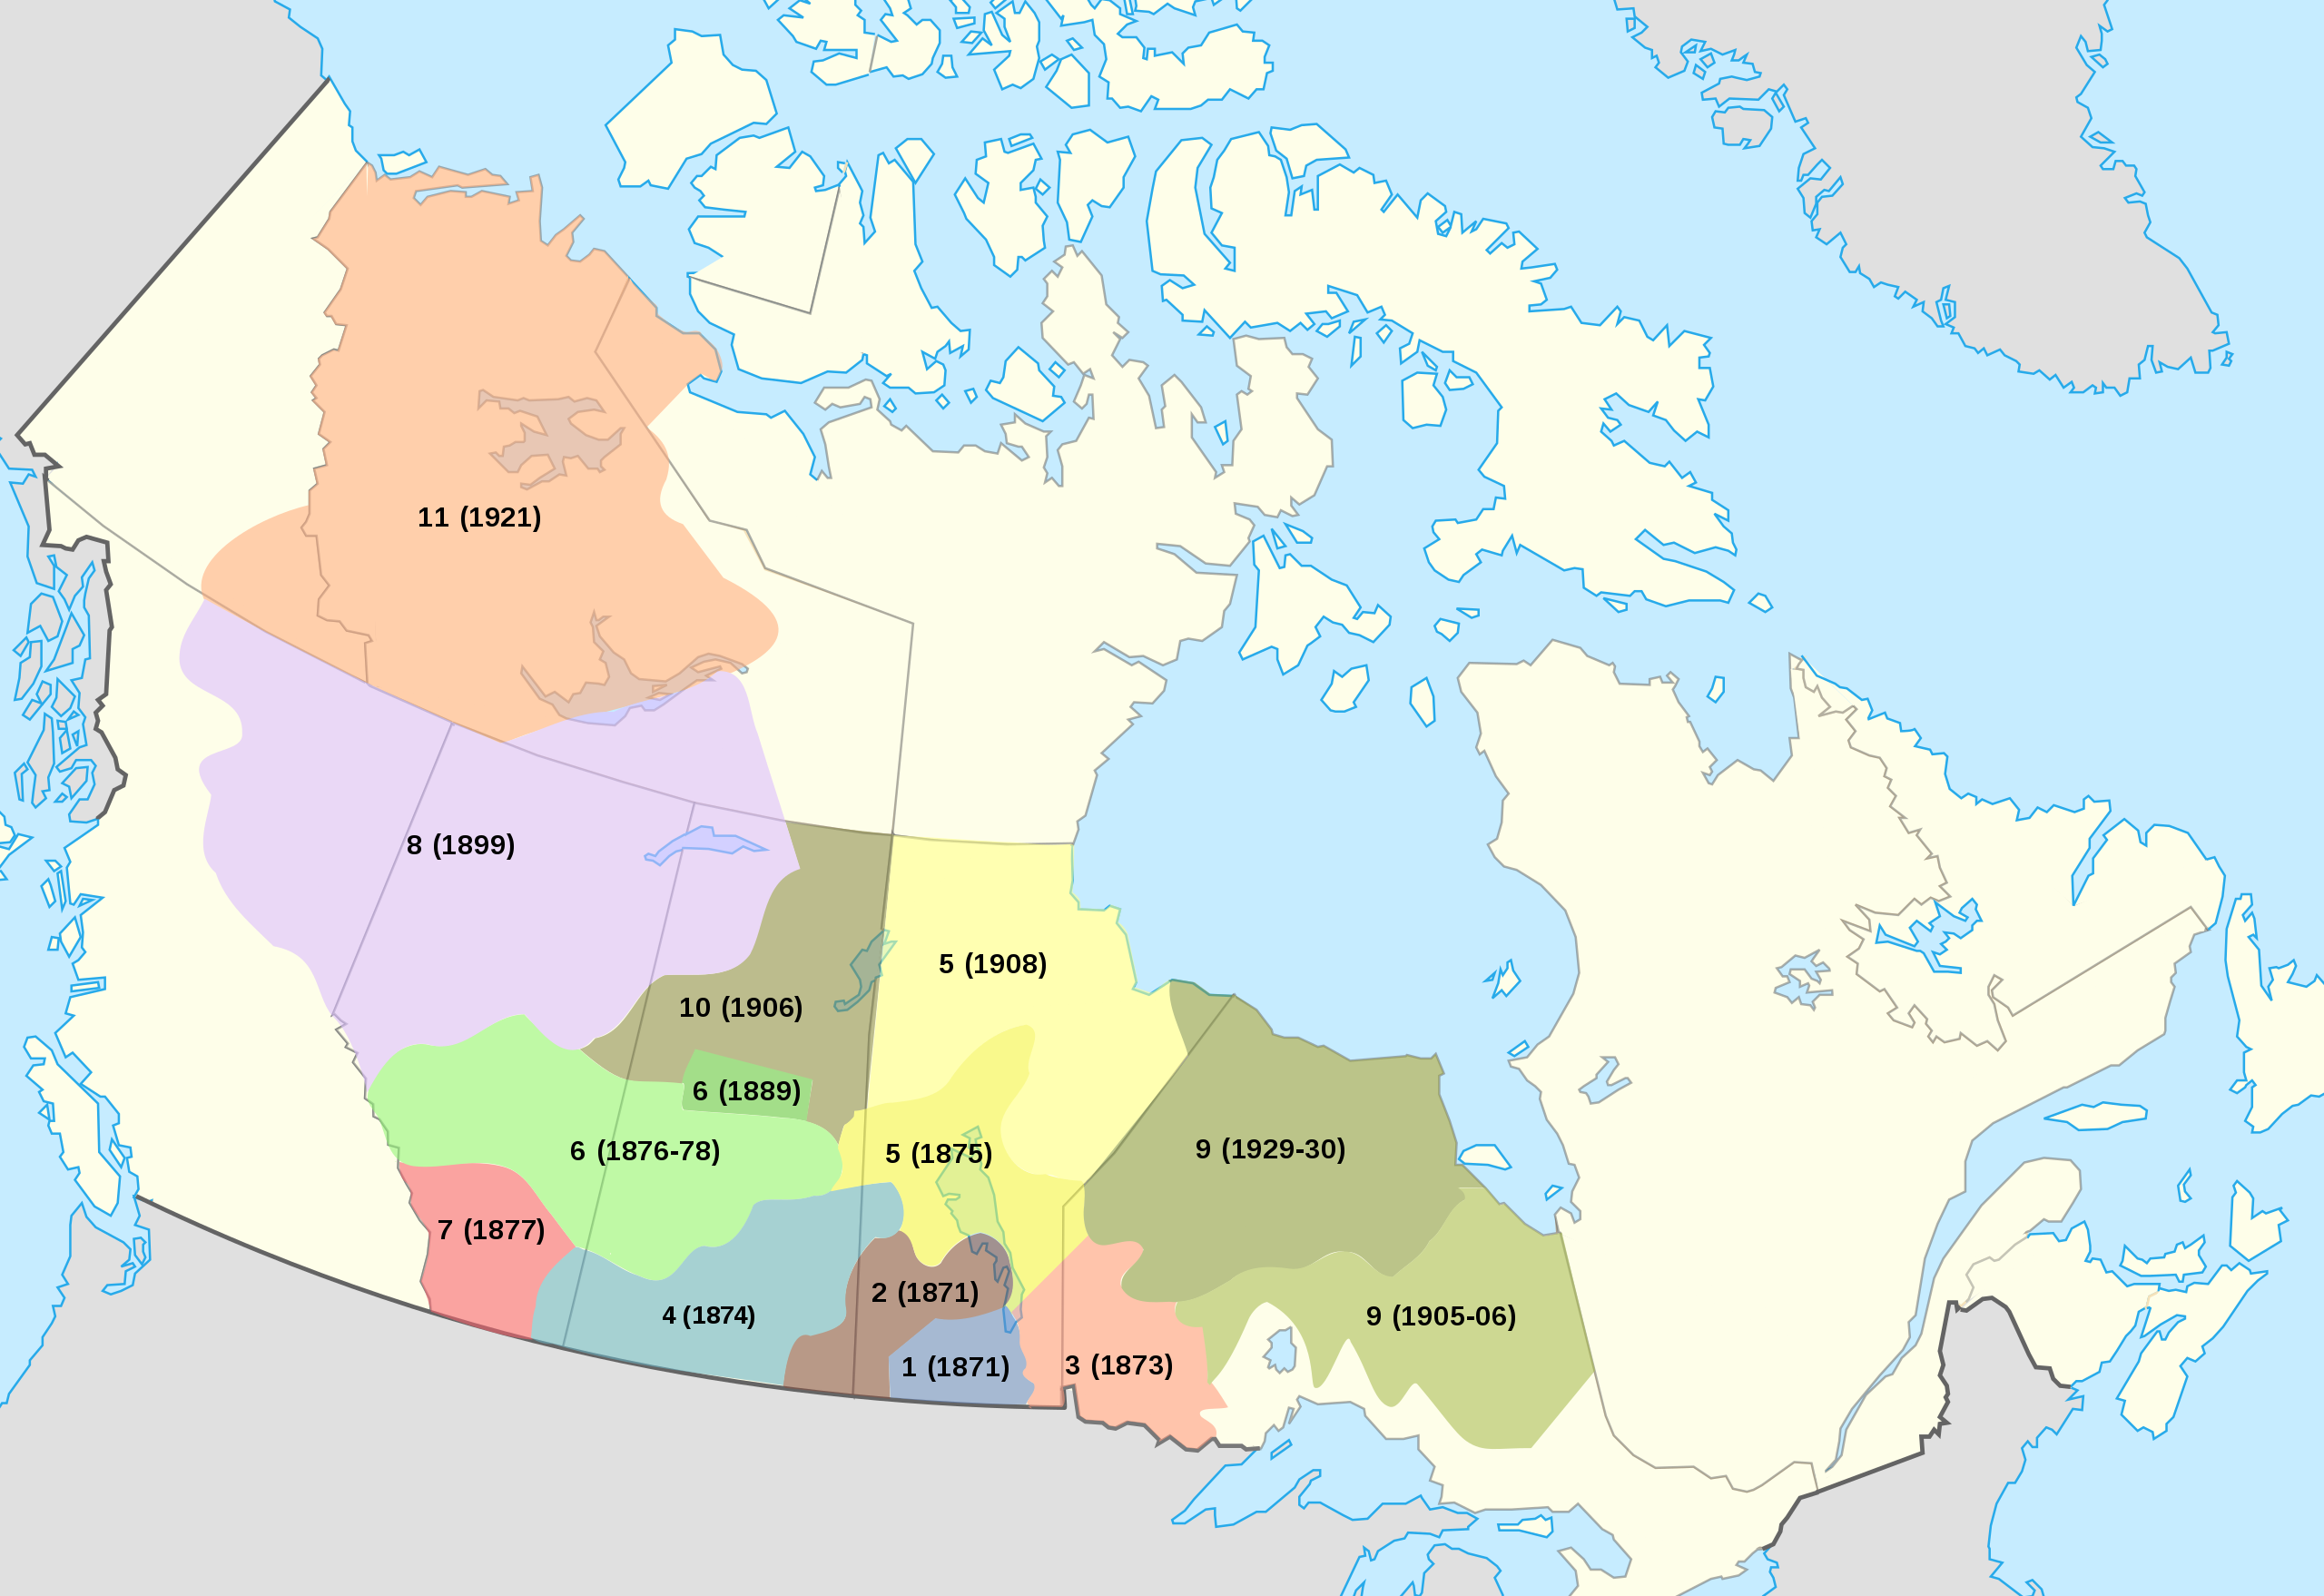
Numbered Treaties and Land Cessions with Indigenous First Peoples, 1871-1921
Is Air Canada, the national airline service, not acting as a proxy of the federal government in acknowledging the continued land claims of Native Peoples hold to old growth boreal forests below routes the airline often flies? The question of indigenous properties and indigenous autonomy is in a sense bracketed over areas Canada acquired from Great Britain in 1867 and purchased from the Hudson’s Bay Company three years later? The increasingly pressing question of how to acknowledge native sovereignty is hoped to be accommodated to the Canadian image of a “cultural mosaic” of sorts, and the NativeLands offers what might be best seen as a response to that mosaic–not an image of interlocking shining cultures of sparkling individuality, but the overlapping rights of possession not rooted in firm boundary lines, but in forests, rivers, and streams, not as a generic bucolic region out of cities or accessible infrastructure, but a new form of mapping, rooted in notions of neighboring places, and acting as a neighbor to places–and inhabiting spaces–that is distinct from an Anglo-American system of property rights.
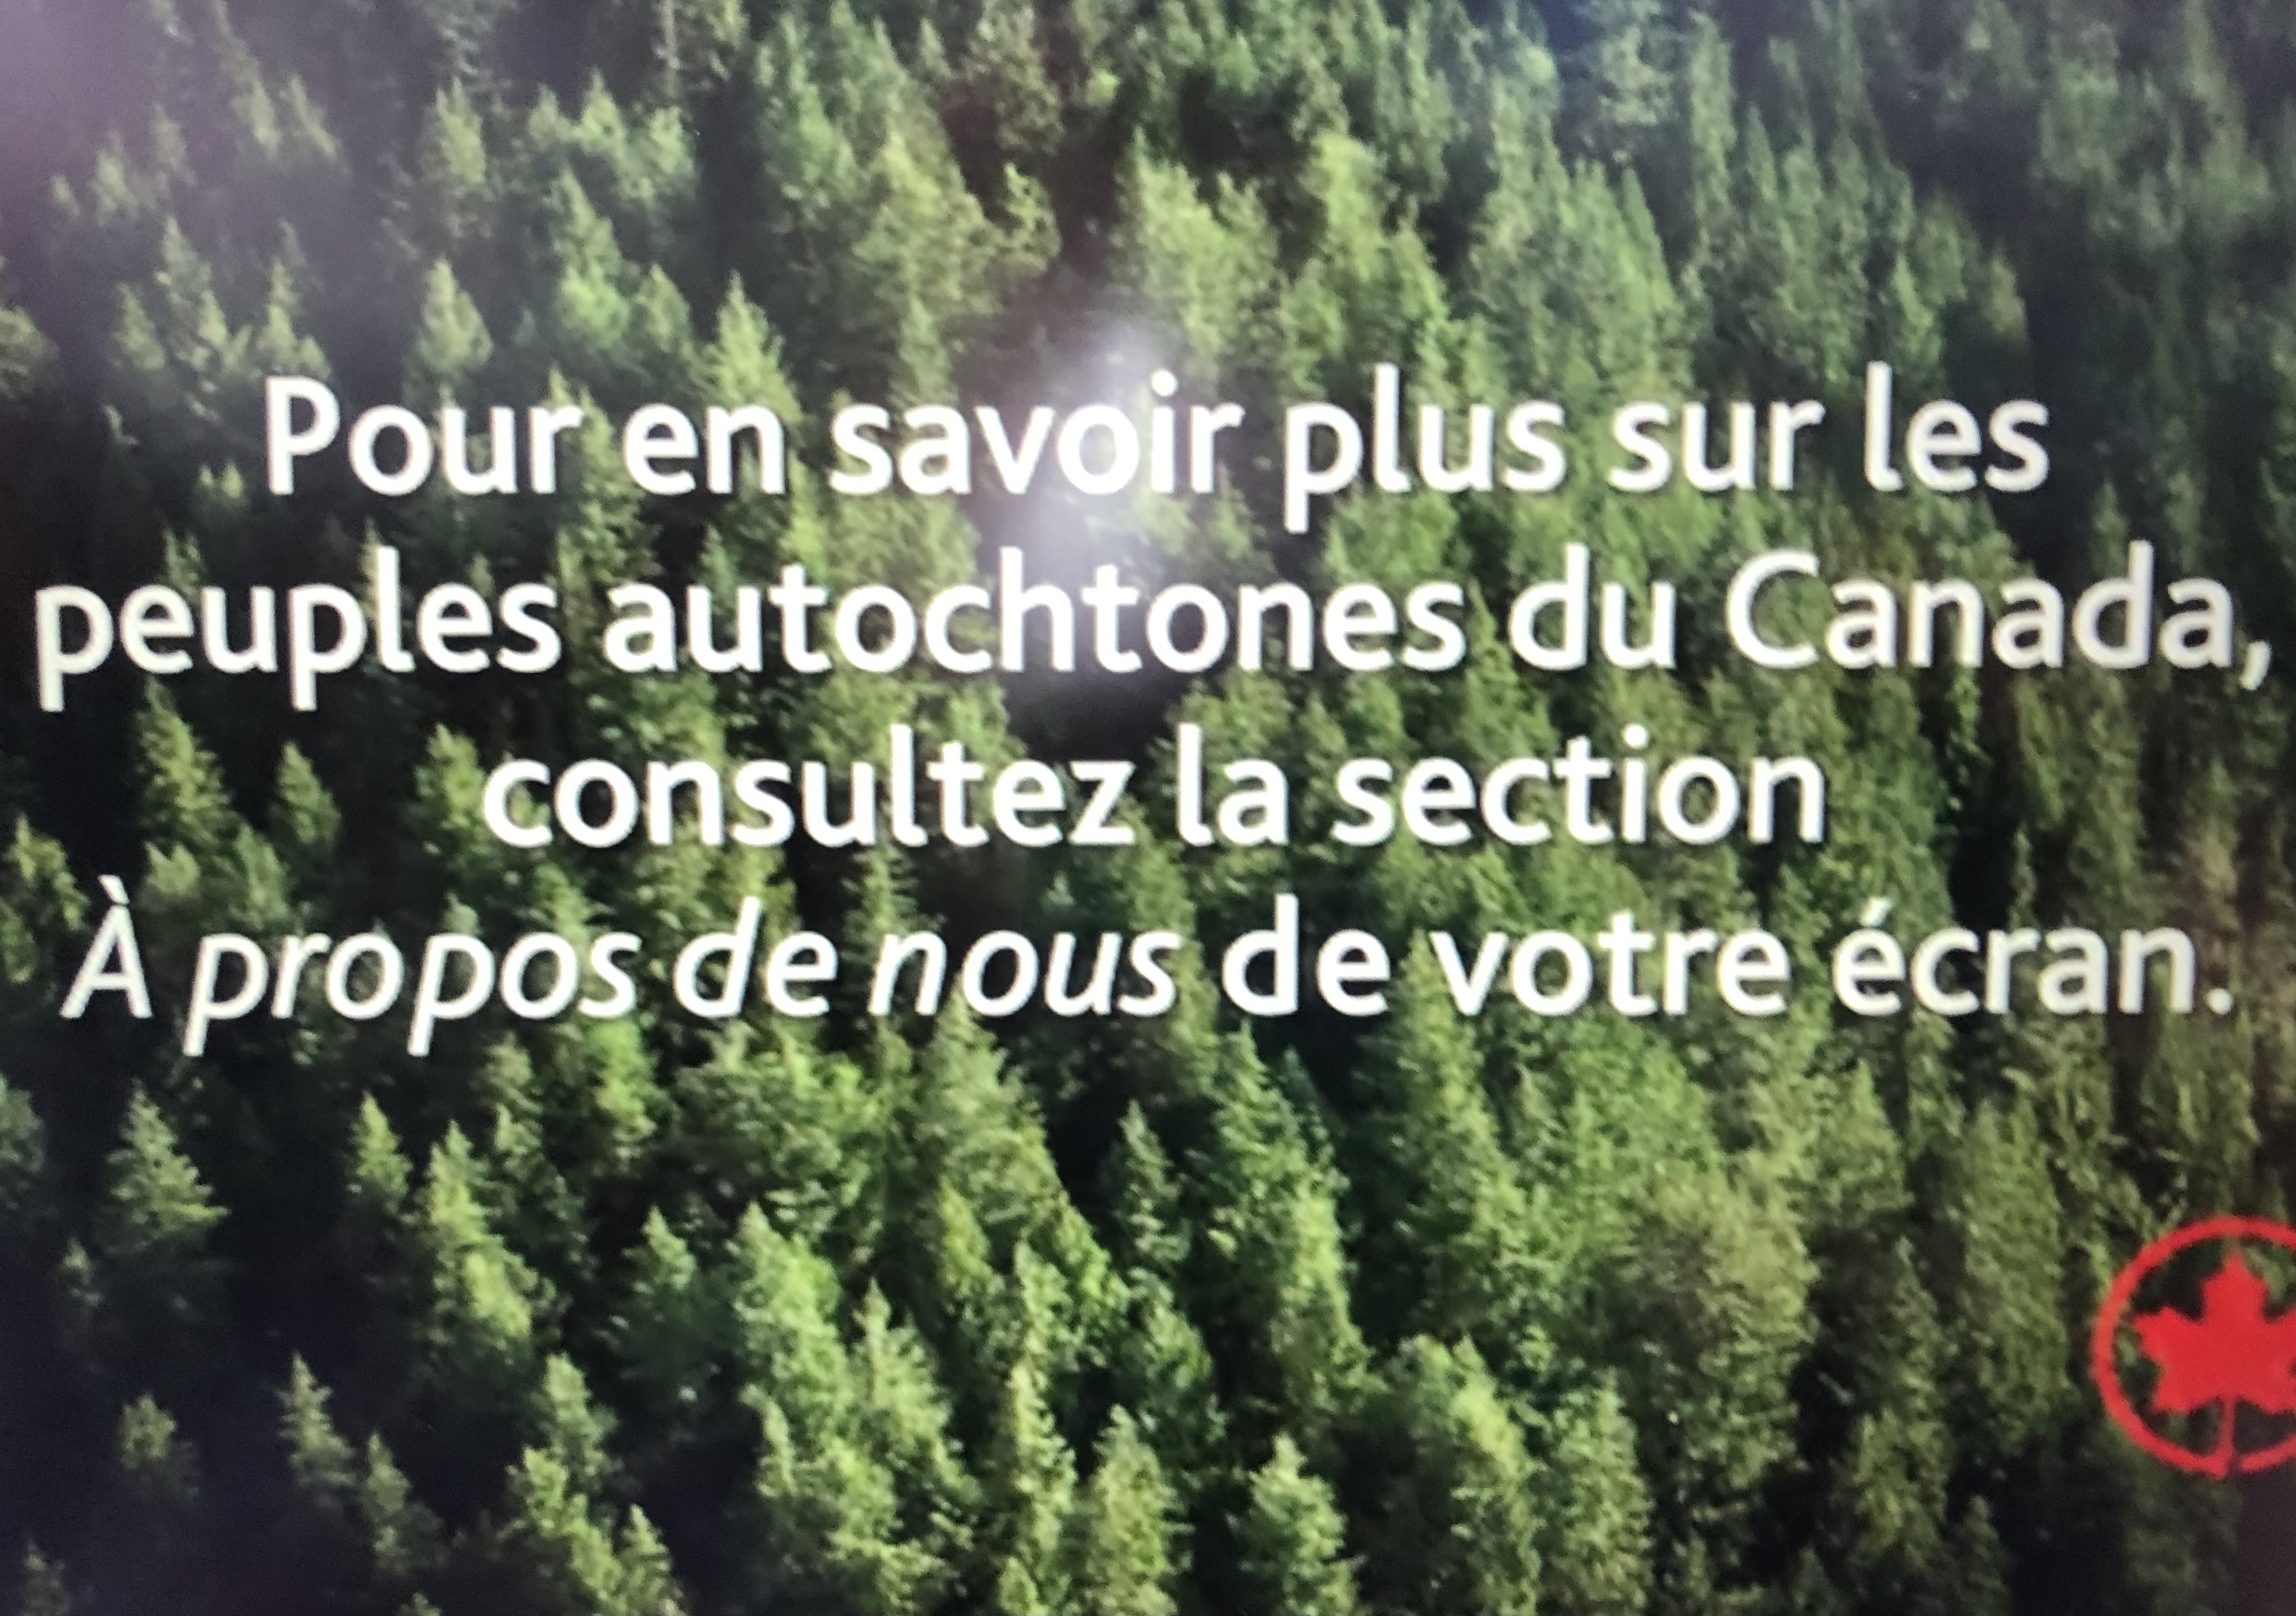
“To Learn More about the Indigenous Peoples of Canada, Click the ‘About Us’ Onscreen Tab”
For although the maps of Anglo settlers–attracted by the shifting global markets for goods, from cotton, to gold, to petroleum, all claimed without consent from their longtime inhabitants–erased or omitted local claims to land by those seen as nomadic, and of an earlier historical developmental stage, with a cutting logic of relegating their very presence to the past, the reframing of collective memories to inhabiting lands and regions offers a plastic and particularly valuable cartographic resource for remediating the future. The change parallels the first assertion of reversionary practices to land title, marked by. the Nisga’a Land Title act of 2000, which guaranteed title to lands outside of a historic chain of property deeds, allowing the determination of titles dependent on competing interests, by which the state can ensure ownership that incorporate traditional ways of recording property interests, outside of a property system of deeds: the new legal authority of the state may as well have inspired, this post suggests, a new form of mapping, in a webmap able to register mutually competing interests in compatible ways, rather than privileging historical titles of written form. In this sense, the growth of webmaps offer a new form of an open repository for competing claims, not linked to a legal system that has long favored colonial or settler claims.
The problem of a project of decolonization of course was greater than a map could achieve–but the relentless colonization of indigenous spaces and places needed a public document or touchstone to return. The presence of native tribes was never in question during the colonization of the continent–if one can only ponder the notion of the Library of Congress, Daniel Boorstin, who commemorated the approach of European and native cultures as so culturally fruitful for American culture, rather than one of loss. But how to take stock of the scale of loss? Northern California has been recently a site of active indigenous resistance to a legacy of colonization, the cartographic unearthing of land claims offers a new appreciation of increasing pluralistic possibilities of occupying the land.
Webmaps offer the possibility of stripping away existing boundaries, in cartographically creative ways, by interrogating the occupation of what was always indigenously occupied in new ways. Henry David Thoreau was plaintive as he voyaged down the Concord River, realizing how native lands had been not only usurped by the introduction of European grasses and trees, not only leading the apple tree to bloom beside the Juniper, but brought with them the bee that stung its original settlers; pushing downriver and “yearning toward all wilderness,” he asked readers, “Penacooks and Mowhawks! Ubique gentium sunt?” The signs of longstanding presence are not erased, but present on the map. And although lack of fixed boundaries on native lands have long provided an excuse to stake claims that exclude inhabitants who are seen as nomadic, or not settled in one place, and laying claim or title to it, and “without maps,” the blurred boundaries of NativeLands re-places longtime residents on the map, wrestling with the long-term absence of indigenous on the map.

It is, perhaps, not a surprise that the crowd-sourced interactive website Native Land Digital that was the brainchild of Victor Temprano, in the midst of the heady environment, CEO of Mapster who worked on a pipeline-related project, circa 2016. The sourcing of maps for indigenous land claims was pushed by his own anti-pipeline activity that involved remapping the place of planned lines of transport of crude oil from the boreal forest south to New Orleans on the KXL project and to Northwest ports Victoria threatened native lands and the ecological environments exposed to threats by drilling and clearcutting and risks of leaks. The current live charting at a live API offers total coverage of the globe, as may be increasingly important not only at a time of increasing unrestrained mineral extraction to produce energy but the retreat of ice in global melting that will alter animal migration routes, thawing permafrost, and sudden drainages of inland lakes that might call attention to new practices of land preservation.
The rich API provides a reorientation to the global map promising a powerful new form of orientation. Temprano, an agile mapmaker, political activist and marketer, framed the question of a more permanent digital repository of a global database of indigenous geography, that put the question of indigenous map front and center on the internet globally. The product, that led to an ambitious open source non-profit, sidestepped the different conceptions of space, time, and distance among indigenous communities, or the blurriness of fluid bounds, and opted the benefits outweighed the costs of an imagined the collection of maps of ancestral lands in term by the GIS tools of boundaries, layers, and vector files, as a rich counter-map to settler claims, able to collate lands, language and treaty boundaries on a global scale. The dynamically interactive open-source interactive project, known for its muted pastel colors, rather than the harsh five-color cartography that reify sovereign lines that posits divide as tacit primary categories of knowledge, is subtly compelling in its alternative non-linear format, that invests knowledge in sensitivity to the contributions of each of its viewers: dynamic, and administered by a non-profit with native voices on its board.
It is, inventively, able to maintain the dual display of a site where one could easily navigate between native and Canadian place-names and explore “indigenous territory,” as if it might be mapped by mapping space onto time in the broadly used cartographic conventions that have developed and flourished in online mapping ecosystems–and offered the benefit of creating layers able to be toggled among to layers of treaties by which land was legally ceded, overlapping language groups, and a decolonized space that was particularly sensitive in Canada, where the ability to engage outside colonial boundaries had been placed on the front burner by extractive industries. There is a sense, in the crowd-sourced optimism that recalls the early days of OpenStreetMap and HOT OSM, of the rewriting of maps and the opening of often erased land claims that crashed like so many ruins that accumulate like a catastrophe as wreckage that has piled at the feat of an Angel of History who is violently propelled by the winds to the future, so she is unable to ever make the multiple claims and counter-claims in the wreckage at her feet whole, and the pile of ruins constituted our sense of the progress of the present, even as it grows toward the sky. Was this a new take on the cultural mosaic of Canada, now revised as a problem of staking claims to the visions of property that the land cessions of the Native Treatise of Canada erased.
The website was the direct reaction to the active search for possibilities of extracting underground petrochemical reserves on indigenous lands in Canada. The growth of the website north of the border however has resonated globally, underscoring the deep cultural difficulties of recognizing title to lands that was long occupied by earlier settlers. If many of the claims to petroleum and mineral extraction in indigenous land is cast as economic–and for the greatest good–the petrochemical claims are rooted in an aggressive military invasion, and are remembered on NativeLands.Ca as the result of abrogated treaties and land cessions that must be acknowledged as outright theft.
The history of a legacy of removing land claims and seizing lands where Anglos found value has led many to realize the tortured legacy–and the unsteady grounds on which to stand to address the remapping of native lands. General Wesley Clark, Jr. acknowledged at Standing Rock, asking forgiveness in 2016, almost searching for words–“Many of us are from the units that have hurt you over the many years. We came. We fought you. We took your land. We signed treaties that we broke. We stole minerals from your sacred hills. We blasted the faces of our presidents onto your sacred mountain. . . . We didn’t respect you, we polluted your Earth, we’ve hurt you in so many ways, but we’ve come to say that we are sorry.” Crowd-sourced maps of claims on NativeLands offer an attempt at remediation, although a remediation that might echo, as Chief Leonard Crow Dog responded at Standing Rock, “we do not own the land–the land owns us.”
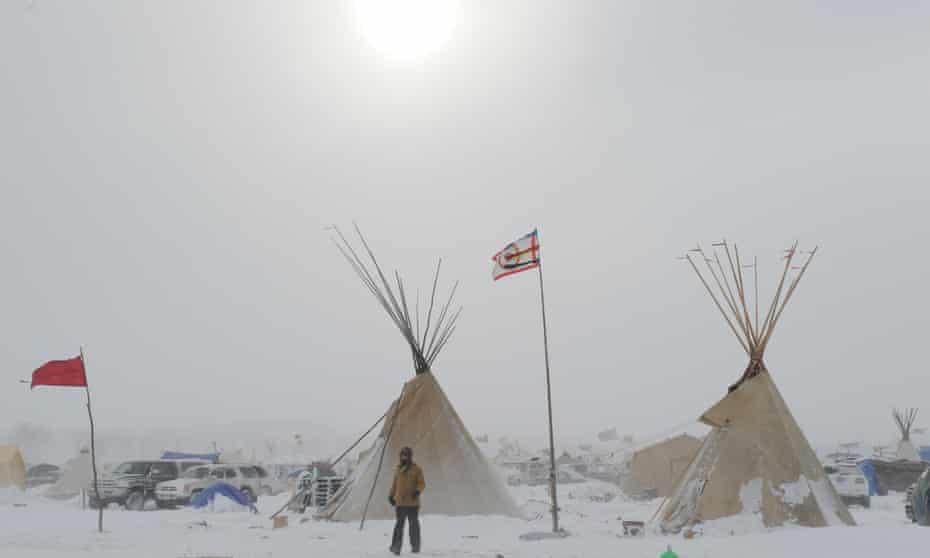
The sacred lands that had long reserved sacred lands in ancestral territory to indigenous tribes were indeed themselves contested at Standing Rock in 2015-6, when the 1868 Treaty of Ft. Laramie that assigned Sioux territory east of the Missouri River and including the water that runs through these ancestral lands as including the water, but the protection of these waters as within ancestral lands was not only challenged but denied by the proposed Dakota Access Pipeline, even if the water runs through Sioux territory, as it long had, leading the Sioux Nation to bring suit against the US Army Corps of Engineers for having planned the pipeline through their ancestral lands, and attracting support of military veterans who objected to the continued use of Army Engineers to route the pipeline through historical and cultural sites of the Upper Sioux that ran against the lands reserved fort he Sioux nation.

The challenge or undermining of ancestral claims to land by the DAPL offered a basis for accounting or tallying of the respect of previous treaties and land claims. In the rise of the webmaps Native Lands, a new and unexpected use was made of the very cartographic tools that facilitate international petrochemical corporations–and indeed military forces–to target lands valued for mineral production with unprecedented precision have helped to stake a claims for the land’s value that undercut local claims to sovereignty. The website offers a way to preserve claims that were never staked earlier so clearly, and to do so in dialogue with broken treaties as a counter-map taking stock of the extent of indigenous lands. It is as if, within the specters of extractive industries’ deep desire to possess the targeted energy reserves, and at the end of a history of dispossession and destruction, the indigenous that were systematically killed and removed from their lands over the nineteenth century, at whose close 90-99% were killed, in a massive and unprecedented theft of land, forcing them from migratory habits to receive religious instruction and live on bound lands to which they were confined. In Canada, where NativeLands grew, displacement of land rights began from clearing herds of bison herds from Prairies to begin construction of the Canadian Pacific Railway, the principle commercial artery to the West, that had by 1869 shifted indigenous resources to rations that rarely arrived, to be replaced by cattle on lands settled by European farmers and style of agriculture. The melancholy history Plenty Coups framed of the extinction of Crow sovereignty went beyond land rights: “when the buffalo went away the hearts of my people fell to the ground, and they could not lift hem up again: after this, nothing happened.”
Time stopped because the imposition of new modes of agrarian regime recast native lands as terra nullius to be settled by Anglo and European farmers, a surrender of land title from 1871-1921 that nullified local land claims. The cartographer and framer of the U.S. Census, newly appointed to what would be the Bureau of Indian Affairs, Francis Amasa Walker conducted the first review of 300,000 Native American in the United States of 1874, trying to sort out the theft of land over four hundred treaties. Walker’s agency was not clear, but if he bemoaned theft of ancestral lands fertile and rich with game, confined in land that could not support them and dependent on rations, there is some sort of redress in how the NativeLands maps invites us to retrace the sessions of lands that undermined these indigenous land claims, erasing the nations not deemed fit to have place or stake belonging in American made maps that Walker helped to codify, placing the loss of land that Plenty Coups did so much to try to protect and retain, against all odds, in making trips to Washington DC to allow Crow claims to survive in this new White Man’s world. Even if the claims that he preserved were less than they had been originally allotted–just 80%–he forestalled desires to claim land for gold prospecting and mineral extraction that are effectively on the cutting block once again today.
Continue reading


