Monthly Archives: March 2013

Mapping Radiation Levels: Toward a Vigilante Cartography or a Model of Data-Sharing?

Few maps rely entirely on self-reported measurements today:  the data-rich basis of maps make poor controls on data an early modern throwback.  But the ability to transmit datasets to the internet from local devices has changed all that.  The recent proliferation of radioactivity maps are based on the open sourcing of self-reported measurements to form a new picture, placing information taken with Geiger counters into a framework analogous to a template borrowed from Google Maps.  Although the only instrument to register radiation’s presence is a Geiger counter, and no standards have been developed for representing the rises in radiation counts in different regions–or indeed the limits of danger to personal health–the provision of such a map is crucial to disseminating any information about a potential future disaster.  While the three reactor that released radiation in the Fukushima meltdown created the largest release of radiation into the atmosphere, the mapping of this release of 300 tons of radioactive waste reported to be spewing from the reactors as they cooled into the Pacific Ocean may have slipped off the radar of daily news, but on the internet may have become the greatest environmental disaster we’ve encountered, increasing the demand and need to map it, and raising questions of its relation to the massive die-offs of Pacific starfish, herring,

By using the internet  to upload and broadcast shifting radiation levels, the flexibility of maps of radiation levels gain a new flexibility and readability through the platform of Google Maps can instantaneously register ambient radiation in air, earth, water, or rainfall, as well as the radioactivity of food, in striking visualizations of geographic space.  This came to a head in the maps that were made to respond to the threats of the Fukushima Daiichi nuclear disaster that occurred on March 2011, and the spread of radiation from the explosion across the Pacific that remind us of how wind and the medium of ocean waters distributed plumes of radioactive waste over time, as radioactive materials from the meltdown of three reactors were falsely imagined to have spread across most all of the Pacific rapidly–


image.png

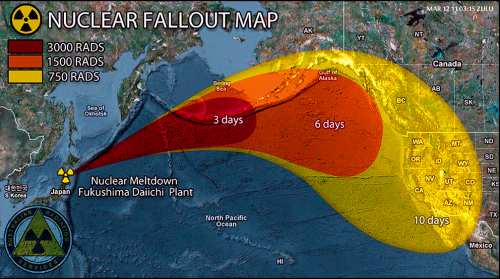
Hoax Projection of radioactive plume from Fusushima Daichi Plant


–and even extending into parts of the Atlantic ocean, in ways that generated considerable panic as a density of radioactive waste moved toward the bucolic seas of Hawai’i–as if to create a sense of the terror of the contamination of the natural setting by radioactive plumes.

There was a sense that the natural disaster could be recorded in real-time, reflecting the extent to which Google Maps had changed our expectations for the mappability of global phenomena, and the visibility of fears of global contamination that could be registered and recorded as a real-time apocalypse as everyone could be their own prophet of the end of times on the platform that it allowed.

image.png


image.pngEarth First! (March 2012)


The news ecology itself seem to have shifted, indeed, as what was undeniably an environmental disaster with potential  global import if not an event with potentially massive environmental consequences was played down in the mainstream media and by science reporting agencies, in ways that led alternative media to promulgate all the more alarmist narratives of radioactive fish off the United States, die-offs of seafood, and radiations on beaches in California and Oregon and the image that the pristine seawaters of Hawai’i had become a sort of epicenter where all radioactive waste had accumulated and come to rest, as if to confirm the extent of technological disaster.


Dispersion of Fukishima 2012


The maps suggested a sense of atmospheric proximity revealed in radioactive plumes, to be sure, that generated multiple fake maps, designed as forms of fear-mongering to accentuate the proximity of radiation in the environment, using an undated map with the NOAA seal to suggest the spread of something from Japan–and folks assumed it was radioactive, given the climate online–although it was in fact a map  measuring effects of a March 11 2011  tsunami, provoked by the Tohoku earthquake on wave height and he communication of wave-energy across the Pacific–perhaps more of interest to surfers than those fearing fallout.


image


For the explosion created huge challenges for mapping a sense of global radiological risk, far transcending any place or the site of its explosion:  the greatest levels of radiation were far removed from the site of the disaster, at the same time as the contamination on the ground, where radioactive deposits were far more intense in relation to geographical proximity.  Despite the far broader time-lapse required for the radioactive plume to travel by ocean currents across the Pacific–here shown after two and a half years–based on water samples taken in 2013, which, if far lower than limits in drinking water at 1 Becquerels/cubic meter, were projected to peak to 5 in 2015-16–far less than you might eat in a banana, or experience in a dental x-ray.


image

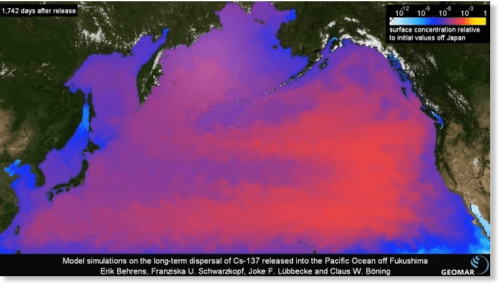
Discontinuities trumped continuities, however, in the levels of Cesium 134–the isotope that was the fingerprint of the Dai-ichi explosion–confirmed the extent of the diffusion of radioactive isotopes linked to the Fukushima reactor, by 2015, contaminated not only Canadian salmon, as tracked at the University of Victoria, but spread across much of the Pacific ocean, leaving an incredible intensity of the fingerprint isotope linked to Fukushima Dai-ichi–Cesium-134–in offshore waters, which perhaps recirculated in the Alaskan gyre, and the radioactive plume was projected to reach American shores some 1,742 days after it was released.


image.png


If still detectable in shellfish sampling as well as salmon, in 2015, the dispersion of radiation made a delayed landfall to the Pacific coast in late 2016, much as the arrival of isotopes across the Pacific was recorded–raising questions of the travel by water of Cesium across the Pacific.


image.png


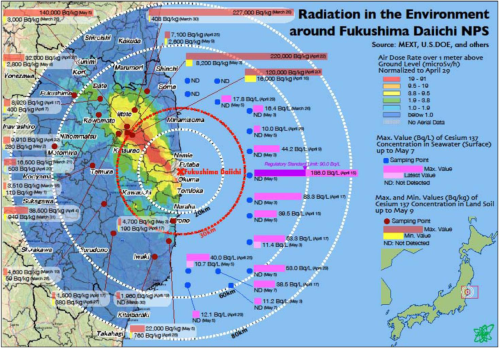
The air dosages of radiation immediately around Fukushima Daiichi suggest a dangerous level of radiation on the mainland, however, apparently confirmed in the growth of thyroid cancer, especially in children, birth defects, and the retention of Cesium 134 in power station workers who show an incidence of leukemia–


Air Dose rate Fukushima Daiichi.png

and a rise in thyroid cancer in California that follow no distinct geographical pattern–but may be due to pesticides, agricultural contamination, or other waste.

An assembly of multiple static and dynamic maps might assemble an otherwise ‘hidden map’ of local levels of radiation, however, and to reveal or expose otherwise hidden local dangers populations face from radiation leaks.  The notion of a shared database in cases of eventual emergency that can be regularly updated online suggested a way of monitoring and reacting to panic levels of the dispersion of radiation from the nuclear explosion, and indeed to measure the unclear relation between proximity to a blast and the intensity of remaining radiation and radioactive dangers.

Although the measurements of danger are debated by some, mapping radiation levels provides a crucial means to confront meltdowns, the breaching of chambers’ walls, or leaks, and to define limits of danger in different regions.   Interestingly, the map stands in inverse relation to the usual mapping of human inhabitation: rath er than map sites of habitation or note, it tracks or measures an invisible site of danger as it travels under varied environmental influences in ways hard to predict or track.  Although the notion of what such a disaster would be like to map has been hypothetical–and is, to an extent, in datasets like the National Radiation Map, which use the Google Earth platform or available GIS templates to diffuse information not easily accessible.  This is a huge improvement over the poor state of information at the time of the threatened rupture of the containment structure of the Three Mile Island in Harrisburg PA in 1978, when no sources had a clear of what radius to evacuate residents around the plant, or how to best serve health risks:  if a radius of 10 miles was chosen in 1978, the Chernobyl disaster required a radius of over the double.  The clean up of the plant went on from 1980 to 1993; within a 10 mile radius, high radiation levels continued in Harrisburg today.

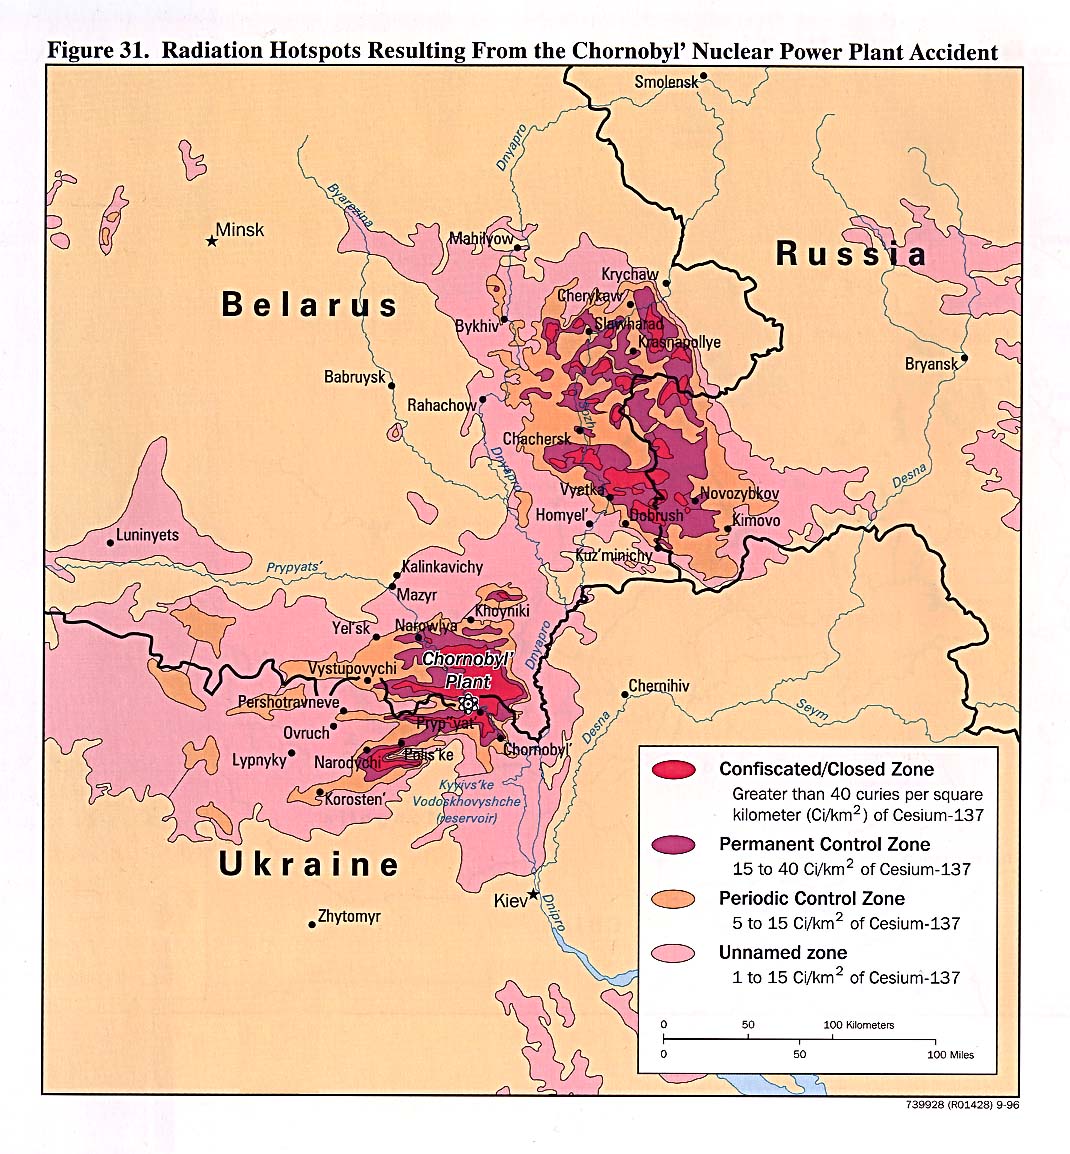
The larger zones that were closed around the more serious and tragic Chernobyl Nuclear Power Plant that in fact exploded in April 1986 led to a clear Zone of alienation that was evacuated three days after the explosion, and considerable fear of the diffusion of radioactive clouds born in the environment to Europe and North America.  The irregular boundary of immediate contamination, including pockets of radiation hotspots not only in Belarus, but in Russia and  the Ukraine suggest limited knowledge of the vectors of contamination, and imprecise measurements.

chornobyl_radiation96

This raised a pressing question:  how to render what resists registration or simple representation–and even consensus–on a map?  And is this in any way commensurate with the sorts of risks that maps might actually try to measure?

The tragic occurrence of the 2011 Fukushima meltdown raised similar questions, but converged with a new basis to define an internet-based map of the region.  If the incident provided a case-in-point instance of ready demand for maps, the availability of a large number of online access in the region led to a considerable improvisation with the value of a crowd-sourced map not defined the local government or nuclear authorities, but by the inhabitants of the region who demanded such a map.  The accident that resulted from the tsunami no doubt contributed to a resurgence and perfecting of the crowd-sourced map both in the United States and, in  a more flexible way, Japan, as websites try to refine the informative nature carried in radiation maps to create an informative response by open-access maps that can quickly register the consequences of nuclear disaster–or indeed detect such a leak or structural compromise–in the age of the internet, and offer a reassuring image (or a cautionary image) adequate to meet with the invisible and intangible diffusion of radiation in the local or regional environment.

Demand for such online databases reveal and feed upon deeper fears of an official failure to share such data.  Indeed, the drive to create a map of some authority has dramatically grown in the light of recent radiation disasters that have not been mapped earlier, in part because of liability issues and because of fears that government protection of the nuclear industry has compromised their own responsibility.  If the growth of online sites is a sensible and effective use of data-sourcing on an open platform created by internet providers, it is also one no doubt fed by a paranoid streak in the American character stoked most heavily these days by folks on the Right.  I’ve decided to look at two examples of these maps below, both to reflect on the nature of a crowd-sourced map and to suggest the plusses and minuses of their use of a GIS framework to visualize data.

The emphasis on the map as a shared database and resource to monitor and publicize the sensitive information about radiation levels has unsurprisingly increased by the recent threat of contaminated waters that breached the containing walls during the meltdown of the Daichi-Fukushima reactor in March 2011, and also of the difficulties that providing a reliable map of radiation creates:  although reactors are licensed by governments and monitored by government agencies, debates about the public dangers that reactors pose concern both the danger levels of radiation and the ability to collect exact data about their spatial distribution, and communication through waters, air, and other environmental vectors.  The ability to upload such measurements directly to data-sharing platforms provides a new access for the relatively low-cost creation of maps that can be shared online among a large group of people in regularly updated formats.  Given the low-cost of accumulating a large data-set, Safecast concentrated on devising a variety of models to visualize distributions along roads or by interpolating variations in existing maps.

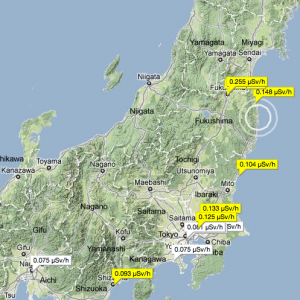
The group-sourced website showing regional and local fluctuations are not visually or cartographically inventive, but pose questions about using data feeds to reveal a hidden topography, as it were, of radiation across the country or landscape–as if to remedy the absence of an open-access trustworthy source of this information local governments would sponsor or collate.  Against a field that notes the sites of reactors by standard hazard-signs that designate active reactors, viewers can consult fluctuating readings in circled arabic numbers to compare the relative intensity measured at each reporting monitor station.  While rudimentary, and without adjustments or standardized measurements, this is an idea with legs:  the Safecast Project proposes to take mapping radiation in the environment along a crowd-sourced model–an example of either a pluralization of radical cartography or a radical cartography that has morphed into a crowd-sourced or “vigilante” form of mapping radiation levels.

Safecast wants to create a “global sensor network” with the end of “collecting and sharing radiation measurements to empower people with data about their environments.”  Its implicit if unspoken message of “Cartography to the People!”  echoes a strain in American skepticism, if not paranoia, about information access, and fear of potential radioactive leaks–in a counter-mapping of USGS topographic surveys, the movement to generate such composite maps on the internet is both an exciting dimension of crowd-sourced cartographical information, and a potentially destabilizing moment of the authority of the map, or a subversion of its authority as an image produced by a single state.

The interesting balance between authority and cartography is in a sense built into the crowd-sourced model that is implied the “global sensor network” that Safecast corporation wants to construct:  while not readily available in maps on access to government-sponsored sites, those interested in obtaining a cartographical record of daily shifting relative radioactive danger can take things into their own hands with a handy App.

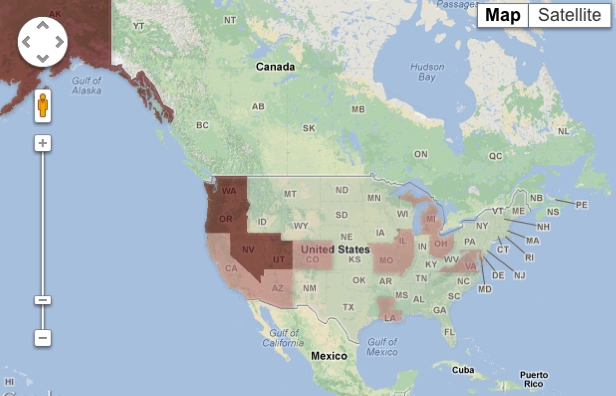
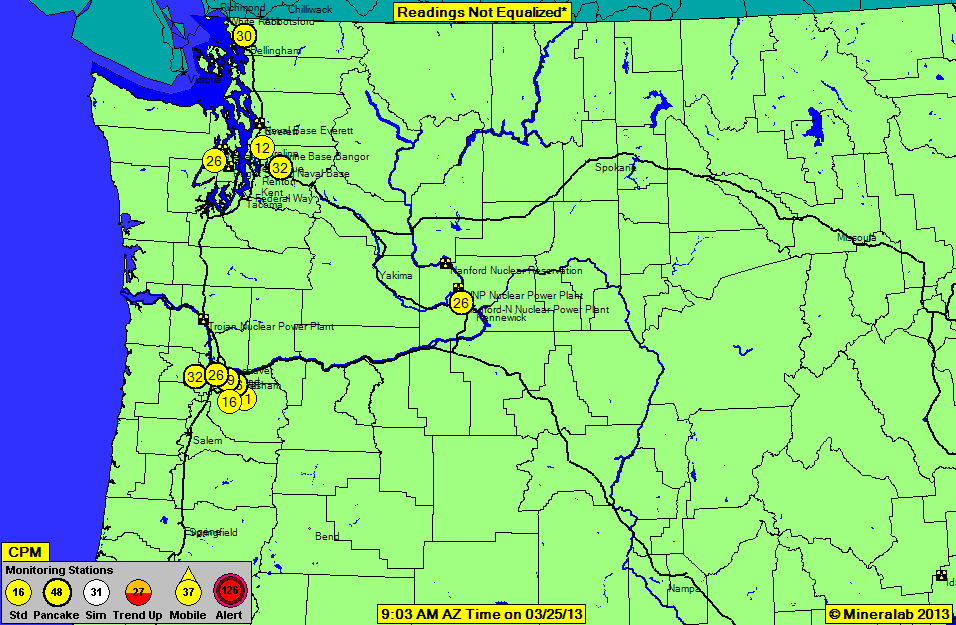
The specific “National Radiation Map” at RadiationNetwork.com aims at “depicting environmental radiation levels across the USA, updated in real-time every minute.”  They boast:  “This is the first web site where the average citizen (or anyone in the world) can see what radiation levels are anywhere in the USA at any time.”  As impressive are the numbers of reactors that dot the countryside, many concentrated on the US-Canadian border by the Great Lakes, as in Tennessee or by Lake Michigan.  Although a credible alert level is  100, it’s nice to think that each circle represents some guy with a Geiger counter, looking out for the greater good of his country.  The attraction of this DIY cartography of inserting measurements that are absent from your everyday Google Map or from the Weather Channel is clear:  self-reporting gives a picture of the true lay of the radioactive land, one could say.  This is a Jeffersonian individual responsibility of the citizen in the age of uploading one’s own GPS-determined measurements; rather than depending on surveying instruments, however, readings from one’s own counters are uploaded to the ether from coordinates that are geotagged for public consumption.

Of course, there’s little level of standard measurements here, as these are all self-reported based on different models and designs–they list the fifteen acceptable models on the site–in order to broadcast their own data-measurements or “raw radiation counts,” which makes the map of limited scientific reliability and few controls.  So while the literally home-made nature of the map has elements of a paranoid conspiracy–as most any map of nuclear reactors across the country would seem to–the juxtaposition of trefoil radiation hazard signs against the bucolic green backdrop oddly renders it charmingly neutral at the same time:  the reactors are less the point of the map than the radiations levels around them.


USA map radioactivity


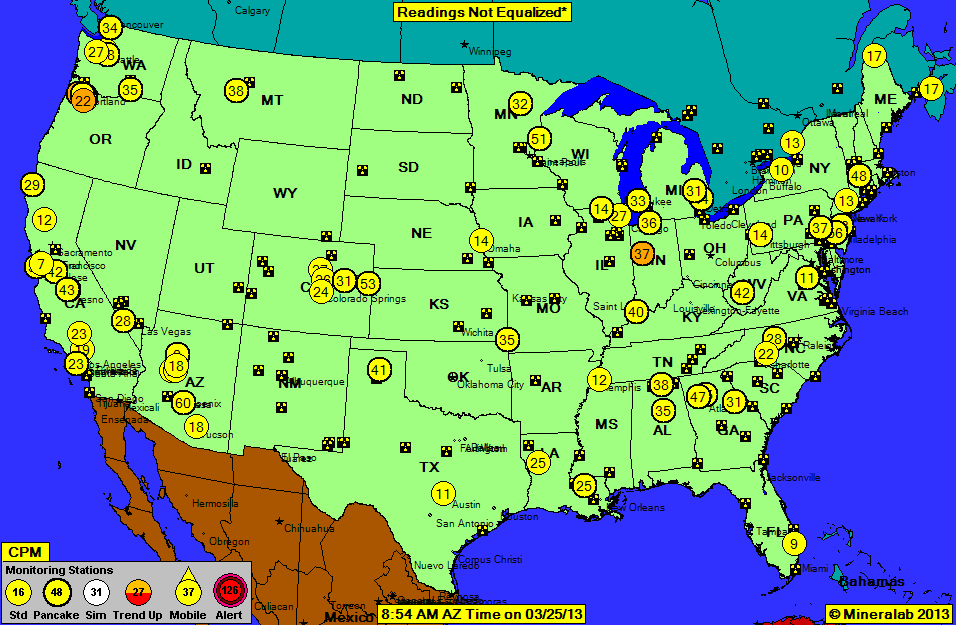
But the subject that is mapped is anything but reassuring.  When we focus on one region, the density of self-reported sites gains a finer grain in the Northeast, we can see the concentration of hazard signs noting reactors clustering around larger inhabited areas, oddly, like the ring around New Jersey, just removed from New York, the nuclear reactors in the triangle of Tennessee and Virginia, or those outside of Chicago and in Iowa, and one sees a somewhat high reading near Harrisburg PA.  But it’s reassuring that a substantial number of folks were using their Geiger counters at that moment, and inputting data into this potentially useful but probably also potentially paranoid site.  I hope they do interview them beforehand, given the very divergent readings at some awfully proximate sites.


NortheastUS


If we go to a similarly dense network on the West Coast, the folks at Mineralab offer a similar broad spread among those informants, and the odd location of so many reactors alongside rivers–no doubt using their waters for cooling, but posing potential risks of downriver contamination at the same time.

PacificNW


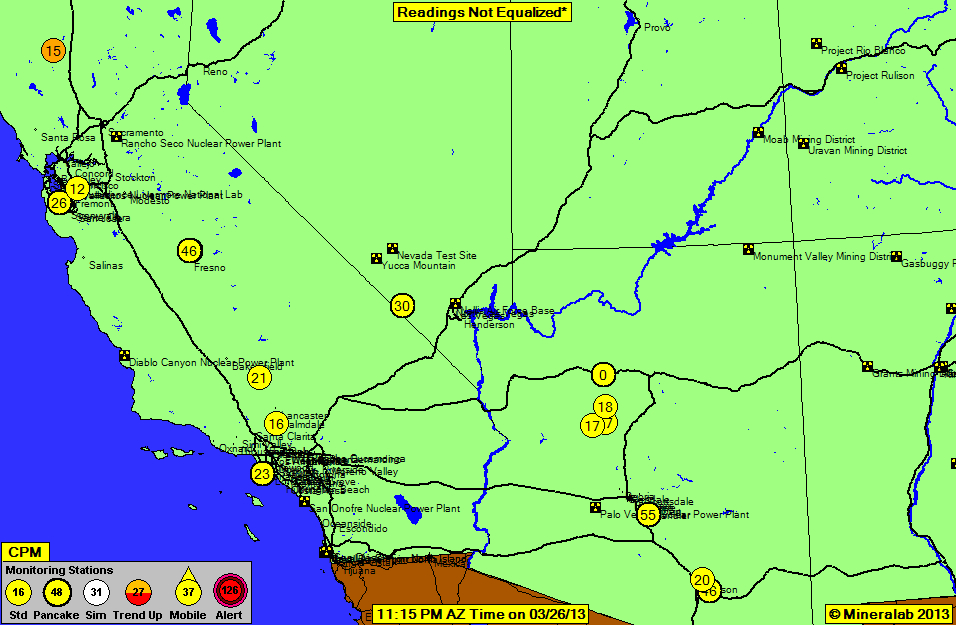
Although the view of Southern California is perhaps still more scary, and reminds us that the maps have not taken time to denote centers of population:


AmericanSW


And there’s a charming globalism to this project. Things aren’t particularly worse off in the USA in terms of the reliance on reactors, if we go to Europe, where reporters are similarly standing vigilant with Geiger counters at the ready given the density of those familiar trefoil hazard signs in the local landscape:


Europe.jpg


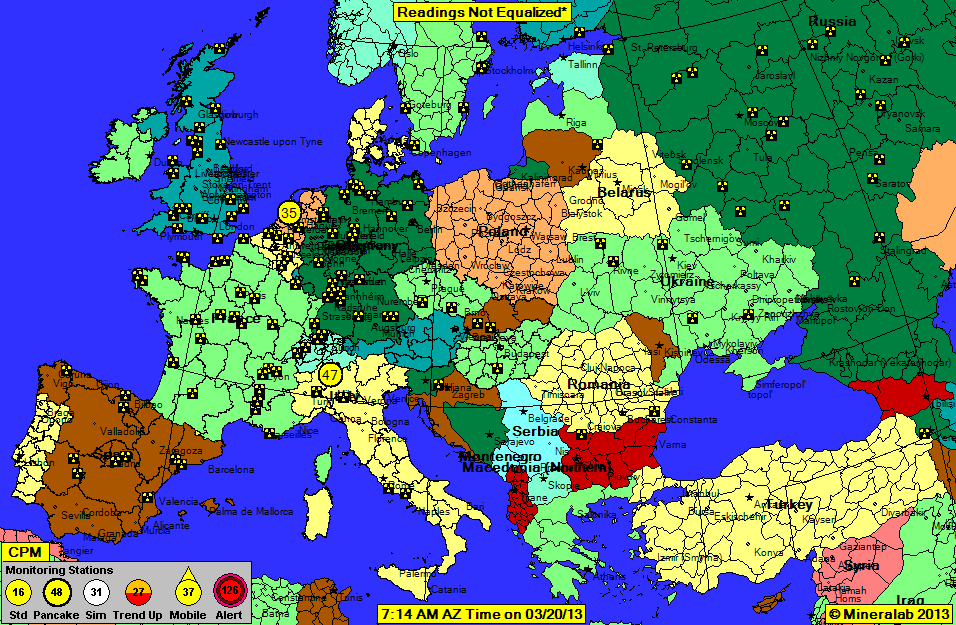
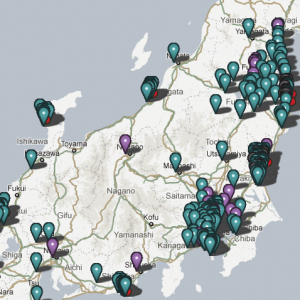
The truly scary aspect of that map is the sheer distribution of reactors, no doubt, whose hazard signs that dot the countryside like scary windmills or danger signs.  And, just to put in perspective the recent tsunami that leaked radioactive waste and waters from the Fukushima reactor whose walls it breached, sending material waste and leaching radioactive waters to California’s shores, consider Japan.  An impressive range of reactors dot the countryside, and but one vigilant reporter in Sapporo notes the very low levels of radiation that reach his counter:


Japan.jpg


Withe a week after the March 11, 2011 earthquake hit Japan, the greatest to ever hit Japan, Safecast was born as a volunteer group dedicated to open-platform radiation monitoring in the country and worldwide; in addition to over 15880 dead in the Tsunami and quake, the tsunami caused level 7 meltdowns at three reactors in the Fukushima Daiichi Nuclear Power Plant complex, necessitating evacuating hundreds of thousands of residents, as at least three nuclear reactors exploded due to hydrogen gas that breached outer containment buildings after cooling system failure.   When residents were asked to evacuate who dwelled within a 20 km radius of the Fukushima Daiichi Nuclear Power Plant, the United States government urged American citizens evacuate who lived within a radius up to 80 km (50 mi) of the plant to evacuate.  This rose questions about the dispersal of radiation from the plant, and deeper questions arose about the safety of returning within a set zone, or the need to demarcate an no-entry zone around the closed plant.

The rapid measurement of radiation distributions not only gained wide demand but provided as of July 2012, Safecast includes some 3,500,000 data points that collect radiation levels, and provided a new mode of sharing information about dangerous levels of radiation.  In ways that capitalize on how the internet allows a massive amount of data to be uploaded from numerous points around the world, Safecast exploits a model of data-sharing on its open platform, offering different models to visualize their relation to each other:  Safecast allows the possibility to visualize the maps against a road-map, topographic map, and map of local population distributions, so that they can better understand their relation to the readings that they’ve collated on line.

The process of massing data is what makes Safecast such a pioneer in creating a large range of readings that can promise a more comprehensive picture of radiation distribution than the uneven distributions that isolated readers might allow.  The Safecast team hopes and promises to improve upon their readings by designing and promoting a new Geiger counter, and has made available the handy workhorse bGeigie, although the cost of $1000/apiece and the time-consuming nature of their assembly is a major obstacle they’re trying to confront. The smaller and handier Geigier Nano Kit creates a dandy device you can easily carry, affix to your car, and whose measurements are easily uploaded to the Safecast website:


IMG_7008


The DIY glee of presenting the tool to measure radiation levels with one’s own mini-Geiger is part of the excitement with which Safecast promises to provide a new map of Japan’s safely habitable land.  The excitement also derives from a belief in the possibility of “empowering” people to measure and compile data about their environments, rather than trust a map that is assembled by “experts” or official sources who have not been that forthcoming with data-measurements by themselves.  The above smile also reflects the vertiginous success of Safecast in distributing its bGeigei, and the boast to have amassed an open-sourced database for open access.

This seems the new key to revealing knowledge in the multiple visualizations that Safecast offers for viewers:  with the enthusiasm of great marketing, their website announces with some satisfaction: “attach it to your car and drive around collecting geo-tagged radiation data easily uploaded to Safecast via our API upload page.” This suggest a whole other idea of a road trip, or even of a vacation, in the multiple ‘road-maps’ that volunteers have uploaded for approval on the Safecast site, with over 10,000 data points deriving from bGeigei imports, that Safecast can readily convert to a map:

Tokyo traffic Safequest


This is also quite serious stuff, taking crowd-sourced cartography to a new degree:  with some 4,000,000 radiation points detected by the Safecast team, the website is able to assemble a comprehensive map of relatively uniform readings, complimenting the sites of radioactivity assembled and culled by the Japanese government with their own independent data from an impressive range of aggregate feeds of environmental data from several NGOs and individual observers across Japan’s coast:


agg-300x300

The image of such aggregate data feeds allowed Yahoo! Japan to build their own map displaying the static sensor data of Safecast:

Yahoo Japan feeds

Kailin Kozhuharov has created a detailed map to visualize the distribution of radiation levels in the island through the Safecast database:

 Kozhuharov Visualization of Radiation Levels


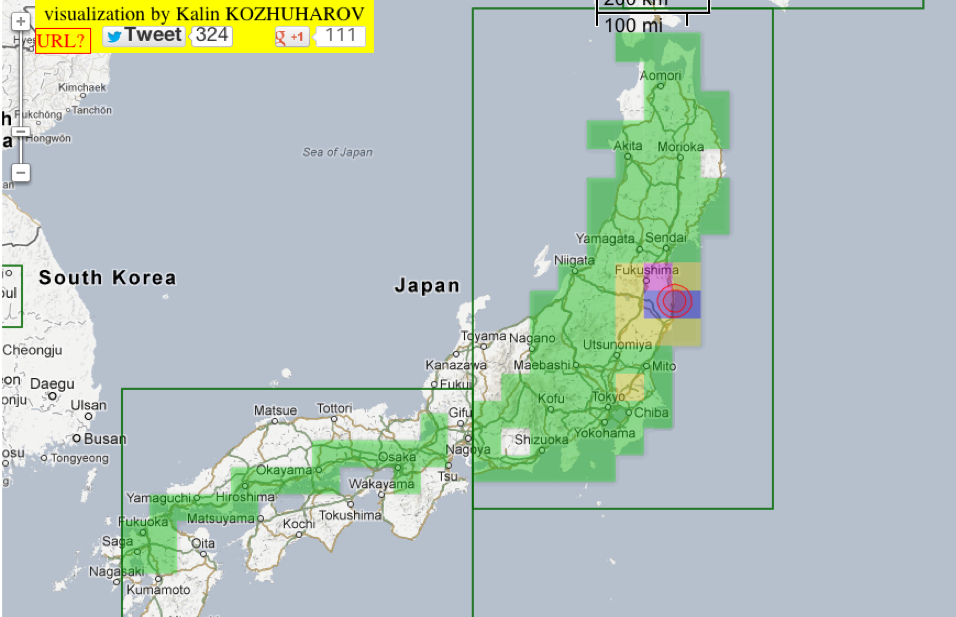
The coverage is truly impressive, and multiplication of data points technically unlimited and potentially comprehensive. While divergent readings may be entered every so often as a Geiger counter wears down or malfunctions, controls are built into the system. An example of the coverage in Japan, again the focus of mapping radioactivity in the wake of the recent Fukushima disaster, where Safecast is based, using locally obtained data once again:


Safecast Japan


The widespread appeal of this device, even more than the Radiation Network, reveals the widespread nature of a belief or suspicion–no doubt with some grounds or justification–that a true map of the dangers or levels of radiation is in fact never already provided or available to citizens, and that the failure of governments of communicating an accurate mapping of radiation demands a privatized response.  And with its partnership with Keio University, developed after Fukushima, Safeguard has developed the “Scanning the Earth” (STE) project that maps the historical data of radiation readings across the globe.  With the Fukushima prefecture, Safecast has also issued a comprehensive global mapping of the dispersal of high levels of radioaction from Fukushima from its own massive database to chart the impact of the environmental disaster over time:


Fukushima Prefecture World Map

Although this map reflect the ties to the MIT Media Lab, it is informed by a dramatically new local awareness of the importance to create a map flexible enough to incorporated locally uploaded data measurements for open access.  It is also a great example of how an event can create, provoke, or help to generate a new sense of how maps can process the relation of local phenomenon to the global in a variety of readily viewable formats.  The demand for creating this world map clearly proceeded from the local event of the 2011 Tsunami, Safecast was at a position to observe the importance of maintaining an open-sourced database (now including some 2,500,000 readings) that offer an unprecedented basis for developing a platform of data-sharing that is readily available online.  In working with the same databases, they also offer some cool visualizations of the data that they collect to illustrate differentials radiation levels in readable ways linked to potential dangers to individual health:

Fukushima?  Safecast

The new facility that the internet has created in the ability to upload, share, and compile information from diverse and multiple sites without considerable costs has meant so lowered the cost of collaboration that it can occur without any reference or dependence on a central governmental authority. This has allowed the compilation of an immense amount of simultaneous data to be regularly uploaded and stored with almost no extra cost from a group of volunteers and to be available in transparent ways on an open-access platform.  (Late in updating this post, I came across an earlier PBS NewsHour episode on Safecast’s interest in data-collection in the wake of the disaster, and the demand of local residents in Japan for further data, given the silence of official government sources on the disaster and its dangers:

(The episode offers great data on using Geiger counters to detect radiation levels at multiple sites near the exclusion zone that rings the reactor, including a restaurant parking lot.)

The means for offering locally contributions to a world map of radiation level distributions reveal an expanded ability to share information in a map the relation of place to environmental disasters.  Indeed, the map itself foregrounds new graphical forms of information-sharing.  There are clear problems with the Safecast model that Japan, in fact, is likely to be an exception to:  Japan was a place providing access to large numbers of its population already in 2003, offering free wi-fi in trains, airports, and cafés or tea houses.  In comparison, the far more limited numbers of the population have access to wi-fi or online resources in rural American towns, or even in urban areas, would make access questions less possible in the United States, where a similar movement has failed to expand not only because of the lack of a disaster of similar proportions.  There is the danger that the “freedom of information” they champion is in the end not as openly accessible as one would wish:  if roughly one quarter of hotspots worldwide are in the United States, it shared with China and Italy the lowest number of hotspots per person, at lower than 3 per person as of 2007, while Japan had nearly 30 million 3G connections.  This creates a significant obstacle to the expansion of the internet as a universal access service outside urban areas with municipal wireless networks, despite the significant plans to expand internet access on interstates.  Despite plans to expand free service zones in Asia, Canada, and parts of the Americas, the broadcasting of regional variations in a natural disaster would be limited.

There may be something oddly scary that Safecast has had its own corporate profile and successful Kickstarter campaign, marking the privatization of the sort of public traditions of cartography formerly undertaken by states for their own populations to devolve to the private sphere.  For whereas we have in the past treated cartographical records as an accepted public good, there is limited acceptance of accessible data collection and synthesis.  As a result, one seems more dependent on the active participation in one’s construction of a more accurate of radiation levels, or upon a network of vigilant vigilante cartographers who can upload data from wi-fi zones.  Is there the risk of a disenfranchisement of a larger population, or is data-sharing the best available option?

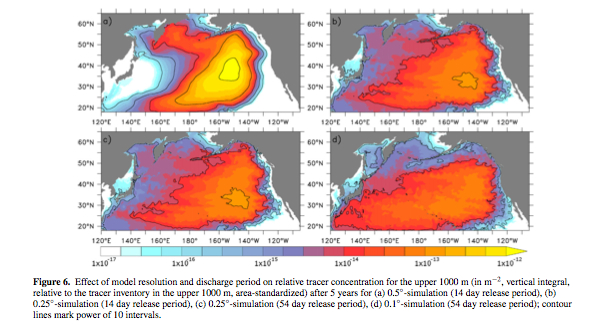
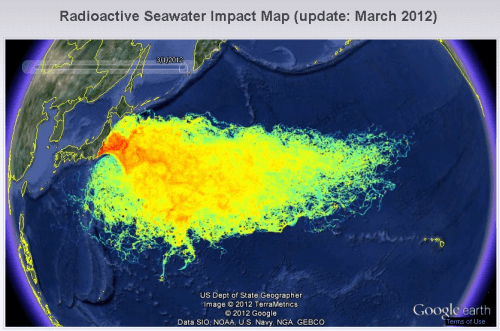
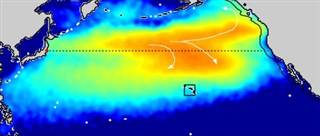
An alternative model for mapping radiation might be proposed in the compelling map of the oceanic travel of radiation (probably in contaminated waters, but also in physical debris) that has been suggested by vividly compelling cartographical simulations of the dispersal of the long-term dispersal of Cesium 137 (137CS) from waters surrounding the Fukushima reactor.  Although the map is indeed terrifyingly compelling, in relying only on oceanic currents to trace the slow-decaying tracer across the Pacific, the video map seems to arrogate capacities of measuring the dispersal over the next ten years of radioactive material in ocean waters with a degree of empiricism that it does not in fact have.  How ethical is that?

http://bcove.me/cp9fol2w

For all the beauty of the color-spectrum map of a plume of radiation expanding across ocean waters–and the value of its rhetorical impact of strikingly linking us directly to the reactor’s meltdown–its projected charting of the plume of contaminated waters due to reach the waters of the United States during 2014, if normal currents continue, is far less accurate or communicative than it would seem.  To be sure, as the Principal Investigator and oceanographer Vincent Rossi, a post-doctoral researcher at the Institute for Cross-Disciplinary Physics and Complex Systems in Spain, “In 20 years’ time, we could go out, grab measurements everywhere in the Pacific and compare them to our model.”  But for now, this expanding miasma offers an eery reminder of the threat of widespread circulation of radioactive materials worldwide.

8C8811758-130831-science-fuku-1025a.blocks_desktop_small


Indeed, the charts that project the spread of radiation over a period of five years, benefitting from the power of computer simulations to map by tracer images the diffusion of radioactive discharge along clear contour lines in the Atlantic, provide a compelling chart of how we might want to look and measure the levels of radioactivity in our national waters.


tracer image of radiation from Fukushima

2 Comments

Filed under Chernobyl, disaster maps, Fukushima, radiation maps, Vigilante Cartography

Desertification

In late January, my daughter Clara wrote with conviction that “Great adventures in eating must include the all-important meal known as the dessert,” and confessed “I could not live with out dessert.”  We could all live without desertification, or the expanse of areas of the world on the that threaten to become enlargements of existing uncultivable land, which the United Nations in 2007 declared “the greatest environmental challenge” and a particular emergency in sub-Saharan Africa that could provoke an impending displacement of some 50 million people within the decade.  Several countries have tried to contain the expanding regions of deserts by planting trees, restore grasslands or introduce plants to stem eroding soils, the huge expense of using water and of using water that evaporates as often as it feeds  plants, is far less effective or practical than it might seem as an ecological bulwark.

Scientists have debated and struggled to understand the causes and origins of the growth of deserts across the world, asking whether the underlying causes lie with declining rainfall, a severe drought that began in a period leading to the 1980s, and how to place local measurements of vegetation that revealed flourishing vegetation near barren landscapes of desertification.  The British ecologist Stephen Prince expressed his frustration at assembling a larger picture of desertification based on data that he described as “pinpricks in a map” which failed to assemble a larger picture by studying vegetation from space by using time-lapse photos of the area of the African Sahel caused famines across sub-Saharan Africa to assemble an image that better revealed relations between local conditions across a huge expanse, of which this photograph by Andrew Heavens created a synthetic document that reveals the broad proportions by which the desert encroached on arable land:


africa_ndvi_200511


The phenomenon is not limited to Sub-Saharan Africa, moreover, as an image of the variety of microclimates in which the threats of sensitivity to desertification has been mapped in the fertile region of the Mediterranean basin:


Desertification Sensitivity in EU

The challenge lies in understanding the global proportions of desertification–revealed in the below map that notes expanding deserts by tan bands–in a coherent understanding of the huge variations of local contexts from Asia to Anatolia to Patagonia to Australia to the western United States:

worlddesert


The global risks of desertification–most prominently on five continents–have been dramtically heightened in recent years not only by global warming, but our own practices of land use, the Zimbabwe-born environmentalist and ecologist Allan Savory notes, describing it as a “cancer” of the world’s drylands, a “perfect storm” resulting from huge increases in population and land turning to desert at a time of climate change.  The areas of land turning to desert are not only occurring in dry lands, but in the lack of any use of the land that leaves it bare and removes it from land-use.  Savory has argued in a persuasive and recent TED talk that the global dangers of desertification has multiple consequences, of which climage change is only one. 

The growth of areas of desertification are apparent in this satellite view, which reveals the extent of a global process of desertification not confined to Africa’s Sahara, but already progressed across quite large regions of both North and South America as well, on account of rapidly accelerating changes in micro-climates world-wide:

world deserts satellite view


The expanses of desertification are even more apparent in a global projection of our newfound vulnerability to desertification, that illustrates the massive degree of changes in the world’s land, in part effected by the bunching and moving of animals, largely encouraged by federal governments who reduced the lands open to cattle grazing in the belief that good land-management practices meant protecting plants from grazing animals:


desertification_map


The above map made by the United States Department of Agriculture-NRCS, Soil Science Division, reveals the dangers of expanding desertification at an extremely fine grain. We can view this map by highlighting the expanses threatened by increased desertification in this world-wide satellite view, whose regions ringed in red highlight the areas of a dramatic increase of desertification and an apparently unstoppable cascade of deep environmental change and release of carbon gasses:


Deserts RInged in Red


The difficulty of understanding the causes of desertification arose from a deeply unholistic ecological view of the nature of microclimates begun 10,000 years ago but rapidly increasing now.  Savory asks us to relate this to the hugely artificial contraction in the number of herds grazing land seen in recent years, creating a resulting very high vulnerability to desertification–noted in bright red–that would result in carbon-releasing bare soil, threatening to increase climate change, much as does the burning of one million hectares of grass-lands in the continent of Africa alone.  Savory argues that the only alternative open to mankind is to use bunched herds of animals, in order to mimic nature, whose waste could act as mulch help to both store carbon and break down the methane gases that would be released by bare or unfertilized–and bare–soil.

Such mimicry of nature would effectively repatriate grasslands by introducing the planned pasturing animals and livestock like goats to regions bare of grass or already badly eroding–and has lead to the return of grasses, shrubs, and even trees and rivers in regions of Africa, Patagonia and Mexico, with beneficial consequences to farmers and food supplies.  By the planning the movements of herds alone, replicating the effects of nature can turn back the threat of desertification by movable herds of sheep and cows, already increased in some areas by 400% to dramatic effects of returning grasslands to denuded regions of crumbly soil and straggling grasses.  Even in areas of the accelerating decay of grasslands and growth of bare soil, Savory argues, we can both provide more available food and combat hunger through planned pasturing, and reducing a large threats of climate change that would remain even if we eliminated the worldwide use of fossil fuels.  He argues that we can both take carbon out of the air and restore it to grasslands’ soils that would return us to pre-industrial levels, based on a deeper appreciation of the ecological causation of desertification and by replacing rejected notions of land-management, actively reducing the frontiers of desertification.  Although Savory does not note or perhaps need to call attention to the risks of the huge displacement of populations and consequent struggles over arable lands, planning the repatriation of land by animals would provide mulch and fertilizers to rapidly effect a return of grasslands in only a manner of several years.

The prognostication of the expansion of the desert is not often as mapped as the rising of ocean waters in the media.  But it may offer a more accurate map of the alternative over the next fifty years, and hint at the huge attendant consequences:


Human IMpact on Deserts

(I’m including a post by Susan Macmillan on Allan Savory’s March TED talk here.)

2 Comments

Filed under Climate Change, Desertification, global drought, global warming, mapping arable land, Mapping Desertification

Mapping the Universe? (Why a Map?)

Significant celebratory buzz has accompanied the recent images that “map” the distribution of matter and heat in the early universe.  Let’s stop on the word map, however, as we admire their content.  It might be worth it to consider how their content became considered as a map–as opposed to a simple image or visualization–to tell us  about how we see maps.  Back when Arno Penzias and Robert Woodrow Wilson first accidentally recorded background microwave radiation resonating through the universe while at Bell Labs in Murray Hill, NJ, they were so puzzled that they paused before reporting their results, trying to make sense of the buzzing in the background by cleaning their instruments of registration and even scooping some fifty pounds of accumulated pigeon poop out of their massive antenna.  They knew the significance of the sound, but weren’t quite sure of how to make sense of the measurements.  And so they checked multiple times before they went public about their observations, because their was no clear way to imagine what form that background static took.  They barely had images of background static–a hum that barely registered, and was not even imagined as able to be visualized.

The reconstruction of their results was hardly a map, since the detection of background radiation was so slight and the images itself so trace-like and whispily diaphanous.  What radiation did register showed, according to a modern reconstruction, something like a very primitive radar or sonar or the ghostly shadows of an ultrasound–after all, this is the afterglow, as it were, of the Big Bang explosion that first scattered the universe’s matter:


Penzias and WIlson 1965


While a reconstruction, this image provides a basis to trace a history of background radiation images that reveals how their forms of visualization were seen as retrospectively mapping the distribution of matter just after the time of the Big Bang.  The COBE probe dramatically clarified these measurements by 1989, using satellite measurements to differentiate something of a clearer visualization or intensity map of remaining background radiation eery afterglow corresponding to variations in local temperatures.  This is somewhat like an early form of medical imaging, and is reminiscent of an MRI with isotopes or coloring agents injected in a bloodstream, highlighting areas with a sort of detailed fuzziness.


Cobe Afterglow


The COBE probe gave important confirmation of the “lumpiness” or uneven distribution of matter–in other words, it suggested that there was already a sort of map of the distribution of densities in the 10 to 34 seconds after the Big Bang, with long-term consequences for our universe’s configuration:  variations in density were defining elements of the background radiation distribution COBE showed.  The evolution of the universe’s size increased this lumpiness, as concentrations of matter in specific places created disparate gravitational pulls  Other images oddly suggested continents and oceans by their terraqueous color-scheme, which indeed recalled a terrestrial map, if something like a relief map of considerable granularity:


universe-cobe


The metaphor of a relief map is helpful.  Despite bluriness even of a later 1992 image from the Cosmic Background Explorer Probe (COBE), whose forms are less reminiscent of a familiar oval terrestrial projection than a map of heat distribution, and plots the temperature changes in revealed by the background radiation on galactic coordinates:  it maps the after-image of a primeval heat-distribution, giving a sense of matter distribution that gave off light and created the iridescent glow.  But it seemed to lack the detail of a map so much as a visualization or imaging with considerably great lumpiness or variations in cosmic microwave background radiation that resulted from that primeval explosion:


1992 MAP


The enormous augmentation of detail within the image that the larger Microwave Anisotropy Probe generated after it was sent to space in June of 2001 provided a far more detailed picture than earlier believed possible.  To be sure, its acronym aside, this didn’t look like anything we’d call a map that recorded a uniform distribution of space.  But the visualization of emissions published in 2003 based on a year of data collection was of truly stunning detail as “an image of infant universe”–the map of temperature variations was a big improvement from the first “baby pictures of the universe” taken by Cosmic Background Imager high in the Andes.  (Each ‘map’ has been announced to the public with considerable fanfare focussing on the wonder of recording this image of background radiation in any visually readable form.)

To improve the resolution of this “picture,” the later WMAP spacecraft, an improved named after the cosmologist gist David Todd Wilkinson, a physicist who was researching background radiation when Penzias and Wilson first got their results.   The WMAP employed reflecting Gregorian dish mirrors to register background radiation at a far greater resolution with a 45-fold greater sensitivity than the COBE probe.  The exquisite heat-variations compiled temperature fluctuations in the “Cosmic Dark Ages” 380,000 years after the Big Bang, “mapping” the last scattering of light from the explosion.  The findings set a new basis for imaging the landscape of the early universe, supporting the current Standard Model of Cosmology, and revealing a picture of a universe in which dark energy played a significant role.  It depicts with unprecedented granularity a record of of heat variations astounding even when shrunk to the size of a 4-by-6 index-card:


background microwave radiation 203.

Leaving aside the embedding of “map” in the handy acronym of the WMAP, or the Wilkinson Microwave Anisotropy Probe, the beauty of its synthesis of data was called an “image” of background cosmic radiation, more than a “map” of the early universe, in 2003, as when 3-year data were released in 2006.  The oval projections used to compile an all-sky image of temperature fluctuations reveal the spots and clusters that grew to form galaxies, was a massive effort of data collection.  Take a moment to click on this image of the some 15 billion years past, and examine its variations in detail,  revealed a striking lacking any uniformity:


ilc_9yr_moll4096


The images of the universe published several days ago were universally presented as a map, is a similar data synthesis based on data accumulated over 15 months.  The sensitivities revealed below in a heat map of readings from the orbiting Max Planck space telescope.  They suggest an even more surprisingly variegated distribution of matter that looks closer to something like a continental division of the world, as if the macrocosm prefigured the microcosm of earth, but seems even more un-uniformly distributed and, as astronomers put it, more “lumpy”:


planck-640x353


The image, like a world map, is a visual register of knowledge, as well as a basis for future research and theory-checking, condensing substantial empirical information and sightings.  It provides a partial confirmation of the age of the universe, and grounds to support the Big Bang model and theory of cosmic inflation.  (This image suggests decreases the amount of so-called “Dark Matter” that is around, and caused some adjustment of the dates of time since that huge explosion.)  As such, the “map” seems to reveal our ability and interest to the stock of progress, see some new directions for work, and be satisfied we have something (at last) like a fine-grained map based on these results, even without the identifying names or signs of orientation we expect from land maps.

How does it offer viewers a map?  For one, it presents a sort of key unlocking a mysterious architecture, and something like a hidden architecture of the world that is analogous in its potential meanings as the human genome map.  Synthesizing a huge amount meaning, much in the manner the human genome project, both reveal a sort of master-code in meta-data scientific images that seem mythical master-maps of knowledge.  The earliest image of the universe is also stunningly beautiful in the variations that it reveals with an almost palpable resolution and the sheer beauty of delineating a primeval topography of matter is stunning if not mind-boggling given it is recording a skyscape of some billions of years ago:  the sheer “beauty” of the image, admired by cosmologists like David N. Spergel, qualifies the refined synthesis of variations as a “map” as well as a registration, and as revealing a distribution of local temperatures, even though it is not that comprehensible as a record of space.

But the data compilation also interestingly fits how expectations for mapping have radically shifted since the widespread acceptance of GIS, or computer-generated images not based on individual images or transcriptions but compiled as graphics, whereas earlier visualizations would not have been so readily classified as maps.  The broad purchase of maps as intellectual tools and visual bases for further inquiry is reflected in the large number of media maps that are daily diffused on the web, Television, and other platforms of visual consumption.  While we used to consider maps drawn renderings based on hard data or derived from surveying tools, the acceptance of computer-generated images makes us ready to call the synthesis as a map.  The refinement of its  color schema and what might be called its greater resolution or granularity suggests the broad popular currency of something like a projected heat map that project changes in summer temperatures as a result of global warming–or the palpability of abstract blobs of bright red coloration in weather maps denotes heat fronts.

The below maps for example chart the projected growth of summer temperatures for the years 2050 and 2090, and make an immediately felt and particularly vivid argument even by abstract forms, in which the earth assumes a temperature in relation to previous summertime highs:


global warming


The Plank image of the universe meets the demand to have an actual image of what was then, as well as of a readable synthesis of data.

Of course, it’s a much more satisfying picture, and one of considerable technical dexterity and achievement.  More to the point, it is a synthesis of astronomical observations, whose measurements are correlated to assemble what seems a continuous and coherent whole.  And that makes it a map, after all, in an age of data correlation.  It doesn’t have any of the symbolic recognizability of anything like a global projection, to be sure, or contain any orienting words or textual signs, but the notion of an early differentiation into degrees of lumpiness of matter is as compelling an image as we’re likely to get or could reasonably hope.  Indeed, the “baby photograph” metaphor is pushed to new heights at the same time–“fatter than expected“–and interest in the image’s general bumpiness.  The new language of the topography of the Big Bang is what the map allows, and where its beauty lies.

It’s an amazingly satisfying as an image that allows us to peer so far back in time and try to grasp what it is we see before us on its surface.  The elegance of the detail of its data of sources of heat allows us to feel, or sensorily apprehend, aspects like the “lumpiness” and lack of uniformity in the early universe, and to start to grasp what an odd terrain of matter it was.


planck-640x353


It’s also a way that the distribution of matter, in its untouched, pristine state, returns to us even in the age of the anthropocene.

1 Comment

Filed under Background Radiation, Big Bang, Cosmic Background Radiation, early universe, Mapping the Big Bang, Microwave Radiation

How Do You Map Your Meat?

Delineating sectors of an animal’s carcass on the form of a living creature is particularly jarring.  It implies a clear category confusion that might be described as either breaching boundaries between the living and the dead, inappropriate, or deeply unheimlich or uncanny.  It affirms the double-existence of the cow, and of all farmed animals, for the modern carnivore, perhaps rooted in his new relation to the art of butchery.  The neat dotted lines that segmented the bovine suggests it is not a grazing animal, than a diagram of what we are invited to buy at the butchers; its very form invites us to navigate passage from the living to dead animals, performing a doubling of the animal portrayed in its domesticated setting, focussed on the socialization of our relation to animals through our own increasingly complex relations to the division of the animal carcass.

If the high-end butchery that has made a resurgence in recent years has emerged as a sort of urban provisioning of select cuts–as if in an attempt to restore a concrete relation to the cuts of meat we eat, in an era of factory farming. If we as a nation are more alienated from the food chain, and from butchery that occurs in slaughterhouses and meat processing plants across much of the midwest and souther states, the concealment of how we treat animals, and how we raise and slaughter them, seems closely tied to the return of diagrams that suggest a new intimacy with the animal, at least for the gourmet crowds of urban hipster butchers and their refined clientele, whose familiarity with the division of the carcass has gained a new almost topographic precision, as if they were doing the manly task of wielding the knives above an actual animal. And when I see signs from the local butcher shop window, inviting applications for workers with “no experience necessary,” I was tempted to apply to do more research for this post. A neighbor had already recently started working there; we want to keep the place in business, and folks cycle through the non-unionized shop in a fashion that is notably brisk.

Meat arrives at butchers precut, of course, and often in cardboard containers that provide disembodied rebuses in place of actual authentic butchered meat, in stylized icons that resemble puzzle pieces as much as the diagrams that once graced butcher’s stores for customers: the place of such meat cuts that arrive in trucks in the northwest and California promise to package up the meat cuts now disentangled for ready preparation, a sign of the skill of the butcher’s craft that in meat cut “survival boxes” that are evidence of a surplus economy of meat, but promise a minimally processed cut of meat for consumption.

Cascade Farms, since 1880

The late nineteenth-century origins of the farm in question that has taken time to illustrate the cuts it ships in cardboard boxes seem intent on recuperating a relation to the provision of meats in the past, as much as the artisanal legacy of butchery: this is a promise of farm to table, quite literally mapped. Or, at least, it is a promise to be doing the mapping for its customers as a mode of assurance. The historical status of these distinct cuts of meat delivered to urban audiences of west coast cities had a long history of converting the cow into cuts, and remapping meat for consumption and distribution, if not civilizing the very process of eating meat as a form of sociability, often forgotten in the supermarket display cases of shrink-wrapped meat that arrives from factory farms. If the animals pastured are echoed in the astroturf-like green plastic trim some butchers still display, have we forgotten the hidden history of how we came to map meat?

Displaying IMG_8159.JPG

Far from only defining the meat–or the cow–the butchery map defines our place as viewers and as eaters.  It does so through the sorts of literacy that it presupposes, embodying the rationality of the butcher shop and the education of the prospective customer, elevating the sectioning of meat from a market or from mess.  We are asked to see the cow as it is best divided, not only by the best butcher, but in ways that cast the skill of the butcher as akin to that of the master-cartographer, and invites us to see the preparation of meat as process that is as solidly rooted in learned skill that transforms the cow that stands upright before us on the earthy meadow to a meal that is able to be consumed among the “animals that we eat.”  

For we all–at least all who seem to be ready for organizing a barbecue, or just grilling meats, seem to know, so that we yuppies are all but ready to attribute to the truly carnivorous instincts of our pets, replicating the first-hand familiarity with the cut-up carcass of a cow on its way to become beef even to the stuffies we buy for our pets. The division of the cow, sheep, and pig from beef, lamb, and pork is a master mapping of domains of food, rooted in the skillful raising of the animal and culminating in the division of the animal corpse., as if this will sanitize it before it reaches our dining tables. And the sanitizer in chief, who drains the animals of blood and represents them to us as consumers was performed by a top-hatted man in a white spotless apron as his blade separated bone-in beefsteaks and rib-eye cuts that hung behind him for customers.

New York Meat Market, from Thomas Devoe, The Market Assistant, Containing a Breif Desceriptin of Every Article of Human Food Sold in the Public Markets to the Cities of New York, Boston, Philadelphia and Brooklyn, including their Various Domestic and Wild Animals, Poultry and Game (New York, 1867)

There is, it is true, an iconic appeal of some animals, whose icons provide arresting signs of their conversion to food on city streets and whose unbuttered outlines are tokens of the foods from which they are processed. But these are the exceptions, which succeed as they suffice to offer signs of the distance of many cuts of meat from the animals from which they were cleaved–and of which they once formed a part. And perhaps the pig is always so standard an early modern sign for butchery–and a familiar animal to be slaughtered for sausage or cold cuts–to be far from the true art of butchery we seem to be staring into in the touristic time-warp tourists still encounter on Parisian streets.

However, the division of the cow seems to have set boundaries in our relations to meat, inn part because of ugh skill of its division for parts, and the greater difficulty in mapping out the sections of the slaughtered beast to convert them to our cooking skills–and to the levels of taste, and economy of meat cuts, that good butchery skills imply. If the low status of some slaughterhouses and cuts of meats is implied in the seedier areas of butchery in many urban zones–the Tenderloin, for example, that wedge of distinctively flat urban land  in San Francisco that is historically bounded on the north by Geary Street, on the east by Mason Street, on the south by Market Street in San Francisco, seen not as a meat-selling region but the “soft underbelly” of the city’s urban vice, much as the Tenderloin in New York City, and may suggest the higher wages of policemen in that part of the city–which allowed them to eat better cuts of meat–or the central site of urban graft–it suggests the transposition of meat cuts to class, and the social strata in urban life, analogous to the region of “outcast London” that emerged in the middle to late nineteenth century, so evocatively studded by Gareth Steadman Jones.

The conversion of cuts of meat to social tiers of urban society seems to reflect the social acknowledgement of the art of butchery as setting a new frontier in the domestication of the animal for human consumers. The mapping of meat is a transformation of the animal to social level of the consumer, mapping a way to convert the mammal into cultural categories of human activity, in what may be the ultimate sort of structuralist dream of post-primitive categories, both in farming and the healthy preparation of meat in an age of increasing fears of food-born bacterial contamination of meat cuts that can give rise to the bacterial infection of the gut from either the farm or abbatoir, and view the elegant sectioning of a lamb’s body as a of a piece with its breeding and raising, and a statement of the skillfulness of its preparation for the table, or at least for multiple modes of cooking–roasted or grilled–as the flesh is converted into food that is promised to be easily digested.

Puytorc

The image denies the differences between raw and cooked, and the living and dead, by providing a far more easy way to visualize cuts of meat as if inscribed on the surface of the living body, and indeed “mapping” regions of a territory by set precincts, creating a consensus erases any sense of the subjectivity of the animal, and displays the carcass as it exists for the carnivore, the regions of the living cow separated suddenly from any sense of the messiness of butchery.  In ways that echo the current rise of the artisanal nature of butchery that have so widely recuperated similar images of the unflawed carcass of the cows, pigs, or other quadrupeds, the cow is displaced by the craft:  for as it appears calm on its grassy meadow, the cow exists to be butchered, and seems not only quiescent but acceptant, prepared to sense no pain at the prospect of being not only divided but seen as it becomes transformed to a set of meat cuts.

As viewers of this fundamentally pleasant image, which invites us to accept the world from the perspective of the sophisticated carnivore, we accept the sectorization of an image of an animal as the surrogate for the actual division of its parts. The fine dotted red lines of that vectorize each region according to its musculature run against the rippling of the individual cow’s skin, and seems a striking way to translate the living animal by an artisanal tradition of apportioning an organism into cuts of meat.  While the marginal image of the butchered cadaver of a cow reminds viewers of the eventual division of the animal body for its human consumers, and a microscopic view of coliform bacteria reveal the dangers if the sanitary procedures of such a translation are not carefully followed.  The resurgent interest in butchery diagrams reveals not only a renaissance of artisanal butchery, and boutique butchers run by hipsters who cleave and sell meats sourced from local farms, of hormone-free and antibiotic-feed free stock, but use a map to communicate and establish shared consensus on the proportions of bone to fat, and flesh to fat, in distinct cuts of meat that we aim to prepare.  While such distinctions elevate their cost, they also draw clear criteria of taste, communicated in diagrams that recall medical textbooks if not just book learning, creating a needed consensus and useful shorthand around tacit levels of knowledge of their relative qualities for butcher, customer, and chef.

The portioning of what appears a living body, but reveals a sort of doubling that the alchemy of maps is particularly suited to perform.  For the farm animal that seems to have paused while grazing is transformed for the eye of other images of the same treatise are moe anatomical–re learned viewer into a carcass: the guidelines for portioning the meat of the animal, before its slaughtering, is something of a championing of the dexterity of such division as an art that is akin to the technical skill of drawing maps–even if the art of butchery is, in general, judged far removed from the art or technical skills of drafting accurate maps, the orientation to the culinary arts served as a translation of the living animal to an edible form.  The origins of such a tradition of apportioning meat and carving the meat after it is cooked but before it is placed on the table goes back to the Renaissance, but a complex condensation of the civilizing process seems to be projected onto the process of dividing the cow’s meat in preparation for the table, in ways we’re starting to recover.  Unlike images from the treatise more anatomical in their copious level of descriptive detail to the sectioning of pork parts–

pig

It is almost as if the doubling of the animal is removed from the objectivity of a medicalized image, but is rather a field that moves from three dimensions of a living animal’s body to a flat surface.

But the skill of dividing farmed animals and of recognizing individual cuts of meats suggest a transformative remapping of meat:  the subjects of good animal husbandry are rendered into regular configurations of cuts after they are slaughtered, in a metamorphosis of meat that is almost as important as the distinction between raw and cooked.  Indeed, the instruction in accurate cuts of beef was invested with a geometric regularity for Hylas de Puytorac, who would win a certificate of agricultural merit to the state which Jules Ferry had created, used to teach readers of the nature of the parts of animal we eat.

The award of merit de Puytorac won reflected his presentation of butchery as an moral message to instruct readers to eat in the most healthy manner.  The diagrams of Hilaire de Puytorac create not only a condensation of the civilizing process, but a confluence of a Cartesian sensibility and bourgeois lifestyle and attitudes toward food–they not only translate between the living and the dead, in an evidence of the uncanny, but effectively bring the cuts of meat from the butcher’s stall to the houses in which meat cuts are served.

cd31eb6b01d26125a97630b642c390f7
Hylas de Puytorac

De Puytorac artfully imagined the transformation of cow to carcass was a question of domestic economy circa 1920, and prepared the animal by distilling the principals of meat division as if they were naturalized in dotted lines atop the skins of living animals; long before they became suitable art hangings, charming for the endearing way that they represent the meat cuts that entered kitchens or butcher shops, their pedagogic clarity directly translated the bodies of living animals to meat, dividing the living animal to the names of meat cuts without needing to convert it to a carcass.

Hylas de Puytorac’s elegant line is far removed from the gross familiarity with which bovine animals seem to gaze right into the eyes of customers at some urban burger joints, now presented as if emblems of the high quality of meats that they use by virtue, perhaps, of their heft, without any sense of carefully portioning meat cuts as de Puytorac so prized. This is achieved by the life-size dolls now included outside some craft butchers, almost eager now to shock the passerby by their familiarity with meat, labeling one’s arrival at a truly honest butcher shop: the old-time bags from local butchers in New York or Ottawa suggest an intimacy with the bovine carcass they promise to transform for your table, in a modern iteration of de Puytorac’s advertisements, now so popular as posters and printed postcards.

Cow outside Burger Joint.png
Plastic Cow.png

To be sure, there is something unseemly in the lack of drawing a boundary between the cow or farm animal whose carcass is offered to provide markets with meat and food preparation.  For de Puytorac, the naturalization of meat cuts followed crystal clear logic, echoed in those crispy defined dotted lines which almost elided the technical skill of slaughtering and butchering by which the sheep was made lamb, and the cow made beef:  the subject of each “map” was the translation of animal to meat, and clearly subtitled “the animals that we eat,” but the cuts of butchery were replaced by a sanitized map for public consideration by the educated or informed, as if this domesticated and civilized the very process of describing, cutting, and consuming cuts of meat.

Puytorc.png

Acts of butchery was the elegant mapping of edible meat were omitted because the map instructed viewers in a new relation to the body of the farm animal, even if they lived far from the farm and probably weren’t yet familiar with the butcher stall or the laboratory of the kitchen.  

But the rise of meat portioning, recently returned to artisanal butcher shops as well as marketplaces and abattoirs, has lead to an increased interest in re-mapping the cuts of meat with an aesthetic elegance that the mass-market of food production had long forgotten.  With the return of the mapped body of meat at local butcher shops gain an aggressive economic presence in select metropolitan areas where the revisionist of the art of butchery gains a new appeal of reintroducing the varieties of beef, lamb, or pork made edible by the linguistic transformation of the living animal to a carcass, and the mapping of a beings’ edible elements, one detects not only an aesthetics of the ‘whole animal’ movement–

sanagans

Sanagans Meat Locker, Toronto CA/Letters in Ink

–but the embrace of butchery, cookery and meat-consumption as a valued aesthetic has led to the revival of such once antiquated maps of meat in European visual culture.  The recent linguistic fetishization of rediscovered arts of butchery emphasize the value of its learned, transmitted intellectual status of the names of meat cuts that frame the image of animal that looks straight into the customer’s eye at Sanagan’s Meat Locker in Toronto’s Kensington Market, acting as a hand-drawn hipster rebus for first-hand familiarity with meat cuts of Victorian elegance for customers who are looking for specific cuts and are in the know–beyond the nostalgia of traditional arts of butchery outside modern meat markets, where they are portioned for the in the know by hipsters who are often tattooed and wearing newsboy caps.

KOKORUDZ.png
Meat Names Sanagans.JPG

The cultural transmission of adept skills of meat-carving is found, in other words, not only at the butcher-shop, but on the drafting table:  as much as the whole-animal ethos has increased consciousness of artisanal skills of portioning freshly butchered meat among a new generation of hipster butchers, the division of the animal body was defined in increasingly elegant diagrams of butchery echo the skills of discrimination encouraged at the dining tables of courts as well as the domestic dining tables of mid-nineteenth century.  New modes of mapping meat were drawn on the forms of living animals, and widely diffused in detailed diagrams that increased admiration in engravings that delineated meat cuts with the objectivity of an anatomical diagram–but that maintained the illusion that steers were divided for the table directly from nature, or from the farm, so that “Le Boeuf” is standing, hopes planted firmly on the ground, gazing duly ahead as the cuts into which his body will be divided are inscribed according to discrete cuts to be distinguished by their ratios of taste, toughness, fat and flesh.

cd31eb6b01d26125a97630b642c390f7

The graphic sectorization of the animal “body” transformed the slaughtered carcass not only to butchered meat, but to a gastronomic culture of increasing and considerable sophistication.  The portioning of meat and the cutting of the cooked body maps onto a signifier of socioeconomic class, marking the transformation of the animal body into a recognizable and elegantly edible product.  One might continue the metaphor or dine out with it as more than a convenient or apt figure of speech.  Much as mapping is a practice of imposing clear configuration on space to codify spatial relations in a recognized form, the mapping of the cooked and the slaughtered carcass transformed the natural boundaries of the well-husbanded steer or other animal into shapes that we invest with meaning and naturalize by their own geometry, and were easily renamed in works of popular education that might be traced back to the efforts of Charles Dressiens’ hopes to ameliorate the lives of Frenchmen by “addressing their stomaches” by codifying “une science de ménage” as precepts of “education ménagère.”

Vismara_le boeuf_small.jpg

The domestic economy of middle class homes placed a strong emphasis on elegant cutting of cooked meats.  “One of the most important acquisitions in the routine of daily life is the ability to carve well,” advised the 1852 Illustrated London Cookery Book somewhat sanctimoniously; even if “the modes now adopted of sending meats, etc. to table are fast banishing the necessity for promiscuous carving from the elegantly served boards of the wealthy,” it continued, “in circles of middle life . . .  the utility of a skill in the use of a carving knife is sufficiently obvious.”  The accomplished decorum of severing joints, carving birds, and the dexterity of manipulating knife and fork garnered spousal approval and admiration, evidencing an ability to divide meat that designated class differences.

On-Carving-86

“Carving presents no difficulties; it requires simply knowledge,” Frederick Bishop continued to tell readers.  Lack of expertise is simply a question for Bishop of good decorum and tasteful bodily comportment.  “All displays of exertion or violence are in very bad taste; for, if not proved an evidence of the want of ability on the part of the carver, they present a very strong testimony of the toughness of a joint or the more than full age of a bird: in both cases they should be avoided.  A good knife of moderate size, sufficient length of handle, and very sharp, is requisite; for a lady it should be light, and smaller than that used by gentlemen. Fowls are very easily carved, and joints, such as loins, breasts, fore-quarters, etc, the butcher-should have strict injunctions to separate the joints well.”

The transformation or passage of animal carcass to meat suitable for preparation, and the linguistic conversion of indicating meat cuts distinct from an animal is an ethical question of renaming, but also a deeply cultural process rather than only mapping animal parts.  If all mapping is something of a conversion of nature into culture–and a creation of place as a known identity, able to exist as a set of coordinates, as well as recognized in one’s mind–the mapping of meat is more than a transformation of raw to cooked, but once-complex process of rendering meat subject to and fit for human consumption, in a combination of the arts of gastronomy and butchery far more than simply anatomy–if the language of mapping meat hides both the work and presence of the butcher and slaughterer as well as the cook by which the tender morsels are prepared, as clear linear divisions were imposed on the steer that was transformed into beef, ready to arrive into the stewing pots illustrated above the animal, or cut into pieces ready for consumption.

dcoupe1_0_0

Far from only employing a sophisticated language, the mapping of meat is something like a deeply historical and cultural sedimentation of rites of renaming what was once alive in ways that entered local food cultures and prescribed models for the preparation of food that seem eerily akin to recipes.

But the decorum for separating cuts of meat or meat apportionment has a long if submerged history, and reveals a cultural form of mapping, and the artifice of mapping accurately.  I begin with such a polite and decorous image since I’m moving toward some diagrams of sectioning prime cuts that focus on the separation of cattle into meat cuts–maps that similarly separate the division of animals’  bodies by butchers and convert what was a body into portions of edible meat.  Although Nicola poetically described on “Edible Geography” “the sculptural discovery of secret shapes within the familiar architecture of an animal,” mapping the carcass is not only a process of unpacking, or of revealing, but a transcription as well as a form of translation of the body of the animal to the provision of cuts of meat–a renaming of body parts as forms of meat.  The transcription converts embodied form to table, dismembering the body by preparing of the cow’s carcass into pieces of prime cuts for the eyes of the chef.  The process of extracting individual cuts of meat from the body, and renaming them, is the ultimate denaturalization, or repackaging of meat cuts for the market place–as its unwanted head, horns, ears, and hooves are discarded and not destined for consumption.  And although the map suggests proximity to the steer, few folks who read the image would have first-hand relations to the carcass, but rather a naming of regular configurations once seen in the butcher shop.

everythingbeefflat-careful division

To be sure, the marginalization of butchery from a public act to a hidden practice, located more often in slaughterhouses or behind the scenes, may lead us to marginalize the slaughtering of animals from our current mental maps, as if the “Tenderloin” could refer only to a seedy neighborhood, as well as the cheaper notion of realty that might be named after the cheaper cut of beef in New York, maybe combining the inexpensive living in the neighborhood spanning from 23rd to 57th streets and Seventh and Eighth, but also displayed clear formal similarities to a strip–

image.png

–but also have gained new metaphorical legs during the intensive carving up of urban neighborhoods, and indeed molding urban space by sheer force by master planners who sought to carve up the city, as urban activists who treasured neighborhoods bemoaned development as “cleaving” organic districts of life by a brutal force of will, carving up an urban space by its neighborhoods in ways that display striking formal characteristics to the inviting “meatspace” of New York:

image.png

Nicholas de Monchaux

Such a cleaving of neighborhoods by what seem–on the city map–small and delicate cuts reflect not only the musculature and distribution of body fat on the animal, but the conversion of lived space to a space of good manners, social etiquette, and culture.

How did this division come to be codified?  As much as how we bring the meat to our table, it is a sort of map of how we ingest our meat, and deserves to be examined as such.  Rendering cows as canvasses to make maps, and imagining the coat of a European Holstein cow as  bearing a “natural” image of the world may universalize the breed, but is a pleasant fantasy, neatly naturalizing a global projection by a clever photoshop.

world_cow_530

The photoshopped cow was clearly painted by stencil, but we’ve long mapped the cattle varieties specific to regions–as the Holsteins of France, who seem naturalized by region akin to a map of cheeses or wines, locating different breeds of cattle as if indigenous to different provinces and landscapes of France.  But rather than derive from specific regions or terroirs that distinguish the different qualities of wine–perhaps embodied by their local mineralogy, acidity, flavor, and earthiness–the mapping of meat is a more profound conversion of the natural to a cultural product, and indeed an illustration of the mastery over nature of the sort that finds expression in a map.

carte_bovins_france

To be sure, there is considerable defense of the healthful or patriotic properties of “meat” that various nations produce.

100% British.png

Tesco Advertisement

But mapping meat into prime cuts acts more like a practical sort of map of cuts, both by distancing bovine forms by labeling, converting limbs beneath its skin to an ownable set of parts and taking possession by some alchemy of them as cuts, renaming the animal as the edible.  The relabelling of the animal indeed turns it into the consumed:  and the artistry of the artisan translates the animal into anonymous cuts of meat that can be recognized as discrete.  In this butcher diagram–or butchery map–the cow becomes the territory, removed from ts location and subject to division into brightly colored prime cuts with far less specific local knowledge of the neck, cheek, and tongue:

beefcuts400 clear

This process of translation, and of unpacking distinct cuts, is familiar already in the below enumeration of prime cuts, respecting a basic division of chuck, rib, loin round, and brisket, plate, flank and shank, and hinting at the deeper cultural division of mapping styles, even if the act of butchering has been separated from the meat shop:

Cuts-of-Beef 1922 Jane Eayre Fryer

The point is restated in Sanagans, as well as in the Harlem Shambles, by openly distancing butchery from the slaughterhouse:

IMG_2802-e1391008693985.jpg

Is this division not a distancing from the slaughter house? If Freud had discussed the ultimate taboo of the dead body of a person as a cultural universal, the naming of these parts of the slaughtered cow that arrived straight from the Shambles or slaughtering house allowed their parts to be converted to the marketplace, assimilated to recipes, and be on their way to cooked. This is not a mapping of nature, but a cultural relabeling of body parts, a continuation of the logic of the slaughterhouse itself, that peaks into everyday life.  For the naming of meat cuts serves as a way of processing the formerly live cow into discrete areas that arrive in the kitchen or chef’s table, or a distinct language by which to name regions in relation to distinct styles of meal preparation and indeed a form that they might be most consumed.  The idea is less to better know the topography of the steer’s divisions, by converting a division of the progression of the steer’s body in the slaughterhouse and to a new lexicon as it moves toward the preparation of food.  The division of the steer in multiple sectors is not merely about labelling, but a process of mental transforming, about naturalizing the division by which the body of the steer becomes transformed to meat.

Beef Cut Chart.png

Yet the work of translation in such diagrams follows a distinct set of practices–or so goes the hypothesis of this post–as the steer’s body and musculature meets distinct markets for meat cuts, in ways mediated by technologies of dividing as well as the art of butchery.  At one extreme, the very different division of cattle carcass best known is perhaps that mandated by Kosher laws of food preparation through expert division by which animal slaughterers prepare the meat suggest not only follow bodily sectors–despite the limitation of edible meat to the front quarters.  As much as a distinct form of meat-preparation, the sanctioned division of the steer seems to reflect a degree politesse in its avoidance of the rear quarters of the animal, as well as meat use–refusing to acknowledge the flank, rump, or sirloin cut, and sanctioning only the central cavity up to the thirteenth rib, or often stopping at the twelfth.  (In Israel, the rear leg is considered kasher, and trained slaughterers take the time to remove the sciatic nerve, leading butchers to sell meat from the leg as kosher meat and maximize the amount of meat available–even as they disdain and discard the “non-kosher” nether-quarters of the animal and its head:

primal-cuts-beef.jpg

Primal Cuts

kosher:non-koser -food

The division of the animal results in the celebration of the slow-roasted or braised brisket for the ritual meal.  The quite exact mapping of the sanctioned cuts of meat from the twelfth rib are quite distinct from the cuts of meat that are sold by kosher butchers, from Square Roast to French Roast to Ribs and the Deckle, or the fore shank, but all are separate from the cuts sold off for non-kosher consumption–

kosher beef diagramcr1.jpg

The sectioning an animal does not simply follow the form of the body, however, or the musculature of the steers:  different cultural styles of butchery may be geographically distinguished within the variety of ways meat is mapped in established diagrams, a rich subject for research, that reveal cultural division in the preparation of the animal–and sectioning does not only reflect sanctioning.

In Israel, the division of cattle can indeed be utterly more complex, where trained shochets divide the steer’s body not only into brisket, shank, ribs and rump and the like, but also to possess detailed mastery of Talmudic requirements for slaughtering animals. The requirements for ritual slaughtering —shechita–demanded a detailed knowledge of animal anatomy to cut precisely the trachea, esophagus, jugular vein and carotid arteries, that were not confined to the exterior or superficial anatomy: butchers were required to distinguish the dangers of any disease able to be transmitted from animal to man, by inspecting the viscera, lungs, and organs for any malformations, as well as to possess adequately sharpened knives to ensure the absence of all pain for the animal, lest they be made as unfit for consumption as if they were diseased, given that man was only permitted to kill beasts for the sole reason of nourishment. The piety of the shochet was perhaps a mean to access the prized delicate tenderloin, reflecting but preserved a parallel sort of an old-school style of butchery, imported in the diaspora from Europe:

Israel-beef-cuts

The resulting intimacy with the cuts of meat are something we seem to long in an era of processed meat from factory farms, from which we want to distance our own consumption, surviving in the ethical laws of kashrut and the traditional use of cleavers to slit the through of beasts by one movement alone, often on an animal recumbent, rather than suspended from a hook or having been killed in painful ways.

But butchery provided an orientation to consumption that has only increased in the current marketplace for food from factory farms. Scots butcher-cuts are similarly refined and complex, as if suggesting a professional transmission among artisans or animal slaughterers, emphasizing the neck and cloud, and different cuts around the round, leaving oddly absent and unnamed the often esteemed tenderloin:

beefcuts-scotch cuts

There is no doubt similarly complex division of the cow in Mexico suggests a distinctly artisanal culture of meat division, oddly similar to that in Israel in its emphasis on individual specialized cuts, each destined for different preparation, in a considerably complex practice of apportionment and distinction of the specific value of meat cuts:

kgraber0108

In Greek meat markets, the culture of a distinct uses for meat cuts animates butchery around an even more comprehensive ‘whole-animal’ culture of meat consumption:

beef_diagram_Greek

Farmer’s markets wholesale meat sellers have given rise to a new sense of wholesomeness of whole animal consumption, including the pig’s feet and jowl, as well as the “picnic.”

Wholesale meat cujts.png

But pride of place in the complexity of artisanal meatcuts must go to the Austrian butchers, whose care of carving carcasses is perhaps a legacy of the Hapsburg court:  dividing the steer’s carcass into some 65 distinct cuts from the Rostbraten to the Tafelspitz and Waldschinkin suggests the survival of local ingenuity and refined taste.  Rather than informed by a unique whole-animal ethos, the sophisticated division seems oriented to the distinct preparation different parts of the steer are due in the old empire, and perhaps the difficulty any but the best butcher will have in locating the desired filet:

Rinderteilung

The partitioning of the entire denatured and bisected carcass of the steer that arrives from the slaughtering house is converted to distinct portions, often destined for different dishes, betraying a distinct level of refinement in both traditional techniques of meat preparation and the codification of a high local level of butchery skills:

fleischteilstuecke
Austrian Meats.png

Of course, the greater simplicity of bisecting the cow’s body and dividing it into quarters is, in many ways, an American invention of which we can be proud:  it is a reflection of the rise of industrial butchery, which process multiple carcasses based on sawing the linear saw-lines to create a division and cross-sections–and a consequent decline in the taste for specialized cuts of meat.  The shop for buying meat has long migrated from the site of slaughtering–although there’s a been a return in some communities for fresh meats.

Slaughtered Daily.png

The predominant most current divisions of meat preparation have tended towards overtly linear cuts and schematization, mapping cuts readily performed by sawing bovine bodies fresh from the slaughterhouses to showcase “chuck” and “round” as generic qualities of ground meat–as much as cuts–and perhaps made more distinct by gradations of marbling than specific bodily origin:

Beef-cuts

Or, in an alarmingly denatured schematic image of a side of contemporary “retail beef,” removed from a steer and ready for shrink-wrapped packaging at your local COSTCO– the schematic rendering of the steer seems cut by a cleaver, rather than with attention to recipes, as if the cuts would break apart as so many quadrants of a chocolate bar:

Retail Beef Cuts and Recommended Cooking Methods

The meat-packing industry has developed its own form of mapping, easily transferred from veal to beef in ways that render the butchered animal ready to eat:

Beef:Veal Ready to Eat.png

A near identical imagery survives in Costco and in many food service outlets.  But the range of meat cuts that one associates with the artisanal has however made quite a comeback in certain niche markets recently, where the elegance of butchery as a form of sectioning has returned, less often perhaps for immediate consumption of prepared meats than the careful preparation of meats in restaurants:

Beef Cuts for Foodservices

But the disembodied icon of denatured cuts is far less disturbing than the brightly packaged glistening cuts stacked in freezer bins in supermarket meat sections, value packs of USDA Choice that serve as opulent illustrations of plenty for consumers unlikely to ever undertake butchering skills.

Value Packs.jpg

–or those recognizable cuts, stacked in rows beside fake plastic grass in butcher windows, fake grass whose presence itself suggests the meat’s remove from the scenes of butchery but oddly conjure the fields where the slaughtered cows presumably once pastured.

There seems to be far less of a lexicon for differentiating meat cuts, as they are increasingly denatured from the animal or steer, and familiar only as varieties of steaks:

USDA cuts.jpg
USDA_GRADES.jpg

Removed from the active division of the steer’s body, such meat cuts appear as if shorn of the animal, in the plastic packaging in which one might meet them in the refrigeration section of a supermarket, or beneath butcher glass.

grocerygal-paulina-market-lamb1.jpg

Yet to remember the distinct interest in distinguishing distinct diverse cuts of meat, take the time to compare the elegant distinctions for dividing beef clarified in a later nineteenth-century image of the range of cuts by which those technically adept can elegantly carve a cow’s carcass, around its neck and shoulders, corresponding to a bull’s musculature, so as to refine desirable neck and chuck meat, that convey the aura of a mustachioed blade-sharpening daintily aproned overweight butcher sipping wine, if not the wisdom they would pass on to good raisers of livestock in the later nineteenth century by that wonderfully didactic gastronomic educator, de Puytorac:

beef-diagram-depicting-the-different-cuts-of-meat-posters-1

Dividing the animal is the clear precursor to eating one.  For Hylas de Puytorac, Chevalier du Mérite agricole, images as”Le Boeuf” were destined more for schoolkids than for butchers; primarily didactic in nature, they sought to preserve an agricultural knowledge in danger of disappearance.

Tableaux demonstratifs

The multiple images he carefully engraved of pigs, cows, and other animals reflect the basic prime cuts suggest a tripartite sectioning of each half of the cow, but are elided with a naturalistic rendering of the bull whose musculature he would have recognized–an appreciation whose embodied animality were not so distant from the art of butchery.  Cuts are clearly subdivided by muscle-groups, in ways that recall the deeply artisanal skill set of butchery.  The division of the body of cattle is far more refined in this 1852 engraving of the over forty available cuts on the bullock:

A-Bullock-marked-as-cut-into-joints-by-the-Butcher (1852)

A 1928 division of the cow for butchering is similarly detailed; although its portioning is far less refined, it similarly covers the whole animal, dividing the brisket in multiple cuts as well as the shank in ways that suggest a process of repackaging bordering on schematization of an almost Tayloristic fashion:

Cuts-of-Beef 1922 Jane Eayre Fryer

Much modern meat-portioning may lack so much of a map, even in its more refined images, as they privilege “fine: cuts, sadly, as the division of animals is performed by saws and only rarely is the butchery of the entire animal actually on view:

beefcuts580

The generic division into sectors seems far more readily sawed for repackaging, which, disturbingly, somehow acquire their greatest color and tactile proximity only after being segmented:

angus-beef-chart1

This occurs in ways that, unhealthily to me, threaten to elide for perpetuity the distinction between cow and beef for customers, and ignoring as inedible a good amount of bones (and meat) that seem too reminiscent of their bovine origins, a transformation that seems elegantly if somehow quite inappropriately elided in this condensation of the remapping of the live cow to a carcass in this oddly ghostly image of meat cuts from the Encyclopedia Britannica, that seems haunted by the older arts of butchery but shows the sites of cuts of meat in a flayed carcasses biomedically, and encased in fat:

cow to cuts

It is almost tempting to read it as a cautionary image about our increasing consumption of animal fats.

3 Comments

Filed under animal studies, Butchery, food history, Food Maps, meat

Mapping Gun Violence versus Gun Ownership

When State Senator Audrey Gibson introduced a Bill 1678 in Florida’s Duval County to mandate completion of a two-hour anger management course before their purchase of a firearm–and for that course to be retaken every ten years–a flurry of consternation and protest broke loose.  Never mind that you can take the course online, and that it only lasts two hours–it was seen as an infringement on the sacrosanct individual rights, independently form the traditions of government designed to protect the common good–yet, by a dogmatism of faith, asserting the protection of individual rights in ways that seem particularly corrosive to the ideal of a representative democracy.

How did this come about, and is there a distinct geography in which liberties for gun ownership are more fiercely protected and agitated for in place of equal protection for citizens?  Such a demand feeds both into the elevation of “rights” as an extension of the absence of constraints on individuals, and the expression of a politics of true sincerity and purity, based on the protection of the individual both against government oversight in any form, and a conviction that government policies need to be scrutinized for their infringement on a purely individual concept of liberty.  The misconstrual of gun ownership as an individual right within the Bill of Rights and that is not able to be over-run or revised by state or local government is based on an interpretation of the Second Amendment long advocated by the NRA in District of Columbia v. Heller (2008), affirming an individual right to own guns within one’s home and on one’s person–as if it was implicit in the framers’ assertion that “well regulated Militia, being necessary to the [collective] security of a free State, the right of people to keep and bear Arms, shall not be infringed.”   The opinion that this assertion constitutes grounds for the legal protection of individual gun ownership rested on the majority opinion that the thirteen words that began the Second Amendment constituted “prefatory” matter,” rather than qualify the terms of and reasons for the defense of gun ownership, has enshrined a perversely popular interpretation, long sought by the National Rifle Association, protects individual possession of guns, even in the face of a near-epidemic of mass shootings in the United States.

It is not a coincidence that the geography of such claims match with the melding of a dogma of liberty in a fear of the usurpation of rights, and need to protect such rights from below–by bringing politics directly to “the people,” their true source of expression–in ways rooted in faith, rather than a model of inclusive citizenship, and a dogmatism rooted in faith, rather than a body of open debate.  It is in specific geographic corridors that gun culture is not only greater, but a “healthy” relation to guns asserted to exist–despite some significant evidence to the contrary.

In Florida, Gibson’s bill was quickly labeled not only an infringement of (“God”-given) inalienable rights, but labeled as “the stupidest thing I  have ever heard” by the owner of Jacksonville’s St. Nicholas Gun and Sporting Goods Store, who might be worried it would hamper sales more than lead to a black-market in firearms (which would further undercut his business, I suppose).  The serious abuse of the Second Amendment across the country rests in part in how the right to a piece is believed natural.  Indeed, the attempt to align it with populist claims, hostile to pluralism, dissent, or liberal traditions, is not only parasitical on a tradition of representative democracy, but against the dispersion of power in a state based on representational democracy:  based on an intentionally polarizing discourse, the interpretation of democracy on which it turns–the trumpeting of individual rights over those of the collective–may indeed be mapped more clearly than one would imagine by normalizing it as opinion, and merely placing it at one end of a political spectrum.

Recalling the sort of strained logic by which the firearms of abusive spouses are being legally protected after threats to employ them as instruments of attack or violent murder, despite the issuance of restraining orders, civil protection orders and affidavits attesting to substantial  fears of abuse.  “Rights” to bear arms are meanwhile championed as if they were inalienable, and in fact even in need of protection from the “insult” of a requisite two-hour anger management course.  If the intent was to encourage introspection, they’ve been seen as fighting words.  While we can both learn about the bill and track it here, we can see a broader set of trends across the country by creating a Google map served up by Mother Jones that starkly maps the state of our nation, using light brown to designate states in which  gun-related deaths already exceeded traffic-related fatalities, and a dismal darker brown to designate states where the number of gun-related suicides exceed the number deaths caused by automobile accidents:


Car Fatalities v. Deaths by Guns


It’s not a secret that the United States leads the world in gun-ownership, and that a Gallup poll puts the percentage of Americans owning guns at a massive 34%.  Al Jazeera compiled this map, of less clear correlation, between gun-ownership and gun-deaths, which I suppose reveals the results of local densities of firearms:


gun-deaths-gun-ownership-us


Tempting as it is to map this onto a red state/blue state divide and a familiar choropleth map, such an supposition would depend on universal voter registration–which is far from the case.  A more provocative map might use the same statistics to construct a set of maps of the relative deadliness of individual states’ “gun cultures.”  The notion that each state has its own culture of violence is clearly itself a fiction that is perpetuated in large part by pollsters, choroplethic mappers or demographic ingenuity, and oddly erases regional difference or urban specificity–and discards economic variations in favor of a viewable poll that clearly consciously recalls electoral data.  But the variations could tell us a lot about the universality of gun violence in regional terms, beyond a  simple mapping on to zip codes, which predictably intensify in urban areas, like the recent map that was published as an interactive map by the White Plains Journal News in Westchester and Rockland counties, but which created a mini-controversy as an invasion of personal privacy by internet vigilantes who decried tactics of intimidation, rather news–as if someone would chase these poor firearm owners.


la-lohudcom-gun-permit-map-20121226


That site was quickly pulled, of course, though the interactive properties of such a dense map of gun ownership is hardly such a gross invasion of privacy, since the guns are registered in legal databases.  Yet law-abiding gun owners like Keisha Sutton felt that the public map exposed “me, my family, my friends, and others at risk,” presumably from the violent gun-control crowd, and was argued by others to increase underground black-market gun sales:  look at the huge number of on-line responses that the article generated.  It is of course not a problem to post multiple locator maps of your local gun retailers, should you want to purchase one.  (It would be interesting to map these sites’ internet use, of course.)

But let’s return to the question of regional variations that these folks have mapped.  Questions of national variation are considerably complex.  If we start by mapping the most guns owned by percentage of the state’s population,


mostleastgunsbypercentage


to get a little more statistically refined as mappers, distinguishing rates in the ownership of guns and firearms in relation to individual states’ populations:


mostleastgunsbypercentageinbwt-1


We can hypothesize an index of the oxymoron of a local “healthy gun culture health,” that, argues one website, might be a better index of personal or individual safety from guns–and which exists in something like a direct inverse to sites of the greatest levels gun-ownership or numbers of gun in circulation:
Color Map of State Gun Cultures


But if we apply what might be called critical thinking, or just comparison, although the deadly gun culture in Nevada is revealed in the above comparison of the balance between gun-related deaths to traffic-accidents, some of the states with “healthy” gun cultures, to use that tragically oxymoronic term, like Oregon, Colorado, or Utah, turn out to not be the very places where an anger-management course might have been just the thing that would have saved some lives.  (Let’s table for now the related question of why Colorado is plagued by such a high number of gun-related suicides–or the fact that 75% of gun-related deaths are due to suicide in the state–or the impact that announcing restrictions on firearm ownership might create.)  That at least offers convincing cases of where it might actually have been a very good idea to keep guns out of some people’s hands.

The defeat of any of the proposed limitations on the purchase or ownership of guns in this country–either though screening purchases by background checks, checking for mental illness, or for restrictions on on-line gun shows–turns a blind eye to these maps, and to the notion that the prevalence of guns in our schools and culture is not a problem:  and even to believe that one can cast owning firearms as a protection of a liberty.  Not only is the Senate in “the gun lobby’s grip,” as Gabrielle Giffords put it, but country and media seem to have turned a blind eye to their responsibilities to regulate access to guns.  Indeed, the notion that the government could even release any information to map gun-ownership was wholeheartedly rejected by Senators, in response to a request from the Republican senator from Wyoming, penalizing local governments for releasing any public registry of ownership of guns.  Indeed, the rush to get gun licenses and sharp increase in weapon sales  in response to consideration of tighter gun control laws–“not just because President Obama and his administration are hell-bent on introducing some form of worse-than-useless gun control in the aftermath of the terrorist attack in San Bernardino CA,” Breitbart.com put it, but because the government “cannot keep you safe.”  The notion that free access to semiautomatic rifles increased safety is so reflexive after major mass shootings in the United States that the demand for purchasing guns at stores like Walmart–currently the nation’s largest gun retailer–suggests the appeal of gun-ownership as an assertion of responsibility.


Magnificient_Seven-640x480

United Artists

It is considerably scary, and incredible, that while convicted felons are prohibited by law from purchasing rounds of ammunition by law, no identity is required for purchasing gun ammunition.  Although the industry generated a $3 billion revenue that grew 8.9% from 2010-15, the United States government’s Bureau of Alcohol, Tobacco and Firearms sees no easy corelation between the sale of ammunition alone and the growing gun problems that increasingly plague the nation.

In an age of increased data-accumulation, data-selling, and data-compilations, this type of data–the clearest data to prevent the public circulation and availability of firearms and guns–seems off-limits.  Looking at the lay of the land, could this really be safe?


Gun Owners' Map


The image is truly daunting. A recent study from the Chicago Crime Lab suggests that rather than curtailing access to guns or their possession, preventing the public carrying of guns is a more critical deterrence to violence.  The study may have a valid point, but the question of where folks will gain their access to guns–or exposure to a culture of guns–forces us to go back to that question of all those red dots in the map above.  If many gangs may change their gun-carrying behavior in response to police pressure against illegal gun carrying, is the enforcement against carrying guns able to be sustained while respecting civil rights?  A study of illegal gun carrying indicates support for the potential effectiveness of this approach, but the ability to procure guns is at the same time a surer restraint against the ability to carry them.

Along these lines, Senator Mark Leno has introduced several bills in California to confiscate those guns that are illegally owned,  estimated at 40,000, using licensing fees for firearms, as well as of introducing mandatory background checks.  While the legal owners of guns are not necessarily tied to those not in legal possession, the widespread possession and acquisition of firearms in the country increases the risk of their illegal circulation, and to monitor whose hands they can enter.  This is a stab at offering a better mapping of the circulation, commerce, and traffic of firearms, if not to map their personal possession–and to map such possession onto the essentially populist claims of the protection of individual rights of gun ownership.


Leave a comment

Filed under data visualizations, datamaps, firearms in USA, Gun Control, gun-ownership, Gun-Related Deaths and Traffic-Related Deaths, Right to Bear Arms

Intoxicants! (Choose Your Poison)

Indigenous Intoxicants Big

“Indigenous” is a bit of a buzz-word, since now not much is.  Expanding the worthy cult of rediscovering the local but also reminding us of its historical origins, this “Whole Foods”-style map of the wide world of intoxicants is an appreciation of diversity and a true big picture.  In its most recent issue addressing the theme of Intoxication, Lapham’s Quarterly has backed a boggling collage of historical snippets of moments of intoxication past–Casanova’s night on the town; Stephen Crane on opium; Honore de Balzac on the delights of coffee; or the Apple in Eden– with the dimension of space.  The map offers a nicely complementary map to an image of the inhabited world, even if one you won’t see on the walls of elementary school classrooms soon:  is it where there are inhabitants, there are media of intoxication, or that societies grow up around intoxicants?  (Although given teenagers’ habits for self- experimentation, perhaps it should be mandatory to post it in every US high school to encourage global awareness in a provocative DIY way.)

Intoxicants are a measure of sociability, at least.  Beer seems missing from the list, or diminished in the face of Michael Jackson’s claim for the “perfectly reasonable academic theory that civilization began with with beer” in his World Guide to Beer some years ago, a theory that brewer Dave Alexander of Brickseller Brewery summed up that “beer is probably the reason for civilization.”  Archeologist Brian Hayden of Simon Fraser University has both pursued and refined this argument by suggesting that the Neolithic domestication of cereals was largely for domestic brewing, linking beer to the “emergence of complex societies, leading Charles Q. Choi to broadcast that “Beer lubricated civilization,” based on archeological evidence that maps beer to the analysis of human remains found in the Nile delta.  (This is not only an argument in Canada.)

But these theories beg the big picture.  If beer is bread, let’s expand our basket of intoxicants by cocktails that offer grounds for socialization beyond the sixpack in a site-specific map:  rather than a map of where you can go to get intoxicated, the above map takes a wider view, timed for St. Patrick’s Day, by amply recognizing the Mediterranean grape, honey, barley of Mesopotamia, palm wine, beside the grain and hops it calls indigenous to Europe. Broadening our horizons by embracing the prickly poppy, mushroom, peyote, beetroot, embracing the glorious juniper berry as well as the Sonoran desert toad, which join cannabis and coca or the Kola nut, to picture the origins of human sociability in more variegated and broader landscape.  No doubt toads and prickly poppies weren’t as easily domesticated, not to mention Arctic Club Moss, but the big picture provides a nicely bucolic view of varied ecological habitats, as well as providing a new sort of level for what Italians have come to call Agriturismo, just in time for Spring Vacation.  It may give fieldwork a good name, even after Napoleon Chagnon took the dark-green slime dripping from noses of hallucinogen-induced violence among Yanomani as signs of their state of perpetual warfare.

1 Comment

Filed under Beer, Brickseller Brewery, Cannabis, Coffee, Indigeneous Intoxicants, Lapham's Quarterly, Napoleon Chagnon, St. Patrick's Day, Uncategorized, Yanomani