
With frozen glaciers disappearing into the oceans at an unprecedented rate, the rise of an ecotourism of glacier viewing is hardly unexpected. The new heights of glacial melt that are feared for much of the arctic this summer–even if the disappearance of sea-ice predicted by late summer won’t be radically different or worse from previous years–suggest cause for environmental alarm as monumental as the burning of dry forests that spew smoke across the nation. The arctic sublime is, perhaps, more deeply rooted in our imagination, as the fascination of the edges and margins of the arctic as a timeless region and place. The contraction of those margins by melting glaciers suggests that our notion of acclimating to a wandering pole seems more time-stamped, in the mode of current maps, than timeless, a warping as well as a melting of time and space.
The disappearing glaciers map conflicts between two logics–a globalized world of smooth surfaces of the Anthropocene, and image of a timeless arctic wild, whose purity is frozen and lies preserved just beyond our reach. The blurred boundary of the Arctic Sea is a consequence of the blurring of boundaries wrought by globalization: warming temperatures that have been created by escalating emissions of carbon and other greenhouse gasses are creating an age of global melting–and glacial melting–where icebergs are fewer and harder to see, and the sea-ice in the former Arctic Ocean is far less likely to strand ships. The erosion of an edge of the Arctic circle, already nudged north at a rate of just under fifteen meters a year beyond 66.6° N, is mapped in anticipation of arctic melting, a surface of pristine blue bound by a line–despite questions of the margins of thawing permafrost, meltwater flow, ice-thinning or of sea-ice. Drawing a clear line for the Arctic Circle is the vestigial inheritance of print cartography, whose conceptual authority hinders us from mapping the critical margins in which glacial meltwater moves into the northern oceans and warming northern seas.
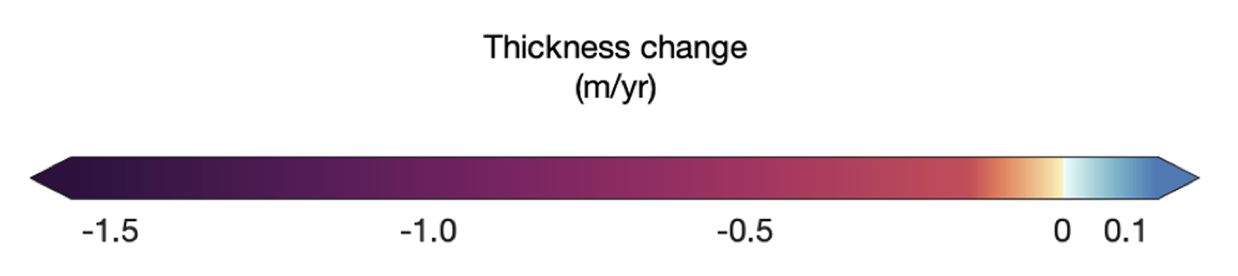
The shrinking mass of the patchwork of glaciers, mapped in part by satellite, reveal rates of disintegration more rapid rates than the ice-sheet of Greenland, in the new millennium, marked by accelerated reduction of mass, of hydrologic consequences that demand local observation. After twenty-five consecutive years of sea-ice los, late season warming created melt conditions for over a third of Greenland’s ice sheet, revealing the new face of global warming of spreading icemelt–as well as surface melt on 36% of the ice-sheet, surface melt at its highest altitudes were fed by surface air temperatures the sixth warmest since 1900. After sustained sense of limited loss of glacial mass in previous decades, among small glaciers over three decades 1961-90, even given the difficulties of accurately mapping time-series for glacier mass before satellite observations, increase loss of ice mass set off alarms. The far lower mass lost by glaciers sharply contrasts to current levels of ice-melt and widespread glacier loss, here alarmingly noted by a cautionary color ramp of orange-red.

Accelerated Global Glacier Mass Loss in the Early Twenty-First Century/Hugonnet, in Nature (2021)
To be sure, the increased interest in preserving a recording of the arctic’s vital signs–the changing soundscape of ice crackling under ships, and glacial waterflow, seek to register the vitality of the glacial landscape to bring the arctic regions to greater prominence, relating to the new scale of anthropogenic disturbance able to be sensed by their own “vital signs”: the Arctic Report Card issued annually by the U.S. National Oceanic and Aeronautic Administration since 2006 offers a rich database virtually accessible of the disturbances of the global arctic,–although the report of 2018 predicted the entrance of the arctic into “uncharted territory” as a lead research scientist of NOAA warned, with an irony firmly based on new data of surface-air temperatures, sea ice decline, wildlife mortality to erosion to ice-melt that had previously long been difficult to access. If we feel the weird weather systems as a local deviation, more than a consequence of arctic melting, they may remind us how rooted our sense of place is in the frozen remoteness of the upper north, whose icepack reflects more than absorbs solar temperatures–as melting stands to end the idea of a frozen timeless purity, as the survival of sea ice more than a few years precipitously declined, even if some fraction of the Arctic Ocean seem to still remain frozen year-round.
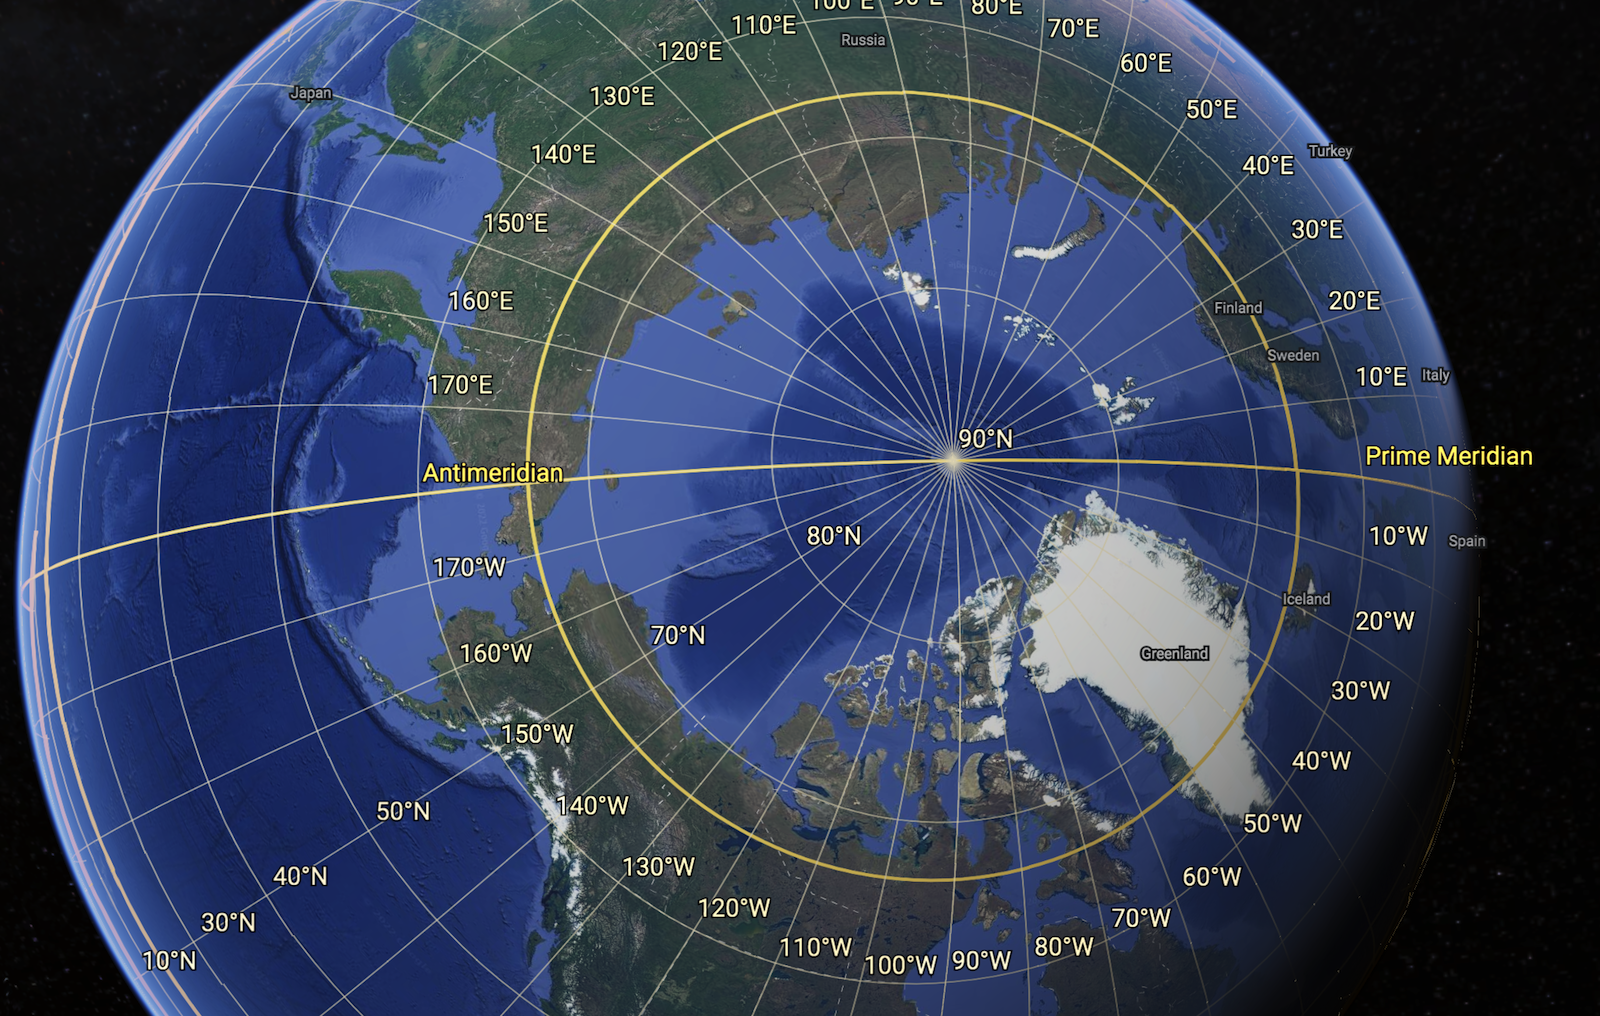
How can we chart these uncharted territories in maps, or can we develop the tools for a conjectural cartography as sufficiently orienting even while we face the prospect of a migration of due north–a change as radically unsteadying for mappers as removing the carpet from beneath our feet? The long-term movement of magnetic North toward Siberian islands is indeed on an uncertain course–

–shifting from Thoreau’s time to the Siberian shores, making us rethink arctic margins, and indeed the stability we were long accustomed to associate with magnetic north, a motion partly tied to melting, and which makes us take stock of glacial health, whose vitality has less to do with warmth.
Conceptual artists as Julian Charrière, whose Swiss origins have perhaps left him particularly sensitive to Alpine landscapes and glaciers, have made it an artistic mission to preserve the fragility of ice fields, sea ice, and underseas sounds of the new Arctic, offering a sense-based record of melting in images able to act as repositories of a new visual relation to a fast-melting world in collaboration with scientific explorers of the reduced levels of sea ice and growing glacial melt.

Julien Charrière, Towards No Earthly Pole, 2019 in Erratic (SFMOMA)
The arctic landscape is also made more alive by the sounds of arctic landscapes, all too easily black-boxed from our world in a denial of climate change. The sounds of glacial calving that are so resonant with the catastrophic consequences of polar glacial collapse offer a sonic register of a collapsing arctic world; the multiplication of YouTube videos of glacial calving seem a yearning to make more concrete the awesome spectacle of glacial collapse. Attempts to extract ice cores from glaciers to preserve the evidence of climactic history before it melts has also inspired attempts to record the interior sounds of glacial vitality in sound recordings of the snapping, crackling, and crevassing as evidence of glacial vitality not from the margins but center of the arctic landscape that remains–somewhat akin to how bioacousticians recorded Humpback Whales circa 1970 to preserve vocalizations as ecological affirmations of balene humanism, revealing sonic expressive sequencing and improvisation never before heard by an innovative “hydrophone” in a nature recording so famous to grow consciousness for a global moratorium on whale hunting.
But if the perception of the aesthetic beauty of whale calls were background music for mindfulness, the melting margins of the Arctic are rarely mapped they demand–or mapped at all, as they are so reduced.

Global warming stands to erase the arctic as an extreme frontier, and to change the flow of sea temperatures in ways that will dramatically accelerate sea-level rise. The archetypal romantic Arctic explorer, Robert Walton, marveled at the “beauty and delight” of desolate frozen fields, even as his blood froze in his veins on the Greenland whaling ship he commandeered to reach the North Pole. , marveled at its “beauty and delight.”
Only as Walton’s whaling ship is trapped by floating ice and cannot move did his arctic reveries conclude; before the ice breaks and frees the ship, he spied Victor Frankenstein, the sled on which he pursued the monster who had perhaps duped Frankenstein to follow him to the North Pole, impervious to temperatures his creator could not survive. The novel inspired by ghost stories may invite us to track the monster from a ship that lay at the edges of sea-ice in the Arctic Ocean–

Walton’s Course and the Edge of Average Arctic Ice Edge from March through August in Nordic Sea/ ACSYS Historical Ice Chart Archive, Boulder CO, Frankenstein Atlas by Jason M Kelly
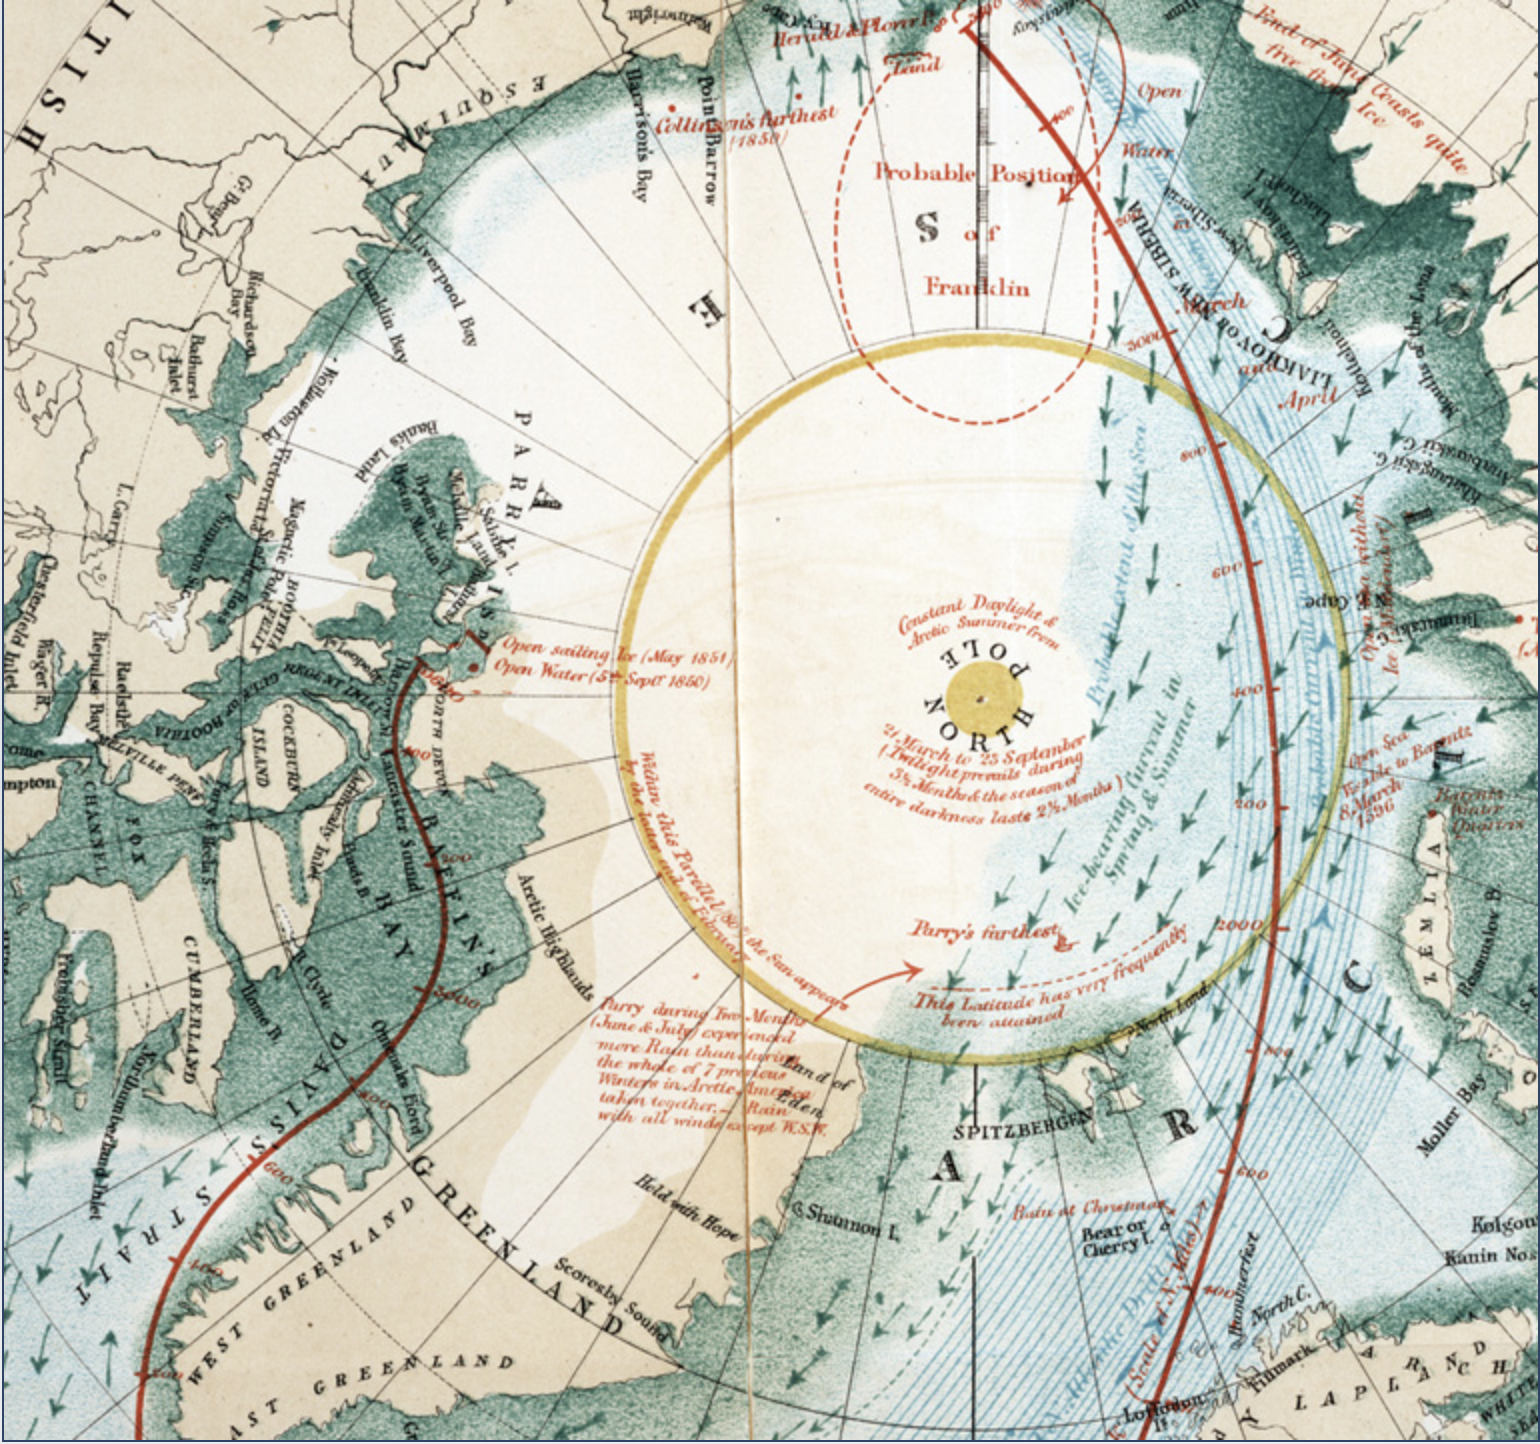
–she was informed by the frustration of numerous polar voyages sponsored by the British Admiralty to the North Pole that were stopped by ice sheets and icebergs beyond the Barents Sea. Mary Shelley seems to have mapped a desolate arctic landscape to conclude Frankenstein’s search for forbidden knowledge, perhaps as she revised the manuscript with grading contributions from Percy in England, and access to the records of the Admiralty. The arctic setting became the fatal conclusion for the “Modern Prometheus,” before the backstory of Frankenstein raising ghosts by alchemical incantations send him to fuse Paracelsianism and natural science that would long haunt histories of science. The very setting of Alpine glaciers where Shelley conceived the story found their conclusion in the arctic, both haunted by accelerated glacier loss. The register of glacial melt is a current register of the Anthropocene, whose own Promethean character is only just beginning to be understood. The northern arctic margins where Frankenstein and Walton crossed paths was still continued to be charted through the mid-nineteenth century, the Polar Sea resistant to staking territorial claims as solid land, the sea-ice unable to be mapped within northern polar seas–

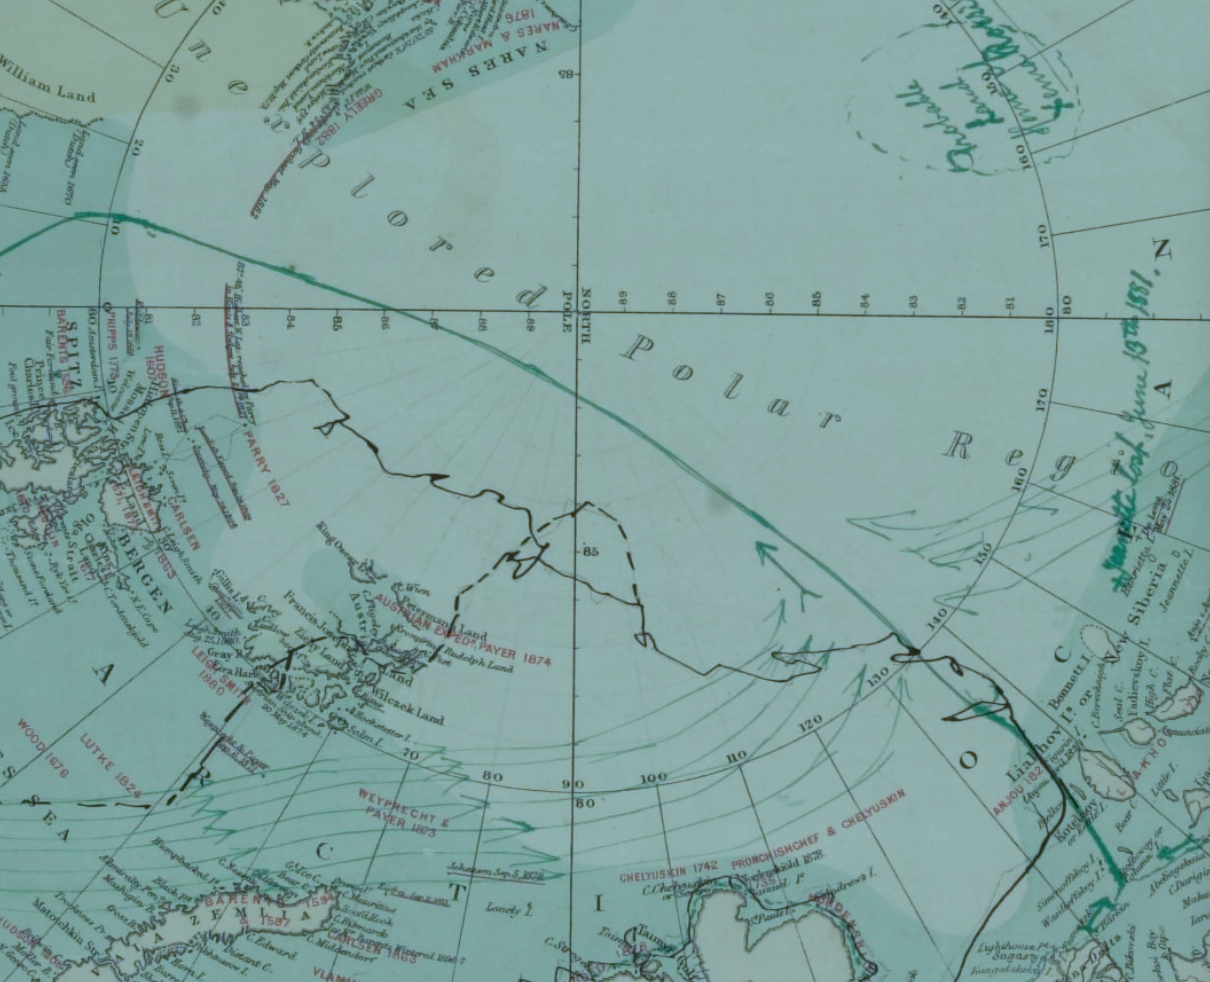
British Admiralty Chart of North Polar Sea (1855, rev 1874) noting Coasts British Explorers Discovered pre-1800 (Dark Blue) and post-1800 (Brown); noting coasts explored by Americans, Germans, Swedes and Austrians 1859-74 in Red Ink
–in ways that we are currently coming to terms with as a mapping of ice-melt and sea-ice melting, in a horror story of its own that has transcended territorial claims.
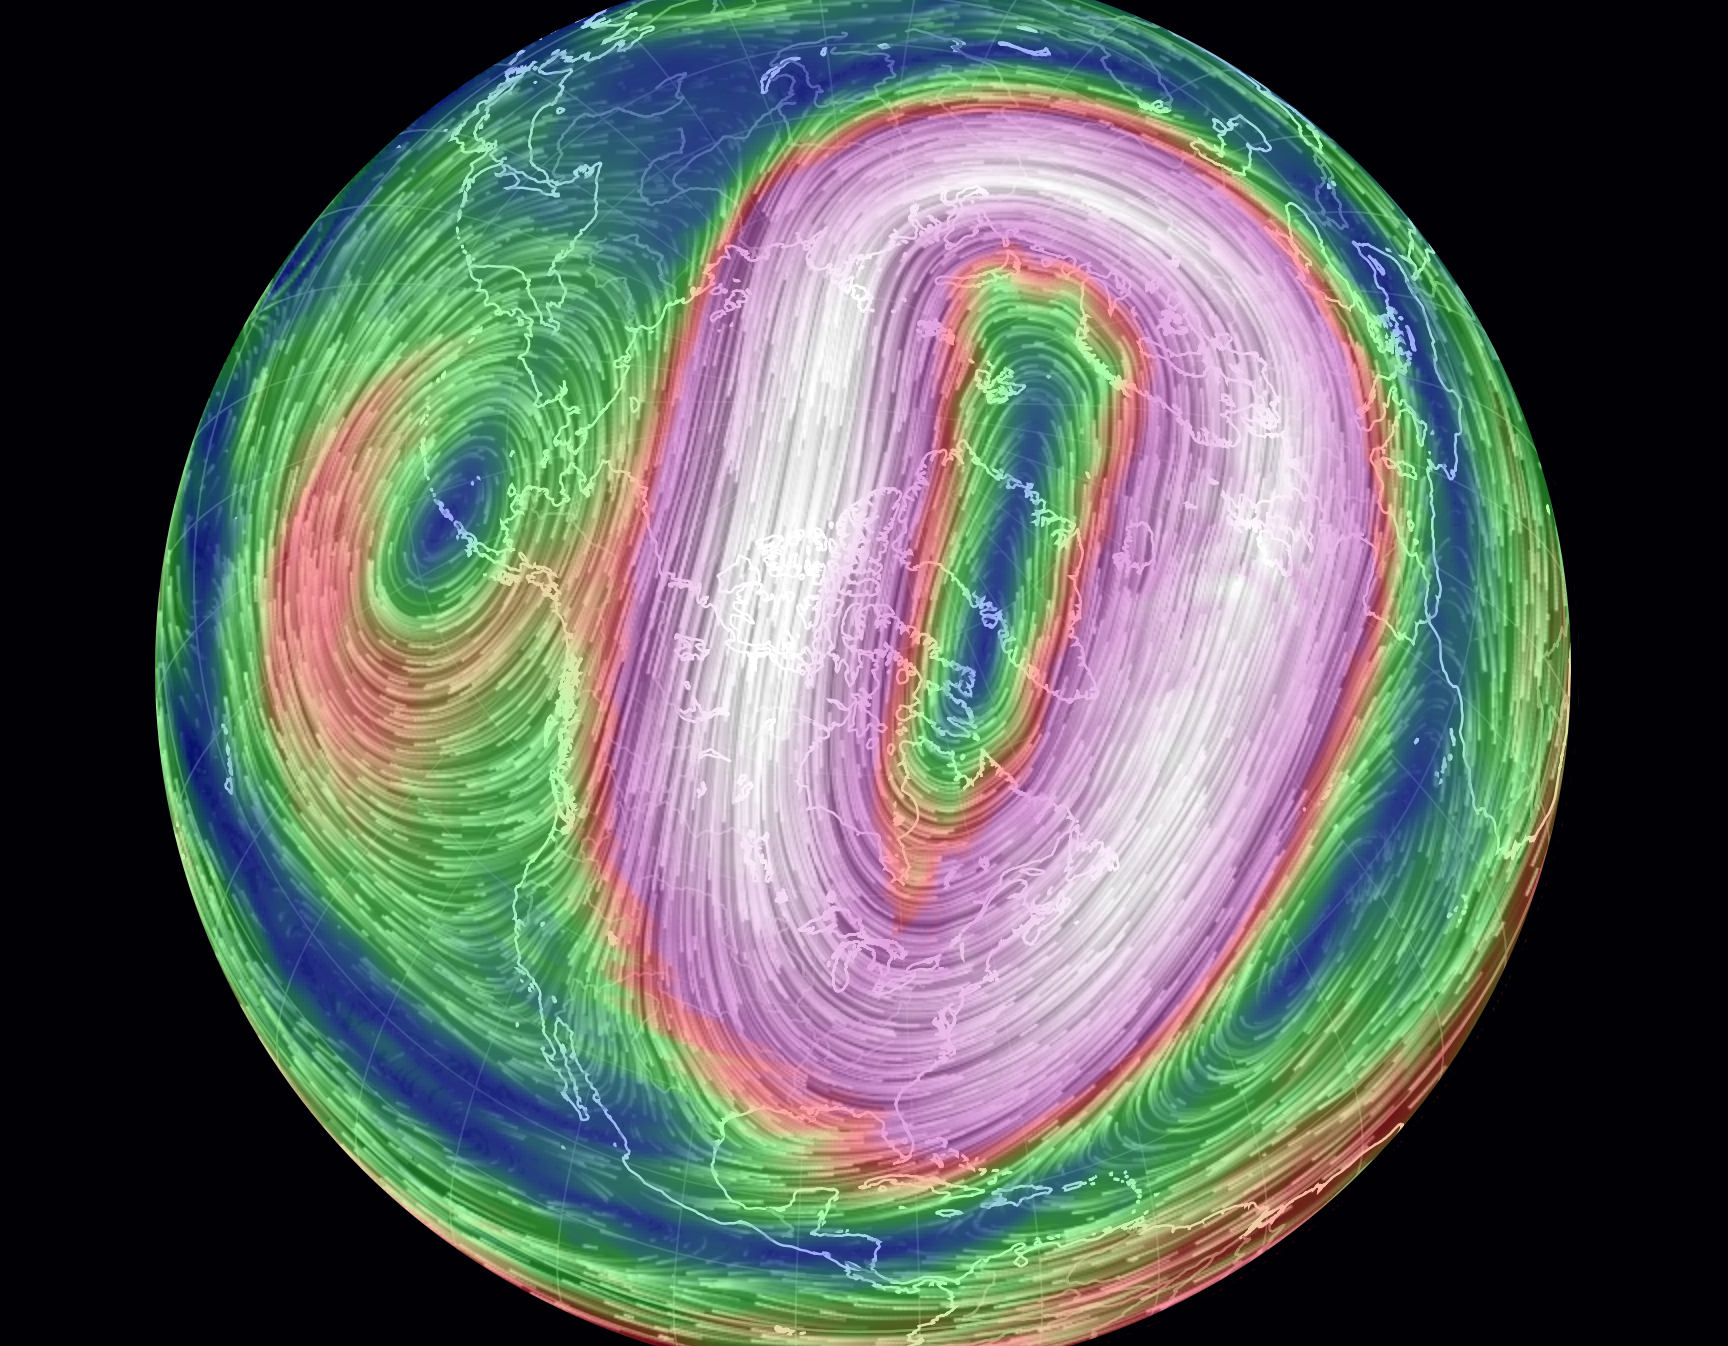
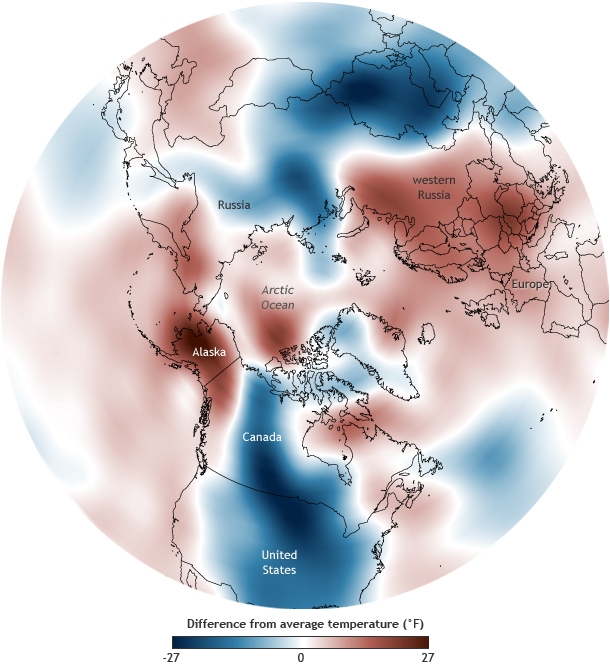
The current landscape of arctic melting frustrates bounding the arctic by a simple line. Rather, we are challenged to map the rates of glacial retreat and the melting of ice sheets, that stand to erode the sense of the Arctic as a fixed frontier, whose margins are remapped as remote sensing provides data of the increasing rates of melting. While icy breezes refreshed Walton’s senses as he passed to the Arctic, if not overwhelming him with the vision of filling long-nurtured hopes of sea-faring at the edges of a geographic extremity, we lack map signs adequate to register fears of polar melting in our warming world. Niko Kommenda’s 2021 visualization in the header to this post of the increased rates at which global glaciers melt bravely tries to sound the alarm. The schematic projection captures the terror of the impending glacial melting, a flattening of the polar surfaces of the globe, where trans-arctic commercial pathways are finally being imagined and plotted, two hundred years after seeking in vain for a northwest passage across Arctic Seas.
By 2016, as the ice had already retreated from the pole, nine hundred passengers had signed up for spots on a luxury cruise liner, the Crystal Serenity, to sail through the sudden access that low sea ice offered to the lost geographic imaginary of the Northwest Passage, a sea route around the top of North America that had become open to commercial ships, and has since become a route of commercial yachting, if it was only first crossed in 1906 if attempted long earlier. While once passing some 36,000 ice-bound islands, some seven routes have opened for ships today, and innumerable routes by yacht, stopping at the site of the unfortunate 18445 Franklin expedition and recent polar catastrophes,

Jason van Bruggen/Boat Iternational
as well as some pretty spectacular vies of calving glaciers, but demand constant navigation of the shifting sea-ice and floating glaciers by yachtsmen, and super yachts able to cross sea ice who often retrace the popular “Amundsen route” first made in 1906, when sea-ice retreat allows navigation.
Entry to the Northwest Passage in 2022/Jason van Bruggen
As we anticipate the ice-free arctic, we will brace for a shifting global axis, potentially upsetting our mapping tools, and a rapid rise in global sea-level, if the melting rate of sea ice proceeds at currently revised rates. As the shifts in global mass distribution due to the melting of glaciers and polar ice-sheet seem to have progressed to throw earth off its axis, we are increasingly disoriented not only by raging fires, or torrential rain, but by ice-melt–the sea ice of the arctic is predicted to melt by the summer of 2030, polar archipelagos melting two decades earlier than once projected, when 2050 was projected as a watershed for an ice-free Arctic Ocean, even in low-emissions scenarios. (Observed sea-ice area in the arctic dramatically plunged 1980-2020, but even in the face of such authoritative models, it is difficult to imagine the disappearing act to conclude.)
Although global mapping companies are beset with worries at the possibilities of a wandering and irregularly migrating or wobbly north pole, as extreme melting has sent the arctic regions and magnetic north into uncharted waters, we rightly worry we are headed not only into an era of submerged landscapes, but unstable relation to old orienting points. The “post-glacier” era not only has started to shift stability of the earth’s axis, on account of the readjustment of mass melting of the polar ice-sheet and global glaciers have already caused in the new millennium, but may well be tilting our bearings and sense of being in the world. The unsteady migration of the North Pole in the new millennium is a deep unsteadying, warping our sense of mapping and being in the world, whose strange behavior has accelerated since the nineteenth century in unsteadying ways, moving from Canada toward Russia in a weird consequence of globalized economies that may be accelerating its motion and force necessary geodetic adjustments to our GPS. If the geodetic maps that Henry David Thoreau devised for Walden Pond were seen by some readers as a comic send-up of the mapping of national waters of the U.S. Coastal Survey, magnetic north offered a framework for transcendentalism for Thoreau to map Walden Pond and the adjacent lake country,–tangible and quantitative even if it diverged from the compass, an accurate frame of reference for surveying and an ethical framework and way of life to liberated from social constraints, a firm foundation to a imagine a more ethical world, firmer than the sailors who vainly sought to arrive at the polar cap.
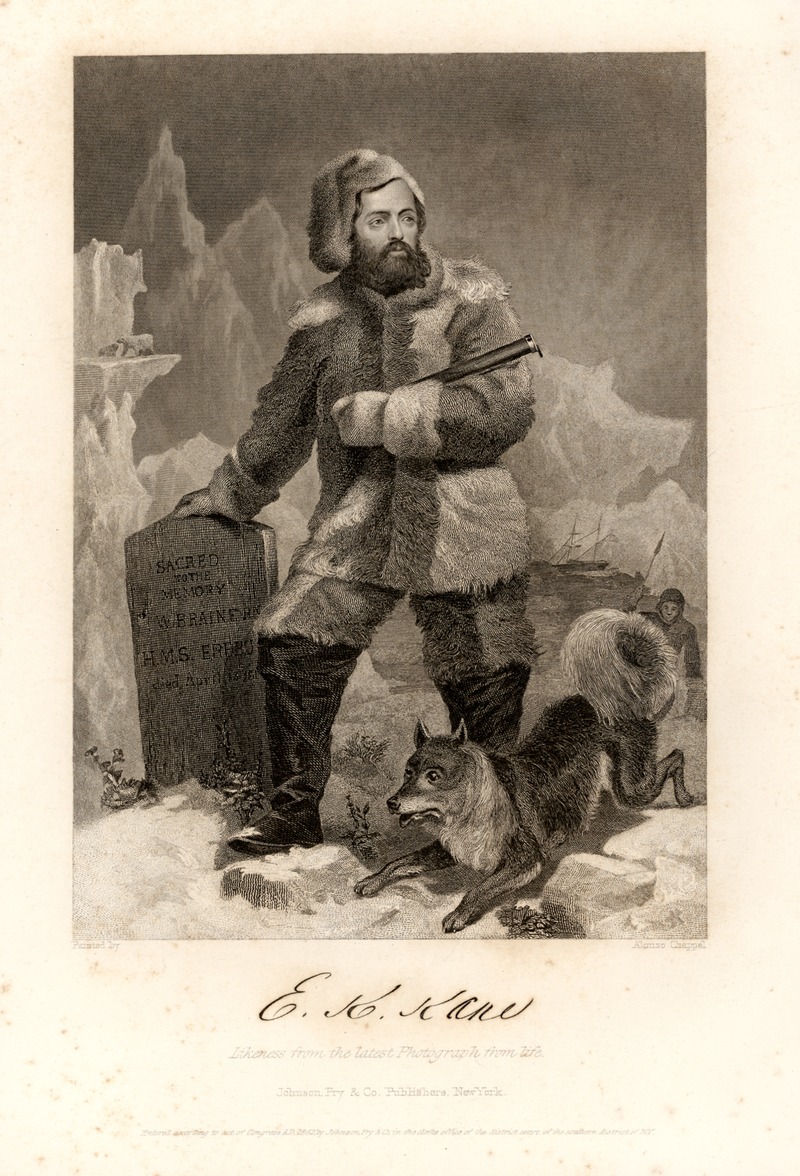
4. The nineteenth-century American explorer Elisha Kent Kane’s accounts of arctic icebergs that had trapped the search vessel on which he was surgeon soon became a media sensation of sorts in the mid-nineteenth century. Indicating the global lines of the arctic that Kane courted vicariously for his audiences in newspaper articles, public speeches, and indeed the watercolors and drawings he displayed on the lecture circuit and Philadelphia’s American Philosophical Society, of which his father served as secretary from 1828-48, seems to have engaged the nation’s attention to the arctic in ways that appear destined to parallel the upcoming attention to the glacial retreat by which the quite sudden melting of long-frozen polar ice merits action in an age of global warming. Despite a growth of climate expertise, we are painfully without guides to the disappearance of glacial markers and glacial melt that has already changed the axis on which the earth spins.
It is disturbing to find a landscape once seen as timeless to be mapped as time-stamped. Can the awe of the arctic landscape still hold awe? Elisha Kent Kane’s audacious account of first-hand contact with the Humboldt Glacier–now the Sermersuaq Glacier–off of Greenland, while now forgotten, was so vivid Henry David Thoreau even felt jealousy, as he doubted polar explorers like Grinell, for all their public celebration, had ever needed to travel to Greenland’s coast. (Henry David Thoreau echoed the deep doubts Ralph Waldo Emerson expressed in “Self-Reliance” about the value of a current fad for travel abroad as a model for personal development, calling the rage for visiting Rome or Greece “a fool’s paradise” that followed from neglect of one’s own backyard, if it promoted a Grand Tour as a formative exercise of bildung: “the soul is no traveller, the wise man stays home;” the rage for travel as amusement only leads only to travel farther away from one’s true self.)
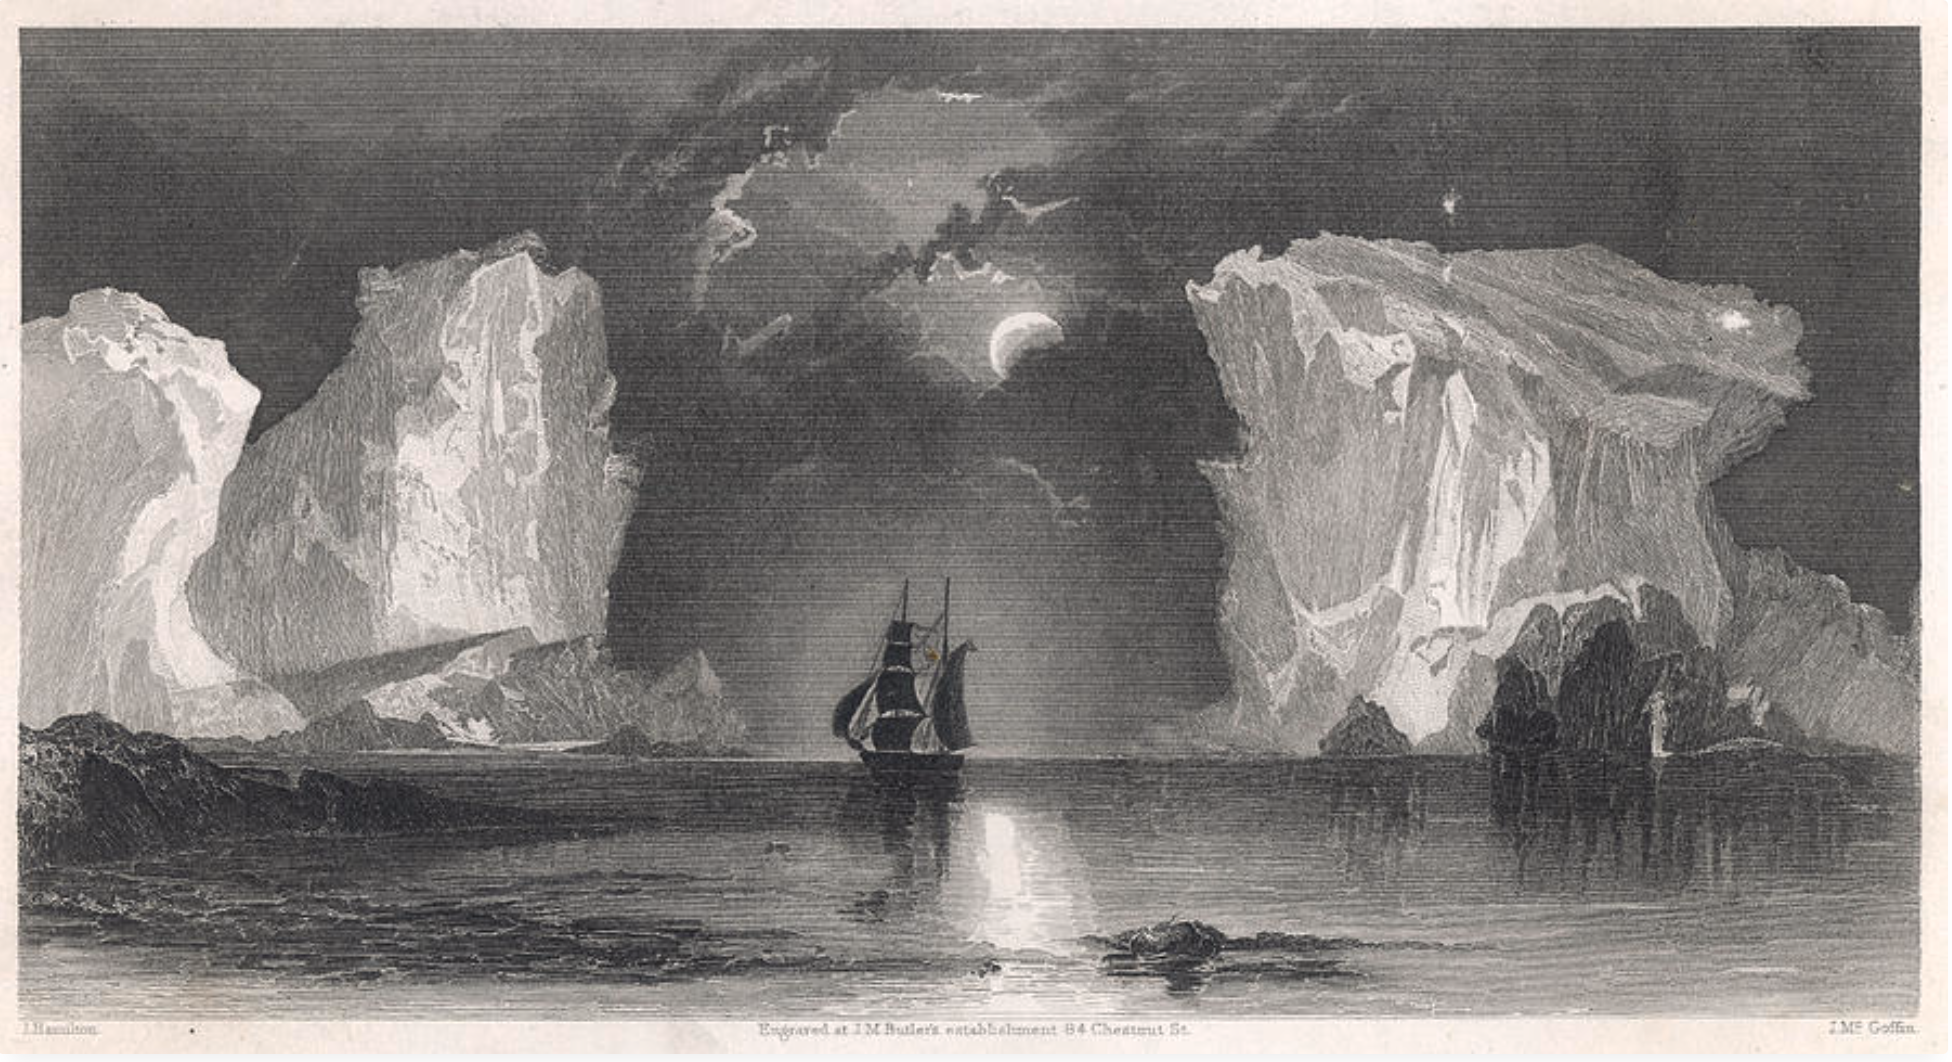
The terrain for potential conflict of motivations had already been mapped: among the personal papers of the doctor served as senior medical officer in a polar expedition, a rather stiff Bones McCoy to Grinnell’s far more suave, searching, and elegantly coiffed Capt. Kirk. But Kane was in the end selected, given his resourcefulness and self-reliance, to head the attempted mission of a polar rescue expedition of the lost explorer, that followed recent maps of the open polar sea. He had probably hoped he might find a northwest passage, before being unexpectedly trapped by sea ice, and forced to abandon ship for a long, rather spectacular trek south, subsisting in the wild on walruses and having dressed in animal skins amidst the frozen landscape of towering icy peak, accompanied only by the canine companion who seemed to have had a clear nose for direction and never flagged in his spirits, even after Kane was forced to leave some companions in the northern wastes, as he searched in vain for Sir John Franklin and any surviving members of the crew of 128, encountering the graves on the sows of Beechey Island (Iluvialut in Inuktitut), three graves that led him to be seen as a naturalist of considerable celebrity, publishing to considerable attention in 1853 an extended account, The U.S. Greinnel Expedition: in Search of Sir John Franklin: A Personal Narrative, a gripping account of arctic travels indulging the “picturesque sublimity” often absent from the natural sciences, including watercolors of Baffin Bay depicting the refraction of arctic light that rival contemporary panorama in uncanny encounters with icebergs, dismal trying weather, and the menace of polar bears that played particular well for the increasingly urban reading audiences.
The U.S. Grinnell Expedition in Search of Sir John Franklin: A Personal Narrative (1853)
If he found only the graves of Franklin and his crew, the encounter with the arctic wilds won him considerable fame as an explorer and scientist, compiling meteorological tables of some length for readers’s perusal. Kent Kane had fronted the wild in the popular personal narrative of 1853 would precede Thoreau’s condensation of twenty-six months spent at Emerson’s property in Walden Pond and were based, as Thoreau’s written classic, on lectures that made good on the many newspaper accounts filed at sea. In his adventure narrative of escaping the arctic extremes, the enterprising surgeon rejected scientific jargon to evoke the terror of arctic landscapes of an uninhabited wild, in ways that Thoreau cast his work against. Kane added his own watercolors to capture the spectacle of fronting of the uncanny ice floes and bergs of unknown arctic wilds that left impoverished any architectural panorama, placing rapt audiences in a harrowing story, of barely avoiding shipwreck on massive icebergs that threatened the vessel in arctic seas as the compass froze. Kane’s romance of confronting the nature of a frozen north, as if the lands were uninhabited, and he was a Robinson Crusoe of the northern hemisphere, a melodrama against dramatically magnified elements, and woodcuts that conjured the danger of the ship listing or almost crashing as he traveled off the map, barely surviving his own parallel voyage to recount the adventure Franklin never got to recount.
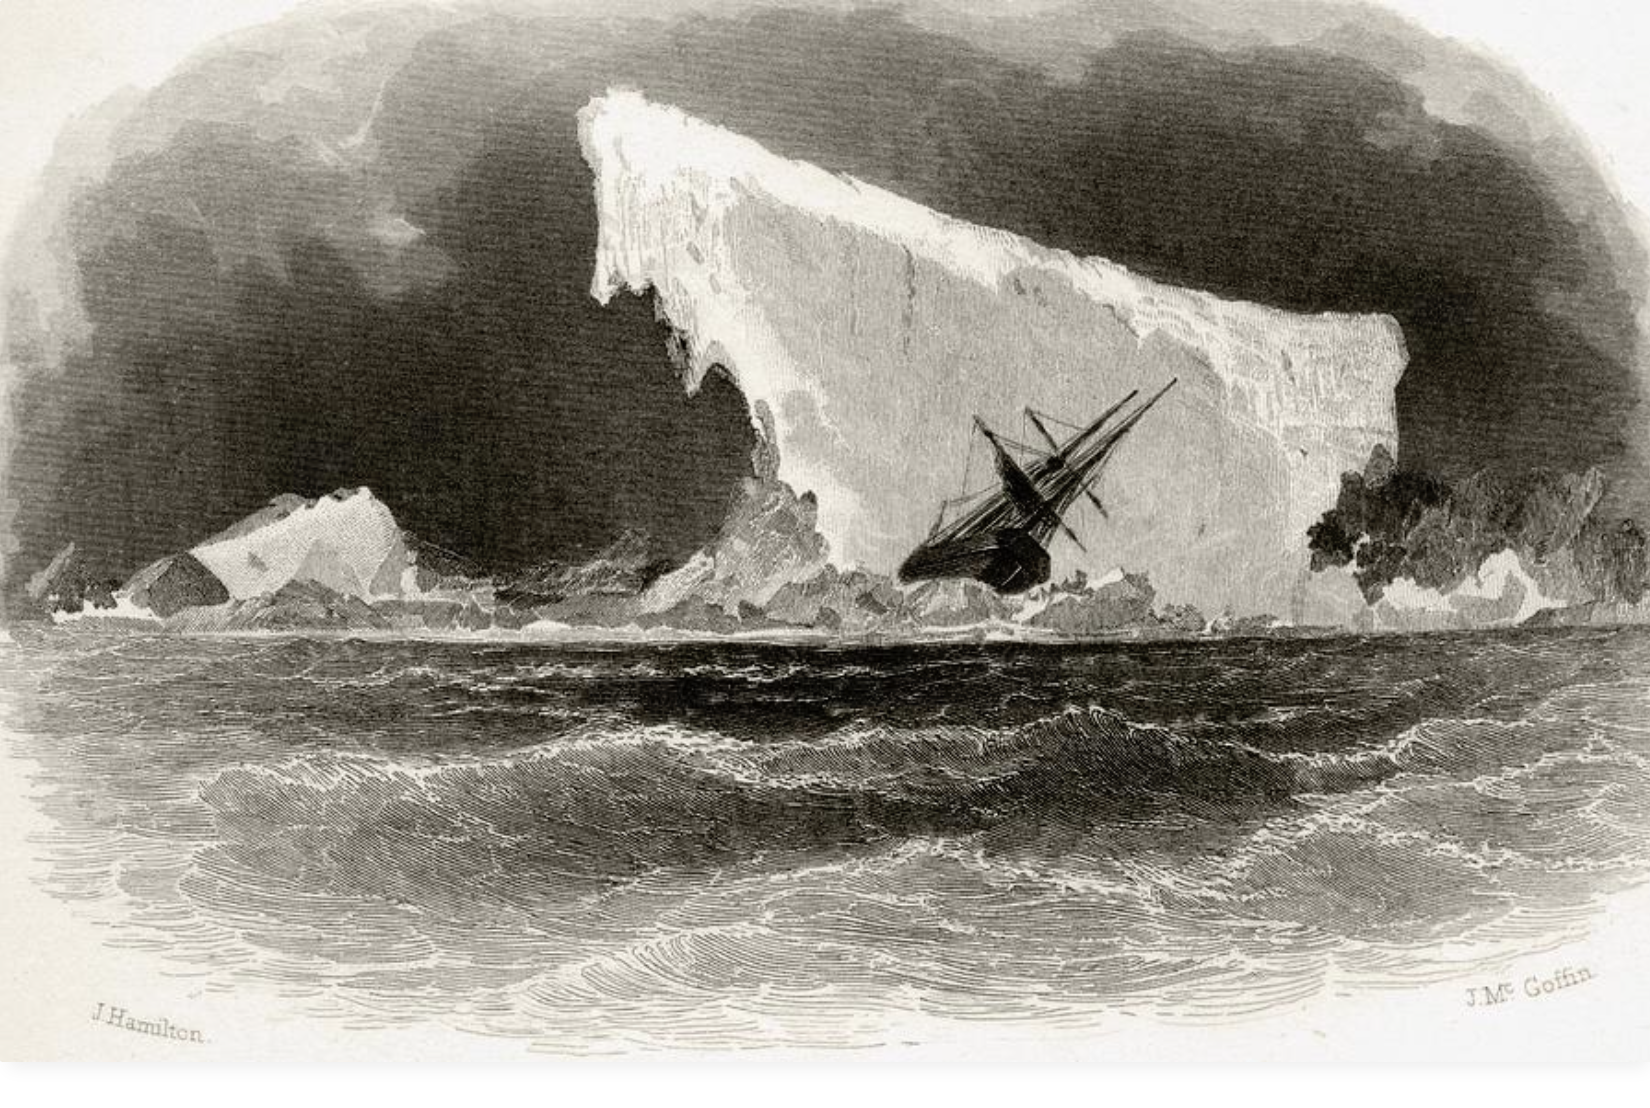
Ship Wrecked on an iceberg, from Elisha Kent Kane, Arctic Explorations in the Years 1853, 1854, 1855
Emerson’s maxim about the vanity of travel is often cited proverbially, perhaps imbued with new tones in an age of globalization, apart from the Sage of Concord proviso about the pleasures of solitude that “Our minds travel when our bodies are forced to stay at home.” The range of remote observation that we are able to access about the arctic this warming summer–and warming summers previous–are cause for alarm, as the number of glaciers have declined rather precipitously in recent decades, as the oceans have warmed, and their melting across the northern hemisphere have contributed and stand to contribute more to the rising of sea-level, as well as exhausting one of the largest storehouses of freshwater in frozen form.
Whether or not the heroes of arctic exploration never fully explored their own back yards with due diligence or not, Thoreau framed a prospective from Walden on the world, as he cultivated his perceptual abilities–refining his own study of the local landscape and its morphological characteristics. To be sure, Thoreau appreciated his own backyard as a source of rich meditation informed by his avid reading of Darwin’s discussion of Patagonia, Rev. William Gilpin’s accounts of the depth of Scottish coasts and Lochs, as well as Kane’s spectacular accounts of his approach of Greenland’s glacier, to view icebergs calving from its coast at first hand. The edge of Walden Pond emerged something of a standard by which he was to judge them all, and for each natural history text (from Lyellian geography to historical bird migrations pioneered by Gilbert Whyte’s Selbourne) to measure Walden Pond against. They offered a basis for Thoreau’s mind to travel, while he was rooted on the banks of Walden Pond, and even to imagine, the actual engineering of Walden Pond and the ponds of Sudbury Plain as excavated by glacial retreat, long before the “Hyperborean” workmen (Irish day laborers) came to export its precious if undervalued ice for a global market.
Kane’s sensational voyages to the arctic had made him an American hero, against whose narrative of an arctic picturesque narrative or so, Thoreau might well have sought to define himself against, but in the past sixty years, Thoreau has remained the model of local observation. Recently, as one tries to process the extent of global warming, remote sensing gives some strength to Thoreau’s point–and Emerson’s–given the possibility of considering the world from one place, without braving the elements to risk being trapped by sea-ice and ice floes of the arctic north in the rather sensational manner of Elish Kent Kane, heroized in his time as a public speaker, American hero, and arctic explorer, before Thoreau began to gain popularity on the lecture circuit in Massachusetts. He was a bit of a competitor, and arrived in Boston with the huge drawings he had made of arctic icebergs that his ship had encountered and seen at first hand as an actual arctic sublime.

Arctic Glacier, Melville Bay from US Grinnell Expedition in Search of Sir John Franklin Grinnell (1853)/ American Philosophical Society Library
Thoreau famously prized Walden Pond as a site of purity from which to apply himself to watching the world, perhaps recuperated in the enthusiasm for viewing glaciers today in an era of ever-decreasing contact with the wild, the uneasiness of watching the retreating remaining glaciers in the warming waters of the northern seas is more than tinged with a sense of melancholy, capturing the sight of the few remaining glaciers and icebergs, and summoning what is let of Thoreau’s deep admiration of the wild. Thoreau would indeed be shocked at a shifting North Pole as a surveyor who, Patrick Chura has shown, prided himself on determining magnetic North by a “true meridian” if modest in many ways: accessing the “true meridian” was a more elevated sense of moral purpose and direction, as he navigated at night-time by the North Star that escaped slaves followed to secure their freedom. Thoreau was proud of his exactitude and precision as a surveyor of farms and of the woodlots around Walden Pond, mapped “so extensively and minutely that I now see it mapepd in my mind’s eye,” he wrote in 1858, to plot his motion across lots’ property lines,–as if the exactness of magnetic north was warranted to navigate the woods accurately.
Thoreau prized the ability to detect the undisturbed wilds of America just outside of Concord, Massachusetts, and in his own back yard, cultivating his perceptions of the wilds of the continent that still survived even in the age of the railroad and outdoor lighting, the timeless glaciers–or seemingly timeless iceberg–offer one of the last sites of the wild, a fast disappearing margin of nature, in a warming world and a world of warming oceans. Now, rather than haunted by icebergs, we are more likely to be threatened by prospects of glacial retreat. In an increasingly warming haunted by polar melting and glacial retreat, twenty-eight trillion tons of global ice melted between 1994 and 2017, raising the prospect of melting of the 70% of the earth’s freshwater stored in permafrost, ice-sheets, glaciers, and ice caps. Remote sensing led NASA to say almost elegiacally, “goodbye, glaciers” in 2012, finding almost 60% of ice loss melting in the northern hemisphere, and much in the Americas, northern Canada having lost 67 billion tons of ice in the previous seven years, southern Alaska 46 billion tons, and Patagonia 23 billion tons. The skills of engineering by which Thoreau, who built his own house in rusticated style, recovering the shingles from an Irish worker as Romans might reuse pieces of ancient buildings, fancied the environmental engineering feats by which glacial retreat had sculpted the ponds he boated, swam, drank, and skated in winter. If Kane had been inspired on his expedition by maps of an ice-free open arctic sea, we have trouble not standing in fear of the prospect.
Augustus Heinrich Peterman, 1852
At the same time as Kane set sail in search of Grinnelle, or 1855, Peterman combined the arctic panorama with intense cartographic scrutiny of the islands and icebergs of the frozen landscape, trying to preserve a navigable open arctic, combining art and cartography to tempt travelers to the prospect of Humboltdian voyages to the many islands and archipelagos of a partly frozen north.

Peterman, Karte des Arktischen Archipel’s der Parry Inseln, 1855
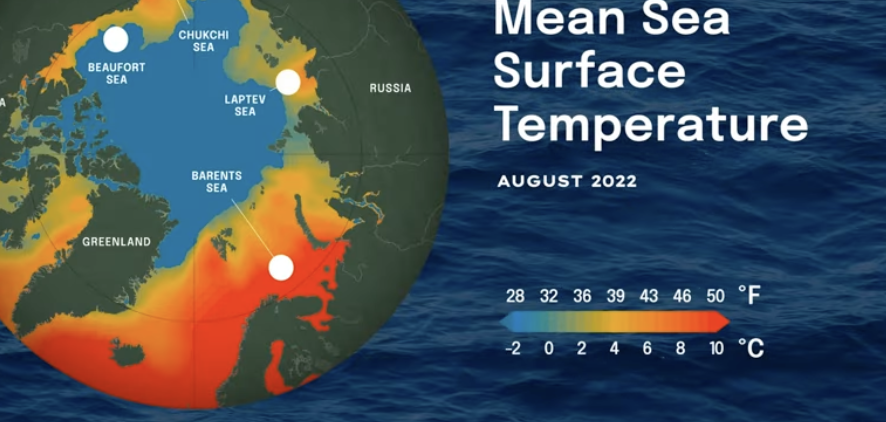
1. The scale of global melting is the negative image of globalization, haunted by a hidden story of dizzyingly increasing global icemelt and global melting. As increasingly warmer waters enter the arctic regions it melts more sea ice, allowing more sunlight to enter the arctic ocean, whose contracting margins trigger a feedback loop as more icemelt reduces the margins of arctic sea ice whose effects we are hardly able to process, let alone to confront.

T. Slater et al, (2021), Copernicus
Indeed, we are haunted by the image of glacial melting far more than we might imagine, and wherever we live. For the mapping of glacial melting–suggested by the data vis heading this post–is best understood as something of a negative map, as well as a map of tragic if not irreversable loss. It is a map that we will not need to travel far to see–per NASA, which has been monitoring glacial loss and ice sheets’ weight since 2002, the prospect of all glaciers and ice sheets melting would provoke sea level-rise over sixty meters or 195 feet. The message of the remote sensing GRACE satellites provided from 2002 to 2017, and GRACE-Follow On satellites after 2018, have yet to hit home, Emerson might say, perhaps as even accurate monitoring is only offering provocation to assess the shrinking margins of the arctic on the ensuing loss of habitat, warming ocean currents, that send ever less cold water to the deep ocean to trigger upwellings of nutrients, and indeed land erosion that rising sea-level can provoke.
Despite its persuasive power, this map remains largely negative, as it tracks ice loss, without the more terrifying consequences of a greater degree of icemelt, with significant consequences downstream. We imagine glaciers as if they had edges, but the margins of ice melt are an image globalization and the only recently conceivable prospect of the margins of arctic melting The arctic must be understood by its margin, not a line, whose changing margins–seasonal margins, margins of melting, and margins of glacial coasts–shown as ‘dripping’ in the header to this post, a projection revealing how much the loss of ice due to global warming has accelerated in the north.

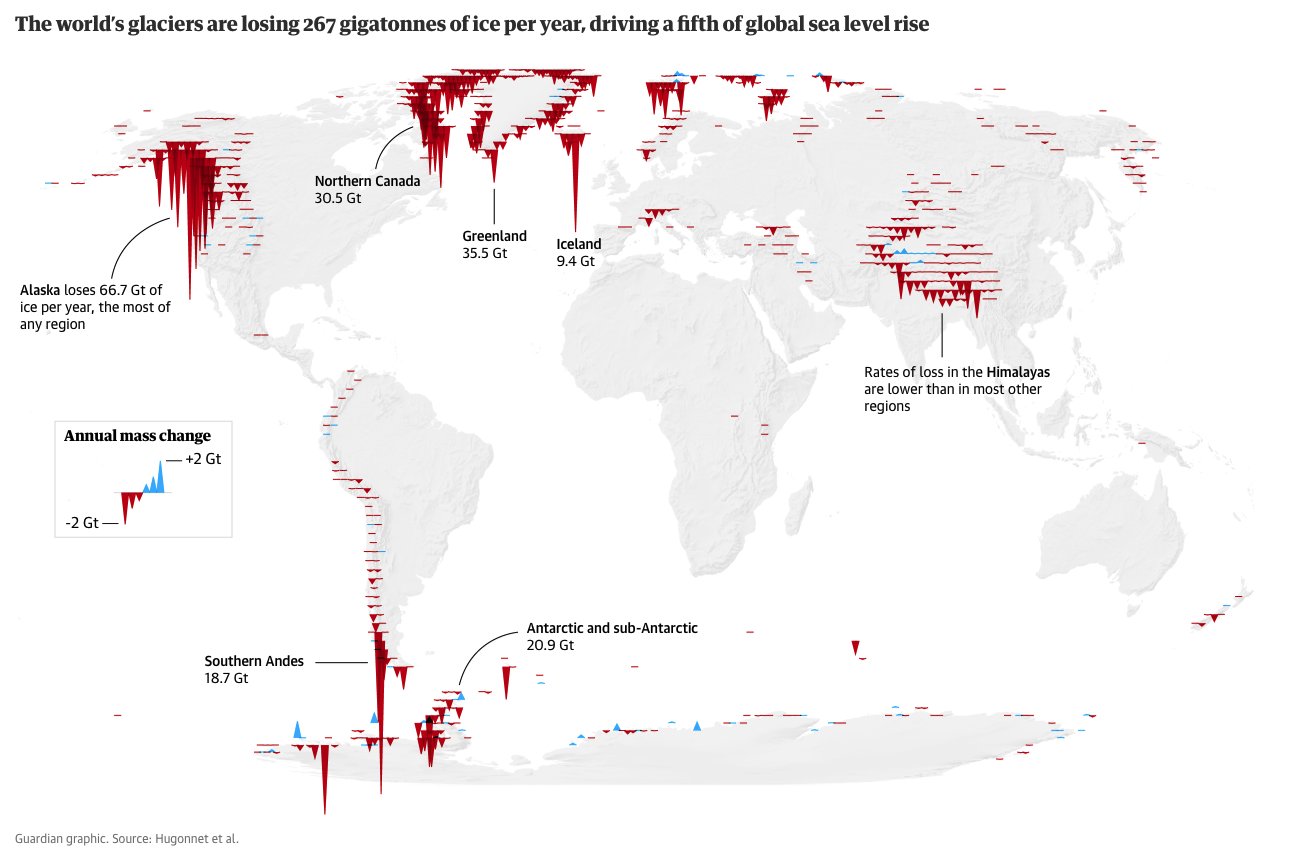
Faced with the burgeoning data of 267 gigatonnes of ice-melt as glaciers and ice caps recede, Niko Kommenda hoped to process remote sensing by statistical data profiles to render the loss of ice at specific as a sequence of spikes at fixed transects. Kommenda long considered possibilities of visualizing glacial melt as a visual projects editor at the Guardian, but the prospect of a recent doubling of rates of ice-melt over the previous two years suggested a need to illustrate the rising rate of flow as a massive shift in the calculus of water flow into global oceans. Recalling the use of spiking red to render rates of mortality of COVID-19 in American cities, if with a downward flow, he mapped a synoptic data vis of global annual change in ice mass. The global continents drip red, in a gripping distribution of the image of ice-loss that almost recall a geo-referenced remix of the classic Sherwin Williams logo, but of a world whose northern hemisphere was dripping with melting ice, as the small rise of several light blue spots suggest rises in ice mass mostly confined to high altitudes.

The map evokes geodetic take on the familiar Sherwin Williams globalism, repurposing the promise to “cover the earth”: in a projection akin to a transverse Mercator project like WGS84, flattens the earth to a single legible surface, haunted by the specter of nearly inevitable sea-level rise.

Henry Sherwin’s logo was, when it appeared after World War I, in 1919, a rebus signifying the victory of American capitalism and enterprise as it expanded to markets to a European theater, across the Atlantic Ocean, in an iconic image of free enterprise that new no national frontiers–

Cover the Earth indeed! The bold totality of Kommenda’s graphic suggests a bold distillation of international mapping tools, a drip drip drip that is almost unstoppable: rising rates of flow from the melting of global glaciers had doubled form the start of the new millennium, sounding an alarm after the first comprehensive studies of ice rivers revealed at high latitudes more meltwater leeched than the ice sheets of Greenland or Antarctica,–putting glacial thinning into prominence as a result of NASA satellite data. Remote sensing may have revealed one of the greatest historical catastrophes of losses of ice in human history, prompted Kommenda to tote up a compelling balance sheet of losses of frozen mass to embody the alarm glaciologist Romain Hugonnet sounded. The work of Kommenda’s mapping continued, as he focussed on the outlines of glaciers and glacial complexes–“The more accurately we can map glacier outlines, the better we can track their melting due to climate change,” Ann Windnagel of the National Snow and Ice Data Center, who has been trying to track the recent reduction of glacial complexes in the Arctic, Iceland, Alaska, Scandinavia, Antarctica, and Central Asia, as well as the Southern Andes, in a global assessment of glacial health–ranking the glaciers’ size and footprints as a long-lasting, enduring flowing mass of ice. To describe the “footprint” of a mobile form may be an unhelpful mixed metaphor, but the inventory of glacial size can map glacial health in relation to glacial fluctuations, ice shelves, ice tongues, ice thickness and ocean temperature, given considerable contribution of glacial melt to sea-level rise–often able to be compared with over 25,000 digitized photographs of glaciers, dating back to the mid-19th century, as a graphic historical reference for glacier extent. By tracking ice bodies and glacial complexes over time, snapshots help appreciate the extent of complexes in different regions.

The awareness of just how much glacial mass had been lost by warming became evident as it set the earth’s axis wobbling off due North in ways that may upset the geodesy on which the global grids we rely in satellite-based mapping rely. The hope to mirror the deep urgency Hugonnet felt to make the remote glaciers more immediate in a multiscalar global water cycle, able to encompass the considerable risks of huge downstream changes in regional hydrology, a fact that Hugonnet appreciates as a long-term resident of the Alps–the fastest melting glaciers offer a microcosm or test case able to contemplate the consequences of a global phenomenon of glacial melting–also known as glacial disintegration, as the over 200,000 global glaciers and glacial complexes have begun quite radically to reduce in their mass and size–releasing a considerable chunk of the world’s freshwater reserves to global oceans.
Although Alpine glaciers are far less thick than their polar counterparts, they risk to by 2050 in current warming scenarios to loose 80-90% of their mass, altering downstream ecosystems by starving them of water, even if not flowing into the open sea. The starving of landscapes from freshwater sources is striking; glacier outlines allow mapping shrinking glacial margins in many regions, including mapping glacier devolution in Alpine areas by a combination of optical imagery and LiDar, as well as old arial photographs, to help to take stock of the loss of about 30% of the volume of forty-eight glaciers in the Austrian Silvretta in Tirol, revealing a rapid recession of glaciers the recent emergency of formerly ice-covered rock face, after gradual glacial retreat, suggesting the loss of a massive repository of frozen freshwater. Zurich’s World Glacier Monitoring Service (WGMS) has already detected a doubling of losses of glacial mass each decade since the 1970s; but the picture of losses at high latitudes and high altitudes needs to be made concrete for those living on near the coasts–despite the North Atlantic anomaly of decelerated mass loss.

Glacial Retreat in Tirol by Digital Elevation Models from 2017 (Black Boundary Lines)
We may lack commensurate memory or metaphors to describe the disastrous consequences of the disappearance of glacial mass, it never having occurred in human history–and any prospect of the growth of glaciers remain quite remote, and if folks continue to feel that “the science is still out on global warming,” the multiple impacts of global thawing will be far more less able to be visualized–or the species that will survive the different possible future scenarios of catastrophic climate change. The scenarios that have been lambasted and demeaned as “theories” but the record-low sea-ice places the survival of glaciers in Antarctica and Greenland that are surrounded by bodies of water at extreme risk of accelerated rates of disintegration that may advance to general collapse by 2050–the record lows of winter sea-ice in Antarctica this June 2023, over a million sq km below the previous record low set just the previous year.

We prefer to view the arctic with awe, and at a move. Or are climactic analogies bound to catch up with us, in inescapable ways?
The current burgeoning riverflow as snowpack melts in California, but may well exemplify the potentially catastrophic effects of raging river water throughout the Central Valley. Increased riverflow from the Sierras have not only rendered rivers dangers, but changed habitat, submerging vegetation and prompting fears of erosion on narrowed riverbanks–and indeed the overwhelming of the drainage systems of the state. The changing calculus of icemelt from the Sierras after a boom year of rainfall and snow said to have ended a multi-year drought will challenge the coastal habitats of the state’s rivers, as well as endangering swimmers: surging rivers stand to submerge older habitats, and suggest the need for more local studies of ecosystems and habitat in the face of increasing glacial ice-melt. The stressors are unknown if unimaginable; icebergs suggested to be linked to awe and abundance and timeless abundance, as much as fragility. Alaskan wild lands, coastal ecosystems in Greenland, the Arctic, Labrador and Newfoundland would be threatened in ways impossible to imagine.

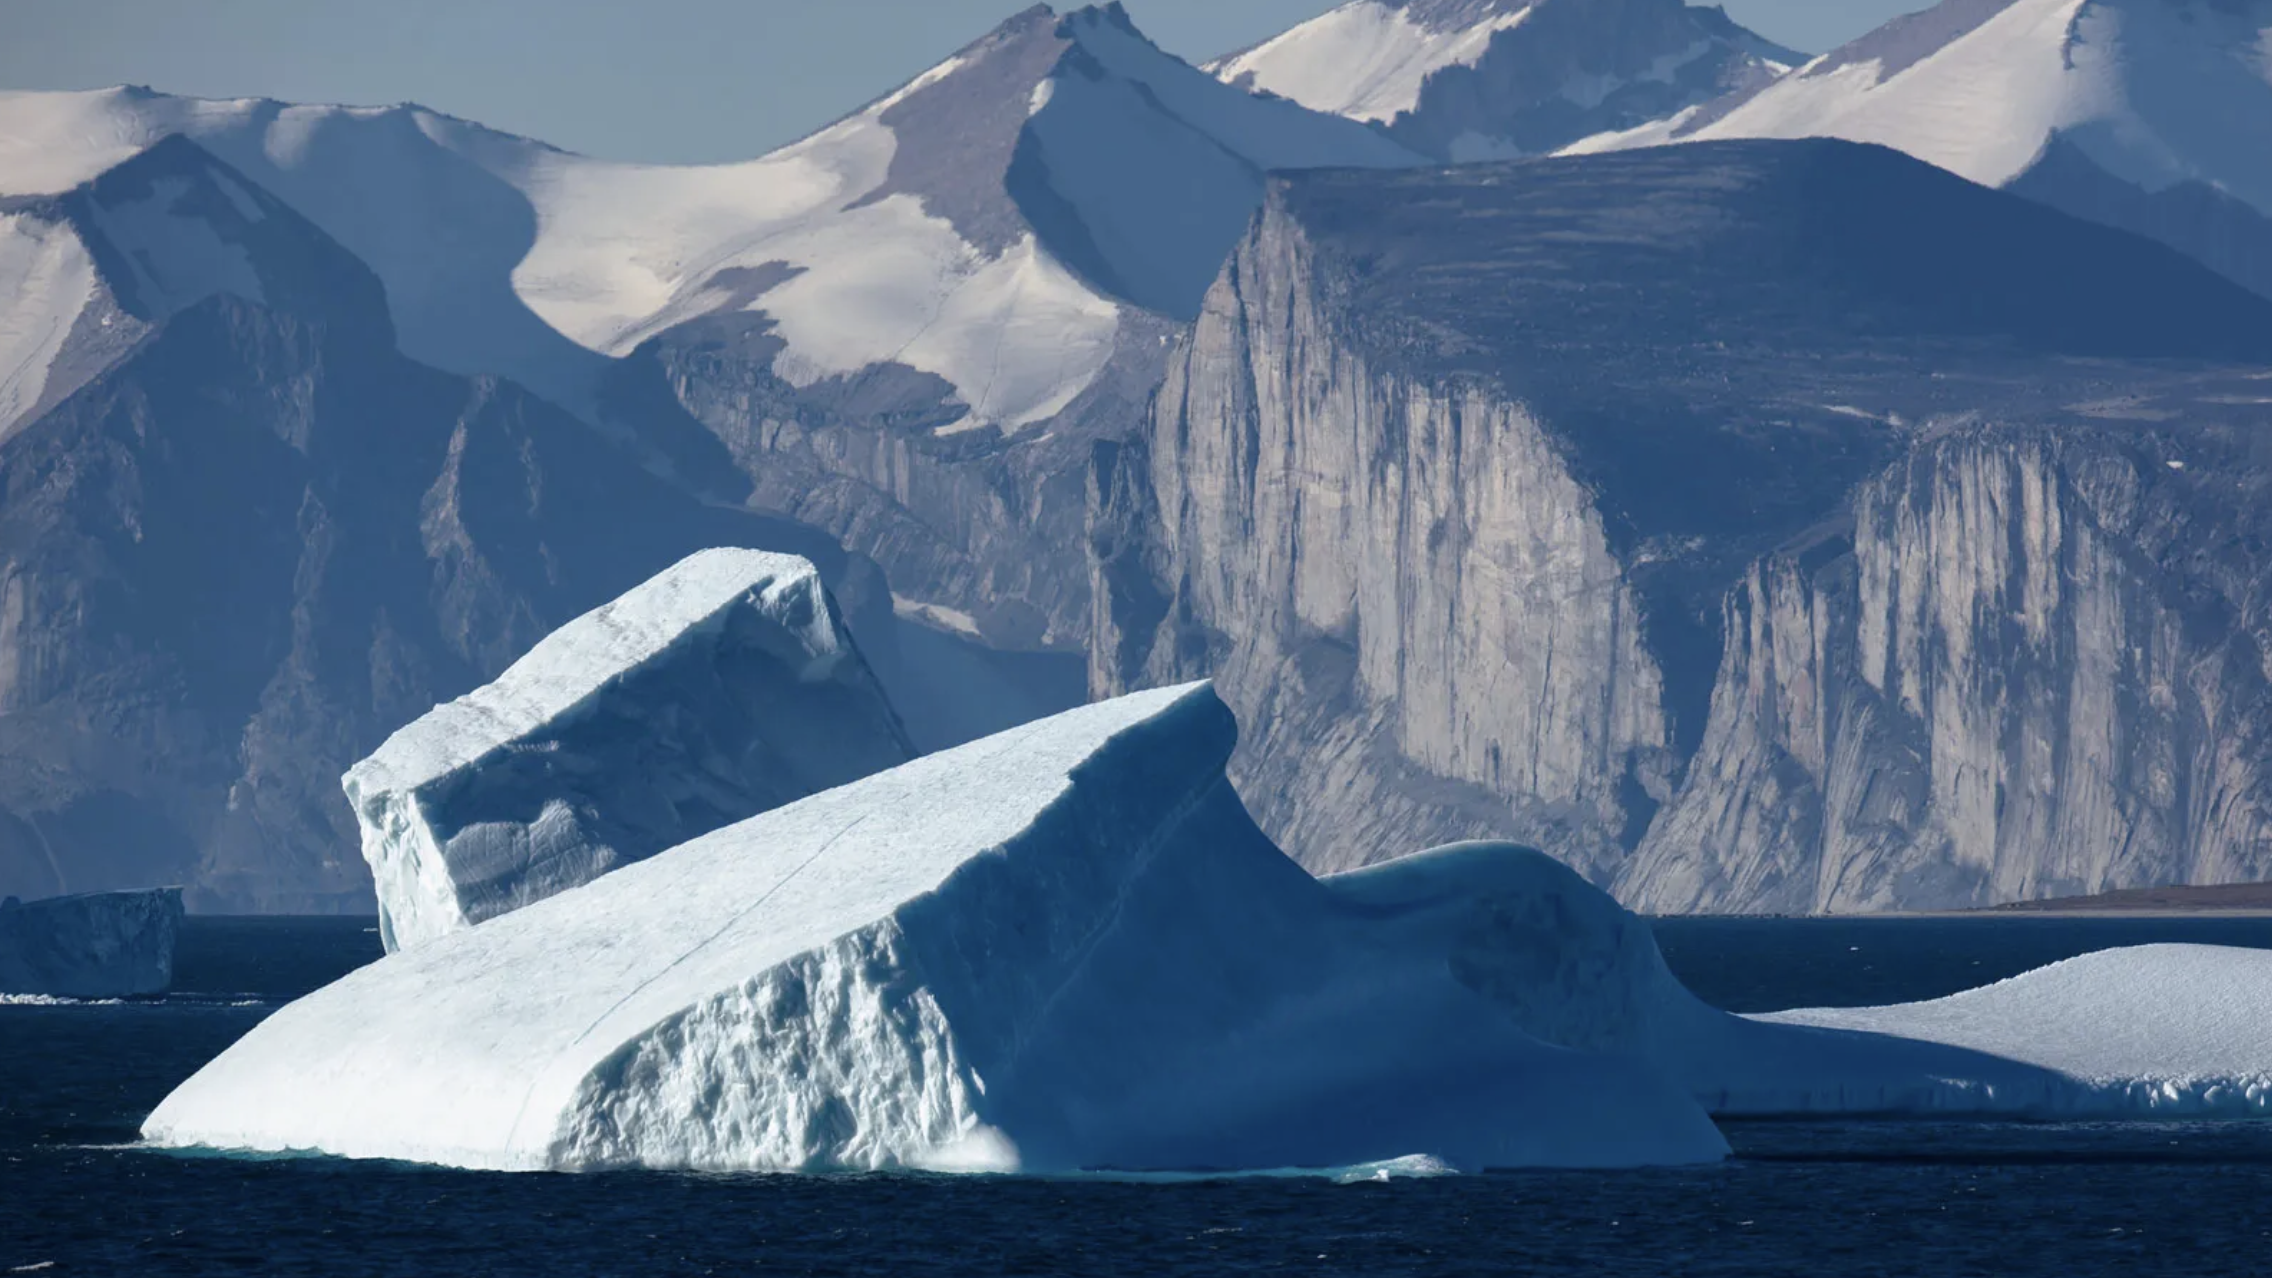
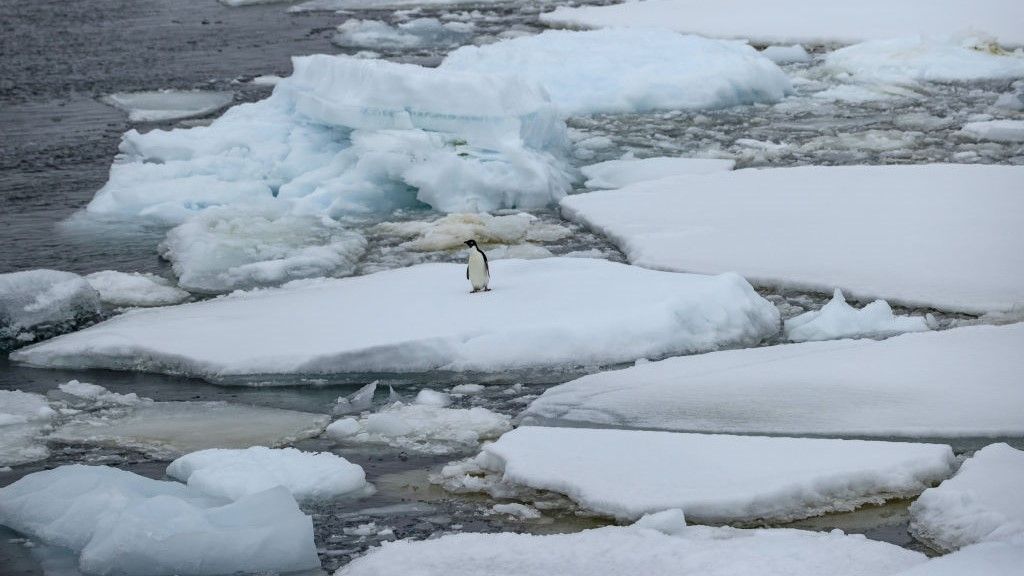
2. The glacial landscape is more acessible to those with the means than ever before, who might well imagine themselves as in a Thoreauvian wild. The expansion of polar melting has created, perhaps paradoxically accelerated, a new sort of ecotourism to search of remaining glaciers of solid blue ice. This seems more of a cross, to be sure, between the expeditions of Kent Kane and for purity channeling Thoreau’s attraction to the wilderness and the wild. Thoreau famously realized the glacial origins of Walden’s kettle morraine and glacial origins of Walden Pond’s purity by a glimpse of appreciation of its deep geological time as he stood by its stony shore. While the memorable image of him seeing himself in the snows of the Winter of 1846-7 preceded his epiphany of the glacial drift across New England, he focussed one spring after the pond froze on the almost animate veins and vessels in the patterns snowmelt created on the sandy banks of Walden Pond, more pronounced beneath the recently built railroad track, as the steep banks revealed “foliaceous heaps” whose interpretation he felt might reveal the secret of life, if not “nature in ‘full blast'” that he had so desired to discover in the wild. As he stood before the sandy banks of the Deep Cut beneath the tracks, as if witnessing ancient treasures uncovered by the construction of subway stops in Rome or Naples, he witnessed secrets of seasonal change and revivification of the vital spirits of Walden Pond in the life of inanimate sand, combining his own passion as a self-styled naturalist and interpreter of global history, in ways akin to the glimpses of calving icebergs, or of the epiphanic blue ice of ice ecotourists witness as they paddle off the northern latitudes in search of ecological grandeur of the wildstill able to be accessed or recouped off Newfoundland’s coast.
Thoreau famously found the most opportune moment for mapping the depth of Walden Pond in the midst of the preceding winter months, in January, 1847 when “snow and ice are thick and solid.” That winter, the arrival of over a hundred Irish laborers excavated ice of Walden for Frederic Tudor, the Boston ice-baron, using saws, ploughs, knives, spades, rakes, and pikes to remove some thousand tons of ice a day–and 10,000 tons in one week–that is often contrasted to Thoreau’s contemplation of the local and the infinite value of the priceless purity of the waters of Walden Pond. Tudor exploited the global circulation of ice packed in sawdust by train and ship that fed a global demand booming in the colonies and plantations for ice future cool drinks and ice cream on a far-flung market, in ways that offers an image of an earlier globalism, based on the growth of markets that failed to grasp the priceless value of Walden’s limpid transparency. But if Tudor and Thoreau are often contrasted, the enterprise by which Emerson was relieved to have the prospect of the “increased value” he might gain from his woodlot in Walden Pond by leasing the rights to harvest its ice to the businessman may well have provided Thoreau with a foil Thoreau detected in how Emerson perceived the “prospect” by which his woodlot by Walden Pond might recoup its cost and gain “increased value” to contrast to the thrift and economy by which he cultivated virtue while living in the woodlot quietly–and indeed fashioning a new sort of exemplary life for himself far from his father’s pencil trade or the commerce of Concord or Harvard’s academic halls.
Few sites of purity remain outside the arctic. But Thoreau discovered a method of sustained local observation of ecosystemic change that the melting of arctic glaciers demand. We risk devaluing how fast-disappearing glaciers feed ecosystems and ocean circulation, at the changed margins of arctic landscapes in an age of ocean warming. Indeed, the extent of expanding icemelt triggers not only feedback loops, but habitat loss, coastal erosion, and changing ocean currents that only local observation can track. If the order of neoliberalism dulled our senses to the disappearance of glacial mass, encouraging an era of denial even as arctic ice thinned, before the melting of 2007 trigered a shift in the thickness of sea ice with less ice remaining in the arctic seas from 2005, undermining the structures of glaciers, we are slowly leaving an era of denial in which maps are able to play an important persuasive role–both to rebut climate denialism and to come to terms with the new margins of the arctic, as arctic borderlands long imagined as permanent are poised to erode: by 2010, Greenland’s coast entered into a thin ice regime definitively, with sea-ice thinning in warming waters over the next decade. By 2019, one of the warmest summers in recorded history, Greenland’s ice sheet was losing some 12.5 billion tons of ice a day in the heat of the summer, in one of the largest events of melting since 2012.

Ice Loss in Greenland, 2013-19
If we have to travel ever further north to experience the timelessness of icebergs–“It’s taken them 10,000 years to get here, but you can discover them in just a click with IcebergFinder.com!”–the latest form of ecotourism seeks to celebrate the contact with a fast-disappearing north, whose “very narrow, very thin margins” have become far more narrow in the face of a warming arctic sea, as the surveyor W.V. Maclean told the pianist Glenn Gould, as we watch the ice floes of Hudson Bay. The stoic surveyor, pulling from his pipe, sought, like a modern Virgil, to summon the scarce abundance of the frozen arctic in ways that maps might ignore, for the CBC documentary Gould produced to show the northern reaches of Canada in a modernistic manner by overlapping audio tracks that commensurate with the “lifelong construction of a state of wonder and serenity” he saw as the role of art. Gathering awe for northern reaches of a nation he saw as generating insufficient awe for many Canadians, Gould clearly channeled his own fascination northward by rail and air, awed by the scarce margins of the northern reaches, the jagged edges of whose the margins of ice, embodied in the pristine barren of ice floes, his documentary reveals as a part of his own conception of art.

Pianist Glen Gould chose as a central subjects of his 1964 CBC Documentary, “The Idea of North,” the cartographer W.V. Maclean, as the surveyor with first-hand expertise of agrarian prospects of northern Canada offered a dry witness to the arctic to invite audiences to the north, far “from the noise of civilization and its discontents,” in an odd use of Freud’s phrase, not as an uncanny, but an the Virgil of unfathomably vast arctic regions entral and on the margins of Canadian identity. The surveyor offered a fitting profundity for the CBC documentary by inviting to reflect on the arctic while hearing a Sibelius symphony, which, despite the thin profit margins, was promoted as a sort of virtue that Canadians had for too long overlooked, daunted by the prospect of extensive rail. despite its thin margins, the arctic was the land of margins, demanding its own poet.
The thinning margins of glaciers and of sea ice are however increasingly hard to convey tranquility. The illusion of the smooth surfaces of global capitalism and markets are perhaps impossible to be reconciled with the jagged edges of arctic ice, or the consequences of the new margins of the arctic, and terrifying realities of the prospect for arctic melting–or global melting, a long neglected component of climate change. If the arctic circle is drifting northward at a rate of 14.5 meters every year, arctic melting accounts for over a third of sea-level rise, and the Antarctic circle shifts south by fifteen meters every year, the warming atmosphere melting long immovable glaciers. Shrinking margins of sea ice have retreated annually, as the Arctic warms four times the rate of the planet, as accelerated Arctic warming in the recent decades–spiking in 1999 and the mid-1980s–suggest that seasonal warming stands to cause massive loss in sea ice that changing arctic margins, and our understandings of the north, challenging earlier simulations and climate modeling.
These are margins that the point-based tools of geospatial technologies are pressed to assess on a local level or “downstream” from the deterioration of the arctic ice-shelf. It is as if we started to loose memories of the past landscape of the north: arctic sea ice has steadily declined since 1979 at the astonishingly rapid rate of 3.5-4.1% per decade. The scarcity of ice in the shifting margins of the north reveals quite different rates of ice melt; warmer waters beside the margins of shores have revealed striking anomalies of ice volume: the levels of sea-ice in May, 2023 were the ninth lowest on record,–considerably below the average of 1979-2022–as the decline of arctic ice elevations, the very age of arctic had precipitously declined by 2016, the “perennial” sea-ice more than two years old now a fraction of what had long been the significant majority of arctic ice.
The consequences felt downstream on local ecosystems, habitat, and coastal health we have yet to map. As impressive as statistical cryosat data on the thickness of ice-sheets across Greenland and arctic regions, we remain fettered by the difficulty of cognitively processing of ice-thickness anomalies, as great as they are, of a pointillistic character–to quote geographer Bill Rankin, whose coining of the term pointillistic cartography may well be steeped in his arctic surveys.

Sea Ice Thickness Anomaly For April 2023, Relative to 1997-2020/CryoSat 2, AWI, v. 2.5I
Only by looking in an iterative, analog fashion at the downstream consequences of habitat and ecological niches can we train our minds to better interpret statistical pixellation of ice-thickness variability, and the consequences of those dark blue pixels that crowd Greenland’s northeastern coast, and much of the Canadian far north on the edges or expanding margins of the once-stable Arctic Circle. Each deep blue dot of a meter and half anomalies in reading the fields of light blue pixels the Interferometric Radar Altimeter notes, where warming waters move north of the arctic circle, driving the rapid rates of ongoing steady shrinking of polar sea ice–and the disappearance of permanent sea ice, to judge by the seasonal retreat of frozen seawater in recent memory from the pole during the past two decades against the 1981-2010 median.
While we isolate this as a northern phenomenon, limited to an “Arctic Sea,” its constitutes nothing less than an undermining of the collective memory of oceans of the flora and fauna who are its residents–perhaps particularly in Alaska and Canada’s north, but also Siberia and Greenland.

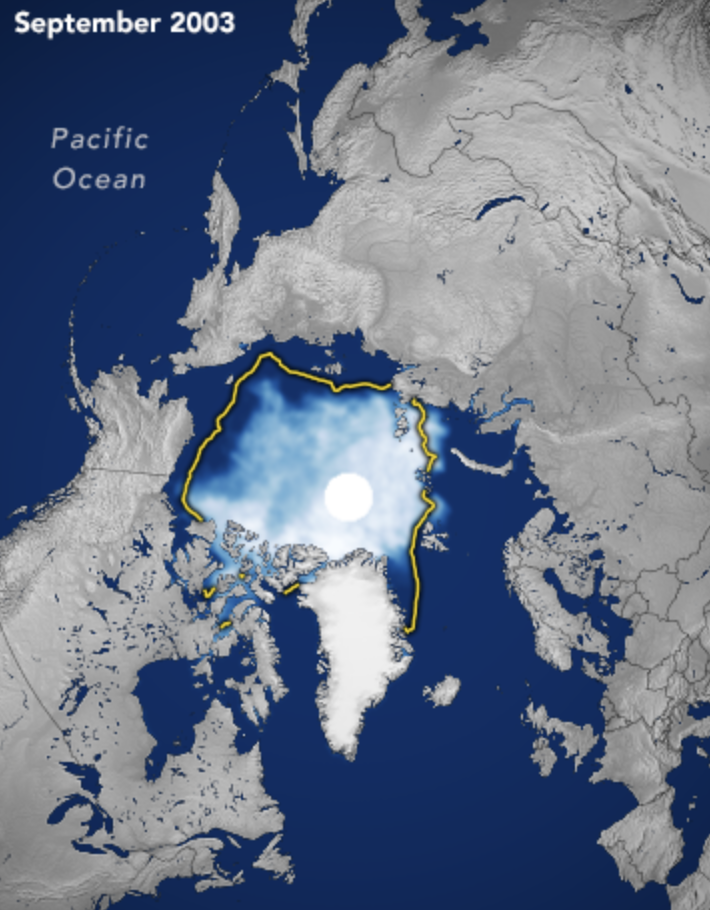

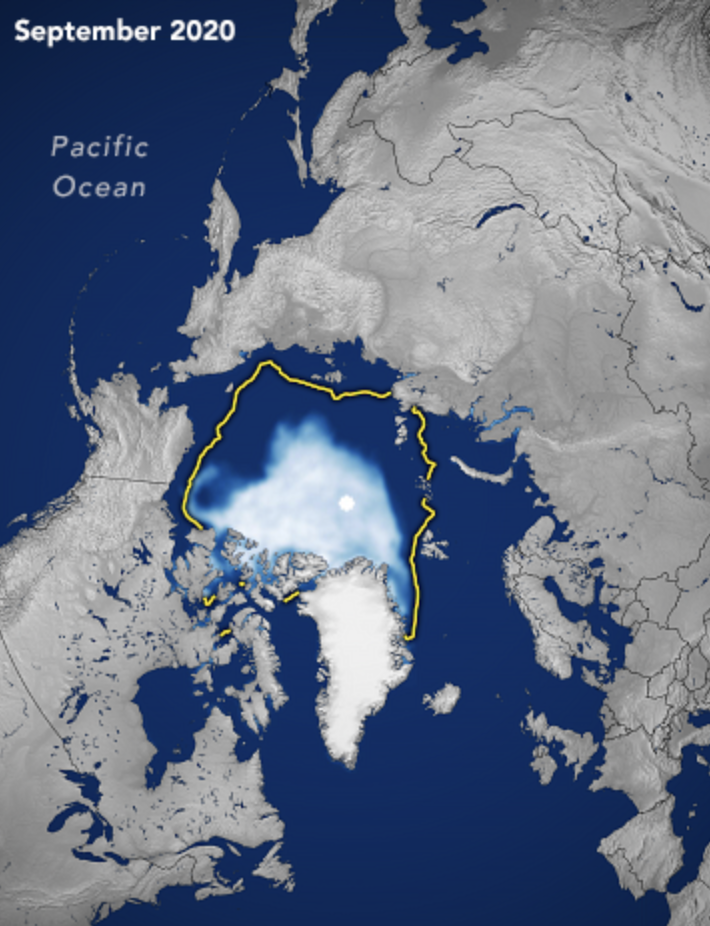
Seasonal Extent of Sea-Ice at North Pole against Median (yellow line), September, 1980-2020/ NASA Earth Observatory
The decline of the age of arctic sea ice is a diminution of arctic memory, and a change in the arctic landscape. It was not anticipated however, in ways that may seem to accelerate the fast-changing nature. Despite longstanding convictions of the immunity of Arctic permafrost to global climate change, as if the coldest areas were somehow immunized or inoculated against thawing.
Yet Google Earth Engine datasets have over the last fourteen years indicated a massive increased in arctic landslides triggered by melted ice in the permafrost during the summer months–“thaw slumps” of long frozen matter able to release potent greenhouse gases as methane emissions in the atmosphere and carbon dioxide in the fastest warming areas of the world of the high Arctic are unable to be stopped–reshaping the arctic landscape in ways that may in time lead to the eventual disintegration of the ice sheet. Glacial melting prompts the growth of coastal landslides created by the collapse of rock glaciers long held together by ice–avalanches and landslides grew in 2014-19 across the warming north, catalyzed or triggered by glacial retreat. In the face of such expansive rewriting of the arctic margins, we risk ignoring the more analog, recursive, local observations of wildlife and habitat that Henry David Thoreau, for one, detected at Walden Pond’s margins, preserving tallies of the dates at which irises, lilies and blueberries bloomed around Walden Pond, allowed Charles Davis and Richard Primack to understand and indeed measure the climate change by howh warming’s shifted the dates of flowering of irises and lilie–giving new sense to Thoreau’s stay at Walden as an experiment,–beyond as one of living in nature or refining his own abilities of sense-perception, but providing an experimental baseline to observe the effects of global warming.
The growing margins of glaciers, including ice tongues form from the flow of ice from many northern glaciers in the northern glaciers of Greenland’s ice sheet and the largest southern glaciers track the migration of long-frozen ice to the arctic sea, increasingly visible in the last twenty years. But can we come to terms with the study of their effects outside of similar analog observations?

Greenland’s Melting Ice Sheet/NASA/GSFC
3. The retreat of glacial ice sheets in Greenland, which is melting in a warming ocean past the point of no return, is already losing 255 gigatons of ice each year, 2003-16, and while its melting is not inevitable, its melting–measurable by elevation loss–would increase as its elevation lowers to an ever warmer atmosphere. And as the coast of Greenland, long a source of iceberg transit, seems to melt, he viewing of icebergs, those last remnants of a frozen Arctic Ocean, are tracked not as sites of self-reliance, are crowd-sourced for tourists, as if testimonies still promising access to a divine,–
-as if to arrive at the Walden-like purity of a blue-tinged spectacle of ice off the shores of Labrador or Newfoundland, while they are still visible, still floating as remants in the warming arctic waters.

IcebergFinder.com/Newfoundland and Labrador
Continue reading


