The iconography by which maps address their viewers might be framed in productive ways within historically situated economies of visual attention with interesting results. For as much as they reflect practices of production, the ways that maps have engaged viewers who struggled with new ways to grasp expanse reveal a dialectic between graphic invention and a larger marketplace images, despite the tendency of those who style themselves historians of cartography to focus on their formal qualities or the mathematics of geographic production. From their insertion at conspicuous places within some of the earliest printed world histories, mapmakers actively courted readers’ attention by crafting increasingly persuasive claims in aesthetically challenging ways, and by raising the stakes of their abilities to process expanse. The promise to crafting a satisfying harmony of comprehensive global coverage has long existed in uneasy balance with their narratives.
The success by which cartography and art communicate globalism might benefit from tracing the ways in which globes have long tried to engage their viewers’ attention. The woodcut of a world map below, designed circa 1490, defined a global purview for readers in ways intended to be cognitively satisfying, promising to orient them to unseen regions by scattered rivers and landmarks, even if they did so by using means that seem antiquated, being both of restricted scope and mediated by inherited ideologies of empire, Christocentric beliefs, and specifically Eurocentric models. But the promise of expanding horizons led this bold two-page map to be prominently placed in a universal history to mark the recession of waters in a post-diluvian world, suspended in the hands of Noah’s three sons–Shem, Japheth, and Ham–serves as a blank slate to inscribe a global history that proceeds to span across generations to the Resurrection of Christ.
If the map of the world is crude by what we think of as modern standards, and possesses no clear spatial indices, the symbolic power of a planisphere of clearly Ptolemaic origins was modern: the engraved schema provides ways of orienting viewers to the lavishly illustrated book’s s expansive content as a comprehensive condensation of collective histories about the world’s regions–making good on the recent authority of such projections along latitude and longitude to reveal an aggregate history charging the growth of worldly and ecclesiastical power over the emergent consciousness of a global expanse, centered roughly on Jerusalem, inscribing a succession of empires over terrestrial space. Indeed, the discoveries of the New Worlds that were mentioned in the 1493 Nuremberg Chronicle (a compilation of universal history of somewhat scholastic origins known as the Liber chronicarum or “Book of Chronicles”) occupy small place in the service of describing the chronology of a succession of imperial ages that culminated in the ascension of the Holy Roman Emperor Maximilian I. The early world map that seems to have derived from a Florentine archetype was used to describe the recession of waters after the Noahic flood in ways whose power existed to set the stage for the rise of Greek and European empires, rather than the discoveries.
If maps no longer convey such a stable sense of narrative progress, and such an engraving would no longer seem a marvel, most maps do considerable work in engaging an economy of visual attention. The world is with fewer open spaces than it was for Noah’s three sons, and global history resists linear narratives, despite the resilience of similarly terrifying apocalyptic notes, at times fed by a rage for biblical prophecy that generated sufficient demand for tracking daily fluctuations of a Rapture Index available for online consultation.
Globalization demands adequate expression by a visual image that can engage its viewers, hopefully by more than the material underside of the interlinked–perhaps a map more fully revealing of the shifting nature of individuals’ relation to the inhabited world. At a time when the earth is crisscrossed with media systems whose signals are relayed along 6,300 tonnes of satellites–and over 8,000 physical objects that orbit its surface and will outlast its inhabitants as a necklace of debris–we lack maps of how we inhabit the world or have remade our relation to it.
Such computer-generated visualizations offer the chance to visualize the satellites that track our changing global positions and information flows, relaying media world-wide over a multiplicity of interconnections: the image reveals what lies outside our visual abilities or comprehension–and which we would be otherwise all too apt to forget otherwise– by using government data to allow us to visualize the multiple layers at which satellites orbit our planet, even if they make it hard to track the wide array of signals that they transmit, intercept or surveil. But they were absent from the multiple covers that served to catch readers’ attention in the global-themed relaunch issue of the New York Times Magazine, a striking photograph of a suspended glowing globe, shot in a studio setting with an exposure that disorientingly overlaps the toponyms of Africa and South America, whose equatorial line seems to cut the globe in an unfamiliar place.
The maps offer an angle to contemplate the stunning long-exposure image of a rotating globe editors of the Magazine recently commissioned from photographer Matthew Pillsbury as a cover illustrating the rapidly changing world for a relaunch issue. The lit globe seeks to communicate both “the idea of chaos in the world, and how this is something we have all learned to deal with,” the design director observed. But the cover of the New York TimesMagazine designed by Pillsbury demands attention both for how it holds the viewer’s interest and renders the globe as its ostensible subject. The photograph is an artistic interpretation, and compelling illustration that reveals multiple relations between art and cartography, as much as it describes the relations between nature and culture or between news media and globalization. But if the image was intended to convey the “speed at which our world is changing” to readers, and presumably represent the news covered in its pages, it gives pause–even as an image that reflects on current quandaries of abilities to sustain the successful illusion of a promise of comprehensive news coverage in an ever-changing world.
1. The almost transient shadow toponymy in the globe as Pillsbury managed to photograph so that the names of Venezuela, Bolivia, and Brazil congregate in a ghostly region off the shore of Africa, and Europe is suitably displaced to its upper regions, suggests the shifting focus of the news, and even questions the familiarity of reading the globe though that most conventional didactic of mapping forms, a globe of the sort one might have encountered in a schoolroom when learning about world geography for the first time: the apparent overlapping of continents and blurring of the northern hemisphere destabilize our surety of global geography in an intriguing way, set, disembodied, above the words “HELLO, WORLD,” ask we re-examine the map we thought we knew.
The five-color globe that appears in the header to this post is, in fact, while a welcome departure from the templates of Google Maps, similarly opaque in the very inscrutability of the very glittering image of earlier attempts to map the earth that it offers. Pillsbury’s long-exposure photograph of a spinning lit globe deserves interest as an advertisement of how the newspaper of record mediates news from a perspective that narrates a version of world news increasingly interlinked and less stable through a strikingly retro medium of mapping as a glowing globe. The photograph addresses how the shifting of what once seemed immovable territorial boundaries circa 1989 have not only been redrawn but shift with an unforeseen fluidity challenging to comprehend. Yet more than inviting us to interrogate relations, or the mobility of global populations and goods, the image almost aesthetically distances the spinning globe from viewer as much as it reveals levels of entanglement of places to one another and intensified contesting of sovereignty. The blurred five-color surface of the spinning globe seems to abstract mapping from human geography. It not only suggests the opacity of its ostensible subject; indeed, it almost asks the observer to throw up their hands in something passing for marvel at the illegibility of a large area of familiar regions, and at the increasing entanglement of current events. It almost revels in being intentionally opaque, however, as if to say that the old indices of orientation just won’t work or clearly be commensurate to the take on current events that it will describe.
2. To be sure, in an age of the proliferation of maps on multiple platforms and hand-held devices, it’s refreshing to rehabilitate the schoolroom globe, and almost ask us about our current world’s distance from it. Oddly, however, Pillsbury’s cover employs an almost antiquated didactic object, a school map, relinquishing interactive mapping tools, to suggest the quick-changing world. By spinning a schoolroom globe at high velocity to craft a visual pun to illustrate global change, the cover raises as many questions as it answers. What seems a conservative cartographical format-if here used somewhat tongue in cheek–as an icon of cartographical authority is almost prosaic. The sheen of the surface takes advantage of the conventional five-color globe of the world to seem to suggest a surface whose very colors and hues are so blurred to render them and all surface toponymy illegible, as much as an image of totality of global relations. As may befit the newspaper of record, the globe is steadfastly traditional in its familiar five-color design: it suggests a space by no means fixed, where boundaries around countries are redrawn and surfaces blurred for all practical purposes, but only tweaks the most standard image of the global coverage to suggest a disorienting sense in which we might lose familiarity in its geographical contours, rather than promise truly comprehensive coverage.
For the globe’s illegibly blurred surface almost erases the considerable varieties of mapping by which we’ve come increasingly to understand and orient ourselves to the world, and almost relinquishes hopes for a new ethics of a world view, but just suggest the inadequacy of imagining the ideas of terrestrial location, proximity and geopolitics as received from earlier school globes.
Is it that the idea of boundaries of knowledge are just not so clearly fixed after all, or that the problem of providing a single authoritative viewpoint is being explicitly acknowledged? What does it seek to illuminate?
More troubling, Pillsbury’s photograph of a glowing globe offers us no place to decipher almost a single word: the effect is almost to see words swimming across its ghostly surface, unlike the transient figures that inhabit urban spaces in his stunning body of photographs of urban spaces. The notion of a commission from the photographer to create an image of global coverage might be misplaced. For Pillsbury has worked primarily in cities like New York, Paris, Venice, or London, using his knowledge of the local to much advantage, as well as Japan, more recently, where he’s taken advantage of a Guggenheim Fellowship to turn his lens toward explorations of Tokyo’s public spaces. His subjects have been less global than relentlessly cosmopolitan in scope. Pillsbury’s recognizable style is more than a sign that the Times seeks to cultivate readers as the hip newspaper of record by the image in this post’s header, as much as suggest an actual global purview of different spaces. The picture is almost a way of conveying just how difficult the job of the news is to convey all that’s fit to print, in a time when the world seems spinning faster than ever before.
3. As an artist who has investigated the relations of crowds to urban space the spaces in New York that he knows well, often working to illuminate the “performance” of identity in interior or cavernous public spaces where individuals and crowds congregate, Pillsbury has cleverly employed extended exposure to blur the boundaries among individuals in urban space and place. The result is to question the relation of the individual to settings that might be otherwise familiar. The extended exposure of the globe is less of a site for staging events or a setting, than a surface just out of contact with the viewer’s eye. Despite the suitability of Pillsbury’s medium to observations of the interaction between individuals and images, or crowds visiting museums, such images are effective as encouraging ongoing visual investigations by expanding time in exposures from a few minutes to an hour that is collapsed into a single image. They indicate the changing “geographic imagination” by which we all inhabit different spaces. The spinning globe is photographed less to offer a record of lived space than an almost fetishized surface as an object, more than inviting viewers to consider the spaces that they inhabit; if the urban spaces can never be stopped or reduced to a purely static form, the globe is always in motion and hard to perceive save by the brightly lit sheen it presents. It recalls a past legibility of space, rather than propose a prospect of continued legibility.
The photograph on the cover of the Times Magazine, despite its candy colors, contains a clear note of melancholy of the absence of hopes for adopting a clear relation to space, even as it radiates contentedness in that realization. The photograph is perhaps best taken as a meta-observation on the success with which maps can continue to command interest in a changing world. The candy-colored globe is an icon of cosmopolitanism, not primarily oriented toward coverage, blurring the notion of one-to-one signification, and almost attesting to its own inadequacy. That is not, however, the most confident self-image for journalism to project. And it hardly helps that we have to wade through about fifty pages of full-color advertisements for high-level commodities and financial services, speckled with small articles, until we find articles about the world in the Times‘ recent “Global Issue” that meet the promise its title posed, but raise some of the issues about which we might want to learn if we could better distinguish its spinning surface after all.
New York Times Magazine
4. The photograph interstingly contrasts to how Pillsbury regularly runs long exposures to pose topics of visual interest that invite us to look at how spaces are inhabited in new ways, raising compelling questions about the construction of space and how we live in it, the globe’s familiar surface offers more of an elusive object of desire and a commodity–and not provide a space that invites us into it, and whose business invites us to sort outs its contradictions. For if the issue doesn’t really invite us to look at the world, so much as the advertisements suggest the globalized economy it serves, the sort of select writing that we have to wade through glossy ads to find is a deserved reward, but hardly a point of entrance.
Another of Pillsbury’s images of a strikingly similar color palette suggests the pronounced permeability of place to humans, and explores a living geography defined by human interaction in ways static maps can rarely either work to successfully register.
But the ghostly presence of the illegible globe almost suggests a world that can’t be grasped, about which we are as mesmerized as challenged to process information. Rather than invite the reader to interpret global space, the image seems a farewell to geography as a matrix of information, rather than the promise of global coverage made by most earlier symbolic maps in newspaper mast-heads or the animated backdrops of nightly news television shows.
New York Times
One senses that there is less interest in the history of an icon of spatial inter-relations, and networks of relationships, than an insider knowledge of how far we have come from the sorts of globes we used to use in school. The photograph seems to gesture, however, to a long history in the twentieth century that takes the globe as a promise of the coverage that the news–or a news channel–could offer, if its iconic role seems to have considerably atrophied as it grew increasingly antiquated in current news graphics, which cultivate far more dynamic modes of visual engagement.
5. The iconic marquis of De Lauer’s News Stand in Oakland, CA, whose range of international papers made it a mecca of the hard-to-find remains a survivor of the on-line. The globe of its marquis dates from the Cuban Missile Crisis, as is perhaps evident in its charmingly corny magnification of the United States. The globe so prominent behind the name “De Lauer’s” in the marquis provides a notable predecessor of the symbolic promise of mediating global information, and the purchase of the authority of the globe as a promise of the delivery of objective information to a shifting readership of news; even if the prominence of the United States on the map belies the fact of the range of international news it continues to sell, the marquis illustrated the inter-connected nature of the world delivered in print daily to the door of an Oakland news stand.
Oakland, CA
The image of the newscaster reading the globe was easily transposed to early television news for some years as an authoritative setting of addressing a public audience of viewers, back when news was of a considerably more univocal enterprise. What now seems too a tired template for breaking news has retreated to a background of increasingly schematic form, no longer the authoritative site of enunciation from a position of expertise it was for Walter Cronkite’s newsroom, even as the studio backdrop map was recently reinstated for current newscasts. The map in front of which Cronkite spoke was something of the objective correlative of the reliability of the individual newscaster, or a sign promising continued confidence in his pronouncements, and was updated in the famous equal area Goode homolosine projection that was adopted for CBS Evening News.
Walter Cronkite (c. 1968)
It’s unclear if this is still the case, even if the network has recently resurrected the same backdrop, it seems to lack comparable authority.
The stability of the globe has atrophied in network news, receding to a backdrop with strikingly less signifying power. The globe has become a glyph of reduced prominence and authority–not only because of compelling graphics, but as its meaningfulness seems increasingly worn and holds less promise or stages a narrative of global coverage not clearly attached to a somewhat overly tired symbol. No longer corresponding to the omnipresence of proliferating online maps in our worlds and on our other screens, the world map seems a superadded surplus, almost an older piece of mental furniture pressed into new service.
The world map is often pressed into service as a supporting graphic rather than an authoritative point of reference:
It’s hard to say how much a static map can pose the pretense of authoritatively describing a terrain that seems so rapidly shifting and whose dynamics of power it could hardly capture. It is difficult to assert the globe’s a promise of comprehensive coverage, or successful a medium to hold the viewer’s attention.
6. To be sure, the continued promise that the globe makes is not truly able to be taken so seriously, as well, given the multiplicity of news sources that we tend to presume, and the difficulty of assuming that one source would credibly count as a fount for universal coverage. Although global coverage remains an icon of authority, the geographical distribution of news items printed in the Boston Globe, MIT’s Center for Civic Media‘s project “Mapping the Globe” demonstrates, by showing the return on the promise of global purview promised in the newspaper’s masthead against its stories–demonstrating a predictably skewed coverage in 2011-15. If reflective of recent global “hot-spots” in Egypt, Syria, Pakistan, and Iraq in that period, the skewed nature of their current coverage directs attention to and mediates a picture of global politics to its readers which one can easily re-imagine as distorting actual its proportions in response to proportions of the paper’s coverage:
While this partly depends on the paper’s distribution, and putting news on the table that will grab attention–and this interactive map will allow viewers to investigate the map at much further depth, below its surface, by hyperlinks to the exact stories about each region that they can scroll through, as if by a toponymical indexing of the newspaper’s coverage of recent events:
It raises questions of the picture of the world that we see refracted in the news stories that the Globe prints, and what it effectively filters out of the mix to provide its coverage of news.
The result, based on a morphing of the world map by data about stories related to countries in the Guardian newspaper, 2010-2012, was remapped accordingly by the energetic and enterprising cartographer Benjamin Hennig, in a cartogram that reveals the distortion of hemispheric privileging of space in the newspaper’s coverage, while maintaining the actual land/water ratio: the result instructively magnifies the mideast, US, and Europe, echoing of distortions of the Mercator globe, while magnifying the AfPak region and Iraq, much of the Middle East, and both Japan and the Koreas:
Even without actually drawing an proportional cartogram of global areas covered in stories that reach print, such as that created by developers of Worldmapper, from Hennig to Danny Dorling, which rescale the size of nations in proportion to how often it is mentioned in online news items, or to create metrics of places corresponding to the size of articles newspapers devote attention to them–and perhaps have retained active bureaus–newspapers hard-wire our brains to a global map or worldview we all too readily internalize. The worldview leads us to expect stories from regions of the world, and to suddenly make space for others–Ukraine; Liberia; Nigeria–aware that they may suddenly may disappear. This might be called the world we bring to the paper, as we first click on its homepage or physically open its pages, as much as the world that the paper covers. But the blurred world of shifting toponymy that Pillsbury preserves is more often one that lies just out of reach.
In terms of the acknowledgement of the blinders by which the world’s news is actually mediated, it’s nice to close with the combined tension of peace and violence created by the coexistence of obliteration of information and an ideal of harmony refigured by far more ironical image created by Maurizio Cattelan and Pier Paolo Ferrari for the same Magazine. Cattelan and Ferrari provocatively painted of a repainting of the globe’s surface that both conveys a suggestion of blissed-out harmony of the island of the lower forty-eight states, and a terror of obliterating all existing toponymy save that in the forty-eight states between the Atlantic and Pacific oceans, save the partly obscured lettering noting both oceans. This masking of a map shows an optimistically if terrifyingly blinkered news, a sense that the world is best in our hands when we’ve obliterated most all that is outside our immediate purview, prepared by what seems a man in a dark blue serge suit, who is calmly and decisively moving a brush studiously to conceal most of the surface of the inhabited world with baby blue paint, in a sort of Brave New World image of preparing What We Want To See as much as ‘All the News that’s Fit to Print’–and wonder if its consequences are so pure–and who is the suitably anonymous man in the blue serge suit who is doing the overpainting, anyways. (It echoes the rendition of a perpetually sunny scenery in Google Maps, though even Google is more forthright in offering geographical coverage. But it would be hard to offer less than shown below.)
Cattelan/Ferrari
The multi-media image of a painted-over globe seems to record the censoring of what we need to know, and what is to be seen–and presents us with the manicured image of what we know best if not a view of the world where censorship is the new norm. In the post-Snowden world, we cannot help but think about NSA’s efforts to infiltrate internet carriers and compromise global telecommunications networks without concern for international law–or treatises with the sovereignty of neighboring countries in the Caribbean: in this globe there is “an equal measure of terror and peace,” although the peace lies in obscuring of the world outside of the United States by blanketing the entire world with coats of light turquoise latex paint.
Cattelan/Ferrari (detail)
Both images provoke us to consider the ways that the image provide commentaries on news as a space for learning around the world, or to orient ourselves to the dynamics by which we describe and are invited to investigate the world.
The mediated nature of news is, of course, not so tacitly commented on by the image of the editorial team that assembled the updated Magazine, young folks huddled around a large-screen Apple monitor of pretty similar ethnic identity and economic background, preparing the image of the world that will be soon ready to be consumed. Has the screen replaced the globe?
The detection of sound provides a primary registers by which we are able to judge spatial relations and experience space. But sensitivity to auditory sensations may be increasingly compromised to orient ourselves across much of the country; the epidemic of the extinction of “quite places” in the modern world has created a deep alienation form sounds of place, even as we can continue to map place, and a dramatic contraction of auditory horizons by which we perceive the world. Increasingly impacted by a barrage of anthropogenic sounds, the alienation that is increasingly common from natural ecosystems of sound, and predominance of sound pollution, has led acoustic ecologist Gordon Hempton to devote increasing energies to making sound recordings of areas of natural sound ecologies of the Northwest in Washington State’s Olympic peninsula. The region, one of the few “deep blue” areas in recent mappings of increasingly elevated sound-polluted areas indelibly shape the acoustic and indeed neurological experience of place across the nation. Registering the increasing presence of anthropogenic noice along thresholds of decibel levels creates an image of the dramatic contraction of sound horizons that Hempton is so interested in preserving. The below map, created by computer algorithms, reveal a distribution that has rightly commanded increasing attention upon its release in no smart because of the recognizable mirror it lifts to our own world of a landscape–here, the soundscape is visibly rendered as a landscape that offers few spaces of blue in which to lose oneself–of the shrinking auditory horizons of most.
After synthesizing about 1.5 million hours of acoustical monitoring, the below representation of noise-levels across the nation’s roadways create a portrait of sounds likely to be heard on an average summer day presents an image of the extent of places where one can expect to encounter aural intrusions. The flyover view illustrates shifting decibel levels across the continuous forty-eight states, but most strikingly reveals the rare places marked by an absence of human-made sound. The almost inevitable infiltration of anthropogenic noises is only poised to grow further in coming years, standing to change our experience of place and how we inhabit the world.
The unprecedented registration of sound-levels mapped across the country and rendered by computer algorithms is a significant achievement, but a benchmark of human geography. The shifting hues of blues used to map the registration of sounds at above-average decibel levels reveal a significant diffusion of high levels of background sound across the nation–and suggests the radical changes our national soundscape has experienced in recent decades. For background noises have become an almost inescapable aspect of daily life. While registration of auditory differences in ambient sound across space have rarely been able to be charted with such precision, the resulting map shows a national both distinguished by far higher sound-levels than the past, and a diffusion of human-made sounds spreading from megacities to the rural hinterland, leaving diminishing differences between the two: the near-absence of lands removed from human-made sound across much of the land suggests a radical remaking of our auditory world, as loudness is no longer clearly localized. Rather than reflecting clear boundaries, the almost inescapable nature of noise-levels across much of the Eastern seaboard, midwest, and west coast lights expanses by a dim sulphuric glow, confining “wilderness”–if by that we mean by that a space where we can listen to hawks cry, hear water running in streams, rustling grasses, the conversation of rainwater with leaves, or insects’ buzz–to a small regions of deep blue that roughly match the largest national parks. Who’s to say that this is not a shift as significant as climate change?
The rising levels of human-generated background noise across the country may constitute a health risk, given established links between sound-levels and blood pressure; the near-ubiquity auditory interference also suggests a significant compromising of our sensitivities to the particularities of place that seems both particularly troubling and of historical note as a change in our lived environment and auditory atmosphere.
While reflecting human density, the map is not only a reflection of population centers–although it does map onto them–but of ambient noise. And it is even more revealing not of where noise is concentrated, than on where it is absent–those deep blue openings on the map.
The rapid expansion of anthropogenic noise has profoundly altered the national soundscape, and indeed made the protected aural environments that suggest the limited success of the management of sound a generation after the 1972 Noise Control Act set a standards of local and regional acoustical management. The acoustic data was processed by computerized algorithms to exclude local street traffic as well as variable air sounds of jets that predicts spatial differentials in the levels of unavoidable local background sound even without such outside intrusions. Human-made noise has not only outstripped population growth; the growth in rising ambient sounds has surpassed three decibel levels is perceptible in almost two thirds of the protected regions and National Parks–roughly mirroring that region of greater natural sounds, not accounting for sounds likely to be soon unleashed by the expansion of hydraulic fracking, pipeline construction, drones, and the expanding density of air travel.
The portrait of our decreasingly differentiated auditory environments raises the stakes for preserving secluded spaces that will undoubtedly compromise our own future sense of space. To be sure, the notion of a comprehensive acoustical monitoring of the entire continuous United States is not possible, and would require far more funds than the National Parks Services has at its disposal. But the picture that emerged of a shrinking space of silence–and a shrinking space of focussing on “natural” sounds, not generated by humans, is striking. Even as we receive increasing recommendations from ecotherapists urging us to act to remedy widespread affliction by nature deficit disorder by immersing ourselves in greater sensory engagement, and ecopsychologists note the health benefits of hearing leaves rustling or wind through trees, the map paints a picture of a future of radically reduced horizons for auditory engagement with unavoidable nature of anthropogenic noise. The illumination of up to half of the nation, if not two-thirds of its inhabited areas, by striking bursts of yellow suggest an encroaching inescapability of noise that may compromise our sense of space: with refuges to experience soundscapes under thirty decibels of loudness increasingly rare, ecotherapists may be conducting some seriously long distance guided trips. One’s eyes are drawn to those deep blue spaces of repose in select areas of the inner recesses of national parks, but one is simultaneously struck by their distance from the environment where one lives.
The imagined soundscape without the presence of humans–or filtering all anthropogenic sound–would reveal a national soundscape pronouncedly divided into relatively noisier eastern and significantly more silent western halves, reflecting the greater inhabitation of the half of the country east of the deserts: this seems almost an auditory Continental Divide. When Kurt Fristrup and Daniel Mennitt of Colorado State University of Fort Collins sought to map a landscape of differentials in “natural” sound across the country, they used it as a sort of base-map on which future data levels could be read: indeed, one can distinguish the deep green swirls of sounds of the Mississippi, silences of mountain ranges, and noisy coasts–but an expansive stretches of silence across most of the region west of the Continental Divide.
National Park Services Natural Sounds and Night Skies
One can usefully compare it to the contacting regions of the forested United States, based on this 2012 remotely sensed map of the woody biomass of the continuous United States, released by NASA’s Earth Observatory and created by computer modeling, that reveals the growing expanse of those regions permeable to extensive infiltration by sound.
One might compare it to horticulturalist and dendrologist C. S. Sargent’s 1884 comprehensive mapping of the density of US Forests, now digitized by David Rumsey, which presented the first detailed survey of the sort, to note the decline in tree-cover across the Great Plains and Mississippi, as well as the Great Lakes:
Wired; from Rumsey Collections
The map of “natural” sounds reveals the levels of under 40 decibels marks a threshold in the intrusion of an array of anthropogenic sounds, one that reflects the changes of how we now inhabit the continent, and how we perceive the inhabitation of space, that might be compared to Global Warming in its cascading effects of how sound spreads across its sonic space.
And in creating a synthesis of sound-levels across the nation, Frist has not only set something of a high watermark in the sound-drenched nature of our landscape. The marked change across the national soundscape that Fristrup has helped chart based on 1.5 million hours of acoustical monitoring reveals a shift in hearing that seems on the level of that described by visualizations of the alarming local rises in regional temperatures across the nation, which providing apparent evidence of an inevitable process of global warming: the maps below seems to suggest similarly ineluctible changes of the anthropocene at the nation’s edges that we have only begun to track, although the causation of such environmental impact to a release of greenhouse gasses is less clearly mapped in terms of causation, and human agency less readily determined than the registration of something that seems like climate change.
New York Times
Rather than consuming the edges of the country, as the above visualization of rising temperatures across the nation as evidence of impending global warming from the New York Times, noise encroaches on the country from the more populated areas more often located on its coasts and eastern shoreline. The region providing platforms to the world is not organized as a clear workspace or a set of clear property lines, but as corporate entities and logos, and where the bulk of the wealth produced has proved increasingly elusive for many of its residents. But the expansion across much of the nation’s soundscape by human generated sounds reveals what an analogous trend of man-driven change, if one that one can map with fine grain, and which impacts our perception of local experience in ways that seem more easy to measure and render at fine grain.
For the compromise of the sonic sensorium across much of the country suggests the degraded sonic environment we are transmitting to future generations. The map of the auditory landscape across the United States suggests the emergence of sizable and rapidly growing rifts on the amount of audible sound to which we are daily exposed that seem as prominent as a Continental Divide: radically different soundscapes in different parts of the country suggest a country increasingly plagued by noise–middle America or what was once known as the Midwest is distinguished by almost ubiquitous manmade background noise; intense acoustic shocks are rendered as bright corridors of noise run along Eastern seaboard of notably high loudness; only pockets of western parks, rendered as deep blue expanses in the interior, are distinguished by sound-levels of less than 20 decibels. The Acoustic Society of America used some 270,000 hours of measurements across 190 sites in the country’s National Parks in the contiguous United States to assess an initial picture of levels of ambient human noise that seem all but inescapable in the U.S. If the 1972 Noise Control Act was directed to strengthen legal protections against “unwanted or disturbing sound” to regulate noise pollution, sound-levels seem so widespread across the nation to be hard to distinguish how unwanted sounds adversely affects one’s quality of life as unwanted disturbances. Yet we now have a means to visualize the collective rises in ambient sound in ways that are truly as compelling as maps of global warming.
The change in our aural landscapes has gone largely unremarked, in part because the data is less easily available, and visualizations were long less able to be confidently rendered in such clear detail–or the amount of data not able to be clearly synthesized. Even at first seeing the map of sound levels in the nation released by workers at the National Parks Services in past weeks, it’s hard not to be drawn to these scattered refuges that lurk inside the map, as we shun the bursting supernovas of aggressively bright yellow whose streaks across the overstimulated sonic landscape where most of us live. The brightness of areas in which greater levels of sound were sensed seem to push us to the relatively few remaining quiescent places in the continent: it is not that they remind us of just how fully the sounds of motorized vehicles have come to penetrate most of our auditory worlds most of the time, but that they seem so ever-present and so visually loud, even when the levels of sound seem to fade miasmatically into the midwest, but reflect the growing population centers across the country that undoubtedly generate the greatest noise. The map creates a compelling picture about how we can interpret the current distribution of populations as filling the nation’s space.
\
Martin Prosperity
Much of the attention that the map has received respond to just how rarely sound-levels have been so closely integrated–or so clearly shown to overlap–with the mapping of an environmental space, or so compellingly integrated within an understanding of environmental change.
The question of registering an atlas of urban sounds have most often responded to less to subjective or individual perception than public policy issues that surround very specific local levels sonic pollution in urban environments from San Francisco to Oslo, based on visualizing noise levels across urban streets through GIS-based simulations that synthesize variations in decibel levels over time–and reflect a desire to control urban noise that even predate the Industrial Revolution, and which, R. Murray Shafer has found, there is evidence in Bern back in 1628, but which computerized maps provide a basis to visualize the results of such acoustical monitoring today.
San Francisco
Oslo
Despite such concern for managing urban soundscapes, less attention has focussed on comprehensively mapping endangered sounds–and even less on the endangering of silence, which have not been often imagined as a comprehensible object of concern. Attempts at mapping local sound-levels for reasons of public health have focussed on a local level to assess problems of noise pollution and to assess aural impositions in urban spaces–and to measure benchmarks of tolerable sound-levels in urban space. We more often consider noise abatement in relation to crowded restaurants than open spaces or countryside. The registration of a varying range of decibel levels across the United States created the opportunity to visualize a color-coded record of ambient sound, grouped according to spatially situated environments, applied a broad palette to geographic space based on a much larger dataset, and one that responds less to problems of placing future projects of construction than measuring the increasing ubiquity of sound-levels often linked to urban environments across the country.
The innovation of the NPS sound map of the country’s less inhabited and more densely inhabited regions presents a particularly persuasive picture of the extent of the growing uniform nature of our aural environments. Based on the 1.5 million hours of motoring across the country to capture sound levels sensed on an average summer day, researchers with the National Parks Service have collated an impressive acoustic topography of the continental United States in hopes to map average decibel levels across the country, and found few areas of relative quiet. The result is particularly striking for suggesting deep scars of sound that radiate aglow from urban agglomerations in a heat map of loudness that registers the diffusion of human-made noise levels across the country, and the extent to which much of its illuminated center is flooded with ever-present background sounds–acoustic pools, as it were, of almost 50 dB, or able to drown most natural sounds from animals. If the sound map created from algorithms suggests just how urbanized we are today, and how far urban noise-levels extend across much of the country, it offers evidence of the auditory effects of anthropocene from which there appears no turning back.
The picture does not look good for the future of quiet spaces in most of the coterminous United States. The stars and streaks of aggressively bright sulfuric levels of smoky yellow–indicating concentrations in urban areas of a level of 51 decibels or more–maps clearly onto population concentrations from the shores of Lake Michigan to Dallas, Atlanta or central Florida. The noise map reveals huge differences in noise tolerance and indeed background noise that most Americans experience as normal, and indeed the auditory expectations most bring to their days, and the relative absence of silence over a large part of the inhabited country that noise has infiltrated, from a light gauze of yellow that surrounds are largest farming industries to the clusters of noise around expansive urban areas. In those deep blue swirling patches of the interior lie the most silent spots of the country,abysses of quiet which register the lowest absolute levels of sonic interference, far from the pollution of urban noise which seems to spread like age spots across much of the eastern half of the continent. (The very deepest deep blue regions designate areas of background noise below twenty decibels, the sound of a ticking watch, far below the a refrigerator hum, and very far from the ever-present ring of cell phones, piercing blasts of jack hammers or car alarms, freeway rumble or such sudden spikes as sawing concrete that now seem to so often mark the hubbub of urban life that is often difficult to blank out save by white noise machines.) A considerable share of the population must be quite habituated to an almost constant loudness of almost fifty dB, or about that of constant traffic–and just below that which is claimed to increase high blood pressure, tension, and heart attack risks.
Remapping the limited areas of low-level sounds top stand out more dramatically in black as isolated islands of greatest quiet gives the map an even clearer urgency as a manifesto for the shrinking spaces of silence across the continuous United States:
The map advances a narrative of the shrinking areas of silence in the soundscape of the continental United States that is decidedly not rosy, and in which levels of noise pollution stand to double or indeed triple every twenty years, making this a particularly troubling prospect that challenges the future of silence in America. Not so surprisingly, it maps well onto a randomized map forecasting air quality across the nation in its contours, although variations in the NPS soundscape in the header to this post show more finely grained variations and seems to exploit a broader dataset.
The deep discrepancies in decibel levels however bears little clear correlation to the current mosaic of political preference across the continuous forty-eight, however Lamarckian one would like to be about the relation between collective preferences and aural environments. Despite a tendency to link weaker support for Republicans with louder areas of greater ambient noise, the data just doesn’t bear it out in full at all: some of the reddest areas are those register considerably greater decibel levels. (Low support for Republicans in Maine contrast with its predominantly low levels of ambient sound; noisy areas of the South are pretty darn red, despite strikingly diverse levels of ambient sound registered in those states; noise-levels in California’s central valley are roughly equal the blueness of its coast.)
The narrative that the soundscape implies is far from rosy, however. What seems most frightening is the lack of any clear map of the future penetration of high decibel levels across much of middle America. Along the frontier of the decibel divide, much of the nation’s center appears flooded dark yellow; Denver, St. Lake City, Las Vegas and Boise seem beacons in an expanding aural frontier, burning bright already in Seattle and Olympia. The registration of these ambient sounds include not only vehicles, but from factories, radios, sirens, televisions, construction sites, trains, or mechanically generated sound of any kind, registering the range of overlapping sounds at any space at any time, in a manner more like Zefrey Throwell’s 1,000-car-horn symphony than the heterogeneous ensemble of percussionists György Ligeti enlisted in his Grand Macabre.
But the origins of the shifting soundscape in the nation might be better tracked through the appeal of the Good Roads movement of Charles Henry Davis, that industrious Quaker who lived in South Yarmouth, Massachusetts, but founded the National Highways Association in 1911, promoting the hope for an interconnected National Highway System of 50.000 miles “built, owned and maintained by the National Government,” which while limited at that time to six great “Main Highways,” advocated an image of “a paved Unites States in our day” that has persisted. The benefits Davis saw in paved roads as an engine of economy that would raise the nation were more than only an infrastructure–“national highways will increase the wealth, the power, and the importance of this country as nothing else can do besides that which has brought civilization to the savage, wealth to the poor, and happiness to all–GOOD ROADS”–but an image of collective benefit. The continued promotion of their benefits, so removed from views of the benefits of preserving place today, actively promoted the benefit of the ideal of a “paved United States in our day.” Indeed, if all road maps were promoted in 1912 from South Yarmouth as useful tools that “will prove of inestimable value to the proposed national highways commission, and in addition will be of service in showing the people of each state how the national government can make use of their roads in the proposed plan” as of a piece with a bucolic vision of the nation.
Davis, Good Roads Everywhere (1912)
Maps boosted the image of a national system of highways, and indeed our sense of access to national space, from the 1925 promotional map that synthesized the roadways of the nation as an invitation to their exploration to celebrate the achievement of 250,000 miles of national highway–
–to the expansion of the “Good Roads Everywhere” movement creating a “paved United States in our day” as if it were “peace in our time.”
Looking at the nation’s soundscape, it’s hard not to be drawn to the chasms of deep blue where sound levels decrease. National Parks Services’ researchers took some shots when they compared these areas without background noise to the notion of traveling back in time to the sound-levels before Columban contact–on their apparent ignoring of the dense population of the continent before its “discovery”–one might see it as the sonar landscape Lewis and Clark experienced with the collection of animal trackers and Native Americans which composed the Corps of Discovery, traveling down the Columbia river or pausing in their portages: these are the areas distinguished with a sound level of lower than twenty decibels, areas where one can access a pristine auditory experiences characterized by the near-absence of the background noises that we are tempted to screen out of our auditory experiences,–and against which would stand out the perception of local wildlife.
The attractiveness of these seemingly pristine places not only provides a compelling advertisement for visiting national parks during whatever summer vacations one might have, but is a compelling soundscape of a world not likely to return, where decibel levels fall far below the fifty that almost seem low for urban areas, the deep blue recalling something like the cold of oceans’ depths. Created by the National Parks’ Natural Sounds and Night Skies Division, it reflects their mission statement to create an inventory of sound that seeks to preserve “acoustic and night sky environments unimpaired for the enjoyment of future generations,” Fristrup worries, and provides something of a watermark on our aural environments, but it is also intended as a diagnostic tool to measure the degree to which manmade noises affect owls and bats who depend on locating insects to find food–the somewhat synesthetic record renders an acoustic environment married by bright yellow splotches and sulphuric streaks, and ubiquitous noise levels comparable to hearing a washing machine churn from a distance of three feet away.
The ever-present scars of unwanted sound spread aggressively in almost radial fashion from major population centers and seem diffused across many the rural areas of the country. The maps suggests the auditory compromises created by the road network which generates ever-present background noise across the continent’s more inhabited areas, even if the algorithm used to generate it discounted traffic, with non-human made sounds of wind and water. Rather than present a watermark of sound levels, the map bodes poorly for the growing levels of volume in years to come. If much of this noise-generated hearing loss perhaps on account of noise-levels artificially generated in iPods and MP3 players which funnel amplified sound into directly our ears–and which may have helped elevate the number of five million 12-19 year olds who have compromised hearing thresholds, according to Dangerous Decibels–a site which is full of tips on living with hearing loss and the risks of noise-induced hearing loss–the desensitization to environmental sounds that the map charts creates a landscape where even those without Noise-Induced Hearing Loss (NIHL) have a compromised relation to their environments.
But the map suggests the changing nature of outdoor hearing for most populations, compromised by the rise of background noise, and the deep penetration of what used to be considered urban sounds of mechanized movements across much of the country.
Reading the stark topography of sound levels across the lower forty-eight, one is indeed almost instinctively tempted to run into its scattered pockets of deepest blues: these seem the safest areas of respite, as one shrinks from the bright incandescent yellows of even a tolerable amount of ever-present background noise–maybe not to the deserts of southwest Texas, but if not to the national parks bordering California, in the Cascades, the Colorado Plateau, Yellowstone National Park in Wyoming, Dinosaur National Monument between Colorado and Utah, and in the Great Basin. (It’s perhaps not a coincidence that some of these ecosystems, many home to Native Americans, were to be preserved “from injury or spoliation” by the National Parks, preserved thanks to Carl Shurz, David Brower and Howard Zahniser. Is the aural intrusion not a deep form of injury?)
One might as well get out a paper map of the greenspace in parks to correlate them with the deep blue lakes of silence . . .
It is almost difficult to imagine the experience of those deep blue areas of silence today.
The expansive chromolithographies of Thomas Moran depict deeply hidden, inner resources of nature in sites such as the future Yellowstone or Zion Park, preserved from industrializing life of in ways that raised interest in the hidden landscapes of the United States, after he had accompanied Ferdinand V. Hayden on the 1871 Geographic Survey of the Territories, in ways that created one of the first romantic images to produce a popular movement for the protection of a landscape as undisturbed. One is struck in Moran’s monumental landscapes by how these awesome environments dwarf their human visitors, arriving in what seem uninhabited lands, far from the noise of railroads or cities in the industrializing United States:
Thomas Moran, “The Valley of the Babbling Waters, Southern Utah” (1873) 18.71.14
Thomas Moran, “Grand Canyon of the Yellowstone” (1875) 18.71.8
These are the ideals of We now look at the romance of arriving at deep blue spots in the algorithmically generated soundscape, far removed from Moran’s monumental renderings of geographical formations that first communicated a sense of the natural majesty of the western United States to a large audience of viewers that communicated the wonder of a landscape he saw as both untouched and pristine, in contrast to the ever-present ambient noise that seems not only inescapable in remote regions of Oregon’s Crater Lake National Park but all but inescapable in much of the U.S.
But the levels of noise pollution that illuminate or almost incandescently light much of the country marks the encroaching of an auditory anthropocene from which there will be no turning back, and which has already altered the landscape as well as soundscape of the country. The spatial collation of audio registrations finds most people live in environments “where night skies and soundscapes are profoundly degraded, Fristrup notes, describing the extent of both sound and noise “pollution” as almost spanning the continent, where median background noise plagues most, out of a desire to “conserve natural sensory environments for future generations” registers his deep and abiding sense of loss and the inevitability of a landscape of increasing auditory degradation that could bring a generation of “learned deafness” destined to dull one to the very soundscapes National Parks seek to conserve–and the notion of such environmentally provoked desensitization to sound seems backed by the datum that some 10 million people in the United States were judged, in 1999, to have permanent hearing loss from noise or trauma. Are we becoming increasingly hard of hearing or deaf, or in danger of slowly losing a sense by which humans have long interacted with the world and gave meaning to it?
The argument has had special resonance–no pun intended. The map that was quickly shared upwards of 10.9 K times record penetration of high decibel levels (above 40) across much of the country’s inhabited land–and the rarity of those deep blue chasms that seem to almost fall through the map. Although the idea that they record the sound environment of the country before Columbus is doubtful, and not only because of the folly of thinking that it was not inhabited before 1492, the absence of industrial ambient background noise over a level of forty decibels is no doubt a pretty modern creation–though anthropocentric presumptions that the noise be generated by humans, rather than animals–stampedes of buffaloes?–seems more unwarranted. But the map based on measurements of midsummer decibel levels is a unique map of how we inhabit the land, and a nice record of what we might mean now by the “inhabited world”–or ecumene. It is a record, perhaps, of how we have chosen to inhabit space, and the ways that we have chosen to inhabit it–the landscape scarred with sound bizarrely analogous to the barren scored and spotted pock-marked lunar landscape, and the connotations of un-inhabitability it inescapably provokes in evoking this surface without life.
The sterile landscape of the moon is an odd choice of comparison. The worry that we may be facing the rise of a “deaf generation,” unable to hear the world as men and women once perceived natural sounds, due the growing decibel levels of constant noise in larger cities, and not be able to hear or register the natural sounds in cities, and even National Parks, has led Fristrup to worry about the threats and healthiness due to increases in ambient noise and wonder if future generations might not even appreciate the sounds of nature in cities or National Parks. If such fears seem alarmist, they are reflected in the deep attraction most observers will have to the deep blue identified with tranquility–and with restfulness or even curl health–an association according with the profound healthful benefits of silence.
Fears of a growing disconnect with aural experiences makes the strong similarity between the scoring of the national soundscape and the lunar landscape somehow appropriate. For the scientific synesthesia that results suggests how we’ve filled the continent with sound, from jack hammers to jet airplanes to trucks to power mowers to daily traffic to sanitation trucks to bird-calls. The sonic landscape closely corresponds to the expansion of manmade environments across the continent, and ignore the level of noise that was made by earlier inhabitants. The measurement of strong levels of sound pollution claims to screen out the traffic of nearby automobiles, but is appears to echo the very network pattern of freeways and highways that traverse the country and link cities with one another, and were no doubt privileged sites of measurement; where few or no roads exist, it seems that regions of deep blue must perforce prevail–or at least that the grids provide a basis to generate noise: grids of streets even appear in the noise map, much as the splotches of bright yellow mark cities and sprawling urban areas that have made silence almost inaccessible for large shares of the nation’s populations without considerable geographic mobility, and moved all landscapes of deep silence far west, removed from traffic’s perpetual hum.
Wikipedia
Only in 1970, of course, considerably more open spaces existed across the United States, if one focuses on Interstates alone across the western states:
The apparent density of noise may indeed be partly explained by the density of the network of highways that course across the Eastern seaboard and much of the midwest.
What might be called the “noisier half” of the United States shows an area of almost continuous noise pollution, where the “auditory horizons” have markedly shrunk in most places to but a few blocks of paved space–
reflects the very same region where highways define a distinctly different relation to expanse:
The expansion of the National Highway System across the nation is perhaps best rendered by a hand-drawn map that tries to project its future and the compromising of place that it implies, with an eye to the shrinking of the auditory human experience of place:
A Highway Map of the USA
For the congestion of noise, roads, and urban areas reveals an image of how we inhabit continental expanse. We might compare the division of the country, grosso modo, to the imbalance in the density with which McDonald’s restaurants are spread across the contiguous United States, shown here by illuminated dots that reveal the proximity of fast food restaurants across the land, sometimes suggesting strikingly similar highway paths, and no doubt mirror population trends, and indeed the density of businesses:
Stephen Von Worley
Does space tend to collapse in interesting ways once one is less able to sense sounds? Such levels of noise pollution offer a sonorous residue or acoustic remainder of how we have come to inhabit the world’s environment and to remake it, and register the arrival an auditory anthropocene which earlier maps have often been hard-pressed to detect.
As much as being confined to the United States, the prospect of such elevated decibel levels in areas of dense population and the modern humming of transportation networks across the country find a parallel in the noises of the global traffic networks we have created in the seas. Indeed, the oceans seem increasingly characterized by constant presence of such noise recalls the “background hum” of oceanic shipping lanes that resounds across the oceans, by modeling a global soundscape seeks mapping the range of sounds ships create in transatlantic voyages, that seem the material reminder of the increased intensity of a global network of shipping lanes. Such sound levels, to be sure, often obscure the cresting of waves, with the upshot of radically compromising the auditory experience of the ocean for its inhabitants–especially imperiling animals that use sounds to communicate, cetaceans from whales to dolphins, in ways that may mislead the sonar skills they have evolved to map their own courses underwater, in ways that create more than auditory interference with how they experience space. And with noise traveling some 4.3 faster in the watery medium than in air–and traveling at an unchanging intensity over considerable distances–the gigantic impact of large-cargo vessels that generate more noise than we would often permit onshore from constantly running diesel engines creates considerable ambient noise to which different marine creatures are especially vulnerable.
A map of the auditory intrusions of passenger vessels alone that was recorded and released by NOAA based on anthropogenic noise of cruise vessels alone suggest a shifting in the oceanic environment:
Yet the spectrum of noise from the chronic levels of noise modeled from larger commercial vessels was far more chronic:
And when summed, the picture that results is of a radically sonically altered and disrupted environment, apparently in ignorance of the disturbances that they create for actual (or any) ocean populations:
The map below registers sounds that extend to a depth of 650 feet in a similar color spectrum map–which doesn’t include either seismic exploration or Navy sonar noise that add considerably to the range of ocean sounds that obscure today’s songs of humpback whales. Indeed, if whales often base their communications over expanses of hundreds of miles through their song, whale space has undoubtedly against such background noise in a a sea with startlingly few areas absent from auditory interference. Such changes would not only affect the cetacean populations of marine mammals as they navigate underwater transit–if von Uexküll suggests that whales are attuned to other worlds, it might be important to contemplate what they make of the ships’ apparently unavoidable background sounds, or whether they accommodate to their presence.
NOAA
If one goes to 200 Hz, a slightly different picture of the local variations in background hums emerges:
NOAA
But what might be considered more broadly is the very difficulty of erasing the imprint that such ships that travel across the seas exercise over the entire marine environment. The sonorous surroundings characteristic of the oceans were earlier mapped at 400 Hz and a depth of fifty feet by NOAA in 2012, from passenger ships, commercial ships, to seismic surveys in an annual average, present a similarly pronounced offshore acoustic disturbances and an even more pronounced augmentation of background noise offshore, as if hidden from landlocked observation stations, as if ships’ engines are only started at full throttle after arriving in the open seas, where ship captains or automated pilots crank up their speeds and plow full speed ahead:
NOAA Underwater Mapping Sound Field Mapping Working Group/HLS Research/ NCEAS–Details of North Atlantic Shipping and local noises near Long Island–from the New York Times
The rumors of transatlantic voyages notwithstanding, it is somehow wonderful to move from the noisy oceans to their landlocked counterparts.
The deep blue sites of relative silence, often confined to the areas close to the coast, may indeed obscure the extent of noise we have created far out at sea, far from the increasingly noisy shore, where we cannot hear their hum. The shifts in the national–as well as the global–soundscape makes one wonder whether, in obscuring some sounds or making other sounds inaudible, one is not changing perceptions of space in ways that the great majority of data visualizations cannot register. But both present us with digitized images of sound-levels so strikingly ever-present that we can almost hear them resonate across space.
Like the deepest blue spots on the sound map of the United States, they mark the rare areas of respite in an every-noisier world.
Silicon Valley is not located on a proper map. And it is fitting that such an unmappable site has become the site attracting such overwhelming investment, start-up money, and employment that it has become a paradigm of the new pathways and interconnections that form a central part of the distributed networks we now speak of as globalization. Silicon Valley is a place, but as a conceptual space demands mapping against its actual configuration. It exists in part as an easy space of commute from San Francisco,if it is hard to gauge the distance between the two. If its proximity to San Francisco became clear by 2001, as the formerly secluded verdant paradise had consolidated its identity as unable contain the proliferation of brands formerly nested in its landscape, the bounty of Silicon Valley was defined by its maps, far more than its location.
Yet where does Silicon Valley lie? Long a place-holder for prosperity more than a location, the term is rich with connotations of branding user experiences, relentless competition of technological innovation, collaborative workspace, cross-fertilization of web-based technologies and design, as well as a ruthless competition whose deeply gendered assumptions have only recently begun to be questioned, rather than suggestive of a bounded location. While something of an ecosystem and region set apart from the national economy as clearly as it set itself apart from an industrial space of production, the area identified with Silicon Valley has increasingly been a site distinguished by such rapid growth and profit margins that it threatens to lose site of any location–and expand in ways that cannot be actually mapped as a place, within polygons or as a bounded region in space: is it more of a mindset, an attitude, or style of attracting investment capital? As the excellent online cultural resource the David Rumsey Center illustrated in its state-of-the-art exhibition of maps of Silicon Valley and other tech hubs, weighing in on Silicon Valley’s transformation and refashioning in the post-war period, in hand-drawn maps that extend satellite imagery to a naturalized place, the hope of consolidating the Valley as a commercial agglomeration were determined to promote its workspace as a bucolic island of munificence as if it had naturally appeared–in 1985–as a site fully born in the world–
–however much a closer view of this now changed landscape reveals it as in fact rooted in time, highly contingent, and almost ephemeral nature of the constituent residents of the commercial landscape that it mapped–and of course its constructed nature as a space where “normal” economic rules end or needn’t apply.
Johnson, “Silicon Valley,” City Graphics of America (detail of above)
If now an abandoned landscape in comparison to the days of earlier Sunnyvale businesses, the inevitability of Silicon Valley as a place is undermined at a distance of forty-five years, even as it has endured and flourished, filling the promise that had already crystalized by the 1980’s.
It is almost fitting one is not sure of one’s own place or position in apt ways while snaking along the freeways that curve into Silicon Valley under Northern California’s lack of clear bearings in the sun-drenched region; there is no sudden recognizability of Silicon Valley as a place. Disoriented by the nondescript brown mountains improbably marked by isolated patches of darker trees which ring the flat fields which once held pitted fruit trees, one immediately finds that Silicon Valley is a site of transit, through which one moves, rather than one of residence, but exists as a workspace in ways that make it a transitional non-place–rather than an actual location. Yet the swarming of Silicon Valley with corporations, angel investors, start-ups, and next big things increasingly threatens, as will become clearer at the end of this long meditation on the ability to map Silicon Valley, to overwhelm its livability.
Yet over forty some years, Silicon Valley has enduringly assumed an enduring mental prominence in our collective imaginaries as a new configuration of capital, and a new notion of economic success, rooted in the displacement of earlier models of work and of a new relation of technology to nature–from when William Shockley first started manufacturing the silicon chips that replaced the cherry and plum-laden orchards that had dominated the Santa Clara Valley. Over four decades, the place of the region has so metastasized in our mental imaginary to spread not only along freeways but an innovation hub able to outpace the growth of the national economy, especially in innovation jobs, although in ways that threaten finally to overwhelm the infrastructure of the region, and its ability to sustain the region. Will the growth of Silicon Valley itself overwhelm the region that is increasingly displaced as the primary sector of tech innovation it has s long claimed to be?
It is not fitting that it is not easy to orient oneself to place because of the region has so long persisted in the mental imaginary. We need maps to tell us,”this is here,” in ways that make the magic of maps of Silicon Valley all too visible and attractive as an improbably combination of culture and nature, and its productive promise somehow oddly naturalized. Rarely was the metaphors of place so successfully enlisted in remapping of place in our collective imaginary as Silicon Valley. The boosterish claims for perpetual production of next generation devices has almost rested on the promise of endless natural bounty in a region, eliding the natural with the technological in ways that don’t exist on maps, but have been mapped and remapped as a utopic space, to conceal that the conceit of Silicon Valley is not at all a location, but a space of work, defined by trademarks, unprecedented angel investment, and the proliferation of patents, as much as the actual fertility of its terrain. The term has however served well in the continued reinvention for over forty years even as it has replaced a place once dominated by fruit orchards and exporters but recast itself as the motor of a newly integrated economy apart from usual notions of work-time.
If Silicon Valley lies off of most maps, and can’t be found on most maps or even exist as a place-name, it is imagined as a freeway exit, and an economic engine, even if it has for many years not produced any actual material goods. But the notion of a place of such hype serves well of the as a promise for manufacturing a new place of work and a notion of productivity, which is especially appealing and useful to imagine as if it lies on a map. but amidst sunny and verdant California hills, nourished by a bright northern California sun, sui generis as a site of innovation as much as capital, and naturalized as a region. While long ago defined as a site for manufacturing silicon chips in roomy warehouses formerly devoted to shipping of dried fruit, the mapping of Silicon Valley has continued to define its place and prominence in a global economy, and to affirm the uniqueness of place even in a world that is far less rooted in manufacturing or material production. Although Silicon Valley exists as a promise of freedom from normal constraints, or patterns of work, its imaginative conceit of as a utopia banks on the promise of new rules for its continued bounty and next generation circuitry, software, and cloud-based commerce, and the absence of any normal constraints in its utopia space, as if it defies any fixed place on a normal map or pattern of economic production and innovation. And as the valuation of mental health apps, remote conferencing tools, and online sales doubled and tripled their valuation in the Coronavirus pandemic, producing a quarter of unprecedented profits in Q3 2020 and Q42020 and continued to attract venture capital, the survival of Silicon Valley seemed uncannily adept in an era of sheltering in place.
The promotional maps of Silicon Valley that were produced since the 1990s are in a sense the markers of its emergence as a place in our collective imagination–and provide the most common maps where the region exists as a place or that claim to orient one to it. But as questions of the replicability or the necessary preconditions for Silicon Valley and investment in tech sectors have grown worldwide in recent years, or over the past decade, the exceptional nature of Silicon Valley, in ways once perpetuated by these maps, has been called into question, in ways that might occasion an investigation of how to best orient oneself to the region. The serial production of such slick colored promotional maps, if they are vanity items without much clear scale or orientation, provide a basis to examine the vision of place that Silicon Valley promoters promoted, entrenched as they are in the image of bucolic abundance they seek to perpetuate–removed from the usual specters of pollution, urban grit, transportation problems, or the poor, unemployed, and indigent that Silicon Valley businesses sought to promote, and holds a mirror up to the non-place that has so dominated our collective spatial imaginary for forty-odd years, when the Valley became the site of corporate swarming in ways that not only rebranded itself but became a site for branding a growing sector of the US and global economy.
The promotional industry maps of Silicon Valley–whose scope has now expanded to encompass maps of corporations in “Silicon Forest” in the Pacific Northwest, “Silicon Coast,” “Silicon Desert” in Arizona, the “Tech Triangle” in North Carolina, “East Coast Tech,” and “DFW Technoplex” play on the attractive image of “Silicon Valley” as a unique site of investment in the high-tech economy. They respond to questions about the unique growth of the region as a site of high tech and corporate investment. But the burgeoning range of maps also make any discussion of its “organic growth” a bit of a sad joke. For the myth of Silicon Valley as rooted in Goldilocks conditions has something true, the transformation of the semi-arid region’s orchards was long a site of one of the largest farms for harvesting plums, cherries, and the streams that fed orchards was anything but organic. But the pull of the idea of “Silicon Valley” as a fixed location also provides a basis for the successful production of these maps from 1989, as the first paradigmatic high-tech region of the world.
The continued swarming of Silicon Valley with cutting-edge businesses, deals, and capital occupies the former Santa Clara Valley, the site for shipping cherries, prunes, and to the world since the 1860s, has particularly resilience as a center of a global economy to which the metaphor of fertility has been used to promote a new paradigm that has naturalized the high tech. Indeed, the rebirth of Silicon Valley in the public imaginary is defined as distinct from the economic landscape of much of the United States, in ways that have raised repeated questions of whether a similar efflorescence of high tech companies is possible in other climates or sites. The region’s economic productivity doesn’t seem to be confined to one place, but its continued growth across forty years reveals the persistent place in our mental imaginary over the past fifty years in ways that demand to be mapped as an innovation economy whose future-oriented economy is set apart from the United states. To be sure, the notion of work-time in Silicon Valley long remained separate from the United States as its intensity as a site for research, development, and marketing–and the basis of an economy rooted in an innovation paradigm based on investing on human-machine interactivity that is increasingly a global phenomenon.
R&D spending intensity in California metro areas/Source: Milken Institute
The illusion of intense competition of a small pool of talent that dominates Silicon Valley makes it a unique ecosystem–one for which the agrarian metaphor seems oddly apt, given its continued growth and the appearance of continued productivity–making the massing of workers, technical competence, start-ups, skilled labor create a web of related companies and hiring models oriented to a business of innovation, a business which generated its own future-looking style. Yet the utopian nature of Silicon Valley and its exceptionalism have over forty years increasingly become the rule, both in the outsourcing of labor–silicon chips long ceased being assembled in the valley, as the name persisted–and a paradigm for creating wealth inequality on a global scale, even as it has cast itself as a site of unbounded economic opportunities. Even the compounds of work in Silicon Valley are odd clusters in an uneven economic landscape, whose status eludes any geographical localization or embodiment.
Menlo Park, CA, site of Facebook HQ (Noah Berger/Reuters)
The unique pace of growth in Silicon Valley as a region redefined the occupation of space–its expansion has defied normal mapping terms of boundedness, definition, spatial continuity, and networks of capital flow–but its “center” or “capital” demands to be mapped, to try to grasp its character by locating its spatial center in space.
Even as the expansion of the Valley has refused fixed boundaries since it was adopted as a term for a newly emerging and unprecedentedly fertility of a space for economic transactions, it has redefined the actual Valley, an orchard nestled between mountains, long since displaced by urban sprawl. But the coinage appealed as a hybrid of nature and culture–and a naturalization of the epicenter of the semiconductor and computer, as well as the proprietary ownership of first circuitry and later code, even as the fruit trees and produce receded into its past, and the layering of data only wryly recycled its agrarian genealogy to explore and explain the ideal growing conditions of high tech.
In registering a site less of human habitation, than through which an increasing amount of capital, employees, data, start-ups, returns, and intellectual property flows, Silicon Valley is a particularly capacious place-holder as much as an actual “place,” having outgrown its metaphorical coinage as a topography whose former fruit orchards and cattle ranches were seamlessly resettled by an apparently waste-free industry, or even its spatial situation, to embrace a style of business and investment as well as of technology. Indeed, whereas once this valley which shipped fruit worldwide has become the paradigm for an even more exceptional sort of bounty, the produce that flows from the sunlit once-green hills is technological and now largely web-based, so much that the modes of interaction and human-to-human activity that once defined the valley as an agrarian hub now seems to have constituted a new sort of workplace, as well as the entrance site to a new economy.
“Silicon Valley” won’t be found on any “real” map. It doesn’t exist on maps–although you will find Menlo Park; Palo Alto; San Jose; Mountain View; or Redwood City. It exists across them, and in the offices off their freeways, save as a “non-place,” a destination and a sense of purchasing power and, it could be argued a state of mind. Silicon Valley is removed from place, as a space of work and deal-making oriented not to the present or the work-time of the rest of the economy, but rather is oriented to the future and the Next Big Thing. But if future-looking, it has a striking resilience as a region, and not only on metaphorical grounds as a site of abundant investment, and has been widely mapped as such, if only to be grasped, and for its possibilities of recreation to be examined. While there has been an underlying continued stability of Silicon Valley as a place-holder reflects the very linked networks of home computing that it promotes, the valley’s abundance is defined by its generational staying power. The staying power in the region of investments in products from integrated circuits, to silicon chips, to personal computers, to cloud computing–from the ARPANET to the internet–has retained a stubborn geography of its own–even as Greater Silicon Valley has spread to the East Bay, San Francisco, and Walnut Creek, and multiple “Silicon Valleys” have so grown across the world, each with their own set of angel investors, to deny or threaten the uniqueness of this one region.
At the same time, however the fame of Silicon Valley has only grown. How to make sense of the continued success of the Valley as a sight of investment, joint ventures, deals, and patents is unclear–but the Valley emerged as a new site of deal making, as much as of the production of goods, and defined its own style in distinct ways, as much as it has gained exclusive rights of copyright or a patent on innovation. Between a hub of intellectual property rights and a push to innovation in a competitive market place, however, and driven by individual holding huge nubmers of patents–Steve Jobs, who has now gained some 458 patents, including a third–141–that were granted after his death, from the 1983 patent for the Personal Computer, as the work of the independent investor Jerome Lemelson in robotics and machine vision, who averaged a patent a month for over forty years, as well as ninety-six after his death. Silicon Valley might indeed suggest not only another form of commerce, not rooted in place, even as it exists as a place: it certainly suggests a new form of IP authorship, even as its technological leadership is not defined only by patents, but a skill at turning what seem to be small innovations into global corporations, fed by the trust of those investors funding the Next Big Thing. If the economic clustering of Silicon Valley reflects the surprisingly grounded spatial metric that determined the circulation of start-up capital only to offices lying “thirty minutes from one’s door”—even in an age when “If you’re not online, you’re not really in business,” the spatial metric defined a fuzzy logic for the spatial clustering of capital.
For as much as it has sustained its meaning in designating a, region, its amorphous expansion has skewed the economy and habitability of the real estate market in the region–in ways that couldn’t earlier be locally imagined–expanding beyond its geographic confines as a locus for employment and investment whose landscape is increasingly prominent in defining the presence of place in an age shaped by ever-increasing ties of globalization. Each corporate campus in the Valley seems a node of the interlinked global economy, in ways that are dependent less on “local” knowledge–as is revealed, say, in this striking survey of the bay waters of 1880–but whose topography is shaped by its ties to the broader knowledge economy far beyond a single region. But even if it is not able to be bound by clear boundaries, or exist as a place, the appeal of Silicon Valley as a term and concept in the geographical imaginary is that it lies apart from normal commerce, and beyond familiar concepts of scale, building empires out of chips, integrated circuitry, or an interlinked economy, defining itself as a apart and as a focus of investment world-wide, fetishizing the local through a bucolic imaginary of the possibility of infinite investment for technologies of global purchase. This post wants to take stock of the Silicon Valley through the metaphor not of agricultural abundance of a place, but swarming of a ‘non-place’–a space not able to be found on any “real” map, but assuming increased importance in a mental imaginary. For Silicon Valley exists as a space dense with investment and deals, where the proliferation of companies replaces habitation or inhabitants, and as a community exists in corporate terms, from the production of silicon chips or micro-processors, attracting migration of highly skilled workers in a new interconnected space of work that has changed the regional landscape over the past forty years in definitive ways.
The playfulness of the place-name barely conceals the displacing of the agrarian orchards that once occupied the site known as the Valley of Heart’s Delight–but nourished by Stanford University, rather than sun, fed by investors, rather than by the watershed of the Guadalupe River, long since dried up, and the once-riparian lands of Coyote Creek, or Alamitos Creek, and fecund with silicon chips, rather than fruit trees. But the place-name’s enjambment of hi-tech and sunny suburbia captures the presence of Silicon Valley as a non-place–a hybrid site of work and capital investment as much as habitation. The over-optimistic boosterism of the term–perhaps hatched by marketers and fed to Don Hoefler, prominent columnist at Electronic News, but emulating the bountifulness of a region’s beneficial agrarian climate for fruit trees or farms–has had considerable staying power both because it redefined the region. “How was I to know,” Hoefler mused innocently on his renaming of the region in 1981, “that the term would quickly be adopted industry-wide, and finally become generic worldwide?” January 11, 2015 marked the forty-fourth anniversary of the naming of the region in print, and the continued transformation of the region reflects the considerable work done by its first naming almost a half decade ago, when the term increasingly beckoned its expansion as a site of job opportunities epitomized by its sunshine, incarnated now in its “sunset” stocks of IPO portfolios.
If “Silicon Valley” was enthusiastically received in America as a region of the country, its appeal as a region set apart from a manufacturing or industrial economy foretold the rapid expansion of the region as it readily metastisized to erase traces of the region’s former toponymy. Hoefler’s early article focussed on the early marketing of the transistor and semiconductor in the Santa Clara Valley, but announced the appearance of a ‘place’ in the spatial imaginary of Americans, retrospectively rechristening the rapidity of startups to appear in the previous fifteen years around the production of transistors. Apart from its commercial characteristics, or business practices, the huge rise of has skewed the economy and habitability of the real estate market of the region in ways that couldn’t earlier be imagined–and led to a recent expansion of corporate valuation of Silicon Valley-oreinted companies of High Tech across the region that extends far beyond its geographic confines of the Santa Cruz mountains and Diablo range, but continues to stand apart from much of the United States. The recent decade of employment growth across varied sectors of technology–health, design, communications, finance–have not only become emblematic of a global economy, but has disproportionately crowded the region as a center for venture capital and an apparent mecca for jobs, defined by the clustering of corporate habitation of the region, as much as human population.
For in Silicon Valley, the individual is indeed transformed to a “Googler,” an “ex-Googler,” or “Microsoftie”, as well as working at Sun, Facebook, or Amazon, which is defined by its corporate culture or the corporate cultures that define place: if “20% is your benefit and responsibility” in the “personal projects” Google encourages, the flip side is that 80% belongs to Silicon Valley. While such a map might seem to leave out people, or map corporations as people and habitants, the complexity of cash-flow and individual personhood in any map of the Valley might be best captured in the combination of graphs, charts, and visualizations of the z-axis of time by which individual employment in the region’s tech sector is understood.
Will the actual confines of the region be able to sustain its growth? The emergence of the semiconductor industry in the South Bay extends far beyond the fairly tongue-in-cheek popularization for a column in Electronic News, running with a term overheard from folks in marketing semiconductors to present an “insider story” of the industry would generate an extensive cartographical afterlife as well as a new place in our mental collective spatial imaginary that displaced the agrarian valley’s network of creeks with a web of freeways. As imported water supplies exceed half of the water consumed in Santa Clara Valley, the region has exceeded and surpassed its bounds. The apparently disembodied region Google Maps generates of the region, fed by the 280, 880, 680, and 101, erases the corporate constellation that creates the nexus of Silicon Valley, but captures the problem of identifying the region’s integrity, as what was once a region of relatively cheap land that could be easily purchased by corporations around San Jose–where the largest publicly traded tech companies are still based, cozily clustered next to such points of reference as Stanford University, where an archipelago of corporate campuses have grown.
At the same time, the Valley has grown not only in economic authority with such intensity to redefine its relation to space. If the region seems as emblematic of income inequality as technology or innovation, as exponential crowding of the region are increasingly fueled by hopes for future growth. Crowding suggests both the way that Silicon Valley’s expansion as a “non-place” has created a new relation to space, but how the region has grown not by familiar models of urban or extra-urban expansion, but by analogy to the increased ability to compress information and invention into its elastic space–and to reinvent its relation to space. Despite the staying power of Silicon Valley as a magnet of investment and entrepreneurial development, the increasingly elastic development of the Valley as an array of interfaces and media, the crowding of Silicon Valley raises increased questions about the continued coherence of its economic and social space, and what sort of space it has come to constitute–and how that space grew as a space bridging nature and culture, as well as investing in future generations in this mythical land of start-ups.
“20% is your benefit and your responsibility.”
1. The toponomy of Silicon Valley has been since quite carefully cultivated and nourished by the industry, long after its orchards had left, from Steve Jobs and Steve Wozniak to Mike Judge: as a region removed from the manufacture of Silicon chips, the extra urban space was a hub of prosperity and investment, and a new way of getting things done that has, mutatis mutandi, expanded as an “area” across an ever increasing geographic space to render it unrecognizable save as a site of investment and ever-expanding economic goals.
For Silicon Valley has so expanded the Bay Area itself on our maps, that the industrialist Tim Draper recently promoted the area as metastasized into its own mini-state in his proposed partition of the state as Six Californias, removing its toponym from anything more than a notional relation to place, now bound as it is by eight freeways, from the 280 to 880, as much as the Guadalupe River, Coyote Creek, and Stevens Creek. But the naturalization of the region as a site of marketing semiconductors and computers defined by a unique trading zone between engineers at Stanford University, favorable tax policies, and venture capitalists has oddly reified a landscape of agrarian work, fruit orchards, cattle ranches, and –Santa Clara Valley and the one-time Valley of Heart’s Delight–
–whose land readily metamorphosized an economic destination and style of work rooted in offices, corporate campuses, and that has persisted as economy of its own, with incomes far higher than nearby regions.
The increasing unboundedness of Silicon Valley is a reflection of its prominence in our social imagination as a region of corporate achievement and internet start-ups grown into tech stock giants–than to its place on a map. Which is as it should be for a place that is defined as a concentration of capital, rather than a fixed workspace, and redefined by its promise as much as its rootedness in the land. While the increased ties between Silicon Valley and Wall Street may pose risks of feeding unrealistic expectations for IPO’s, the expansion of Silicon Valley needs to be explored for the unique space that it has created–as much as the careful cultivation of historical levels of inter-generational invesment of its own.
In this sense, the punning toponym “Silicon Valley,” which gestured back to the agrarian economy micro-computing had replaced and displaced, called attention to the unique sustained investment in industry that defined its genius loci, if its god was Manon, as much as innovation. If the riparian banks of Coyote Creek, and Miguelito Creek have been displaced by the paved corridors of commuters, the cultural capital of Silicon Valley has been so globally diffused to be a model for global cities, the recent failure of recent heavily promoted IPO’s despite their “Valley” Buzz may have created a slew of “zombie stocks” under-written by Wall Street and backed up by venture capitalists, but unable to offer the continued investments and promise that have led so much money to flow into the Valley’s corporate accounts–raising questions not only of “getting out” of initial investments, but of how many employees the increased crowding of Silicon Valley can actually continue to create, even as it redefines its owns pace.
How Silicon Valley will remain on the map can only be answered by excavating its formation as a place. The region of Silicon Valley has long been represented as a case for the stubborn relevance of geography to the economy in an age of the interlinked, the generation of wealth, linked products, has also left its mark as disturbing the region’s economic equilibria in ways that its very identity as a fertile valley can no longer be clearly recognized, and whose boundaries lack clear bounds. For Silicon Valley is fundamentally a locus of economic transactions, evident in sheer number of investments, volumes of sales and users, as well as successful startups and of the marketing of the future, even if it holds the name of a hamlet on a fictional map whose notion of exceptionalism might more closely resemble a board game than actual geography. But to persist in naturalizing it as a fertile El Dorado of High Tech prevents us from examining the peculiar place that exists between the Santa Cruz mountains and the Diablo range, shown as if they existed on a field of green.
But rather than being as disconnected from a site of work, the economy of the interlinked has emerged around a given nexus where plentiful entrepreneurial investment has encouraged an economy that has seem credibly naturalized to a given region and climate–as the perpetually sunny image of Silicon Valley long been cultivated in the “map porn” of product placement evident in the region’s annually produced vanity maps, in which business cards replace toponyms.
The naturalization of the corporate constellation that has settled across the region since the 1980s as a microcosm of the micro-computing industry, has defined itself as a map of the computing hub of America, but now extends far beyond any single map. For as the haze and pollution of the Valley have increasingly grown, the continued investment in “sunset” companies promised to never fail seems called into question by the continued market for financial services, health services, and networked items.
The expansion of the authority of the region as a corporate cluster reflects the increased leverage that it gained as the merchant of a new sort of sales and property with patenting of software from the early 1970s, the growth of the patentability of software from the 1990s created grounds for an unheard of expansion of the region’s symbolic and actual capital; what attracted investment was less hardware or silicon chips, than the algorithms that are often cross-licensed as commercial tools, creating a new period of astronomic growth witnessed in the over 150,000 patents it issued for “computer implemented inventions” by 2004, a number which has only grown since that date, driven in part by economic necessity as much as entrepreneurial investment. As a center of investment, it is too big to fail.
Wikipedia
The transformation of a purely notional relation to place that was cannily created about thirty years ago to designate the abandoned orchards of the Santa Clara Valley attributed to newsman Hoefler or fed to him by industry promoters caught on quickly after it appeared in print in Electronic News. In the fifty odd years of extraordinary economic expansion since the tacit boast first circulated, and the spatial imaginary of Silicon Valley has become less a place or even a region than a crisis of corporate over-expansion and congestion, with little room for workers to live nearby. And as the map in the header to this post reveals, the corporate toponymy of the region, if shifting, has come to rival or displace the the actual names of towns, as they indicate the actual terrain of investment, employment, valuations, and real-time commute. And even if the exceptionality of the area was long pictured as a site of abundant economic growth, both as an economy apart and one that followed its own rules of the game, Silicon Valley remained a site for the proliferation of start-ups and potential buyers of smaller internet companies to an extent that warped not only the demand for space but economic geography, real estate valuation, and commuting times of northern Californians, as well as to pave over whatever remained remotely bucolic about the Valley during the 1970s.
The region has expanded beyond the category of a magnetic boom-town whose economy was set apart from the United States by the very ease with which it effectively generated wealth–unlike most of the nation–and where salaries, investment, and product production seemed at a different actual scale than the rest of the nation. The distorted scale of Silicon Valley’s wealth, entrepreneurs, and volume of sales challenge and make it particularly difficult to locate in the conventions of a single map, and press the powers of data visualizations and cartographic skill. Maps of the region suggests a different relation to geography, work and space, rather than use familiar terms of cartographic expertise–as if these could ever be commensurate with the space or actual topography that Silicon Valley–the very name of the region has become the ultimate floating signifier–has continued to define.
The continued growth of the region over forty-five years to become an economy as large as that of some developed countries–and to see the coining of seventy-five analogous place-names designating over hundred and five locations as similar sites of “digital urbanism”–from Bangalore to Berlin, as well as Ireland, Scotland, Texas, New York, and Sweden as if in hopes to jump-start a digital economy in “Mobile Valley,” “Telecom Corridor,” or “Silicon Alley,” by capturing an apparently mobile but elusive signifier to christen prospective hubs of the digital economy–in the face of the persistent and stubborn growth of this single region as an interlinked economy. The continued prominence of the region in the global imaginary has created a sustained the desire for its material remapping, as if to grasp the resilience with which economic transactions have remained located in a relatively, across generations, in a well-defined region for over forty-five years.
Although “Silicon Valley” exists as a new hub of an economy transactions that has been removed from a material trade, its preeminence in our spatial imaginary continue as it has shaped the geography of the state of California and economy of the United States. As such, “Silicon Valley” demands its material concretization and mapping, in the hopes to embody and explain of its distinctiveness as a region. This blogpost has itself expanded, analogously, as if to come to terms with the paradox of comprehending and mapping Silicon Valley as an emergent place–which signifies both a place and a destination and a state of mind, but refuses to be coherently mapped, even as it has utterly reshaped the increasingly paved terrain that it has continued to occupy. Perhaps if an absence of regulation is the chief defining characteristic of Silicon Valley, of course, mapping its location might prove as elusive as classifying its economy in familiar terms.
“The best people had made the best systems and the best systems had reaped funds, unlimited funds, that made possible this, the best place to work. And it was natural that it was so, Mae thought. Who else but utopians could make utopia?”
–Dave Eggers, The Circle
2. The promise of the region’s identity as privileged mecca of knowledge and technology has persisted with the introduction of a new sense of intellectual property as it has attracted continued entrepreneurial investment, coasting the waves of hopes for a new economy. If the Valley remained a center for start-ups whose fertility was long unrivaled as a site of start-ups in the 1980s, 1990s, and first decade of the twenty-first century, corporate deals in the region have so runneth over to obscure any center or set bounds we might recognize as a “Valley” or indicate on a map–and suggest the distortion of territorial extent and expanse that the economic powerhouse of Silicon Valley has wrought in ways that will challenge any mapping of the sociodemographic entity long known simply as The Peninsula–an unbounded term that has for all practical purposes replaced “Silicon Valley” as a geographical designation. For despite the removal of “Silicon Valley”from a traditional geography of work, the continued geographic stability of its corporate clustering over a considerable length of time has suggested its resilience as a place.
Indeed, indeed the continued swarming of entrepreneurial investments, start-ups, intellectual property negotiations, and internet hubs to the relatively specific region has increasingly found itself without the possibility of mobility that its economy might otherwise imply–and perhaps best defined by its lack of regulation.
Over forty years since Hoefler coined the term “Silicon Valley” to describe what had become the “breeding ground for industry,” the corporate landscape of Silicon Valley increasingly finds itself without room to grow. Indeed, the current shortage of office space and a colonization by corporate campuses transformed whatever had once been economically or figuratively bucolic about the former industrial landscape into insulated workspaces suggest an archipelago of the interlinked.
What once seemed to transcend the bounds of the American economy has set bounds for its own urban development in ways that have artificially escalated real estate prices, the geography of the Valley–if once created–has warped the economic equilibrium of the region. The clever expression rapidly adopted by the hi tech community as a naturalization a genius loci in upbeat terms set apart from the nation’s economy possessing its own distinctive rules, has come to warp the economic equilibria of the region far beyond the space that it originally designated: as much as replace the bounty of former orchards of plums, cherries, and apricots with an ever-plentiful production of micro-processors and computer chips, the economic equilibrium of an expanding Silicon Valley raises pressing questions about its future rarely posed before. If the genius loci asserted on pro-commerce maps of Silicon Valley depict a pastoral image of innovation and investment, the actual Silicon Valley’s growth has so distorted the real estate market and commute routes to obliterate the legendary natural fertility of the region once rich with fruit trees that provided year-round delicacies of dried fruit.
Yet whatever genius loci still exists in the region is less defined by fealty or dedication to any god save as a broadly understood site of sacrifice. The current economic equilibrium of the region so warps the lived geography of traffic and housing across the Santa Clara Valley so as to conceal conceit of the region’s plenty–whatever Gods or guardian spirits dwelled at its altars beside Manon. Indeed, the expanding commute times and density of office space have replaced whatever image of a “Valley of Heart’s Delight” in which technical expertise could flourish with only apparent pollution-free production of integrated circuits whose plenty replaced its formerly legendary past agricultural wealth–
–to a not so bucolic region whose landscape can barely conceal its haunting by 23 superfund sites, toxic waste, overcrowded paved arteries, or bleak landscape of grim skies where trees poke through corporate campuses that even the best architectural romanticized futuristic rendering of Google’s new campus can barely disguise. The ever-expanded economy as retained its metaphorical toponym, but almost fully obliterated the abundance valley of the past with an entirely new sort of techno-fertility.
The distorting effect of Silicon Valley were evident in geographer Bill Rankin’s now-dated donut distributions: the Bay Area provided a paradigmatic questions of the blurring of urban and suburban where “concentric rings of wealth and poverty [arise], with the rich both in the suburbs and in the ‘revitalized’ downtown, and the poor stuck in between.”
As Silicon Valley’s economic growth has surpassed the GDP of entire nations, the naturalization of the “Valley” as a site of growth has concealed the consequences of its inevitable expansion are increasingly impossible to ignore.
The dialectic of the expansion of Silicon Valley has spread whatever actual greenery that remains in the region to the periphery of its apparently expansive economic growth–at the same time as its privileged concentration of corporations created a new self-proclaimed Eden and “Valley of Heart’s Delight”–as it has become something more like a Valley of Consumers’ Desire.
whose most prominent former start-ups congregate in an even more tightly bound settlement along freeways that run from Sunnyvale to Cupertino to San Jose:
The continued growth of “Silicon Valley” was perhaps long based on disrupting and erasing the boundaries of its former farms, and then of displacing or surpassing the productivity of past firms that settled in the region: the tongue-in-cheek adoption of the agricultural metaphor to describe the micro-culture of a region came to designate the way its economy stood apart with one foot in the future, evoking a place with new business practices and sources of entrepreneurial investment, it also denoted a concretization of a business practice that proved particularly challenging to give a visible or apparent site on the map. But the continuity of designing new products for consumption was always central to its growth, as was the marketing of a new network of the interlinked.
Rather than questions the continued swarming of Silicon Valley with start-ups, tech workers, coders and entrepreneurs, this post raises questions about the consequences and stability of a place defined by the continued swarming of capital to a single site–and question the sustainability of such swarming, as well as its causes. As much as exploiting the mythology of the fertile valley around Santa Clara and San Jose, it has been argued that the myth of Silicon Valley exists at an unclear overlap between a promotion and a locus of production, and a network that is both challenging and quite difficult to map: what mapping Silicon Valley would mean is indeed hard to say, for even as it is a highway destination and legendary site for start-ups, now permanently part of the economic landscape of modern America, its impact on the region has so outgrown and upended its immediate landscape to become paradigmatic as a locus of the blurring of nature and culture, even as it entertains that “Silicon” and “Valley” once belonged to separate domains.
The ways that nature and culture are yoked in the very term for a region that neither occupies no individual “valley” or has anything but the most mutable–if exclusively defined–boundaries capture the complex ecology of an economy that is still in the process of being mapped, and has compelled its own mapping as we seek to understand the elusive meaning of a region that has so disproportionately loomed large in our national consciousness. For despite its apparent naturalization of place, the region is of course absent from most actual maps, as that of even contemporary maps of the once-fertile region’s coasts and waterways, the conflation of culture and nature in “Silicon Valley” makes the complex ecology of the region’s economy and industry increasingly important to map, and to map in the region that it inhabits.
Silicon Valley has not only redefined the relation of place and space, but increasingly intrudes on the uniform distribution of space on a map: it ecology indeed disrupts the very continuity and stability that one associates with a geographic map. While drawing sustenance from inflation of the value of its products, first as the clearing house that for so long transformed Silicon Chips into microprocessors and now as new forms of networking and interface, the Valley emulates the “disruptive innovation” that has become a dogma of displacing earlier technologies, disrupting existing markets by creating new markets for features so successful that are increasingly omnipresent parts of our daily life, by disrupting the ecology of a bound or circumscribed place. Rather than suggesting a tacit dogma the Valley defined, before Clayton Christensen theorized it as “Disruptive Innovation,” as entrepreneurs and engineers to focus on the applications of semiconductors for products of daily life–small microchips; business machines; personal computers; telephones; online services–before Christensen gave a positive twist to Schumpeter’s conviction s that such an economy of “creative destruction” would cause capitalistic society to end.
Can a region built on successive disruptive innovations be either indicated or rendered on the flat continuity of a map? Or is the apparent instability of “Creative Disruption” of displacing networks of communication far less disruptive than Christensen would argue, and based on a stability of place?
If Disruptive Innovation is premised on creating new markets that didn’t earlier exist, and reinventing a business model at ever decreasing profit margins, the stability of Silicon Valley suggests the continued marketing of linkages symbolic, imaginary, and actual. If the dogma of “disruptive innovation,” unlike the sustaining innovations that aim to innovate more speedily as needs evolve, work by creating new markets through services earlier unimaginable or inaccessible to most, from the personal computer that rapidly produced circuit boards and microprocessors of silicon chips, the “Battle for Customer Interface” has long been a constant in the region’s growth.
3. Any “map” of ‘Silicon Valley’ is a proposal and projection, as well as a fantasy, their orienting abilities have considerable staying power. If all maps are constructions, maps of Silicon Valley provide a particularly useful way to come to terms with the evanescent nature of its local ecosystem all too evanescent to perceive, and too complex to grasp in ways reduced to a single visualization. The mythos of “Silicon Valley” has grown in pace with its technologies, as a hybrid of software and commerce, circuitboards or even silicon chips, has attracted capital to the region. Its very economy is increasingly felt in the successive waves of residential displacement around the Bay Area, by which the effects of the continued investment it attracts and economic growth of its performance are immediately felt, and mapped by Trulia in the rising real estate values.
The metaphorical permanence of a fertile region has held, all the time, as former farmlands have become a site of cross-fertilization, growing talent, whose fertility is based on the ever-growing engines of corporate entities–
Such disruptive innovation creates markets that didn’t exist before, and reinventing a business model about producing cheaper products at lower profit margins, and attract increasing numbers of engineers, corporations, investors and clients interested in riding its peculiar and particular ecology in ways that are not perceived to lie outside its economic microclimate. The swarming of the region has disrupted a delicate regional ecology, coopting and displacing earlier networks of value, but recast disruption as flourishing. Ever since metonymy was first conflated with toponymy forty-five years ago, rebranding naturalized the region’s economic growth as a new wave of the economy, and agrarian metaphors have conflated toponym and metonymy in ways that invested the region with a sheen and imagined coherence as a geography of hope, Silicon Valley has been mapped as a site of limitless economic growth of ever-expanding amorphous boundaries on Google Maps–the traditional mode of mapping in the Valley.
Who could have foretold the current expansion of the region once rooted in the fertile plains of the Santa Clara Valley with an amorphous area on the verge of consuming a significant amount of the Bay Area, generating a distinct rhythm of work that was sustained by new forms of investment and a new market for goods? Even while the apparent mobility of tech has grown, the resilience of the name on which sales force teams had hit–“Silicon Valley”–has stuck as a space with connotations of continued fertility, lent coherence to its components even across a dot-com bust-and-crash: metaphorically and conceptually, as a distinct ecosystem whose economy remained more resilient than that of the nation. For “Silicon Valley” retains a distinctly privileged place in our mental imaginary–both as a desired destination and a site of innovation aimed to be recreated elsewhere–despite the challenges in defining the aura of the region’s promise as a material space in cartographical terms.
Perhaps this is due to the largely insider nature inherent in how Silicon Valley is perceived as a place. The insider nature of the region was recently exploited with great success by former software-worker Mike Judge as a theme for the eponymous HBO series, “Silicon Valley,” with remarkable international appeal. The place-name is a basis for its narrative has proved a source of intense curiosity and cartographical investigation, if only in the hope to reveal the hidden mechanics that might explain the hidden culture that ostensibly animates the region.
The designation of the Valley has provided a huge source of its attraction and appeal–and the lure of its green hills that defined it as a destination and a site deserving of investors’ attention that led it to be so prominently foregrounded on their maps–so much so that rather than directly puncture or satire the hype of start-up culture and the values of techies or entrepreneurs, the show seems more of a situation comedy that is sprinkled with tech jargon and adult humor, which admires a shrine of tech culture from afar. Silicon Valley has constantly rewritten its own present, lending the very notion of mapping a center of hi-tech that assumed its own the notions of natural fertility considerable cognitive appeal.
Innovation was always inscribed on its landscape. As early as 1982, Moira Johnston observed that even if “Silicon Valley appears on no map, this former California prune patch is [now] the heartland of an electronics revolution that may prove as far-reaching as the Industrial Revolution of the nineteenth century” and “cutting edge technology stumbling over itself its competitive a rush to the marketplace.” The region quickly captured one-fifth of the global market for silicon chips, then valued at over 15 billion, creating ties to a marketplace even as microprocessors manufacturing has receded into its long-distant past, and enjoyed an amazing resilience as a center of investment, entrepreneurial capitalism and redefinition of new online providers of web-based services. The conceptual work of remapping the industry that “Silicon Valley” provided helped in the material construction of the region, giving its material creation and consequences an air of stability, and even inevitability. Although the chip fabrication factories that used to dot a zone once manufacturing integrated circuits and semiconductors are shuttered, and in the corporations in Silicon Valley increasing attention is gained by “napkin” products of marketing ingenuity, the growth of the compressive capacities of silicon chips remain emblematic of a Valley that continues to warp our sense of space, and be talismanic for the Next Big Thing. Even as silicon wafers have come to take the form of chiplets more easily printed than etched, their use as microprocessors or repositories of memory will continue to expand online platforms, driven by the doubling every two years of the transistors able to be etched onto a silicon chip.
4. The former fruit orchards once known primarily for its production of semi-conductors, was quickly designated the epicenter of a new economy, and continues to occupy a privileged place in our mental imaginaries as a new geography of work and wealth. Its individuality has come to stand for the transformation of much, if not all, of northern California–displacing the region with new technologies of the personal and an economy approaching libertarian ideals. The industry that so famously concealing its waste-products and smokestacks to play off of the bucolic scenery of a formerly fertile landscape of plums, apricots, and cherries has so successfully styled itself after the agrarian fecundity it effectively displaced. Renaming the region of such agricultural fertility “Silicon Valley” was not only a sleight of hand of marketers: it naturalized the growth of the new landscape of the region as a guarantee of economic promise, as much as it created a clever brand, and redefined the region as typifying a new rhythm of work, where circuits were confounded with in ways that have rewritten the once-Golden State by providing a new focus for capital and new market for employment.
The promise of Silicon Valley as a beacon of entrepreneurship and investment, as well as personal advancement, has almost forgot its historical origins, so rapidly did it identify itself with a new economy. If for the fictional innocent Mae, whose arrival Dave Eggers chronicles in his recent parable of networked information, The Circle, can only marvel at the different region in which she has come to work, with its burnished workspaces and glass buildings promoting the promise of transparency in terms of the new mental geography that it offers as she navigates its workspace–Mae gains the impression that “The rest of America…seemed like some chaotic mess in the developing world“—the status of Silicon Valley as a unique site of investment and corporate clustering both demand to be mapped–and frequently are–in order to understand the continued preeminence that place holds not only as the world is increasingly interlinked, but in ways that capitalize on the distinct centrality it has maintained in an ecology of information.
Already by 1996, much of the world was tied, by high fiber cable, to the United States, on the ocean floor, that has expanded by 2011 to a global ring:
Yet very reasons for the preeminence of Silicon Valley as a place has proved far more difficult to map–both since the mapping of Silicon Valley offers little clear explanation of the dominance the region enjoys as a place and a region of investment, and the unique place that it continued to claim within a world that is increasingly interconnected on networks–and indeed depends on tools of computing drawn from truly global economic reach–both for IT workers and for rare metals that go into keyboard circuitry. The computer networks that span the world seems not to demand any single location, but an apparently amorphous ‘Silicon Valley’ continues to retain astounding corporate density in an age of outsourcing. And even the most generic maps of Silicon Valley purport to offer their viewers an “insider”-view, charting continued expansion in Silicon Valley’s tech industry–even as that expansion runs against its metaphorical insistence on regional fertility.
Not only have the real constraints on water-use that have challenged its narrative of boundless growth. Growing conflicts around water-rights have only pointed up the warping of space and the privileging of location created by the continued prominence of Silicon Valley, for all the apparent mobility of the internet and placelessness of computer networks. The quite elastically bound region that is an epicenter of ecommerce has concealed or smoothed over a rich palimpsest of inter-generational corporate dynasties, from Hewlett Packard and Apple through Facebook, LinkedIn and Google, but created a stability in place even as it has so radically redefined landscapes once marked by farmers or manufacturers of chips, from Fairchild Dynamics or Intel, that have nourished them: for Silicon Valley is, if nothing else, appropriately named as it is defined by its own ecosystems of intellectual communities, engineers, coders and material cultures, if these ecosystems are less dependent on rich aquifers that formerly watered the acres of fruit trees that were cultivated in the region’s fertile plains.
But the network that has replaced and be written over its previous landscape has retained centrality in a unique economy on a global scale that seems to deny accepted standards of measurement.
Yet can the ecosystem continue to be actually sustained? One might begin, in a very literal fashion, from the often concealed landscape in which Silicon Valley was spun, to unpack the metaphorics of eternal fertility that led its very toponym to be so optimistically coined. Even though the economy of Valley’s geography is no longer so dependent on its water-table–
and even if it may have begun recover the long-term displacement of water from the region and arrested its story of subsidence from the mid-1960s–
the actual ecosystem filled by start-ups, coders, engineers and venture capital that fill the long narrow trough once so intensively cultivated for fruit is now paved over to be serviced by the corporate campuses that dot the freeways that ring the amorphously growing region, rather than being an actual physical destination, or be able to be arrived at by conventional means. Arriving means gaining sufficient capital, and being a sufficiently global player enough to be visible local.
“You know this isn’t what you might call a clock-in, clocked out type of company. Does that make sense?”
–Dave Eggers, The Circle
5. The notion of a “place” seems almost foreign to describe the space of transit of engineers, corporations, and capital in Silicon Valley–a “space” which, in so far as it exists, parallels Marc Augé’s poetic notion of a “non-place” or the sprawling spaces of “supermodernity” filled with an abundant density of events–if it is not paradigmatic of it. For Augé argued that the abundance of super modernity is unique as its crowding of events each insistently demanding its own interpretation and clamor for the town attention as if to make the totality difficult if not impossible to comprehend: Augé’s “non-places” generate “thin” abstractions which each individually upend an ability to locate culture in place and time.
As much as defining an economic niche, for all the apparent topophilia of its designation as a place or destination, the network of Silicon has proved increasingly difficult to define over time. Rather than existing in one place, moreover, despite its pronounced self-declared exceptionality and insularity as a biological and economic niche, Silicon Valley exists in dialogue with the very past of the region that it has erased–and concealed. The paved worlds of Silicon Valley are best defined now by the “non-place” of interesecting freeways, interstates, and roads, over-writing its earlier landscapes, and spaces of transport by which substantially more tech workers are drawn to Santa Clara valley than anywhere in the state, creating a swarming that challenges the viability and coherence of its ecosystem, even as it creates a new space of work.
If once existing in relation to a specific chains of production and manufacturing, embodied in the fabrication of semi-conductors, circuit boards, or silicon chips, as well as integrated circuits, the increased remove of Silicon Valley from a site of production–and its increased reliance on user interfaces from ecommerce to maps to datafarming–indeed suggests that its extraordinary density of investment, capital, and economy is increasingly dependent on universalized relations to a phone, tablet, or computer screen. The increased remove at which Silicon Valley stands from a supply chain or indeed products from 2015 offers a very odd backdrop for its increased attraction of engineers and employment, and indeed the consolidation of economic power and in one place. where global capital seems to concentrate, even as its source of capital lies in the creation of an effective interface that demands no actual geographic center–but continues to attract increasingly unheard of levels of investment–but whose very landscape erases whatever specificity was once prized in Santa Clara Valley in the not-so-distant past.
Indeed, the upending of culture as a set of practices that are localized in time and space is very much what Silicon Valley has created and promises.
The actual longterm instability of the landscape of Silicon Valley lies on a cutting edge of economic models geared to global investment that increasingly never seem rooted in space, and generated the unique topography of capital investment it promised.
If the separate dynamics and logic of Silicon Valley always prided itself as depending on levels of technical expertise and communication networks never quite known to or kenned by outsiders, the invitation to explore the topography of the Valley and its impact on the region remain one of the most mapped subjects of recent years, largely for the often illusory promise of transparency that maps of Silicon Valley’s work arrangements and structures of investment seem to offer, and the increasing disruptions that the illusion of the region’s fecundity has wrought on its lived landscape in recent years, in such different ways that the optimistic promises of local abundance of the serially produced vanity maps of businesses that have colonized the region and lent integrity to an area that now spans not only the peninsula but much of South San Francisco, Marin, and the East Bay–and has left an indelible mark on the configuration of the region as a whole.
Maps serve as visualizations for putting issues on the table that open them to future discussion, embodying networks and ties that can be better detected and discerned, as well as serving to orient viewers to their spatial situation or location. The vanity maps of Silicon Valley that are widely marketed as well as designed as promotional copy devised and distributed by Michael Desrosiers of Silicon Maps carry a perpetual promise of insider knowledge. The images of a proliferation of corporate synergy that is itself generative has long overshadowed the individual successes and failures of Silicon Valley. The mapping of the corporate collective that subsumes the suburban reality of the region has grown so large so as to supersede geography itself–even as it trumpeted a distinctly new geography of work from the get-go. For Silicon Valley was readily recast from an area of bountiful agrarian production to a symbolic site of new productivity of the microchip, whose invisible laborers produced and synthesized silicon chips, but whose intellectual economy provided its real engines, created a geography of work long difficult to locate or define.
The economy has shifted over the past five decades, to be sure, as its corporate engines have shifted from the chip and monitor. But the image of perpetual fertility have sustained a toponym that helped define one of the greatest economic concentrations in the economy of the United States and of the new global economy: the place has become paradigmatic of the compression of time and space that allow globalism to exist. In the sole instance of the perseverance of an image of localism, the former agrarian region became a desirable destination whose moniker cemented connotations of fertility, and assumed imposing prominence in our collective mental imaginary as a place for reaping unheard economic margins, whose open-ness as a new economy would redefine online communications–casting aside hardware and software (Fortran; ASCI; Unix; Linux; etc.), as if they were so many antiquated agricultural implements.
6. For Silicon Valley is engaged in a perpetual practice of remapping, as much as charting a new economy of its own. The rewriting recasting of the once rural region mystified its own origins as a new geography of work. First concentrated in offices of engineers, coders, and platform designers, the region’s geography has produced a mythic landscape that increasingly difficult to map uniformly but defined by sites of production, centers of manufacture, or industrial relations.
And the impact of the forty-year swarming of the region has also created an untenable situation of little sustainability or foresight, growing by taking advantage of pro-commerce policies and politics, but fostering rising unsustainable practices on a region whose unclear mapping is almost akin to the optimism that lead to a failure to map or monitor the water table, much as what is actually produced in and around Silicon Valley has become, for all the championing of its productiveness and economic engines, increasingly difficult to clearly define. At a time when Tom Goodwin can readily admit that the real “Battle is for Customer Interface,” rather than spaces of work or supply chains that are situated in space, the mapping of the recent swarming of Silicon Valley serves as an extended occasion to open up questions about why the Valley still continues to exist, and whether the romance of situating one site of such density for Tech investment will long remain so strongly situated in a single place.
It is apt that the many commercial maps of Silicon Valley suggest a deceptive open-ness of access even as they celebrate the clubbiness and power of a select number of tech companies that have increasingly come to dominate its space. For the same values have simultaneously lent continued interest to the project of “mapping” the economic activities of the region and defining a place that is increasingly difficult to define in meaningful ways on the map. In an expansive geography bursting the boundaries of the freeways by which is navigated the space that was ringed by paved, crowded freeways like the 101, 280, 880, and negotiated along the 237, and 84, the growing corporate zone long straddling multiple municipalities is defined primarily by inhabitants who were not its actual residents, who congregated along in lots and embody the region. For even as its economy seems to have had decreasing relevance to its geographical position in space, the region has come to embody an economic engine identified with unbounded hopes of California itself.
7. The contradictions of how what seems a placeless product have proved spatially fixed, and indeed densely located, reflect not only a concentration of entrepreneurial investments, but a crowding of corporate cultures that may prove unsustainable to the region. If the properties were first sold by Stanford University to attract businesses to the region, the region developed its insularity as a highly educated hotbed of programmers, coders, and engineers, and increasingly become known by the money that moved through its undefined space. And if the sixteenth century mapper of the world, the early modern geographer and engraver Abraham Ortelius, could confidently note that “because every part of the world will have its own map as well in this book, and will be discussed at some length,” in his Theatrum Orbis Terrarum circa 1570, promising to achieve complete coverage of the Ptolemaic ecumene, or inhabited world, “together with the land they constitute the entire globe,” Silicon Valley has proved an oddly insular microcosm of global finance. Its contours an limits not easily able to define or to be recreated anywhere else on the globe.
Despite its changing cast of characters, the unique conglomeration of corporate culture on the Southern Bay has grown in ways that demand to be mapped. Desrosiers’ annually produced maps offer a barometer of corporations across region whose insularity has long segregated it from the world in the annually-produced (and somewhat goofy) vanity maps of the region that offered corporate social registers for the past twenty-five years, acquiring unforeseen popularity since 1989, and even generating $1.7 million in annual sales in 2001 befits the region, if they’ve also been dismissed as “map porn” for recapitulating the very claims of universalism that Silicon Valley has claimed to represent as the center of a newly wired world. The publicity-rich promotional pictorial maps which chart the continuing corporate crowding of the region, even across the dot com bust to the economic upturn of recent years, with its hortatory call to “Put Your Company On the Map,” makes the vision of the Valley the promise of the maps they themselves sell. Joining the map in a prominent manner is a means to place the individual corporation within a complex of innovative practices by which the region’s landscape has come to be defined and to concretize.
Paradoxically, perhaps, global recognition value is what is required to be visible on the local map.
The almost comically colorful promotional corporate maps crafted by Silicon Maps are not surveyed, but exploit and package the insularity of Silicon Valley and mirror of the turn to globalization, and the worldwide reach of the corporations clustered there. For although Silicon Valley lacks precise contours, to be sure, or a center, and defied the categories that would have made it easy to map, the mapping of the region and the affirmation of its unique incubating matrix as a site of density have long been important to advertise its own luster: so has the image of a still-verdant region, illuminated as if by perpetual sun, beneath the leisure like activities of ballooning, sailing, and pleasure drives, even if it is ostensibly a land of work, an area of transit for planes and cars, with no workers visible–and whose proliferation of profits is reflected in its forest of business cards. An early influence for the poster, perhaps, can be detected in the little-appreciated board game In the Chips: Silicon Valley, designed circa 1980 by a former high school classmate of Steve Wozniak and Steve Jobs, sold in the South San Francisco Box Factory, a center for paper products, provided one of the first “board game” maps of corporate career paths in the formerly bucolic region. Although quickly criticized as “basically a vehicle for local businesses to advertise in a board game,” it offered but an inkling of the permutation of the landscape that was to come–registering the density of the corporate clustering of Hewlett Packard, Intel and Varian Associates, its players advancing with dice to pass “Salary Increase,” as if to celebrate the new gamesmanship of crafting an alternate pathway to fortune, as much as a new community of commerce:
‘
While it may seem perverse to chart the region marked by innovation by means of a static map, the image provides a reflection of the spatial imaginary that Silicon Valley has become: the images that Desrosiers and company fabricate suggest the nature of Silicon Valley as simultaneously both a physical transitory space that one can enter and a mental space that is less able to be entered into or render visible, and a set of actors who compete for investors’ attention and whose products compete among consumers. The serial production of these maps over twenty-five years suggests their shifting contours of changing characters, as much as they affirm the stability of its scale or its static nature. For the maps suggest the distributed nature of Silicon Valley as a network, and the shifting nature of that network as a locus of technological production and economic vitality all over the world. The evolution of this distributed network suggests an archipelago of corporations whose actors often both circulated among each other and whose investors changed, maintained its symbolic and unity over an extended period of time, if not constituted its own order in and unto itself.
8. The image of Silicon Valley creates was never intended to describe only what lies within its own parameters, however, but also to provide a commentary and gloss on how the organization of one area exists an angle to existing concepts of and experience of space. And so it seems particularly apt that the relation of Silicon Valley to the space around it of private bus lines that ferry workers to Silicon Valley provides a counter-map that serves to problematize the very issue of the Valley’s relation to transit space. The timely visualization revealed routes of private commuter busses that tied the workspace of Silicon Valley to the city of San Francisco; it opened many eyes to a hidden network of transport created to ferry engineers, techies, and designers, if not executives, to amorphous worksites removed from an urban place, and put the question of Silicon Valley’s intentional remove from an urban infrastructure.
Fora subsequent generation, “The City From the Valley” traced the creation of an exclusive transport network that create and reflect a distinct relation so space: with a nod to the color-scheme of Massimo Vignelli’s color-coded New York City modernistic Transit Map of 1972, Eric Rodenbeck and Stamen colleagues imagined the stops of these exclusive lines as if transit hubs to shift lines, adapting Vigelli’s cartographic iconography as a tacit commentary on their very exclusivity. Whereas Vignelli opened access to urban space, the private IT bus lines appear as a separate transit web imposed on iSan Francisco’s infrastructure–yet existing outside it–carrying inhabitants outside the city to a new destination, and ferrying money into the city, mapping the existence of Silicon Valley at an angle to San Francisco’s infrastructure by the exclusive bus lines that transported workers to the Valley, tracing a progression that imposed its own sense of space on the region:
The City and the Valley (2012) (Copyright Stamen design)
“The City and the Valley” reveals the private buses that feed giants of Silicon Valley from the Mission neighborhood in which Stamen is based, but also a cartographical broadside against its secret economy. While Stamen is known for mapping data flows in dynamic ways, Rodenbeck used a team of surveyors used Field Papers to plot once-secret exclusive lines for ferried workers to the Valley’s biggest corporate workspaces that direct attention to changes all too easily often go overlooked, and shape how Silicon Valley corporations have changed our relation to space: the apparent draining of San Francisco workers is less the point than the hidden daily migration (or “forced” march?) of techies to the peninsula.
The 2012 map launched an almost explicit cartographical invective against Silicon Valley’s relation to the city from a champion of open-source data, unlike the secret API codes effectively monetized Google–by so far the largest operator of bus-lines they are collectively classified as “Google Busses.” (The Field Papers program is available as a free download on Stamen’s website.) Rodenbeck acknowledged Massimo Vignelli’s public transit map as a model,but the visualization also echoes the iconic map by which the retired civil engineer Charles-Joseph Minard mapped the steep losses incurred by retreating infantry and soldiers that the Napoleonic army incurred from the Moscow campaign of 1812 by using shifting the band-widths to indicate the army’s loss of soldiers along its path of retreat through Europe after the disastrously humiliating the campaign–the streams of flow tracing private bus lines that feed Silicon Valley with a daily forced migration of tech workers suggest the massive size efflux of workers along a parallel system of private transportation, from the city streets in the very same Mission area neighborhood as Stamen design, as if to suggest how the commercial expansion of the Valley has changed many of the tech workers’ own relations to space in ways that warped the city of San Francisco itself: Edward Tufte praised the graphic economy of the condensation of meanings in Minard’s graphical representation of the contraction of the army over space, Stamen’s map of bus-lines gained a powerful symbolic status not only as charting the formerly hidden highways by which Googlers and others make inroads in public transit systems, but a rewriting of public transit and public space. The year of its mapping, 2012, suggests something of a tipping point in the swarming of the Valley and its expansion into San Francisco’s exclusive property market, in what Rebecca Solnit has described as an invasion of the city that has forever changed its dynamic and character.
The burgeoning streams feeding workers along the I-280 and US-101 are shown as an abandonment of public transit. But whereas the retired civil engineer Charles-Joseph Minard elegantly drew attention to the endless attrition of those soldiers enlisted on Napoleon’s march to Moscow across Europe in the narrowing band-width of the extensive itinerary that the soldiers were forced to take his 1869 infographic, the map of the “forced” migration of tech workers from the city to the 101 and 280 to their destination on the peninsula of course describes the reverse. The bands of alternate colors and stops gesture to the New York City’s Metropolitan Transit Authority’s famous map of public subway lines, but shows the volume of passengers who abandon public transit in making their commute. The convergence of private bus-lines to Silicon Valley raise implicit questions about its exclusivity, excavating a hidden network of transport by which the economic preeminence of Silicon Valley warps the infrastructure of San Francisco’s changing urban space: from the city, we see the horde’s of computer buses, feeling the exclusivity of the region’s pull, and the economic impact of the salaries they bring back to the city.
Is the story of the parasitical pull of Silicon Valley as an exclusive “rim” economy outside San Francisco only a part of the story of the historical warping of space within the Bay Area that the massive growth of the economy and resources and infrastructure of Silicon Valley now holds? And does the rarely articulated influence of Minard’s work on the Private Bus Lines visualization a suggestion of the deep tragedy of how that growth has warped space in the Bay Area? The busses currently emblazoned with the reminder “THIS BUS REMOVES TWENTY CARS FROM YOUR COMMUTE,” to remind other motorists of their value as a public service, the point of the Stamen map is that Silicon Valley may have engendered a private conception of space that runs against the very notion of a public transportation from which it might benefit–or the common good.
The question of how Silicon Valley can be mapped for the public good, rather than private interests that underpin its expansion, is the subtext of this post. This post poses similar question of how the swarming of Silicon Valley increasingly came to warp the distribution of space across northern California, that perpetrated a hoax on deceptive uniformity or equal distribution of mapped space around the stupendous concentration of capital investment, intellectual property, and initial government investment in creating the region as a new workspace. Encouraged by the almost terminal velocity of its own production of products, and legal copyrights for microcode processors of increasing power, the conceit of “Silicon Valley” is problematic to map in any objective way at the very time that it changed the nature of communications worldwide. If its expansion called into question the situated nature of geography or the geographical situation of human activity, or collective practice, it’s important to remember the inescapability of the existential reality of its geography. For an area increasingly dedicated based on information retrieval and storage, and the open-ness of all knowledge, the space of Silicon Valley has over-written itself multiple times in the very recent past of which almost no trace remains–almost as if memory is obliterated from its landscape.
But even as the networks of computing have rewritten the workplace and our modes of communication, the geographical location of the region where its capital is based is too often obscured by the increasing opacity of most maps. At the same time a suggesting the uncertainty of what a future map of the region that has become so central a conduit of capital might be, this post offers an excavation of Silicon Valley’s relation to its past, and an attempt to resituate in a more detailed landscape. In this sense, its “space” may better correspond to Michel Foucault’s notion of a “heterotopia” of modernity, as a space that stands apart from the conventions that mark the division of space or measuring of time, that seems open to all, but is actually accessible to few, and defies the conventional measurements and criteria of maps. To examine this space, this post aims to consider the steep changes that its growth has wrought on the region’s environment and on its lived space. Rather than map the economic performance of its major players and the genealogies among electronics firms, start-ups, and corporate brachiation of micro-computing, this post attends to how the space of Silicon Valley was redefined as a center of swarming that offsets whatever mobility the internet might allow–and the status of Silicon Valley as a “non-place.”
“Though the company was less than six years old, its name and logo—a circle surrounding a knitted grid, with a small ‘c’ in the center—were already the best-known in the world.”
—Dave Eggers, The Circle
9. The importance of mapping Silicon Valley assumed from its increasing assertion of its importance in the national economy, now important as a way to understand how an increasingly global economy takes so much of its spin from a site of continued entrepreneurial investment and corporate density, even if its center or bounds are difficult to define.
We have come to accept the spread of Silicon Valley from the South Bay as inevitable. But the multiple reasons for its historical formation as a center and a locus for innovation in hi tech might be reviewed. It may be the great real estate deal offered corporations by Stanford University on unused lots leading them, to become a center that prefigured Citizens United in seeing corporations as its inhabitants: lured by low taxes, an available pool of educated workers, and an eventual abundance of software and electronica, to lock into low 1975 real estate prices by 1978, and join what emerged from the 1980s as an entrepreneurial hub, investors helped to be transformed to a site whose economic vitality that, somewhat surprisingly and perhaps unwarrantedly, is eagerly been sought to be emulated worldwide down to its architectural details, as if to recapture the luster of the region as a heavyweight in an international industry.
The maps that Stanford officers used to entice executives to what is today Mountain View, without industrial or corporate presence in the 1950s, in sharp contrast with the skyrocketing real estate prices in today’s Bay Area. If it suggests the long-term investment that predated venture capital funding, it reminds us of how quickly the region’s landscape changed around what seems the expanded plans for downtown San Jose.
Stanford University officials attracting prospective clients to settle businesses in the South Bay, c. 1950
Although never consciously planned as a region, the continuity in coporate clustering from the 1950s through the mid-1980s, when the region won its name, continued long after the dot com bust to resurrect in an Era of Devices with the energy that the personal computer once had: rather than being a center of manufacturing, however, the geographical description of the region–which remains notoriously difficult to define in conventional geographical terms. It perhaps heuristically exists as the material counterpart of the increasing expansion of the all too often undefined deep space Internet we have such trouble to visualize: it is surely symbolic of the economic wealth generated on line, balancing the disembodied phenomenology of User Experience that makes it compelling to map the corporate topography that has assumed so prominent a place in our way of doing business, and indeed in our sociability. But mapping Silicon Valley is also a way of answering the almost perpetual riddle about the replicability of the region that has attracted so much international attention in recent years.
Indeed, we almost need to map this site of corporate clustering that barely exists for its residents, but might be measured by the traffic through the cities of Menlo Park, Cupertino, San Jose, Los Altos, or Fremont now that the existance of a “Valley” barely registers in the mind. But the region also occupies a place in our mental geography of a new El Dorado, and a seat of corporate wealth. As much as a seat of residence, the region was long envisioned as one of corporate belonging in ways that were early represented in Michael Desrosiers’ clever caricature maps, featured in the header to this post, who hit in 1989 on the idea of creating a collage of business cards, prefiguring Where’s Waldo?–which, its website claims, consistently sells over twenty times the volume of other city maps. The mapping of Silicon Valley has continued to survive the dot com bust. As well as charting a corporate “ecosystem,” the maps hold a mirror to the Valley, it creates more than an imagined entity in the mind’s eye, but poses the illusion of a community that can be easily entered and to which admittance can be readily gained.
Silicon Maps, 1991-2014
Even as outsource our own communicative skills and link us to the cloud in an Internet of Things, Silicon Valley expands as a region and what might best be called a ‘non’-place–which lacks a social center constituted by its inhabitants, but expands for those who are able to benefit from its expansion, as the new Greater Silicon Valley that spans loosely from Santa Cruz to Sacramento, in a dispersed economy that rewrites the relation of individuals and tech workers to space.
“Silicon Valley” offers a place where we readily locate the microelectronics industry, biotech, and IT whose bounty seems symbolically inherited from its once abundant crops of apricots, plums, and other fruits. The conceit concealed in its toponymy offered a metaphorical stability that conceals the degree to which it is a place through which cars, traffic, workers, money, and investment move, and in which the highest paid executives in the country live but whose community and environment is being increasingly undermined. The renaming of a region once-fertile with fruit after the surface of integrated circuits etched on one of the most abundant elements oddly displaced the engine of its new economy onto part of a product, the semiconductor, as if to obscure the hidden engines of entrepreneurship and competition that drove the region, much as its intense competition was concealed under a veneer of upbeat optimism and untold profits: the abundant creation of an integrated circuits made from silicon, and the expanding numbers of integrated surfaces to be placed on a chip both at low cost and relative ease, coopted a metaphor of abundance with surprising facility.
“Uber, the world’s largest taxi company, owns no vehicles. Facebook, the world’s most popular media owner, creates no content. Alibaba, the most valuable retailer, has no inventory. And Airbnb, the world’s largest accommodation provider, owns no real estate. Something interesting is happening.”
10. The microprocessors produced on ever-smaller circuit boards defined a new era of electronics products which soon provided a basis for data storage unites of Random Access Memory, pinning the local economy to new forms of intellectual property in computing and new engines of production, epitomized by Intel men in bunny suits or logos like Apple and, later, Facebook. If the congregation of over 3,000 electronics companies in 1980 had defined the region as an agglomeration of small firms and entrepreneurs, contracts for custom-designed integrated circuits led to the commodification of memory chips and the rise of the integrated microprocessor, the expansion of computer-industry startups across the region was cast in an curious chiasmus with the fertility of the ground, as the contraction of farmlands was replaced by new lots, corporate campuses, and offices that drove up real estate prices in the entire region at warp speed. The ever rapid assembly of increasingly powerful circuit boards, melded with the speed of travel among and between manufacturing and corporate sectors along the region’s freeways, soon led a the surface of replication, re-engraving, and a downloading of memory to designate a sector of the economy that seemed to expand worldwide, altering notions of subjectivity and space alike in ways too vast and complex to assess yet, but are epitomized in the activities of assembling and reading blogposts. It is hardly surprising that computer networks have carried so much data to become targets implanted with software to gather sensitive personal information for NSA surveillance, but that the CIA has created its own front company–like In-Q-Tel–to outsource its own intelligence gathering work and defense work, actually raising money for the government and allowing the agency essentially to co-opt technologies to enhance its spying capacities and abilities without any government oversight–leading to programs as “Total Information Awareness” and other data collection and analysis to locate, map and identify hidden potential terrorists networks from online data–and explicitly inviting the firm to “identify, adapt, and deliver innovative technology solutions to support the missions of the Central Intelligence Agency and broader US community.”
Naming the region after a surface for an integrated circuit to be encoded with memory etched has proved a particularly compelling notional map. The name was perfect expression of the utopian nature of Silicon Valley and the big claims for rebuilding information circuits from the ground up. The surface etched for a circuit stuck as a spatial imaginary, because Silicon Valley was in essence engraved from the ground up, encoded with new matrixes of economic structures and circuits of commerce, work, and investment that seemed so ingenious from the start and whose big, big dreams were based on making circuits small, small, small. Even if the region of Silicon Valley is no longer a site of chip manufacture, Silicon Valley became the privileged identifier of an industry by a magical metonymy which seemed able to be extended to a bucolic landscape of northern California.
The naming of the region after the cheaply replicated and infinitely encoded space of the chip has stuck far beyond a marketing ploy in an industry removed from industrial centers, which expanded with the adoption of languages that allowed the sort of large-scale programming able to maintain large software projects, and increasingly expressive code, and readily maintainable operating systems and graphic interface from Windows to OS X to Android, that redefined the wealth of the region and increased investment in its products. As much as a new geography of work, it portended and facilitated new geographies of communication and networked systems: “Silicon Valley” grew as it offered a space of linkage of networks–and through the internet–that removed individuals from their location in a space. Even if Silicon Valley became spatially defined as a geographical entity, it was a lure and an ideal space of the swarming of IT workers, coders, software designers, and entrepreneurs, rather than being a place or location, even if, with globalization, it designates the interlinking of the online world: although Silicon Valley has always been more of a way to move through space than a place–a site bounded by limits and defined on a map–the corporations who settled on the cheap lots of its expanse, encouraged by contracts with the defense industry, assumed the name soon after it gained new attention as a site of expanding returns, producing an endless stream of personal products attracting entrepreneurial investments, that continued to blossom–even when corporations started outsourcing much of the actual manufacturing process to locations overseas, and established satellite distribution centers, service centers, and tax shelters outside California in ways that made the region more glocal than local–if it ever had been.
For Silicon Valley defined itself by its exceptionality as existing outside the usual criteria for measuring space and time. The very problem of defining what “Silicon Valley” was quickly came to stand for a new relation to technology or an unbounded reaction to the online world seems particularly helpful to define as spatial situated if not rooted in a specific place. The name hopefully marked a new sector of the nation’s economy that has since become its most conspicuous and most economically productive, whose continued insularity and exceptionalism seems to have transferred to economic productivity as a point of global envy. But the problem of mapping its relation to space is, in a sense, ignored by fixation on its valuation and productivity. Rather than developing as a community, however, what we call or construe as “Silicon Valley” is not a region, but the network of industries whose code has both become a center of IT employment and disproportionate entrepreneurial investment, although its corporate archipelagos, even as they are mapped locally, continue to exist as oddly separate from its social space–and assumed the odd status of a global center of investment whose definition was difficult to pin down, even if it also had to exist–and defined a setting where IT workers and designers congregated and were drawn–a workspace with uneasy relation to its physical place, creating an uneven playing field worldwide, despite or notwithstanding the bright optimism of their utopian dreams. For Silicon Valley reveals how the world is truly increasingly (or inevitably) spiked:
(The placement of this image of interconnectivity in what seems like the antiquated monitor of an old computer screen not too subtly suggests that the world’s surface is here measured by investment in IT–and the new notion of mapping that it necessitates.)
While the rise of Silicon Valley at the same time as globalization–a trend datable from circa 1989–is a topic that bears further attention, the new potential of silicon chips to organize information that researchers at the Photonics Research Group in Ghent (Belgium) when they created a self-reflexive mapping of the globalization of hi-tech in 2oo9, revealing the survival of an artisanal heritage in an age of big data, etching the quaintly conservative and all too retrograde Robinson projection of the globe at the quite unprecedented scale of 1 trillion:1 on an optical silicon chip of forty micrometers nods to American ingenuity even if it trumpeted tech–not with micrometer calipers, but to boast the abilities of scale reduction. As much as charting space, the chip-map announces global victory of its medium, by illustrating the integration of optical circuits by light modulation, using 200 mm processing to illustrate a million-fold multiplication of components crammed onto one chip on four layers, as a “micromap” of the global scale of web-based interconnectivity.
All maps effectively play with the limits of encoding information to attract visual attention to themselves, and the notion of mapping a practice of coding and encryption seems particularly problematic for the information industry. If this post offers multiple ways of “mapping” the contents and locations and players in Silicon Valley, the region exists most prominently in space as a site of investing and employment–and a site with a premium of claims to intellectual property–than a place that can be occupied: it is a linked and a liminal space, which based itself on a set of protocols for interacting with a screen or monitor, whose mapping was less often about fixed definition than its appraisal.
The region became a center for the concentration not only of entrepreneurial investment but wealth, and was an early site of the super-rich by 2008:
The region continues to exist as an attractive center of investment, but its truncated descriptor never designated a fixed place so much as a lure: its elasticity seemed apt to denote a site that served as something like a nerve center for dispersed fabrication facilities and service centers around the world. The evocative place-name that fabricated the non-place as a location where one was absent, and naturalized an economy that needed no geographical relation to its local economy; masking the oddity of using second most abundant element on Earth as the name for a new industry for investment. At the time that the region had attracted executives to the west coast with promises of stock options and later IPO’s in the 1960s in ways that were a premonition of the subsequent expansion of personal computing and the cognitive rewiring of the Internet, its expansion could not be foreseen, it was already suggestive of a new topology of work. Although some advertising gurus claim to have heard the term in the mid-1960s, the toponymical coinage stuck as something that compellingly signified its nature as an insider culture of innovation and intellectual property where silica somehow replaced the gold standard. The metaphorical image of “silicon growing” that came to explain the expansion of the industry, and to capture the sense of continual innovation that became increasingly removed from the fabrication and assembly plants which migrated overseas.
The metonomy of Silicon Valley perhaps long allowed its complicated topology to be overlooked, as if space or spatial stiltedness did not, in fact, matter: the image of the exactly replication of silicon chips gained traction as a metaphor for this corporate blossoming, and belies the need to map the emergence of steepest economic inequalities and equity that exist in the world. The region was early defined by the amount of investment made in circuitry and the products that they promised. The record funds needed for start-ups in Silicon Valley soon arrived, with executives from the East, as the region morphed from the property lines of the orchards that once defined the Valley of Heart’s Delight, abandoning a fixed shape of fields from which migrant workers supplied the world with what seemed an endless supply of dried apricots, cherries, and prunes, as sales force teams applied the aura of the region’s fertility to the production of personal electronics encoded with the semiconductors and chips that were both products of local labor, often from migrant workers’ families, but where the real money lay in its intellectual properties and the promise to reconnect users everywhere. Silicon Valley has of thirty years provided the matrix for new notions of connectedness on varied platforms, but exists not as a clear workspace, so much as the DOC appellation for corporate entities and the devices that have included ever more powerful microprocessors, from the 4004 that introduced ROM and RAM to ever smaller chips to encode memory to the atom and Pentium, the marketing of technology in products from calculators to personal computers created huge windfall revenues even as the bulk of the wealth it produced has continued to prove particularly elusive for many of its residents.
The preposterous basis for locating a name in a conduit of memory was almost predicated on rewiring the region from the memory of the land. Although “Silicon Valley” firms have been among the most famous for being eager to reduce their carbon footprints, and Going Green, the formerly very fertile area Silicon Valley remains by nature poorly defined as the urbanized areas around the South Bay by Google Maps, which almost traces an outline around an expanded grid of paved streets and semi-suburban grids along the network of freeways by which the region is primarily experienced and defined, as a matrix of roads and exchanges that oddly emulates the labyrinthine pathways of the chip itself:
And while the region’s leaders–Google, Apple, Intel, and Facebook–vaunt their dedication to Green and a low carbon footprint as an order of social responsibility, the region of Silicon Valley rewired the fertiility on the ground, and conceal the greatest dense of superfund sites in the state–despite the recent promises the same companies have made to restore wetlands, banish the “heat islands” of parking lots, and replace asphalt with drought-resistang greenery, as well as, in some cases, even replanting fruit trees: the roof of Facebook’s new building even promises its own ecosystem with hiking trails amidst full-grown trees; Apple plans to plant apricots, pears, and apples.
But is this drive toward restoring local landscapes a sort of weak repentance for the depth of inroads that the companies have made on the environment–or the decreased demand for human labor in the second economy which is not only replacing physical jobs, but making physical jobs disappear. Yet the rapid increasing capacities for computer memory cannot conceal the deep impact that the old manufacturing jobs have left on the land.
More locally, however, Silicon Valley maps itself as a landscape that has long been primarily characterized by corporate productivity and identity–most famously in the pictorial maps designed and annually refashioned by Michael Desrosiers–and how these map onto its reality, rather than in terms of space: for here, the regular rules of time and space do not apply, or objects, as figured in the Desrosiers maps that were produced as the region became integrated within paper maps, hover in an undefined space or matrix, as much as they occupy fixed positions in a perspective plane that one can meaningfully scan.
So much is evident in the collective maps that the largest players of the region devised to remap themselves in the region, channeling the graphical skills and stylistic abilities of Desrosiers’ firm, which has emerged as the region’s collective cartographer from the late 1980s. In the same years as one began to talk about globalization and as Silicon Valley products gained an audience worldwide, the then far smaller enclave of Silicon Valley regularly produced promotional images of itself that held something of a mirror to its expanding industries, stylizing the congregation of corporations between the 101 and 880 as a paradisal group of the newly arrived. The notion of this mirror seems appropriate to the heterotypic construction of the region less as a bounded city or location, remaking of the region as a site for commercial branding and a matrix for massive investments. For even though the “silicon chip” is less emblematic of the region today, and chip manufacturing spread to Asia and offshore areas, the metonym that the toponym promises in this propositional image of the coherence of the region, moving from the individual object (the silicon chip) to the industry, and the name of region that is less due to anything inherent about its place or inhabitants than the software industry it suggests, and the goods that circulate through it–rather than the place that they create. These colorful maps increasingly came to chart the circulation of intellectual capital and the energy of intellectual property–here, the time of microprocessing circuits becomes space–rather than they carry the pretense of spatial orientation or even of defining a fixed location, each serving as a sort of archeology of the business life of the region rather than its land.
If history influences and shapes how we see reality, it also shapes how we understand space. And this erasure of place–and indeed the constitution of the region as less of a fixed place, than a space through which money, goods, capital, intellectual property, and corporations move, as so many commuters–suggests the unique nature of Silicon Valley as a non-place (more on that later), and the triumph of metonymic function over a toponymic stability in its name. For the shifting architecture of Silicon Valley as a metonym for the industry that exists there makes a walking tour of towns like Cupertino, Menlo Park, San Jose or Palo Alto an illuminating illustration of how the arrival of industry changed its relation to the former openness of space. This post examines the constancy in the shifting definition of Silicon Valley in concealing the space it offers to bring together different communities, and remaps the relation of its material creation to what was once the Santa Clara Valley, even as the region expands over space, driven less by a relation to a fixed product, but the spread of investment in the region’s companies online web-based business, and the removed relation to material products that this expansion represents.
Yet was that motion an inevitable product of the region’s longstanding uneasy relation to place? The annual images that map the Valley created by Desrosiers and what is now Silicon Maps replaces regional toponymy with a rough collation of business cards, at an intersection of branding and information, but can hardly be said to really constitute a “space” or “place,” after all. The product provides a telling encomium to the region and its contradictions, and the difficulty of knowing what to map–or what data to choose to examine and foreground–when one looks at the region in which a clustering of corporations have defined themselves as its residents, designed to boost businesses’ market valuation in a region where valuation is the name of the game–noting the “high perceived value to the people who receive it.”
The cornucopia of plenty by which Silicon Valley has been mapped for over thirty years creates a sense of place where one is in fact hard to define. If not absent from the map, the promotional elision of Silicon Valley with its scenery conceals the deep rewriting of the region as something like a board game, with little actual relation to its environment. The power of such a metaphorical remapping of the landscape is deeply tied to the preservation of an ideal of the bucolic setting of Silicon Valley, and its assertion of the ongoing vitality of the Valley as a privileged site of innovation.
11. If cultivating such a market, it pronounces the local degradation of the Valley is masked by pronounced dissonance between its metaphorical mapping and its configuration on the ground. Silicon Valley is viewed quite differently from within or without its corporate spaces. Even as Silicon Valley has generated both a staggering number of jobs and amount of money in one puzzlingly apparently perversely specific geographic location, what is at once so prominent a node of work and investment is particularly difficult to map, in part since it defines itself with such little reference to the material world. (Although “Cupertino” is well-known as Time Zone location, and a surrogate for “Pacific Time,” few know where the site of Apple Computers actually is.) The problem of mapping Silicon Valley is almost one of giving location to a place whose location is scarcely legible.
To be sure, the map itself defined Silicon Valley as a place–remaking it against other images of urban centers as lying outside of a built environment, and not able to be mapped as lying on straight or clearly surveyed lines. Desrosiers’ view of Silicon Valley as a single microcosm–resembling the “microcosmic” city views after the cartoonist Saul Steinberg’s 1976 rendering of westward bird’s-eye view of New York, View of the World from Ninth Avenue, if careful not to infringe on issues of copyright–questions its relation to the concept of place, and indeed of the Valley’s status where the world is no longer understood or measured by fixed lines, but opens before the viewer as a Valley of corporate logos, each moored locally but proliferating world-wide online. The encomia to corporate plenty referenced a longstanding tradition of the encomiastic views of urban architecture; but “freed” from a specific setting, buildings are replaced by corporate structures whose online presence resonate the viewer more than the verdant surroundings to resurrect the forty-five year old slogan that trumpets a bucolic setting of the “glocal”–as if it were environmentally conducive to corporate growth. In conveying an image of corporate stability, the annually reissued map of ‘Silicon Valley’ had come to spread north to San Francisco by 2001, both to reflect the inability for its corporations to be confined, and encompass the multiplication of investment, spinning off of further companies and projects expanded that expanded on the internet and tech boom, spurred by the inflation of real estate and the filling-in of what seemed an open area of cheap land, long before it became such a prime site for global commerce to an extent difficult for individuals to conceive.
The formerly secluded verdant paradise can’t contain the proliferation of brands formerly nested in its landscape as more corporations wanted to show clients that they had arrived. It also signaled the break with the past–and with past models of business–that Silicon Valley cultivated, even as it grew into a hub of global commerce.
The improbably pastoral metaphor naturalized how the new collectives of corporations had spread across much of the Bay Area, assuming individual identities as persons that predates how the Citizens United decision removed limits on individual corporate expenditures in politics– echoing the largely libertarian ethos of the region. The connotations of abundance and fertility in the toponym is reified in the publicity maps marketed annually by Silicon Maps, who pictorial maps, such as that pictured in the header to this post, suggest the difference between how Silicon Valley is viewed quite differently from within or without its corporate spaces.
The deep cognitive dissonance between this metaphorical mapping and the crowded configuration on the ground, and the perennial attractive sheen perpetuated in Desrosiers’ color-saturated tableaux depicting a space the viewer wants to inhabit, but that seems absent for the uninitiated. The expansion of its space isn’t irrational, but has created a tight-knit community both expansive and insular in its parts: it is something like both a utopic space that conceals its status as a “non-place,” to borrow the term of the French anthropologist Marc Augé, who has argued that a range of similar “in-between spaces”–spaces for moving between and betwixt, from airports to highways to the computer terminal’s interface–convey a sense of placeless rather than the stability of tradition as liminal spaces. Such a “non-place,” to be sure, breaks down distinctions between workspace and playspace, and between such givens as private and public space: it is a space through which things travel through, even as it lacked its own center or geographical stability. Indeed, they mask the longstanding degradation of the region, by picturing it as a destination akin to an older era’s board game–a game from the time of the first map Desrosiers designed, as if a hybrid of such classic boardgames like Candyland or Carriers.
The swarming of Silicon Valley refers both to the arrival of workers in the region, where some 30% of the workforce is tied to high-tech, and successfully seeking and attracting workers from much of the country, and, often, restricting hiring from competive companies, purportedly to keep salaries from rising out of control. Counties like Santa Clara, San Mateo, and San Francisco revealed the strongest gains in jobs in high tech in the four year period 2009-13 in the nation, far outpacing the rise of data centers and tech centers in other regions of the country: and despite considerable attention to predicting what would be the “next” Silicon Valley, a question asked since the 1970s, the somewhat surprising durability of the region in an age of globalization seems of unique geographical magnetism as much as its economic interest.
.
The academic nature of the problem raises questions not only of PR or branding, but the critical mass of programmers and coders who gravitate to the region and not only move between different jobs, but readily gain entrepreneurial backing for their own start-ups that build off of a large pool of engineers. In an age when tech industries seem disembodied from location, the region is no longer advantageous to live in, but Rather than attracting folks by health plans, benefits, or even a particularly stable progressive environment, despite its association with progressive politics.
This post suggests its popularity as a figurative Christening of a region has much to do with how it obviates any critical mapping, and seems to naturalize a warping of the boundaries of the regional and personal–lines otherwise hard to clarify by the conventional signifying structures. For while the contours and expanding area we call “Silicon Valley” is often redrawn and redefined, and the region might exist as one of the most promotionally mapped areas of the world, the lack of an actual location of the Valley makes it challenging to map, even if it considered a primeval “entrepreneurial ecosystem” and remains a place for businesses to stand out. Indeed, the region stands out as one of the sites of the highest concentration of wealthy inhabitants, if it is also characterized by high levels of poverty–and it stands out as a model for future job-creation in ways that make its mapping especially important.
The mapping of Silicon Valley raises the problem of seeing through maps, and understanding the dynamics among the sorts of populations that live there more than has been addressed. And the recent championing of the region not only as a distinct center of entrepreneurial activity, but something of an economic prototype of economic growth in the nation makes it particularly important not only to analyze, but to explore in order to understand the consequences of its particular economic intensity and indeed entrepreneurial hyperactivity. The surprisingly clear definition by the MIT economists Jorge Guzman Scott Stern, who sought to map a distribution of the successful start-ups in the region from 2001provides something of an objective image by assessing the success of new businesses registered in the region from 2001 to 2011, ranking them by number of patents and indices of “meaningful growth” revealed a striking distribution in the region with its epicenter in the Santa Clara Valley.
Long after buildings of chip fabrication, assembly, and production have migrated overseas together with service centers, and the age of manufacturing personal computers appears to have run its course, the continued economic gravity of the region’s intellectual copyrights persist: the ineluctable pull of the region that seems rooted in a name has itself has expanded from a region to a sector of the American economy and, even more broadly, all sites of commerce in software and user experience.
The allegory of productivity that “Silicon Valley” claimed was a sleight of hand that was most likely to be perpetuated in a map. The mapping of Silicon Valley is especially important because Silicon Valley is the sort of site where the question of insider versus outside knowledge is always in the game, and the knowledge of the actual lay of the land a form of secrecy for those in the know. Silicon Valley is a sort of mythical game–a fabulous place or El Dorado–that cannot be pinned in one place, or in a region, even if it seems to naturalize itself as a land of wealth and fortune, built on the illusion of an information economy that it creates–though productivity of the region has a huger carbon footprint than one would acknowledge. For if Silicon Valley remains both a geography of innovation, capital, and work, far more than a space of investment that generates its own concealed toxic waste.
But the manufacturing industry of chips have undermined whatever fertility remained in the formerly agrarian region known as Silicon Valley, which only survives as a reference for its unpredictably abundant economic growth. Indeed, the troping of a natural region of abundance provided a confusion between categories of nature and culture that seemed apt for an area whose exact objects of production could not be grouped or defined–and became the ultimate for of copyrighted insider knowledge themselves. The first poster-maps that tracked the rapid expansion of corporations across Silicon Valley boast an almost oblivious confusion between nature and culture as categories that has only grown over time, as an always poorly defined region that spread municipalities and grew on freeways has spread past its origins in Cupertino, San Jose and Palo Alto as a hub of software start-ups imitated and emulated worldwide, as if it were a proved template for economic success and innovation–and indeed a metaphor for a roadmap–despite Silicon Valley’s complete failure as a community, or as a productive civic and environmental space. Indeed, despite the language of Green that has been adopted at Intel, Google, Apple and Cisco to lower their carbon footprints, the green of Silicon Valley conceal the existence of many deeply toxic superfund sites underground.
Although we think of space as undifferentiated and smooth in its topology, the unlevel clustering and clumping of Silicon Valley reveals a far more complex surface, whose shifting links to its landscape beg to be mapped in its entirety. While the compressing of the history of Silicon Valley’s existence as a place in maps cannot be excavated at one go, this post starts to examine how the mental maps constructed the region as a site of social interaction in ways that have overwhelmed the landscape that used to exist–a landscape which the very name Silicon Valley seems to herald as a land of plenty. This post will consider the difficulty of mapping both the region and consider the lack of any clear roadmap for the future, as the swarming of the region has erased all traces of earlier landscapes, and has grown unprecedentedly from the area of Cupertino to come to occupy a huge stretch of land from Sacramento to Santa Cruz as a Silicon Valley writ large, providing a promise of future storage even as it consumes the land on which it lies.
Cast as a “hub” or an elusively mythic “El Dorado,” the economically productive if uneven terrain of Silicon Valley compelled continued attention and scrutiny and mapping, if not only because how the ways that its collective practices remain specifically spatially situated seem improbable and unclearly understood, unless the degree of investment in the region is understood by being somehow amalgamated to the formerly verdant landscape. But the new relation to work that the region offers on its corporate archipelago is itself a bit lonely, alienating and the landscape pretty foreign.
“‘Safer to build it here. To keep all the patented stuff secure.'”
–Dave Eggers, The Circle
12. The explosive economic and geographic growth of Silicon Valley as an idea over the last fory-five years parallel its own exceptionality in its production, projected to only increase, of items moving from the personal computer and peripherals to devices in our homes. Now plotted beneath a reticulated grid, or shown as such, it is virtually a global stage to itself, fitting for a globalized world. If “Silicon Valley” has changed as a site of corporate corporate congregation, and coders and programmers, as its past has not only fallen away, both with its perpetual positioning of itself in the future, and revaluing of the notion of location, the spatial practices that underlie Silicon Valley’s construction may not be well understood. Although the older landscape has been largely erased by the intensity of economic swarming of the region, the prominence of the region in our vision of the future is disproportionately huge: it is even hard to imagine, given its current prominence, that map of the state of California existed in the mid-1980s without the region on it.
While it is distinguished not only by its economy, but the highly educated workers, highly paid executives, and entrepreneurs it attracts, even as the IT economy spreads world-wide, the continued arrival of highly educated workers, but of firms with relatively low costs of doing business seems, in its insularity, truly separate from the country, reveling in a similar notion of intellectual property. The congregation of corporate wealth across Silicon Valley is difficult to chart objectively in space, and its influence on how space is configured across the Bay Area is difficult to minimize. It is nearly impossible to unpack the historical redefining the Santa Clara Valley and nearby areas as if they constituted a continuous region, or compress the history of the region onto the surface of one map, but the maps provide something of a register for understanding this layering, and examining its consequences for the future of the same landscape.
Indeed the production of products that compress information, relay information, and fabricate memory across ever decreasing material forms also exists–and perhaps gets its most clear materialization–on the map, as something of a cancer that has come to inhabit the land.
As a site of intellectual and technological exchange and innovation, Silicon Valley long asserted its own exceptionality separate from the country, and imagined it had no actual environmental presence–even as that presence has atrophied and grown. If the name “Silicon Valley” conjures the riches of its agrarian past, that past is increasingly removed both in time and space, not only in San Jose but far around. Indeed, the organization of Silicon Valley constitutes such an insider culture, that it creates a marked dissonance between mapped and perceived space.
The swarming of Silicon Valley cannot be best charted empirically, financial, or economically, but in its continued vitality as a privileged site of innovation: the considerable density of competing corporations masks the increasing difficulty of gaining an insider’s view on the complex fortunes and concentration of investment in the region predate the Ages of Google, LinkedIN, Facebook, and Twitter–those economic engines whose business is the extraction of personal data. The region has its own lexicon, albeit one that has been adopted worldwide. To be sure, these corporations have sold products that have changed not only the region, but the face of global interaction–redefining terms that seem extracted from the lexicon of social anxiety of middle school–“liking,” “friendship,” personal communication–to market an altered notion of the personal that has altered forms of sociability and notions of privacy worldwide, in ways that seem to derive from the sheen of calm that radiate from the region of Cupertino, Mountain View, and San Jose.
The economic ascendance of this region has changed our longstanding relation to printed paper, indeed, as a privileged medium of privacy, and linked us to one another in absurd ways. But it is less well noted that the rapid expansion of a single site from which such webs develop has also remade a region in ways that demand to be more clearly mapped, given how their product offers a distinctly new way of relating to space. Can one argue that there was, indeed, a sense of space from which the engines of the internet emerged? Or map its origins in something like a material form, rather than adopting the metaphor of a cloud? Silicon Valley was never a single or fixed “place.” The perpetuation of its fiction and unique status in the world as a center of start-ups and a highly valued software industry perpetuate the fiction that it is a place–and is distinguished as a region that receives at present almost one half of all venture capital investments in the United States, which depends for its continued vitality on an ability to continue to attract suitably skilled tech workers, address problems of both housing and traffic that the swarming to the Valley has posed, and allow similar opportunities for success to the many residents of the region who aren’t or have not profited much from its current astronomical economic growth.
These are steep demands. But it confidently pointed itself to a future, and located that future within the products that it sold. It is no accident that the rise of Silicon Valley as a region included in maps of California parallel the time of the date most widely identified with globalization, 1990–the date the first saw the consciousness of the rise of C02 emissions, and indeed awareness of the interlinked nature of global warming to local industries: the clean of Silicon Valley, if illusory, as we shall see below, may have indeed provided a large part of its particular sheen in the South Bay. A compelling conceit of “Silicon Valley” is almost impossible to define on the map. For it offers an “other space” of shifting definition objectively impossible to “map” as a fixed region or an archipelago with stable directions of growth.
Silicon Valley’s longstanding mutability–and indeed its erasure of its past–has made the term a valuable conceit, however, not only to define its difference from the rest of the working world but to imagine that it does exist. The unique nature of how Silicon Valley exists by a distinct set of rules for competition, innovation, engineering, and investing have generated a sense of swarming frightening because it increasingly sees itself as working best by its own rules, and most often working as primarily responding to an international economy. Its impossibility to be located or fully mapped parallel its increasing insularity. As a region that grew up around the production of silicon chips as a commodity, and expanded on new ways to market and personalize the microprocessor, but went beyond a marketing ploy: it is an illusion of plenty, perhaps, based on the utter availability of all that exists online, and that also seems to in the radically re-configured (and now forgotten) Valley of Dreams, where the most privileged place for “memory” exists in a chip, online, or in the cloud.
Despite the legendary open-ness and meritoriousness of Silicon Valley, the reasons for its narrative of economic exceptionalism remains difficult to map, even as it is eager to be emulated. The felicitous metonymy of its toponym is so removed from geographical place to extend wherever the industry of which it become a metonym has spread, indeed, that what “Silicon Valley” is is less clear than the swarming that it has become. Inhabitants of “Silicon Valley” are more properly mapped as corporations, rather than physical landmarks or actual inhabitants–and the region is best defined by those liminal spaces or heterotopia through which pass monies, patents, engineers, designers, security experts and goods. For despite the specificity of an evocation the region once known as the Santa Clara Valley, the spread of “Silicon Valley,” as its products touch the world, are more difficult to objectively survey than regions of California or the United States: and with even the maps of Silicon Valley insisting on a topical focus, and perpetually redrawn in vague bounds, the parallel compulsion to map Silicon Valley–to try to localize the increasingly floating toponym first coined as a clever compression by marketers, and reveal it as a landscape of its own. For the very same region that grew with the evangelical conviction that its products serve to “make the world a better place” have in turn erased one of the more bucolic places on earth: indeed, local differentiation wha was named Silicon Valley is for the most part vanishing at the same time as it grows by providing an alternate reality mediated by the personal screen. Could one argue that the shifting relation between information to privacy is informed by the world-changing solipsism that Silicon Valley has become, and the apparent relative blindness to the external world that its continued prosperity has perpetuated?
The growth of this capital of prosperity, that has now become perhaps the prime the engine of the American economy, where workers continue to generate more output than anywhere else in the nation was, of course, partly premised upon a changed relation to the land and erasure of its past and a uniquely fluid relation to space and play. The “swarming of the valley improvised an infrastructure of very decisive economic advantages of skills and education, and whose insularity has a history of deeply disturbing and disorienting environmental effects.
Santa Clara Valley, 1914 (from Mount Hamilton), History San Jose
Corbis
The extent of the radical transformation of what might be called the local ecosystem of what is now widely known Silicon Valley–rather than the Santa Clara Valley–can be suggested by a recent mashup of the data that the United Park Service has compiled of sound levels across this region, as part of its larger project of color-coded mapping of sound levels across the nation; the considerably high range of sound around the peninsula to San Jose that the acoustic sensors revealed indicate that an area which has been described as a “rim city” is in fact not only plagued by traffic noise along its freeways, but now almost more polluted with man-made noise as the Port of Oakland or downtown San Francisco, with a longer continuous region defined by sound levels in the highest two ranges–where, of course, each ten decibel intervals mark a doubling of perceptible levels of ambient sound that suggest its widespread commute:
data from National Parks Services’s Division of Natural Sounds and Night Skies, Kurt M. Fristrup; local Bay Area mashup by George Jones
The rising sound levels across Silicon Valley may be marked by the intensity of traffic on its street, but mark an invasion of noise that could suggest a compelling visualization of the swarming of populations far beyond the levels of the past, and a miasmatic expansion of man-made sound-levels across the region that stand in striking dissonance with its relative low density housing. The sound-map reveals the radical remaking of the region to one that is the perhaps the most marked by human activity in the Bay Area, based on the registration of sound-levels on a summer day, that belies the conceit of the confusion of nature and culture in the region’s self-chosen toponym in days when it first emerged as a manufacturing center.
The radical rewriting and rewiring of the landscape recast Silicon Valley as a destination for groups that attract capital, linked it to a growing pool not only of coders and engineers, but of venture capitalists attracted to invest in the region as a site of economic growth. The statsu of the region as a globally unique site of investment and expertise has let its influence be felt by the cascading effects of a clustering of corporate colonies, form the warping of real estate prices, new costs of congestion, and pollution–even as the region retains a name of agricultural origins as a fig-leaf concealing its long-fading bucolic facade.
“It was called the Middle Ages, the Dark Ages. If not for the monks, everything the world had ever learned would have been lost. Well, we live in a similar time, when we’re losing the vast majority of what we do and see and learn. But it doesn’t have to be that way.”
–Dave Eggers, The Circle
13. The almost evangelical confidence in an economic gospel of high tech has created the recent swarming of Silicon Valley that defined it as a region that has consumed what was left of an old agricultural space. “Silicon Valley” was far more than a place from its first naming some forty-five years ago, and rarely appeared on maps of California maps even five years before its corporate settlement was increasingly mapped the logos and locations of its major companies and its charted corporate density beyond the 10, to a region spanning from Santa Cruz to Sacramento. If Silicon Valley is somethings defined as a ‘workspace,’ it is something more like a space of investment, and a mapping of its own future. Despite multiple maps and remapping of the region, its dynamics are hard to capture because its totality resists mapping: the area might be most famously rendered by maps of economic performance, but the poster maps produced annually produced by Silicon Maps of its sun-drenched landscape make a unique promise of the existence of this made-up toponym as a place one can observe, if it is barely visible from the freeways through the region, from which one has no sense of entering a place or space–and indeed on which the individual moves rather than inhabits, and consistently does high quality work. After all, the cultivation of Silicon Valley is partly the cultivation of an image of innovation.
Although these vanity maps are ephemera, but do heavy lifting both in manufacturing this place, and in mapping a space that has merited receiving extensive investment over time. The map succeeds in persuading one that one can comprehend its almost undifferentiated corporate expanse as filled with distinct landmarks and nodes of work among which its visitors pass: the map makes good on the story of a toponymy without etymological significance, but reflects the explosion of interest in the memory stored in the material chip, and the abilities of data compression it allows, and is less a location than a designation of a target for investors. (Toponymy here does not generate metonymy, as Bordeaux wine or Roquefort cheese, but metonymy designates the region it has by extension overwhelmed: the region has itself become a metonym for a way of life adopted world-wide and mediated on one’s “personal” screen.) There are few who would have traffic with all the sites of work that are listed in the Desrosiers’ map, but the accumulation of corporate density is what constitutes the Valley, and may create the best cumulative map of life for those who work within it, and narrates the success story of the region such as it exists as an area where everyone does high quality work that they love.
The figurative notion of the region–a Valley that grows Silicon Chips!–naturalizes the swarming of the region in recent years. And in illustrating the continued symbolic fertility of the region, such promotional maps reflect its settlement of its actual landscape by industry. They document Silicon Valley’s privileged position in our mental imaginary and economy–both as a desired destination and a site of innovation aimed–without recognizable borders, and the conflation of corporate identity with the actual landscape. The expansion of such a “place” over forty-five years demands examination as recreating the region as a center of investment, financial investment, and intellectual innovation affirms its own centrality in an expanding market for security services and interactive industries. For even as the continued centrality of the place of Silicon Valley as a center of start-ups seems contested, the material configuration of Silicon Valley demands to be mapped not for the dynamics of its workspace or the valuation of its multiple corporations but for the difficulty in mapping how its openness as a continued site for ongoing speculation and fertility, concealing the lack of transparency in remaking its landscape as a continuous region that extended far beyond its original historical location, as an abundance of corporations congregated from the 280 to the 680 to remake a territory from a freeways bounding orchards just forty years before.
The quite colorful and seductively silly poster maps designed by Desrosiers’ firms perpetuate multiple myths of the Vally by a particularly clever sleights of hand. They mask the competition of corporations and the environmental impact of their products and the particularly congested settlement of the area from Cupertino to Mountain View to Menlo Park and across Silicon Valley, they reflect that technology companies employ some 27% of the jobs that exist in the region. It’s no secret that the paving over of a huge section of the sun-drenched region once filled with plum and apricot orchards in the Valley’s Mediterranean climate now paved have expanded the demolition of much of San Jose, rendering it more prone to urban heat. Even as Silicon Valley corporations like Google and Yahoo compete for being more green, and, since 2011, Microsoft, ScanDisk, National Semiconductor, and Yahoo have thrown more money at serious efforts of tree-planting with local non-profit Canopy as cities from Palo Alto to San Jose took proprietary ownership and protection of remaining trees–and to renewable energy, the region has remained the most productive area of technology in the nations. Yet the rapid growth of historical San Jose over the past four decades, fed largely by the swarming of Silicon Valley, transformed it from a land of orchards to an area where some 60% of the land is now covered by impervious roads, buildings, and parking lots whose urban tree canopy has often fell below 15% in 2013, when the city council anxiously planned additional potential tree planting sites in its parking lots, sidewalks, and public streets, utterly changing it from the past.
And yet, the removal of many of these allegedly “green” corporate campuses remain far from public transportation, often in ways criticized for their car-dependent design. A considerable degradation of the environment of Silicon Valley occurred with the expansion of a corporate swarming of the region, often poorly mapped by economic metrics of the amount of moneys invested in the region or its economic returns. Despite the potential mobility of Silicon Valley as a space of investment, entrepreneurial interest, and the circulation of commodities, rather than a place of residence or work, the expansion of this corporate map suggests the contradiction between the local site where Fairchild Semiconductors still lies and the expansive region of the Bay Area that has now become an extension of what was once a single region. While Silicon Valley is often mapped as a genealogy of corporations or a shift from industry to consumer goods that emerged as the internet and information highway reconfigured economic life, what would it look like to consider not its corporate networks, but the balance between the access to its space that it seemed to offer and the relative opacity created by its technological and corporate worlds?
The difficulty to map Silicon Valley lies less in its mobility or dynamism, than the ways it seek to normalize its relation to space, defining a single site of origin, even as it continues to cannibalize territory in direct relation to the growth of the traffic of internet-based businesses: the region has become a site for the traffic of money, software expertise, and employment in something of a physical reminder of the expansion of web-based commerce that quite creepily make it best place to mint millionaires–and indeed to produce more millionaires than any country in the world outside the United States as a whole and China, and by far the most economically productive place in the United States of America. The disproportionate economic engine, however, has begun to feel its own growing pains. The perpetuation of an illusion of bucolic harmony is more than a vestige of the region’s old agrarian origins, but a celebration of its uniqueness. The ongoing project of pictorial remapping the region reveals a continual rewriting of the region around the myths of Silicon Valley’s flourishing and uniqueness, and an increasing amnesia toward its own sense of place. This post suggests that the illusion of its continued coherence and vitality has continued to attract entrepreneurial investment by cultivating an idea of open-ness, even if its culture is in fact quite closed.
By using a variety of maps of the region’s inhabitation, it seeks to reconcile the balance between insider and outside perspectives on how its unique relation to space, by offering one that has grown as it has long remained so unclearly mapped. Indeed, a recent mapping of the sites of entrepreneurship–rather than work, property, or legal entities or municipalities–led Scott Stern to map the region as first and foremost as a space of “high-impact entrepreneurship,” rather than as a location, that began in the South Bay, east to Livermore, north to Marin County, and up along the peninsula. Even as Silicon Valley is under assault for the pronounced clubbiness of its culture of programmers and rarely openly examined pronounced lack of female venture capitalists, the region has remained a particularly privileged site for valuation, investment, and speculation unlike other regions in the country that regard it as the space to watch for the Next Big Thing–despite its many possible emulators as tech hubs around the world–from Silicon Hills, Silicon Forest, Silicon Prairie, Silicon Square, Philicon Valley (Philadelphia) to Silicon Allée, Silicon Wadi, Chilecon Valley (Santiago), and many more who seek to define the unique relation of local and global in a post-industrial economy. Yet no space has proved as productive, or as much of a focus of investment.
For the place of Silicon Valley as a node of technology, interactivity and user experience that seems a gateway to global markets seems to be able to be reproduced, but seems to retain a unique relation to space, balancing its ideals of open-ness against the sources of its intense concentration of worldly capital. Its steel and glass smokeless buildings of offices and parks are increasingly integrated into its verdant landscape, as if to blend nature and culture and naturalize the flourishing of its corporations–as much as its residents. Indeed, despite a huge growth in the salaries and benefits of the successful few of the current information economy, the continued stagnation of wages of middle- and lower-income workers’ wages have meant that income inequality across Silicon Valley is increasingly unequal–and few can afford to exist in its currently elevated real estate market, where in four decades a predominantly agricultural economy of land-use has been replaced by a growing of what goes under the name of an “information economy,” whose leaders once preached egalitarianism, and continue to espouse a sort of meritocracy, but where even as the local job market expands, some 20% of household incomes stagnate below 30,000, and a further 35% are between 35,000 and 99,000–even as the region generates extraordinary wealth: incomes of high-wage earners stood some 4.4 times that of low-wage earners, higher than anywhere in California–a quite pronounced high wage/lower income inequality, despite an apparent Gini Coefficient of income inequality approaching zero (0.44461).
As a unique center of investment in the expanding information highway of the early 1990s, the maze of highways in Silicon Valley became nourished by bus-loads of tech workers, software engineers, and coders who moved through what existed more as a non-place–a site through which moved capital, products, and goods, rather than worked in its physical site. Yet the continuity and identity of the region as a site of continued fertility is clear. If as a region it remained difficult to circumscribe, the continued vitality and coherence of Silicon Valley has been an important founding myth for the region: the maps of its landscape, as the annually produced vanity maps in the header to this post, foreground the shifting cast of characters in the region’s main actors, driven by valuation, and reveal a distribution that lacks any localized center or fixed bounds. The myth of the economic insularity of Silicon Valley as a spontaneous generator of profits just recently resurfaced in Barack Obama’s 2015 State of the Union Address, when the President repeated a narrative of how the region created “jobs that didn’t even exist ten or twenty years ago–jobs at companies like Google, and eBay, and Tesla . . .” and privileged the region as emblematic of the most well-off. The continued rhetoric that the Silicon Valley map deploys of corporate plenty had not only infiltrated the State of the Union by 2015, but the President tacitly recognized the its arrival as a significant lobbying force in Washington, as social media now tops the list of big spenders to the tune of $14 million a year.
The attempts to map the growth of a network of its corporate community reveals its distinct character by both currying attention by inviting examination of an insider’s perspective and resisting being objectively mapped, often by revealing contradictions in its own coherence. And at the same time as achieving net neutrality, urging that the strongest “possible rules” to keep the internet open, fast, and without regulation, the laudable endorsement reveals Silicon Valley’s increasingly privileged place as a sizable corporate lobby and newfound political clout. (It seems somewhat cynical hyperbole for the President to cast cyberspace as a new “Wild West” where “everybody is online, and everybody is vulnerable” at a Cybersecurity Summit in Palo Alto, given recent exposure of back-door programs of government surveillance by the NSA, the multiple stops of both President Obama and former President Clinton to the region signal its political prominence.) Are the new faces of Silicon Valley deserving blame for having created a new relation to the world, or are they symptomatic of a global change in the economy of attention with broad consequences? Such a shift even might be explored by excavating the radical transformation of the region known as Silicon Valley and its surroundings–rather than link its growth to a new elite composed of individual CEOs who seem too easily cast as bent on global domination.
If the faces of these CEOs evoke a ruthlessness of a new generation of superheroes, keen on demonstrating their continued strength, the swarming of the region is best embodied in maps to be understood as a consequence of the unique space for investment it creates. The difficulties of mapping Silicon Valley seems rooted in the contradictions between its vaunted openness and the difficulty of understanding the dynamics of its space with anything like transparency. While Silicon Valley has origins in apparently opening its insider network as a landscape of speculation and valuation, the network of investment that animates the valley is of necessity opaque, making objective mapping particularly difficult to render its commercial operations in clearly legible form. Since “Silicon Valley” first appeared in maps of California in the mid-1980s, it has loomed large in the mental imaginary as creating a space for interaction between investors, coders, software engineers, start-ups, and tech workers that blurred familiar lines of investment, work and even physical space. If the term concealed the ways that such an interaction occurred, it has become of the site of a far greater density than its first pioneers could have ever imagined, or that the spawning of business cards across a sun-drenched valley south of San Francisco openly conveyed. Although Der Spiegel hascharacterized the region as bent foisting “forced happiness”–Menschheitsbeglückungswerks–on the world, its concentration of economic activity seems driven by demand for returns, more than cultural values.
For the construction of Silicon Valley is less an effect of its current CEO’s thirst for power, re-writing of rules of global commerce, than a corporate overcrowding that has so long and successfully developed to have forced an increasing number of its “innovation industries” to shutter–as did some 2,500 in 2013–the drive to define oneself in a sea of corporate competition, even as its production of circuits or chips was long eclipsed. The erosion of the open space of Silicon Valley–and the retreat of corporate colonies into individual compounds known now as campuses, may threaten to erased the very trading zones on which Silicon Valley traditionally based its explosion of profits.
“We find your Technology Map to be a most cost effective way to gain visibility as a High Tech leader in the Silicon Valley. We look forward to seeing our logo on the 2003 map/calendar.”
14. The promotional posters Silicon Maps pioneered promote a region by masking its increasingly deep inequalities. Indeed, the absence of a community in a region where corporate practices obscure its own identity as a community: if the map compiles constitute social registries of the region, as a conceit of marketing which would continue to cultivate prospective clients–“Sponsors: Put Your Company on The Map!™”–while orienting viewers to the industrial and corporate centers often hard to see from the road, they perpetuate an insider’s view of its landscape. The poster map seems a surrogate for revealing the growing valuation of their own industries. But as any poster intends to paper over yesterday’s news by today’s actuality, these recurrent annual publications paper over the business dynamics they herald, speaking less to outsiders or visitors than to those already initiated and in the know. The poster map provides a public profile of a company, and something of a sense that it has, indeed, arrived, even as the expansion of “the industry” alters the environment in fundamental ways that are more rarely mapped than the story of its economic success. The maps suggest a sort of board game where visitors can enter, and an imaginarily isolated space that they can explore.
The poster-maps merit scrutiny for how they confront the amorphous constitution of Silicon Valley over time, and the shifting cast of characters it involves.
Silicon Maps, 1991 (detail)
Those annually-produced colorful pictorial maps, one reproduced in the header to this post, records the corporate swarming of Silicon Valley as well as a sort of social register of the region, as much as a map with directionality that might help evidence a sense of itself as a physical space. While the map is an advertisement that is self-made, and Desrosiers solicits local corporations to place themselves on its twisting freeways, the result nicely evokes something like a “non-place”–a site of the transit of products, technology, and funds, served by winding roads, freeways and expressways, familiar to the insider, which one enters on the 101, along its low-density buildings and placards. The sequence of promotional maps, once assembled collectively, suggest the expansion of Silicon Valley as a site of entrepreneurial investment that resists easy interpretation.
The vanity maps of local corporate clusterings have more than totemic value: for they figuratively document the novel semantics of the ever-changing, mutable and actually overlapping spaces of Silicon Valley as a sort of fertility cult whose corporate residents heralds themselves as the site of the future, and the recession of the landscape of its past. If “Silicon Valley” became a place-name as a form of branding, its currency and solidity concealed its own continual reframing and negotiation as a site of corporate logos of varied online platforms, rather than as a specific place, but to manufacture a sense of place of particular attraction. The region emerged as a site funded by government subsidies, to be sure, before emerging as a hotbed of start-ups, but was able to naturalize its own ongoing fertility in ways that concealed the complete transformation of its landscape. Virtually an integrated circuit of its own, the landscape, once naturalized as a center of technological commerce and clean industry, replaced the landscape of orchards that once defined the bucolic nature of the Santa Clara Valley or Valley of Heart’s Delight.
For Silicon Maps marked metaphorical toponym naturalized a landscape of regeneration as a landscape of innovation and perpetuation revaluation in its annually generated maps, even as the site declined as the manufacturing industry for electronics that it once was: what was once a site for producing semiconductors or transistors became one of ongoing innovation in the tech industry and providers of internet platforms and exchange, concealing the transactions and flows of investment that brought it to life, and presenting the many forces it brings into reaction with one another in a global economy with the image of a static location–akin to the landscape of the Santa Clara Valley that it has replaced, and gives an apparent materiality and location to a site which is both difficult to map and based on a world-wide circulation of goods. The maps suggest how Silicon Valley might be mapped both as a conceptual space and against its actual configuration, if only so that we can better gauge the distance between the two, and to consider the unique relation of its “place” as a corporate network, rather than a community. The swarming of the Valley that Desrosiers has continued to map from 1989 so compellingly through the present offers a mirror of the swarming of Silicon Valley far beyond the eighty chip manufacturers that spread along highways from Palo Alto to San Jose, boosted by an availability of cheap (most often immigrant) labor, as had worked its earlier orchards of plums. Even as the actual farmers left the Valley, and the green space far receded, with the swarming of industrial campuses and, soon, islands of corporate minicities on the peninsula, the density of Silicon Valley is difficult to chart, because it seems so spread out. The insularity of the community is as distinct as its much-vaunted open-ness and the premium it placed on a devotion to freedom, equality, and rational thought.
The swarming of Silicon Valley they show is based on a long-standing vangelism of tech, however, as much as for folks in search of work: if not an organized religion in any way, the theology of technology has define logic of the swarming of the Valley–and the mutual recognition of its members–in ways that made Silicon Valley a community of believers hard to map from the outside; it was always a center of investment whose benefits, not so paradoxically, rarely reached most of its residents from who they lay far out of reach. The region providing platforms to the world is not organized as a clear workspace or a set of clear property lines, but as corporate entities and logos, and where the bulk of the wealth produced has proved increasingly elusive for many of its residents, and indeed leads many of its residents to leave.
Cartographical attempts to present its corporate clustering as a verdant bucolic space are evident in the popular maps that defined the region from 1989–the other year of its coming of age. Desrosiers’ maps were explicitly crafted annually for explicitly promotional ends, but their continuous appearance for almost twenty years register how Silicon Valley entailed a conscious re-writing of a performative relation to space, erasing the bucolic scenery that once characterized the Santa Clara Valley first with manufacturing industries that concealed the waste they generated, and then with a constellation of corporations among which the freeways–so integral to its creation–almost disappeared, and toponymy almost vanishes within a network of corporate logos that once recalled business cards in a verdant landscape. Silicon Valley’s predominant industry required no fixed or discrete location, and was situated behind computer terminals, but Desrosiers mapped a sun-drenched space in which brands figuratively blossom, selling its image of fertility, from the year of the Loma Prieta earthquake, as a microcosm of commerce in California’s coast, his maps reveal more about its performative relation to space than the many data visualizations of its productivity or the investments it has attracted, and provide a fitting entrée into an exploration of how Silicon Valley has created a unique relation to its corporate space.
For most conspicuous in the mapping of the region over all of these years is the conspicuous absence of public space. The Silicon Valley mapped for the corporations who dwell there compete with each other, demanding some loyalty and collective hiving off in corporate identities, but are content to set new levels of mixing individual identity and a corporate setting and space, and even adopt what seems a distinctly insular economic climate and mode of communications, and its own adoption of new models of intellectual property that in ways are still closely linked to the silicon chip–years after the factories for producing chips have receded into the background of its corporate culture.
This poster map promises make sense of the constitution of a corporate place in Silicon Valley, as much as the relations between people and objects, or of its actual inhabitants. For Silicon Valley is indeed defined not less by its inhabitants than the corporations based there, from those who responded to invitations from Stanford University to settle in lots sold to attract business to the region to the start ups who congregate in its space. The result created a space through which investors, programmers, start-ups and coders circled each other in ways that would forever alter the lay of the land.
It’s hard to know if there is any clear “outside” Silicon Valley, whose culture permeates the region. Mike Judge’s satire of the culture of programmers, engineers, eccentric venture capitalists, and excess, where money wildly circulates, appeals as an insider story of how Silicon Valley became far more than a fixed geographical place for reasons and escaped categories: bound by the paved paths of route 101 and the 280, and now to 680 or 880 and beyond the 101, and viewed in motion, one negotiates the Valley as a sprawling corporate space straddling municipalities, stretching from San Jose, Santa Clara, and Mountain View to Palo Alto and Foster City or beyond: the region is an interlocking swath of the Bay Area that call attention to themselves, more than a freeway exit, but as a space of transit, through which course large sums of capital as well as creativity–although the focus on the Valley as a source of the production of value has often obscured its own unique sense of space or the space it creates. Silicon Valley is no longer distinguished as one site of entrepreneurial investment, to be sure, but an entire region that has attracted an incredibly significant investment across a growing geographical expanse.
Martin Prosperity Institute
The swarming of investment is somewhat decentralized and widespread. Yet Silicon Valley remains, in a geographic imaginary, a place which advertises where one has arrived–and must pay attention–but exists as only a “place” that one can arrive if one has an insider’s map. Silicon Valley is viewed differently from within or without its corporate spaces, and extremely hard to map for the uninitiated. The actual elusiveness of Silicon Valley rests in being bound by freeway mobility and displacement, as one-time relatively cheap land was converted into corporate campuses, and at the same time being an experience–a fact which Judge captures so perfectly–that is only really able to be perceived by the few who worked there, and take the freeway exist to their sparkling sites of work.
The special place of the region nation-side is more evident in a mapping of venture capital investment across the nation:
Martin Prosperity Institute
Venture Capital Investments from Andreessen Horowitz, In-Q-Tel, NEA, and Kleiner Perkins in 2014
For despite sustained attention to the uniqueness of Silicon Valley’s economy, Silicon Valley is emblematic of a shift in our sense of space and its inhabitation: its growth might be mapped as a relation between firms of electronics and shrinking wilderness formerly characteristic of the region, and, as much as a new culture of work, maps a new reaction between work and space in an area whose former orchards are now largely paved.
Google Maps
As much as the rationality of economic models, the collective action of swarming may provide a helpful model to understand and unpack the historical growth of the Valley’s sustained economic productivity, quite unlike the genealogies of corporations, or IPO’s backed by Google Ventures or other venture capitalists that have been created to describe its generations of commercial growth. For swarming conveys how the expansion of the Valley, or with a fixed center, has spread and grown by quite unique criteria that don’t seem to abide by the rationalist principles of most all programmers or CEOs.
Silicon Valley has been long mythologized as an anti-industrial space, whose unique workspace was defined by synergy and trumpeting itself as a flex space at the forefront of a tech revolution, but the changing relation to space of the region was not fully understood. The physical space of Silicon Valley lacks a center, physical footprint, or in relation to an urban economic environment–even though it seems to stand at the center of the world. Silicon Valley seems defined by an ongoing swarming to Silicon Valley, despite venture capitalist Marc Andreessen’s 2012 prediction that, as work moves to the cloud, “software is eating the world” erasing the distinctions between locations. The corporate preeminence that the Valley endures–a preeminence reflected in the regions’ hyper-inflated real estate prices, the daily swarming of commuters who can’t afford to live nearby, the swarming to industrial cities, the swarming of spin-offs, or of the intensity of investment that distinguishes the region outside of the way we designate place or partition space, and has an at least two-fold existence for those who participate in its economy and those who view the economy from afar. Even as crowd-sourcing has become not only one of the new mantras of the internet, but Silicon Valley a source that has expressed increased confidence in crowds as sources of knowledge-production and distributed problem-solving, the continuation of this concentration, despite the consequences and irrationality of such a swarming of Silicon Valley, are perhaps poorly understood.
15. The contradictory nature of Silicon Valley is illustrated in its radical transformation of itself as a place. The environment of the Valley is often, to be sure, obscured by its powerful myths. In fact, the multiple spaces of Silicon Valley–manicured green spaces of corporate parks; freeways; open office spaces; self-contained islands; sites of toxic waste; homeless encampments; sites of toxic waste; wilderness–coexist without the harmony that is imagined in the bucolic visions of the Valley that this header describes. The contradictions between these spaces are only hinted at in the visions of the valley that are produced by Google Maps as a hazily populated region in Earth View.
If we can see that an increasing expanse of Silicon Valley is now paved over–the disappearance of greenspace in Silicon Valley and much of the peninsula is legendary–what spotty areas of greenspace remains seems hemmed in, despite increasing calls for coordinated sustained development of the region, either built on or paved with asphalt or concrete or threatened to disappear, as less and less of the region is covered by trees–and seems to have grown as the Valley that once existed was replaced by buildings, freeways, pavement and parking lots. As if in inverse relation to the shrinking of global space online, the expansion of the Valley as a site of work and investment has continued to warp the lived geography of the west coast and its environment in somewhat startling ways, only recently appreciated as we distance ourselves from the mythos of the region’s talismanic synergy.
In a world where the web flattens production and consumption, Silicon Valley has remained a spike for entrepreneurial investment. But it remains a liminal space, outside urban environments, or even a “rim city.” Silicon Valley is not only a visibly heterogenous space, but one challenges criteria of geographical meaning in ways that make it all the more difficult to map or chart: it juxtaposes multiple sites, themselves often incompatible with one another, in a single site, each linked to different senses of space and time.
The coherence of the conceptual pace of Silicon Valley is notoriously difficult to map both because it changed so quickly, and because so little of its true construction or inner mechanisms seem evident in a simple land-map or the “spatial configuration” of such a unique post-industrial space, especially one that looms so large in a spatial imaginary. For it abandons the conventional categories by which geographical space is understood of proximity and scale, and even metageographical concepts of rim cities or corporate suburbia; its economy suggests a megacity with unique ties to a global economy. Silicon Valley long ago abandoned property lines of the orchards that once defined the former Valley of Heart’s Delight, where migrant workers supplied the world with what seemed an endless supply of dried apricots, cherries, and prunes. Rather than a center of agriculture or yearly crops, the region has been in large part paved over. In fact, just under 60% of the region is paved, and only 15% covered with trees, radically altering its landscape from the past.
“Swarming” captures an instinctual collective pattern, as much as a rational plan, as a figure of speech. The multiplication of corporations on the ground around the Bay Area often imagined as genealogy proving too complicated and brachiated to map by the 1990s, the multiplication of corporate presences throughout the Bay Area demands to be examined as a new relation to space. “Swarming” implies an animal-like herding and multiplication removed from the precepts of rationality that are claimed to underlie Silicon Valley, and an unconscious collective activity, but serve to attract future engineers as a magnetic force, drawn often through educational networks that as much as anything else constitute Silicon Valley, and help to define its overwhelmingly male preserve–
–often in hopes to join its innermost circles or mafia.
Silicon Valley seems only bound over the longue durée by freeway mobility and displacement, as one-time relatively cheap land was converted into corporate campuses, and at the same time being an experience–a fact which Mike Judge captures so perfectly–that is only really able to be perceived by the few who worked there. But the image of Silicon Valley popularly perpetuated by its local cartographer and chronicler, Silicon Maps, unconsciously provides a guide by which corporations could see how they occupied its space, literalizing the transformation of metonymy into toponymy in the clever expression of compression dreamed up by sales force reps and marketers as a catchy descriptor transferring connotations of agricultural abundance to the electronics business that has long stuck. The same marketers could surely not imagine the remaking of its local landscape that play on the horizon, or the preeminence of the region during the spatial shrinkage the internet facilitates.
But the name not only stuck, but became a toponym and freeway exit, even if it lacked a center or enjoyed a clear location. Its optimistic transference of connotations of perpetual prosperity to tech resonated with the sunny evangelism of a unique marketplace: and the name stuck as investing coherence in a region of transit, across a dot-com bust-and-crash, as defining a metaphorically distinct ecosystem whose economy seems more resilient than the nation’s economy as a whole. For the swarming of Silicon Valley depicted above followed the region’s transformation into a manufacturing center, but pre-dates the wireless mesh that led it to reborn as an archipelago of the internet-linked. The commercial map united a region not bound by land-surveys or legal limits, it might remain best mapped reflexively to foreground its myth of spontaneously regenerating prosperity as the displaced orchards of yore. For time, as well as space, are difficult to quantify or measure in “Silicon Valley” which has been far more than a fixed geographical place from the start–it almost had no bounds, as a site which was not really defined by work, but by the flow of workers, coders, programmers, circuits, chips, and platforms, distinguished by a seemingly endless supply of venture capital and a rash of rising valuations by the next century.
If these communities overlapped in different ways in the Valley, the collective synergy so often championed distinguished the region in ways that demanded to be visualized, but which maps fail to comprehend adequately. Desrosier’s perpetually sunny land lends actual coherence to a now not so anomalous intersection of freeways, obscuring the contradictions of a clustering of big tech corporations by situating them in a smoke-free bucolic setting. The maps sort out not only the big players, but orients one’s experience of the region obscured by the confusion of driving across the region on the crowded 880, 237 or 101 which has few prominent landmarks–save Great America or Fry’s Electronics–along a maze, glimpsing billboards, logos, or now, the enclosed communities of those who have indeed “arrived.”
The burgeoning logos that crowd the surface of the pro-commerce map does some serious cognitive work by effectively reifying Silicon Valley as a place, branding it as something considerably more for insiders and outsiders alike: a microcosm of the world of hi tech that constituted itself as something of a new frontier and a new space of work, tied to the idealism of the nineteen-seventies but closely tied to a new world of global finance, but one completely removed from the familiar office space or indeed patterns of work: it is the vision of the new industry that defined the Valley–a vision of the multiplication of individual makers of chip-related industries, soon expanded by the arrival of global electronics firms, and in fact led it to win its very own patent office “to speed up the patent process and help American businesses grow, innovate, create jobs and compete globally” in 2012 to confirm its status as a “number one destination for innovation capital.”
“‘We own the patent for that particular technology. Did you know that?'”
–Dave Eggers, The Circle
16. Who was the new patent office really for? We have extensive data and metrics about economic performance and entertain theories for the growth of a trading zone between coders, and capital. But mapping the mental construct of Silicon Valley–charting the proliferation of energy in the maps by which the Valley viewed itself as a place–remains a challenging to unpack, so distant is it from the environment or ecology of Silicon Valley on the ground.
This is partly due to the difficulties of defining Silicon Valley as a place with apparent bounds, the difficulty of pinning down the very centrality of a site through which have moved circuits, code, products and venture capital, and which now stands as a center of platforms to a World Wide Web, instead of manufacturing, and to take stock of its resilience as a site of investment over time. For Silicon Valley seems a center that we can’t map so easily as a site of work, one that has long been a notable spike of the global economy, where the swarming of workers and the place it has assumed in our collective mental imagination as leading to the future stand at odds with broader environmental change across its growing expanse.
Mike Judge’s satirical account of the emergence in the eighties of a view of the Valley is perhaps a history of the moment it became unreal. The HBO comedy has certainly gained huge popularity as a narrative of the historical moment when the Valley appeared on the map as a unique space. “Silicon Valley” depicts the interaction of entrepreneurs, programmers and coders on which feel we somehow have a purchase, inviting us to be a fly on the wall overhearing interactions in an “absurd time in history where people who are 24 are suddenly worth $10 billion in a year and a half.” Although Silicon Valley’s continued vitality as a site of startups may be currently questioned, as the mobility of tech has grown worldwide, “Silicon Valley” retains a distinctly privileged place and position in our mental imaginary as a conceptual space–both as a destination and a network of innovation aimed to be recreated elsewhere–the challenges in mapping Silicon Valley with fixed bounds, a center, or indeed as a space provide a healthy way to excavate the contradictions and constellation of meanings that Silicon Valley has aquired. For in our mapping of the economic success of Silicon Valley in our imaginations, we have, in a large sense, papered over and homogenized the huge differences of wages, ethnicity, and lifestyle in the porous region. For, if not the Wild West, it has sustained itself on a frontier-space, bridging spaces more than defining them.
One powerful account of the birth of this geography can be traced to ta time when funding from the US Department of Defense turned to Stanford University, and began luring tech projects with leases on local lands, both for military and civilian ends, the swarming of the Valley has redefined its heterotypic space in ways that were unforeseen before. Despite the focus of scrutiny on corporate actors at the cutting edge of the next big thing–from Xerox’s Palo Alto Research Center, with help from the Pentagon’s Defense Advanced Research Projects Agency–as much as its economy was shaped by corporate growth, Silicon Valley was remade as a site of technology that erased its own past, and whose composition is hard to read. The myth of the verdant landscape stuck as a topos of rebirth, but also a bizarre combination of nature and culture that pointed the way forward, concealing the fractures that lay beneath the glistening sheen of the pro-corporate maps that Desrosiers continued to produce, and the difficulty of knowing what, exactly, the politics or the character of this corporate space was in American culture. If the internet was supposed to be universally accessible, and independent of location, the corporate space of Silicon Valley that had benefitted from available funding for research and start-ups, and benefitted from a mobility and collective migration of talent among its corporations and the greater acceptability of hackers among its milieux–as well as the relative remove of the Valley from larger market forces. If continued speculation has been directed to locating the next center of tech on a world map, the relation between local and global crucially allowed money, capital, and workers to flow through Silicon Valley as a conduit, and indeed the constitution of a rich market for programming and engineering on the ground.
The region’s origins at the center of web-based computing might be traced as an intellectual genealogy of hypertext in the Stanford Research Institute and adoption of Vannevar Bush’s image of a systematic ordering of information by associations–links–rather than ranking or indexing, navigated by a keyboard, as one lineage of the region, the swarming of Silicon Valley demands to be spatially and conceptually mapped, to excavate its symbolic status as a location, reborn most recently as the site for a historical drama on HBO–much as its increasing alignment of the programmer with a male culture of self-sufficiency that naturalized its own male identity–and intense dueling of programmers’, coders’, and entrepreneurs’ free-market ethos–despite the quite complex social composition revealed in the demographer Dustin Cable’s “Racial Dot Map” of the region’s relative social segregation. The segregation perhaps tends to disappear as the population shifts on freeways, but exists in the image Wired celebrated as “the best map of America’s racial segregation,” where Asian-Americans are noted by red dots, Latinos by orange dots, whites by blue dots and blacks by green: the map of 308 million dots, each signifying an individual, reveals clear “ethnic” enclaves.
A great part of the Silicon Valley’s continued symbolic unity lay it is status as s a center for entrepreneurial activity–and intense investment local corporations–create a unique landscape, not able to be reduced to the political, not easily able to be easily imitated in other regions, however inevitable is the attempt to imitate and emulate, i. Lest branding seem the sole function of the maps that bound the region’s apparent shapelessness, it os important to note the difficulty with which regions inherit its sheen–for as “Silicon Valley” is reified and its branding imitated briefly if spectacularly produced Silicon Alley in Manhattan, Silicon Hills outside Austin, Silicon Allée in Berlin, Silicon Docks in Dublin, “Silicon Roundabout” in London, Silicon North in Ottawa, or, back in the US, Silicon Prairie or the Silicon Valleys of the South–as if each is competing for a symbolic marker having arrived at a similar model of economic investment, the distance at which each lies from a similar concentration of start-ups or investors is evident in metrics devised by Jorge Guzman and Scott Stern weight regions to measure the quality of entrepreneurial activity from 2001-2011.
For this intensely hyperactive space of reinvestment has increasingly directed to a global economy in ways whose dynamics are hard to recapture–and that leads visitors to many of these regions from California to wonder at the different lifestyles, less free-flowing rivers of money and conspicuous expenditures they find overseas, where start-ups just don’t live in the same way. These differences are not treated in this post, which has ballooned enough, but seeks to move between branding, economic charts, and data visualizations to better map the space and region Silicon Valley not only as an economy, but as a space. The changing space of the Valley, in other words, seems central to an understanding of its expansion not as a work space, but a space whose ethos or social space of actors has encouraged so much finance to still flow. The flow of inordinate capital to these new spaces have much to do with the rise of homelessness in San Jose and across Silicon Valley, to be discussed later, given the near-impossibility of sustaining a residence in a space that is increasingly valuable as a place for hanging one’s shingle and displaying one’s business card on a map.
The powerful remapping of the Valley in these poster maps that Desrosiers produced for a large corporate clientele represent, more than anything, the interest in sustaining an imaginary view of the Valley as a “green” space, and as a bucolic land of plenty, in an increasingly impoverished nation. The assiduous cultivation of this image of fertility conceals the obliteration of the landscape’s former fertility that had so long defined the region, but made it into a new land of national plenty.
“The rest of America…seemed like some chaotic mess in the developing world. Outside the walls of the Circle, all was noise and struggle, failure and filth. But here, all had been perfected. The best people had made the best systems and the best systems had reaped funds, unlimited funds, that made possible this, the best place to work. And it was natural that it was so, Mae thought.”
–Dave Eggers, The Circle
17. Despite the recent arrival of “Silicon Valley” on California maps, the mapping and remapping of the Valley’s corporate clusters made sense of its intersecting multiple economies, to make the illusion of the Valley present to viewers as a place, during the 1990s. The comfortable jostling between competing corporate entities, many of whom exchanged ideas, products, or employees, was shown as a single surface of production–albeit one that seemed pollution and industry-free, in ways seems a careful smoothing over its curious heterotopia–even as the former Valley of Heart’s Desire began to disappear. If all maps share encomiastic functions to some degree, these images chart the emergence of an extended archipelago of the internet-linked, not bound by lines determined by land-surveys or maps, to show the triumphal promise of its economy. The map showcases a myth of self-generated corporate prosperity, at the same time as the increasing corporate swarming of the region by consumer-driven commercial consumer firms in the Valley that incrasingly changed its material map of employment and work from a purveyor of chips.
“Silicon Valley,” Michael Desrosiers (1990)
The verdant bucolic space of the sort portrayed in maps of Michael Desrosiers from 1989, suggest its openness as a continued site for speculation even as they concealed the pronounced lack of transparency in remaking of its landscape. The image of abundance is naturalized in the map: there is hardly room that seems to remain in this “map” of space crisscrossed by freeways; the profusion of fabled corporate logos of brands as Atari, IBM, Memorex, Olivetti, InfoWorld, NEC, KLA, Intel, beside Fry’s Electronics and a young Apple dot the greenery of the South Bay. Desrosiers’ Silicon Valley would only spread north to San Francisco over a decade later, in 2001: until then, a secluded verdant paradise holds a proliferation of brands are nested in a landscape with which they have little traffic in an improbable pastoral metaphor, beside grey highways on which snake cars, buses, and perhaps a municipal garbage truck that both sanitizes and barely conceals the levels of waste the region has long created. The imagined space of Silicon Valley, however, has always trumped the real concrete sprawl, and the maps of Silicon Maps–previously “City Maps”–provided the mirror to the corporations that they have pretty continuously wanted to see, they merit examination as being without serious impact on its surroundings.
The “map” of the Valley whose new name Desrosiers popularized on the business calendar was a mirror of Silicon Valley. It inscribed the name of each company he located on his pictorial map who would pay–adding satellites and a zeppelin in 1991–and reflects the changing cast of characters it invested with apparent harmony, which cast the region’s abundance as its own brand through the conflation of a proliferation of business cards that the region generates with the land’s natural fertility. An early prototype of this commercial map, which invited local companies to place themselves on this new space by attaching their business card within its map both exploited and famously advertised the fertility of Silicon Valley.
Silicon Maps, 1991
To be sure, the 1991 landscape was about branding as much as mapping, but demands some symbolic analysis. Desrosiers revealed he Valley as an improvised congeries of spaces–a hyperbolic heterotopia–where the density of manufacturing industry had replaced existing models of work and generation of wealth had magically become clean. Crammed side by side one another in a green expanse that somehow remains park-like and inviting–and worth ballooning above–workspaces bloomed in ways tied, implicitly, to a global economy, but was depicted as an alternate workspace that echoed a classical bucolic scene, and plastered over its competitiveness or martial metaphors by presenting this workspace as something of a “playspace” where competition was far more intense–and mortal–than the board-game like scenario of cheery colors would portend.
The pastoral expanse of Silicon Valley can be scanned as a region of fertile abundance from the first very map Desrosiers made–which displayed a corporate cornucopia as an always green, sun-drenched landscape, in what might be the precursor to the current perpetually green landscapes in Google Maps. The cartographical rhetoric of abundance is about product placement, as much as the determination of geographic location, but the promise to orient viewers to the Valley by an imagined prospective view of the South Bay which almost seems its own island paradise, above which sail two smiling white balloonists, welcomes one to something of a self-declared topic corporate mecca by showing the most prominent big players circa 1990 to tell each they had arrived–and offered a bright invitation to find a place in its terrain. Of course, the map was indeed more board-game than actual terrain: it invites people to Silicon Valley’s new image of settling space more than orient them to its corporate plenty. How can the congregation and spawning of so many software and electronics industry–yet to be called “information”–be understood than by swarming, as the Valley seems something like a feeding ground and center of spin offs whose own genealogy is difficult to track?
The mechanics of such swarming is less due to immigrant laborers, but to map some of the reasons where the figure of swarming proceeds–both in terms of the swarming of the landscape with corporate entities whose growth depends on chips’ availability, the swarming of capital that congregates in the region, obliterating the landscape once there, to the swarming of commuters who have longed stream to the region from cheaper residential areas on its margins, a swarming so prominent a factor of the multi-lane highways that in the most pedestrian sense link Silicon Valley to the world to have become a defining element of its current landscape. While swarming was not Desrosiers intention, it seems an apt paradox to see the seat of this new information industry as best mapped by a sort of herd behavior whose design is not clearly rational. If its roots seem to lie in the plummeting of the prices of circuitry and semi-conductors, the now-mythical “separate culture” that bloomed in Silicon Valley from Intel to Apple to Google, the post-1960s culture, replacing that of Fairchild Semi-Conductors, rested on a link between “computer” with “personal” that arose in the early 1980s, and quickly encouraged the near evangelism of an affective tie between man and machine.
National Geographic (1982)
For these maps embody and manufacture the seamless unity of the divided region of Silicon Valley as if it were a coherent place, by doing the sort of job maps were long employed to do. While they vaunt the micro-community that Silicon Valley as a center of manufacturing and programming that made it one of the sole sunny spots in the United States, were they also conscious of the erasure they perform of its earlier sense of place as the Valley of Heart’s Delight, content to map the desire for increasingly powerful circuitry and “user-friendly” personal computers?
“‘We value your work-life balance, you know, the calibration between your online life here at the company and outside it. I hope that’s clear. Is it?”
–Dave Eggers, The Circle
12. Were such early mappers of the profusion of corporate spaces across the Santa Clara Valley tacitly conscious of the displacement of the once-fertile agrarian community formerly known as the “Valley of Heart’s Delight,” whose bucolic orchards of peaches, plums, and cherries were replaced by a scattering of electronics firms based in semiconductors and silicon chips? Was the definition of a new microcosm of fertility a name that concealed an undeniable if implicit recognition of the erasure of what once was, and a process of forgetting by what it had been replaced?
Nicolas Poussin, “Et in Arcadia Ego” (1637-8)/Musée du Louvre
Et in Arcadio Ego? The studious absorption of reading the location of Tech companies across the Valley finds its counterpart, perhaps, in the bucolic space where stand Arcadian shepherds, bent over the sepulchral monument that they find in their midst, perhaps like programmers trying to read code, script and algorithms of the past, or venture capitalists trying to find the Next Big Thing. The shepherds’ engagement leads them to realize the civilization that once was there, and the fated disappearance of their paradise. They are not in the Desrosiers’ maps. But the swarming of Silicon Valley seems almost premised on the erasure and displacement of what once was there: if we live in a space habituated to the writing over of landscapes, Silicon Valley was one of the first, where we’ll be long reading the traces of its past occupation.
Few signs of the past of the Valley are present in the commercial maps of Silicon Valley. When Desrosiers cleverly mapped the region of just four years later as an expanding region, it had expanded considerably, but the map was hardly realistic: the Bay Bridge looms, as greenery recedes into a somewhat misty rainbow-hued ground, Intel appears beside a growing Apple campus, and new firms like Siliconix, Hyundai, Semivac, Informix and CompUSA dot what seems a board game more than terrain, beckoning one to enter the landscape of gambling on the vision of the future it proposed. The instability of such a tie-dyed terrain speaks to the post-1970s origins of the coders, geeks, and engineers. If the map also acknowledges a mellow past of Silicon Valley, the peopling of the landscape presents it as a sort of fold into which a tight community of insiders is nested–no streets are labeled, or toponymy noted, save corporations who could buy a spot in the new landscape featured in the calendar, which all but obliterates the one-time fertility of the land, replacing it with a landscape of business cards so often carried by those who navigated its highways.
Silicon Maps (1994)
The map’s fecundity imitates the spinning off of corporations by former workers who attract new backers that characterized the Valley’s actual economic growth from Los Gatos to Concord and Mill Valley. Ss companies have continued to be spun out from companies–if Fairchild Semiconductors’ former employees generated at least a hundred; who knows how many were spawned by others–corporations replace place-names, as the landscape conflated with the continued circulation of business cards, as the spinning off of companies obscure geography, and corporate cleavages led to a swarming of a region beyond all expectations of its earlier inhabitants, but in ways that reflect the optimism for universal free-market competition.
Silicon Maps (2013)
How, ask promoters of this popular piece of office decoration, do I get copies of the map/calendar or put my company on the map? The deep desire to “put oneself on the map” of the region reflects the corporate swarming of Silicon Valley–driven by the arrival of workers, capital, and intellectual properties to the region in ways that fed an anxiety of how to visualize how one’s company had arrived in a landscape where swarming was early on naturalized in a landscape of apparent abundance. Facilitated by networking, the ongoing image of a landscape of innovation and investment perpetuate a mythos of perpetual renewal as if a natural environment or ecology, blending nature with culture, as if reasons could be found for its emergent structures in a landscape of innovative renewal, even as it had begun to disappear conclusively as a place.
The apparent openness of Silicon Valley’s environment is often attributed to its much-vaunted open informal organizational style, informal communities that generate innovative thought, or networks among entrepreneurs able to detect and sniff out the valuations of new platforms and opportunities for economic growth. But these over-rehearsed explanations of the region’s abundance tend to naturalizing of a landscape of continued fertility in ways that create a “place” or space in a metaphorical sense, as if to fabricate a notional creation even as its coherence is in fact concealed and never so clearly perceivable for its inhabitants–save perhaps as an obliteration of its perpetually receding agricultural past.
National Geographic (1986)
So unaesthetic is its design that it is doubtful that Silicon Valley will ever find its own Trevor Paglen.
Rather than developing as a planned or gated community, Silicon Valley developed as a sort of language game that emerged around player–and grew as a space of gaming, both of placing bets on corporations, and investing money in startups, which on its own had no fixed bounds and no limits or center, but lay in the overlap of multiple communities of coders, programmers, and manufacturing workers that exploited the availability of electronic circuitry and silicon chips. The Valley seems a classic heterotopia of the confusion of spaces of investment, coding, and corporate campuses, whose focus is directed to the flow of information on computer screens: its metaphorical mapping embodies what emerged as an archipelago of the internet-linked, not bound by lines determined by land-surveys or maps, but best mapped reflexively to foreground its myth of self-generated corporate prosperity. Such promotional serially produced sequence of annual vanity maps, designed as individualized posters and desk calendars, record the record job growth by “biz listings” in ways that don’t pause to conceal the ever-present engines of is formation.
But they foreground the difficult-to-pinpoint rationale for it’s enduring economic prosperity. All maps mediate an individual perspective and the spatial distribution of a world-view, but such pro-commerce pictorial map of Silicon Valley relishes the worldliness of the insider’s perspective. The iconography of the pictorial map of the Valley inscribes and recapitulates a myth of the genius loci, since so often recycled in depicting a salubrious locus amoenus for generating unending venture capital, without offering space to interrogate the unique rationale for its corporate clustering in a bucolic setting, or to recognize its cascading effects on the region. But the map foregrounds the difficult-to-pinpoint rationale for its enduring economic prosperity. For the ever-absent contours or centers of Silicon Valley are problematic to map or imagine as a fixed terrain, rather than as a vast archipelago of corporate settings whose members drink from a common, secret source, or concealed groundwater aquifers and rivers that have replaced the old.
18. The mapping of the region expresses the difficulties in coming to terms with the historical emergence of the region as such a prominent center of capital, as much as the data that might be measured of its exponential economic productivity and growth, which somehow masked its tacit connection to a globalized economy. Rather than being closely tied to a city, Silicon Valley has emerged outside of crowded spaces, where it could attract labor to the region–or draw from nearby cities from San Francisco to San Jose to Santa Cruz–without ever being a city itself.
And even though there were early plans to use public transit to link San Jose to Oakland in the early part of the century, the lack of a center and disaggregation of Silicon Valley was always part of its appeal, if not its attraction, as a region that could attract folks from around the country, and was capacious in its ability to absorb–if in recent years also sent folks to the new “Silicon Valleys” in the US. Yet despite hopes to create public transit lines since the start of the century, the spread out nature of the Valley have never been built–even if it has very long been projected. While this presses the nature of our public transit, is it really that hard to serve Silicon Valley directly–a project that has been in the works, it seems, long before tech settled the area? The poorly-served nature of Silicon Valley by public transportation from San Francisco–and the bevy of private busses that have arisen, as a selective private transport web that Eric Rodenbeck of Stamen design famously likened to an alternate private transport system that feeds on public infrastructure of San Francisco to leech out the tech workers who live in the city for its own suburban center of industry, picking up workers from secret stops to carry them on the 101 and 280 to corporate campuses in the peninsula.
The motion through Silicon Valley’s workspaces–site of the international traffic of products, capital, investment, and workers–resists conventional mapping of its workplace, environment, or investment, and resists a conventional network of public transit to feed its factories today: the stops of the corporate busses, scoped out by Stamen so that their routes were mapped by Field Papers so that they could provide a sketch of the alternate network of transit that tied the city to the region’s major players–from Yahoo to Apple to Google to Genentech, as if to survey the ties of the city to the peninsula through a hidden network of private bus lines to Silicon Valley that Stamen was able to excavate. But even in the initial plans for the Bay Area Rapid Transit system of a Peninsula Line that would transport workers to the peninsula was never realized, although the plans for decreasing the congestion of traffic to the peninsula were not easy to forecast
The coherence of the Valley can be less defined in the political terms that the rest of the country might recognize, the opposition between different political parties, less clearly defines its relationship to the nation than its relation to tech. Santa Clara County–a relatively wealthy county by median income, in which the majority is non-white–is difficult to define as a political environment. The region has tended to vote increasingly Democratic in recent elections, no doubt increasing ties of Democratic presidents to the region, despite a deep-seated passion of Silicon Valley for free markets, verging on the neo-Liberal, but corporations like Apple and Google became overwhelmingly supportive of Democratic candidates in the late 1980s in ways that reflected their deepest faith in IT as a progressive (if not liberating) force in the world that aligned it with ideals of equality, if one tracks the region from the early 1980s.
The symbolic world map would never be read, and is less about denoting spatial relations than the level of data compression photonics can facilitate. But the image necessarily might preface the problems of mapping Silicon Valley in how it appropriates a chip–an icon of the Valley’s manufacturing fame–as a surface to map a global distribution, if one perhaps legible only in the world of electron microscopy. The production of such “electronic mini-marvels” by low-salaried immigrant workers–often, unbelievably, not working in laboratories or corporate quarters, but in something like a putting-out industry during the early 1980s, when immigrant workers were taught vocational English to assemble chips or circuit boards at home–provided a forgotten basis for jump-starting an industry in one quite specific site.
The laminated map speaks to the global ties that Silicon Valley mythically forged in a global economy in about those very years, and even the possible mobility of corporations from Silicon Valley, USA, at a time when internet companies began to crest on the World Wide Web, and the release of Google Maps and Earth in 2005 boded a new vitality of a Valley, if no longer only a center of manufacturing, as the site of net-based startups whose interfaces would continue to change how we see the world. As we have multiple metrics and a near infinity of data to map Silicon Valley, the place it occupies in our mind may be as good a way to map its place in our economy as the data that we have about its performance, productivity, or capital it attracts. Yet the globalization of the web–and web-platforms–remained rooted in large part to Silicon Valley’s ill-defined structures, as it became the sight of, if not vision, a somewhat evangelical trust in the liberating nature not only of coding and programming, but of creating new social platforms–from credit to finance to medicine to social-networking–that came to define one aspect of globalization in a non-industrial style.
How can the emergence Silicon Valley be best mapped, charted, or expressed? The ‘engraving’ of global connectivity on a chip celebrate the global reach nano photonics would allow for linking the world, in disciplines from biotech to security to manufacturing to laser lithography. It celebrates not the medium of the map or the mapped subject, but the very practices of layers of lamination and processing for encoding information as in a map.
Despite the elegance of using the surface of the chip as an actual map, any mapping the region that launched the web’s networks seems far more fraught, if only because its contours continually expand. The absorption of the world onto the surface of the chip may erase the oddity of Silicon Valley’s unique position as a site of computing technologies and tech investment. The intricate laminating four layers in the micromap may be less difficult than mapping the overlapping areas that exist simultaneously in the Valley, and the view that appears best, and perhaps only, to insiders of Silicon Valley’s space. If all maps share deeply encomiastic properties, boasting the limitless possibilities of interconnectednesss, it is not difficult to map how Silicon Valley continues to hold particular primacy within that field.
Conventional tools of map making or metrics of growth are harder to use to track the contours of the Valley. Even as the end of manufacturing that had boomed in the 1980s meant that suppliers of semiconductors had ceased to be concentrated in the Valley by 2008, and were produced world-wide from Bangalore to Tokyo to Canberra, a map of coeval time charts the persistent centrality Silicon Valley surprisingly continued to retain in a metaphorical landscape of the global economy of knowledge-production: indeed, the Valley’s status a prominent spike in the knowledge economy, pointedly questioning Tom Friedman’s image of a flattened earth. For by 2007, Silicon Valley had remained a privileged preeminence as a spike of tech workers, patents, and investment; if it was surpassed in patents by Tokyo and Beijing, it stands out as a center of attracting global capital in a remarkably spiked economy of IT and communications technologies:
The persistent concentration of such prominent peaks in the global landscape of “knowledge-production” in Silicon Valley seems partly metaphorical, but is based on the shifting landscape of perpetual abundance in the reborn Valley of Dreams. Such an image of unending innovation of course conceals the degradation of both the region of the Santa Clara Valley and environs, and masks the disappearance of the valley that was once there, as well as the extraction of funds from region. The prominence Silicon Valley enjoyed as a peak in global networks of knowledge-production–both in patents and IT employment but, most notably, venture capital–stand out in this map of the inequalities of a “spiked” world, where the United States seemed to hold an undeniable advantage, despite a burgeoning number of patents in Tokyo and Shanghai, and Silicon Valley a prime place, despite the rise of IT from Boston to Austin in the US, and its rise in Ottawa, Berlin or Ireland or Bangalore.
Can these spikes be explained by economists who have sought to map the circulation of currency that was increasingly funneled into Silicon Valley industries, or its level of ingenuity, in order to define the continued centrality that the Valley occupied? While these measures are to an extent circular, they provide a basis to suggested how densely spaces in the Valley overlapped. To be sure, the density of the Valley as a site of investment alone was remapped by the scale on which start-ups and venture capital were drawn to a single region by the economist Richard Florida, drawing on data from the National Capital Venture Alliance, that as of 2011 focussed an inordinate amount of money on one place:
Zara Matheson, from data of USA Today and National Capital Venture Alliance
But this may use data to boast of the billions of dollars invested, with little fine grain or sense of how things are on the ground in the heterotopic conditions that distinguish the former Valley of Heart’s Delight. To piggy back on the visualizations of CityLab again, the striking density of the jump in patent applications around San Jose, even in the post-crisis year 2011, reveals the considerable resilience of the Valley, even as ground was ceded to Boston and New York. The sustaining of a unique market of speculation for knowledge and innovation–despite competition from folks both in Portland, the East Coast, Chicago, as well as Texas:
If the weighted nature of the bubble map to the locus of Silicon Valley remains indeed striking–especially for a non-metro area–the density of patents in the Valley before that crisis synoptically map the peculiarity of the Valley’s restless energy as a unique motor for the region that attracted such sustained investment:
But does it present an adequate image of the costs–or discrepancies–in the money that flows through its midst, or the corrosive values that it may pose to the local landscape and communities? What do we truly want to foreground in its maps? The map that so distinguishes Silicon Valley as the site of patent applications seem to have been filed by folks emulating Steve Jobs’ historical 458 design or tech patents–an astounding number, even if a third were awarded only posthumously. The huge concentration of patent applications–of which the Apple family was a large share–offer one index of the Valley’s fertility. It seems only rivaled by corporate centers of innovation in Rochester, NY, home of the Mayo Clinic and IBM campus, and surpass New York, Boston, New Haven or Ann Arbor. And the number of applications for patents the region generated streams down the counties of the Valley gives a sense of its intensity that lay the groundwork for its corporate presence. Measuring patents per sq kilometer reveal a striking density, reflected in the over-amplified costs of local real estate:
Atlantic/City Lab/Zara Matheson, Martin Prosperity Institute
Another emblem of Silicon Valley as aspiring to a perennial site of innovation might reflect the huge cult around innovation tied to industries in the Valley–one aspect of which is revealed in the almost entrancing visualization of the patents linked to Steve Jobs across different sectors of tech and design. The image of an expanding, apparently boundless range of patents across that proliferate across different sectors of local industry are all tied to Jobs–who in appears below as a light blue node, mid-central, from which spins out thin blue lines to diverse sectors of technology and design–but seem to expand outward, as if without bounds or clear center, but boundless energy, in an apparently endlessly self-generating web-like form, without clearly planned growth. For it in some way reflects the spread and growth of Silicon Valley itself, and of the range of new products and devices with which Silicon Valley had become increasingly defined.
André Vermeij: Visualization of patents associated with Steve Jobs, shown as a blue node above center
19. But the set of maps raise cautious questions of how data can actually measure the productivity of Silicon Valley. Although such collections of economic data can, to be sure, help to envision the continued prominence of the region as a center that attracted investment through markets for circuits, chips, algorithms, platforms, or congeries of online services, they don’t map the reasons for its survival with any clarity, and only affirm its importance as a focus of national, if not global, attention, and don’t describe the peculiarity of its status as a ‘place’ or geographic region. They surely pose questions of how to visualize the data that provide metrics of its growth, but only by considering the profound “placelessness” of Silicon Valley–and its prominence as a center of transit, but also as a between-space through which workers, commuters, money and big finance moves, can we map the very sorts of swarming that have defined it for almost fifty years–and have continued to work against any attempt to level the playing field. The multiple contradictions in the place-name of Silicon Valley, as a place between nature and culture, between global and local, and between workplace and commercial space, seem as good a place as any to start.
The map showing the multiple corporations that ring the South Bay with which this post began surely conceals the local losses that the reinvention of the Valley endured. What continued to distinguish Silicon Valley as a center of innovation, and what sort of maps would make sense of its disproportionate advantages in a global marketplace, and a sort of emblem of globalization, which was ready to discard its dominance in the semiconductor to cultivate new platforms of prosperity farmed and nourished by Google? While seeming to draw on a reservoir of coders and start-ups that lie within close proximity, allowing it to extract technologies, money, and platforms from a strikingly dense space, more competitive than many other places in the US. For if toponymy was long intended as metonymy in Silicon Valley, the innovation clustered around the Valley tells but half the story–and erases the obliteration of a long-disappeared Valley of Heart’s Desire. While we are dazzled by the glittery array of patents that proceeded from the Valley’s economic growth, the costs of being on the edge of the future may be about to come home to roost.
Despite the vaunted fertility of the region, its riches were of course never by any means ever accessible to all. The region of Silicon Valley has the most accentuated disparities in wealth in the country, with some 20% of its inhabitants living in poverty and a strikingly expansion of poverty across the regions, in something of a microcosm of the coming global economy in which 1% of the global population own over half of the world’s wealth. The demographic divisions of Silicon Valley run sharply against the message of inclusiveness that is diffused as if a meme by most all Silicon Valley firms: the suburbanization of poverty across the Bay Area, as in America, pushes poorer residents to outlying suburbs and include Silicon Valley and the South Bay–making it among the most pronounced regions of the divergent wealth in the nation, from East Palo Alto to Morgan Hill. For if it is a center of a booming tech economy, the San Jose-Santa Clara region is the seventh largest concentration of homeless in the United States–including major metropolitan regions–leading many without homes in Silicon Valley to be concentrated in a 68 acre encampment in a sunken subdivision along Coyote Creek, a shantytown of tree-houses, lean-tos and jerry-rigged tents whose residents were recently evicted from encampment that was close to some of the largest players in Silicon Valley and United States. Many of its inhabitants were chronically homeless, some pressed out by a soaring housing market driven sky-high by the swarming of tech workers–inability to pay rent is the major cause of homelessness, as well as homeless techies: for the swarming of Silicon Valley has itself produced its underside in the Jungle, the negative space to the corporate abundance Desrosiers has continued to map yearly, an unconcealed encampment by the route 280, and a counterpart to its sanitized spaces. Most workers ar oblivious of it even as they espouse helping the world. (If what was the nation’s former largest homeless encampment was forcibly cleared over Christmas 2014, a New Jungle of homeless quickly emerged farther from downtown San Jose.)
Did the region’s placelessness in essence foster homelessness?
It seems that the Jungle’s growth date from the Recession. The greater density homelessness in this small region along the 280 speaks to the deep sense of being broken in a region where real estate prices grew so improbably high so suddenly, stripping many of stability in a market that was hard to comprehend–and indeed what sort of actual community both software and the internet creates. For in the same region of corporate abundance, one in ten depend on a food bank, and the costs of corporate bankruptcy and costs of living may have created a new Grapes of Wrath—even as Tech CEO’s seem among the nation’s leading philanthropists. Silicon Valley’s tech firms enjoy extreme sources of investment; products of unrivaled popularity boosted average salaries of $76,593 in 2011, compared with a national figure of $50,502, according to the American Community Survey. And yet, also according to the Survey, 13.9 percent of the 40 million residents of San Jose went without health insurance–and the region offered one of the lowest residual values for average wages in the state. Few rewards of the Valley’s dominant industry reach many of its residents, whose corporate campuses are clustered in close proximity. One aspect of the coherence of Silicon Valley is that few fortunate to partake from its prosperity–overwhelmingly both white and overwhelmingly male.
Polis, Changing Percentage of Families in Poverty, 1990-2010
Deep divisions in the formerly landscape of Silicon Valley tellingly emerge when the region is rampaged by racial self-identification, the strikingly segregated community that appears, concentrations of self-reported “whites” in the American Community Survey noted in by red dots, apart from “Asians” who noted by green dots, and “other” by noted by yellow dots and a few African Americans by the few blue dots:
Dustin Cable–detail of Racial Dot Map
Despite the near-talismanic quality of Silicon Valley in our national imagination and economy, the region is become a microcosm of our inequality–sixty-plus billionaires inhabited one of the most radically socially unequal places in the United States to live. For even while trumpeting egalitarianism and open-ness, tech firms in Silicon Valley remain the epitome of a closed society, whose quite conservative hiring practices, despite an embrace of a rhetoric of transparency and progress, and a deep belief in rationality–obliterates an open playing field. Most tech workers draw from quite demographically similar cohorts (streaming from Stanford, UC Berkeley, Carnegie Mellon to San Jose State), and Silicon Valley tech firms attract far fewer fewer minorities than are represented in American college graduates. The dominant male ethos of programming and coding, and male-identified nature of corporate ideologies of rugged individualism and empowerment, Vikram Chandra and others have argued, had become attached to programming and business in Silicon Valley. The distinction between manufacture and coding–and the intellectual genius of programming–had early defined deep splits in how merit and credit was awarded in Silicon Valley’s industry, and indeed who the major “players” were.
For the disguised workplaces in Silicon Valley electronics firms long concealed the huge appropriation of unseen migrant labor who filled jobs often most closely involving carcinogenic chemicals and metals. David N. Pellow argued migrant workers who undergirded the electronics and computing industries in the same Valley once used for farming fruit remained less able or likely to unionize than the migrant fruit workers of earlier generations, who worked canning and drying fruits of the same land; the expropriation of labor was not especially unfettered in the Santa Clara Valley, but the remarkable success of the union-free policies of the electronics industry and computing companies silenced the exposure to and production of carcinogens which have led to the huge concentration of superfund sites–what Tom Foremski calls its “sweetly toxic center.” Despite the formation of the Silicon Valley Toxics Coalition to protect workers as early as 1982, the perpetuation of the belief of a “clean industry” concealed the toxic work environments involving thousands of metals and chemicals used to produce chips, perpetuated by concealing the air ducts, chemical discharge, and smokestacks of the region. (Those exposed to these toxic chemicals were the “silent workers” of the valley: women, immigrants, minorities–often underreported or not included in tallies of exposure to carcinogenic risks.)
“‘I love it that you call it a campus. That’s very cool. We used to call this places offices.'” –Dave Eggers, The Circle
20. While it is the center of global capital, the workspaces of Silicon Valley are themselves oddly cordoned off from a sense of a uniform or continuous space–set apart as campuses from the actual economic world. The logic of financial extraction and expropriation of capital generated a concentrated stock market of venture capital, whose ties to a global market which oddly skewed the internet economy and sites of hi-tech startups founded since 2002: if expanded to include San Francisco, the expanding Valley numbers a prolific two-hundred-and-ten, and leads particularly in those companies funded by venture capital (568), few of whose wealth was widely shared.
Such visualizations echoed the spiked world map offer some evidence of a northward shift of the center of gravity from Silicon Valley in recent years, and what Richard Florida calls a broader urban shift in whatever “model” of high-tech start ups exists. But it ignores the transformations and expansions which have reshaped Silicon Valley itself, as if in the need to trumpet a pronouncedly whiggish story of the world-wide spread of markets of innovation as if driven by an invisible hand, and indeed the transfiguration that the Valley has undergone as a site of commerce and work, transforming the Valley from a fixed site of work to one of the global circulation of capital in surprising ways. Can one rather speak of the swarming of the Valley as an appropriate metaphor for economic development? Or how can this corporate swarming be explained? The animalistic connotations of the metaphor as a collective behavior of aggregation which lacks any central coordination, driven by its own intelligence which serves to model a complex system whose self-organization cannot be perceived from any fixed or single perspective, or locally rooted model of rational intelligence, may indeed provide one basis to conceiving of mapping Silicon Valley, rather than seeking grounds for its own rationality or searching for reasons for the coordination of its emergence.
While the causes of Silicon Valley’s pronounced peak in the metaphorical map above may be unclear, persistent vaunting of the “new economy” has created a focus of global capital across several generations that have wrought a rewriting of its workplace. They suggest the huge investment in local property–and site-specific location of industrial giants in the region of Silicon Valley–whose campuses create the ultimate reification of a new site for work and the rewriting of the region as a workplace–and the increased residential remove of its economy from many of its residents.
The metaphorical remapping of an unequal tech landscape in a globalized economy seems tied to successfully sustaining of the metaphor of the Valley’s fertile setting of entrepreneurship and innovation, even as the continuation of its metaphorically fertile terrain, this post suggests, concealed the degradation of the real local landscape of the South Bay: even in asserting the vitality of the Valley as a privileged site of innovation, and a mecca of entrepreneurship, an expanding market for platforms of fixed obsolescence and unknown opportunities masked the degradation of its former fertility. If cultivating markets for platforms of e-commerce and social media were fed by the global expansion of the invisible empire of the internet, the sustained metaphorical mapping of a landscape of plenty, and innovation and progress, masked the dissonance between the region’s corporate configuration and the disappearance of its landscape. Santa Clara University, seeking to attract students to the land of 6,600 science and tech start-ups, echoes the disappearance of place in the region by prominently situating its own campus amidst a corporate landscape as if it has displaced the toponyms of a lived terrain, to orient prospective students to what it optimistically calls a “mindset” more than an actual space:
Is this region perhaps better understood by the category of the geographer and anthropologist Marc Augé has used to describe a ‘non-place’, defined more by the experience of transience–even as Silicon Valley is defined as a place of work and, not only of work, but of innovation and tech? The meta-geographical concept of a heterotopia not able to be embodied on a map, ranging from the points of transit such as airports or freeway rest-stops and hotels to the absent spaces we occupy before a monitor or TV, are defined by a space of partial subjective perception that seems apt in particular ways in the valley, and especially applicable to a lamination of distinct points of orientation–one can sense at least three above, from the contours of shorelines and oceans to the cities to the corporate topology, as well as the tacit omitted map of freeways that physically connect them on commuter lines. Absent for all practical purposes, the “Valley” seems present to the extent of the partial awareness of space that exist for its inhabitants–a similar awareness is produced by the reader of the above, where a landscape of the brands of innovation consumed has replaced an actual topography, as routes of transit through the space replace an embodied entity, and global industrial entities displace the orienting cues of toponymy, now demoted to a distinctly lighter shade of font.
If Silicon Valley is the unseemly aggregate of such clusters of corporate quasi-toponyms, or the critical mass of a corporate collective it creates in an era of late capitalism, more than a place, or a mappable space–something contained in ways akin to a theme-park or game-board more than a space physically occupied or to which one can be oriented. Newly-built corporate ‘campuses’, increasingly segregated and built apart from local communities, make manifest the complex relation to place that most corporate entities increasingly feel. One heart of the region, the Googleplex, defines itself both as a central part of the Valley, yet not of it, and as a bounded island in an archipelago of imagined places each discretely situated within the Valley as individual sites, but as collectively constituting one region–or imagined work place, with its own clear borders. Each, indeed, modeled after the classic case of space moved through–the “campus”–has been argued to be an attempt to create something like its very own city–the physical evidence of its corporate independence–even as these conceptual campuses are so often attempted to be grouped as a region; even as they exist as micro-cities that dot the rim of the South Bay, as if they were enclosed biospheres of their own, the secrecy that attends to each site of production at Google, Facebook, Electronic Arts, and Apple conceals their relation to one another, investing each its own image of insularity and high-stakes secrecy, as if it were a microcosm that has spun off from Silicon Valley as a whole.
What are these satellites an attempt to deal with swarming of the region by both providing expansive real estate in a crowded market, and economically withdrawing to gated enclaves, separate from the communities in which they live?
Googleplex in Mountain View
Electronics Arts in Redwood City
Facebook City in Menlo Park
iTown in Cupertino
The eery similarity of the oculus of iTown to photographs of GCHQ by Trevor Paglen is surprising and scary:
Trevor Paglen
But, as the CIA admits its nongoing struggle to break the secrecy and code of Apple’s iPhones, the similarity between these agencies of encryption may not be indeed so far apart as seems as each seems merchants of secrecy.
And, as Google hopes to double its Mountain View-based workforce from 11,322 to over 24,000 and expand the square footage its owns in the North Bayshore area north of the 101, on properties it’s acquired from 2005 to 2011, building a huge multi-building campus of its own, completing its four buildings of 3.4 million sq. feet in the seven million sq. feet of office space in Bayshore properties owned in the area by LinkedIn and Microsoft:
Plans for Google’s New Complex in North Bayshore
These buildings are the apotheosis of the swarming of the Valley. For Jim Morgenstern, the chief of Linked In’s realty, the huge advantages of creating the goal of a “critical mass” of workers in one region–transformed the areas of farming and former junkyards to bucolic satellites, in which one can “drive out in this incredibly tree-lined, almost serene place,” and find that “It’s five minutes in between buildings. It’s not 15 minutes or a half hour because you’re driving somewhere.” The swarming of Silicon Valley has its end product in the foundation of the Googleplex in 2003,
This “hiving off” of workplaces in the North Bayshore area, as the consolidation of such complexes across the peninsula, suggests a desire to keep coders, engineers, financial folks, and design within close communication, the lived geography of the company, which often employs spouses, family members, and in-laws, reflects the family-oriented corporate collective that has come to pass for “community” across Silicon Valley, but whose real estate scramble excludes much property rates from members of the community outside the corporate constellations–Google Inc., LinkedIn Corp., Intuit Inc., Microsoft–that have become powerful property owners of much of the land, as if in a material apotheosis of the Citizens United Ruling of 2010 about corporate personhood.
Is there any surprise that the very social media titans of Silicon Valley offer a new way to map the intersection between public media and social space in the state?
Alan McConchie/stamen design
“‘We value your work-life balance, you know, the calibration between your online life here at the company and outside it. I hope that’s clear. Is it?”
–Dave Eggers, The Circle
20. These theoretically independent architectural “places” in the peninsula convey impregnable self-sufficiency. They both mask the very nature of the inter-related economy of the region as a trading zone in which employees and material moves, and place each in its own field of green. Their discreteness belies that they are situated on a network of freeways, offering spaces to move through, as much as real residences. They are miniature Valleys of the Heart’s Delight, echoing the earlier name of the Santa Clara Valley, each networked in a broader cultural space, aspiring to be a place.
The non-place that is known collectively Silicon Valley was of course the focus and launching pad for a globalized economy of late capitalism, in which the production of competing platforms and forms of intellectual property have replaced the production of goods. This seems no coincidence, and specific to the unique heterotopic space in which the majority seem to be working from behind computer screens. For this reason, perhaps, despite the seeming possibility of the mobility of the moniker Silicon Valley, despite some success in recreating similar or analogous sites of corporate investment and entrepreneurial backing, a similar density of clubiness among investors does not actually exist. Even if the notion of “another Silicon Valley” has led the term geographically circulate with symbolic currency, and be playfully truncated to christen hopeful destinations or centers of innovation and venture capital–Silicon Alley, even as it appears prominently emblazoned as a destination on freeways from Milpitas to San Jose, briefly if spectacularly led to Silicon Alley in Manhattan, or Silicon Hills outside Austin, as sites of tech start-ups, or Silicon Allée in Berlin, or Silicon Docks in Dublin, “Silicon Roundabout” in London, Silicon North in Ottawa, or, back in the United States, “Silicon Prairie,” alternately located in Des Moines (Iowa), Texas (Fort Worth) or Oklahoma City, or the Silicon Valleys of the South–even as the name is imitated, as if it were a mantra or a spell, each compete for a symbolic marker of prosperity.
But can any acquire the aura of an innovation hub that can symbolically naturalize itself as a comparable wellspring of innovation? Perhaps they are hindered in doing so, because of the unique nature of Silicon Valley as a “non-place”: even as maps provide important ways of narrating the status of a Valley, its definition makes most sense to inhabitants than it can be described by traditional cartographical tools. And so it seems apt that as the Valley survives as a center of investment, it makes sense for Mike Judge’s television comedy to look back and illuminate the insider’s story of what was there at the start as a way to map its emergence as an island in our radically uneven sociocultural landscape. For if Silicon Valley’s contours or location seem to defy mapping, but the fixity of a privileged place exists as one that seems able to be invested with objectivity or fixity, when viewed at the scale of a national map, and its very privileged position in our national economy suddenly emerges in ways that demand to be explained:
For while the Arpanet seemed to promise a landscape of packet-switched computer networks, but the focus and locus of the world-wide system of internet protocols oddly seems to have been most successfully reaped in a precise location, even if we now imagine it as a World Wide Web without parameters and not able, as a constellation of information, to be geographically constrained.
The quite grossly skewed nature of the geographic distribution, crudely mapped to be sure, suggests the existence of almost gravitational forces that attracted those corporations that the internet enabled to one small region, boosted by the presence of communities of coders in outlying areas, governmental agencies and research centers, and a unique nourishment from private universities that have actively encouraged its expansion in multiple ways, and perhaps created a climate of financial possibilities that have helped set it apart from the nation. Despite the global reach of the internet, the population of coders and local reinvestment in platforms has meant the location of the largest billion-dollar internet-based IPO’s from Zynga to Google to Facebook–as well in biotech and medical instruments, according to the Small Business Administration–affirms the geographic centrality Silicon Valley holds of a network at first appearing to transcend geographic specificity: as well as straddling municipalities, the somewhat inexplicable concentration of capital in a cluster of corporate campuses which seems to hold themselves to standards apart from government is defined by an community rich with start-ups and coders, continuing to attract IPO’s in the face of other potential sites which boast still lower taxes–or sales taxes–from Costa Rica or Rosarito to Seattle, Dublin, or Switzerland, as the privileged site for generating phenomenal wealth and profits. Even as such alternate “Silicon Valleys” proliferate in an attempt to wrest the moniker and good fortune from California, however, including across the necklace of Silicon Valleys of the southern United States, situated amidst zones of pronounced poverty. Silicon Valley has expanded, and still retains global centrality as the hub of tech–or the competition for the title of Silicon Valley North in Canada between the former unchallenged holder of the title, Ottawa, with Calgary, Vancouver, and Waterloo, only the latter was in fact awarded a “five bar” rank of signal strength, as if that was a predictor of who would inherit the moniker in northern climes.
Despite the diffuse nature of such apparent competition, Silicon Valley continues to hold a clearly dominant gravitational pull–not only because of its new status as a pool of startups who can advertise to larger corporations, but as a community into which one can break. Many corporations located in the Valley–perhaps unsurprisingly–have, to be sure, regularly sheltered their huge profits overseas, both resisting or avoid federal prosecution for not paying their share of local or federal taxes, encouraging them to remain based in the US due to a beneficial tax code, even in the face of attractively low tax-rates elsewhere–and even leading them to expect similar tax-breaks in other countries. While the special relation of tech to tax code demands much research, the economic incentives of remaining located in the Valley seems based between a symbolic capital and capital gains, lowering their tax rates by stockpiling 1.7 trillion of earnings overseas is something of a scam that permits tech to draw increased symbolic capital to the Bay Area’s shores. (Given not-so-recent revelations of the scope of NSA hunger for dragnet surveillance of web browsers and cell phones for data collection, and the use of web browsers for individual geolocation, is it indeed too sinister to imagine a shady backroom quid pro quo between platforms or software providers, as Jacob Applebaum argued, from Yahoo! to Sun to Microsoft to Dell to Apple, to, knowingly or unknowingly, allow them back-door access to private online communication? Or is some such quid-pro-quo enabling of backdoor electronic access for spooks just too paranoid and too staggeringly illegal to even imagine?)
Without being overly apocalyptic, the very insider nature of the Valley tempts such outlandish hypotheses. With their ability to defer taxes on income deemed reinvested, the expansion of software companies and campuses has overflowed from Silicon Valley to offshore satellite campuses, driven partly by the pursuit of Larry Page’s “perfect search engine” that transparently understands the desires of its users, Silicon Valley can hardly contain its growth. Silicon Valley is rarely a site of residence, these days, so much as it has morphed into a site of work, of course, if only because its real estate is so crowded with corporate parks, and so directly fed by freeways that run from residential areas from not only Mountain View or Sunnyvale but Santa Cruz or San Francisco. It is a space of interaction between coders, venture capitalists, and startups whose specificity almost exists as a focal point of commute lines–from which most of its workers have been priced out.
Desrosiers’ popular pictorial mapping of Silicon Valley has helped rebrand its economical vitality as a land of plenty, adapting a particularly clever conceit in a clever sleight of hand that conceals its own nature as an illusion. It conceals the fact that its contours or centers are problematic to map as a unified terrain, and that the few invited to the apparently profitable spaces are quite select. It appears as a vast archipelago of corporate settings exists, whose members drink from a common, secret source–as if the concealed aquifers of innovation and venture capitalism had replaced the estuaries that once irrigated the South Bay, but the image of plenty is of course something of a self-perpetuated myth. The image of a wealth of “innovation clusters” was mapped by McKinsey digital some six years ago in ways that captured its unique place in our mental map in a similarly stylish design, but one of similarly questionable meaning: the corporate buzzwords of “momentum,” “dynamic oceans,” and “innovation” seem puzzlingly abstracted from its sense of place, though we get the idea of its greater importance than other California cities to tech.
Leaving such corporate buzzwords demands some serious spatial and cognitive remapping–not least because creating a cartography of the creative community of coders and coded is particularly compelling. (What sort of “diversity”–no doubt in ventures, not in workforce–the map implied seems to lie in its use of corporate buzzwords which features “dynamic oceans” of momentum among investors, as much as productivity.)
The state of the Valley, still depicted as a land of jobs and opportunity still demand mapping at the intersection between hedonism and opportunism, between work, venture capital and tax-dodges, and at the unclear intersection of a mental, economic and corporate space, more than a “place”–a terrain and superimposed on separate municipalities, bridging once clearly drawn county lines, which has become part of our mental universe but one looks to old maps vainly to find. Even as Silicon Valley emerged as an increasingly central sector of our national economy in the United States, it has increasingly acted as its own republic–diverting over $100 billion dollars into overseas tax shelters, even as it conserves an imaginary capital and value into a specific place, tied to a global circulation of capital. The extraction of wealth in the Valley foreground the difficult-to-pinpoint rationale for its enduring economic prosperity.
21. Although “Silicon Valley” primarily denotes a site of employment, it is as much a site of the imaginary. Indeed, the toponymy of Silicon Valley often remains only an almost imaginary destination for tech workers, as a board game, as much as a community of entrepreneurs or innovators. It is the classic contemporary image of a community one wants to join, whose boundaries are often hard to map with any fixity because of their own elusiveness. In Mike Judge’s television drama, however, we are suddenly there. More an enclave, preserve or invisibly gated community than “place,” we can see the origins of the new state of Silicon Valley is an enclave to be recruited to, which deems itself external to a jurisdiction. In a sense, the Valley’s unique status is historically mapped in Judge’s historical drama, a comedy about the vicissitudes of coders, programmers, and capitalists in the social interface that occurred at start-ups of the 1980s at the fictitious corporate setting of “Hooli” (aka, Google) about data compression: the drama examines the Valley as a privileged site for designing software to now-familiar platforms of global exchange, and the high prices and potential popularity start-ups command as their stocks rise, making fun of the language of marketing and purchases of often undisclosed prices based on ever-rising valuations and semi-cannibalistic buyouts by corporations eager to boost their own values. In the historical drama of six characters in search of six-figure salaries, buyouts, data compression algorithms, elevator pitches, unfunded startups, reverse engineering and cloud platforms become narrative devices of plot development, exposing the culture of programming as a hidden social topography of Silicon Valley featuring fierce corporate competition, hiring practices, and hedonism. If Silicon Valley has rarely reflected America, we enjoy being invited to experience the story of “Hooli” that might be the most compelling “reality” TV show of all–one about which we all feel some purchase, and can at last participate, now finally having been invited to view and happily if vicariously partake, if without shares.
The very same terrain that nation was long eagerly watching–if at several removes, to be sure–in our social imaginary at the same time as we have increasingly interfaced with its products is now available on TV where the idealized vision of the Valley exists as a form we can all be vicariously involved. All this makes it particularly interesting to locate Silicon Valley’s centers or purported bounds, or to imagine the construction of the world or Silicon Valley to which we are given access on HBO: as one of the ultimate insider stories that plays for a large audience nationwide, Judge’s eponymous sitcom is perhaps the best historical map of the Valley, since it offers perspectives to viewers, offering a in-jokes and partly recognizable routines, presenting itself as the results of something like a mock-ethnography of the Valley’s recognizable ideal types–hackers, coders, by-standers and backers–from within its own social space.) In a clever historical drama, a world unfolds to which we are peripheral but which we are all, by now, implicated, featuring stock characters with whom we are all too familiar, but who are compelling since they seem so far away from our present world of online-surveillance, geolocation tracking and cyberterrorism, these fresh, youthful faces present a compellingly contrasting image of charming naive in their earnest optimism of kids on the make during the 1980s. (Is there also something appealing about such a boys’ club scenario imagining Silicon Valley as a fencing-ground of a nerdy frat-house for guys on the make–despite increasing awareness of incidents of sexism and harassment from investors in the tech industry?)
The show is in a sense a retrospective thematization of the non-place of the Valley. The not-so-hidden story of the six characters in search of generating more than six-figure salaries is that everyone wants to be part of the Valley, or to be seen as lying at its center. If a remorphing of the American Dream, it is one to which not many are invited or allowed. (The success of an HBO documentary about gangs in Oakland and Los Angeles, “Bastards of the Party,” set in the Oakland of 1995, is a lesson in property values and the imaginary social landscapes we watch on TV.) Being a central player in Silicon Valley is itself a way of boosting one’s valuation, and acquiring the latest start-up is a central way of remapping one’s place in the Valley’s highly corporate landscape. Forty years after the term was still introduced by sales teams back when it was one of the most important manufacturing areas on earth, even in the post-Netscape landscape, littered with discarded platforms and providers, it continues to attract investors by promising platforms.
Even as Windows 10 boasts to unite user-experiences across devices by”offering a familiar experiences as they switch back and forth from personal computers, to tables, smartphones and other gadgets such as gaming consoles or even holographic projectors,” as the AP put it, and movement past the event threshold of the anthropocene in which smart phones outnumber global inhabitants, a vision that led Microsoft CEO Satya Nadella to address the needs of “a world in which there are going to be more devices on the planet than people,” the ever-expanding markets for the same devices continue to concentrate revenues in Silicon Valley, directing global capital to the Valley of the Heart’s Delight–and increasingly attach its devises to the notion of the consumer’s delight, by design or ingenuity.
Indeed, even if a relatively select proportion of viewers were anticipated to find the show popular–according to Echelon Analytics–the widespread success of the show suggests the interest of most Americans in its subject.
Long after it has relinquished its role as a center of chip- or transistor-manufacturing, or even as it continues to hold prominence as the sole global site or the center of software industry, Silicon Valley exists so prominently in our collective geographical imaginary as a site of both start-ups and coders, as we participate, in Judge’s serial drama, with its new platforms, ventures, and IPO’s. The new produce of “Silicon Valley” is increasingly rooted in its eventual inevitable obsolescence, as new platforms are updated and replace the old with rapid-fire succession of appropriately punctuated decimals, as if the valley itself recapitulates the MJT send-up of Geoffrey Sonnabend’s three-volume theorization of Obliscence that forgetting is “the inevitable outcome of all experience”–subtitled “Theories of Forgetting and the Problem of Matter“–in which all the past is truly irretrievable, and memory a comforting construction to buffer ourselves from such necessary disappearance. For supersession increasingly is normative in Silicon Valley.
Despite the immaterial matter of its merchandise, the concentration of work in Silicon Valley is set apart from the country as an idealized workplace. That the Valley currently continues in its constellation, as a concentration of a center for internet-based IPO’s may actually seem something of a puzzle, despite the persistence of its prominence in our national imaginary. This might seem particularly paradoxical, given that the Arpanet was first designed by the military as the sort of mobile network they sought to construct the as able to withstand air-raids or nuclear attack, and lacking any center that could be dismantled or targeted in attack, but that provided the sort of ghost like infrastructure that could preserve the unity of the nation in the case that several major cities were obliterated–as J.C.R. Licklider proposed a “galactic network” of computers that could talk to one another as a response to the potential for the destruction of our national infrastructure in case of a (Soviet) missile or nuclear attack that got special traction at the Department of Defense’s Advanced Research Projects Agency, and provided the impetus for projects of “packet-switching” for sending data along an invisible network from computer to computer, following its own route from place to place that defied easy mapping.
The sort of non-site-specific mobile network that the military envisioned led John Unsworth to note its chronological similarity to the synthesis of LSD consumed in the Bay Area in rendering place meaningless. The one-time counter-culture novelist Thomas Pynchon to imagine the circa 1970 computer geek Fritz to feel his mind blown at the revelation that when he ponders how, since when “gets on this ARPAnet trip, and I swear it’s like acid, a whole ‘nother strange world – time, space, all that shit,” whether “they gonna make it illegal.” Both reference Ken Kesey’s calling the prototype of the Internet–Douglas Engelbart’s oN-Line System–as “the next thing after acid” for its associative structure. Yet the site Silicon Valley, rather than offer the placelessness the Arpanet promised, has held almost gravitational pull among internet startups from 1996 to 2006, according to the Small Business Administration, in ways that would probably make it a prime target for missile attack–if we were worried about it. Although cyberpunk prophet William Gibson presciently evoked the same line of thought in Neuromancer, describing cyberspace as premised upon the “consensual hallucination” of online existence, Silicon Valley has generated both a staggering number of jobs and amount of money in one puzzlingly apparently perversely specific geographic location.
It makes sense to consider the odd dynamic of permanence and impermanence in Silicon Valley as a heterotopic space or cluster of heterotopia–defined by the transit of workers, flow of capital, and expansion of interfaces–that have radically rewritten an ecosystem or its own. The very fluidity of the streams of commute-migration might be mapped not only on the distribution by which Stamen effectively mapped the private buses that ran on secret routs to ferry some 7,500 tech workers from the city to work by the most effective paths and recruit tech workers to Silicon Valley to Apple, eBay, Facebook, Google, and Yahoo! The secret routes, which no corporation assisted Stamen to map, stands as a separate apparatus of transit, open to few, and providing them with an alternative mode of collective transportation on dark-windowed WiFi busses to avoid a nasty commute. The lamination of these commute routes over the Stamen Toner base map stacks data in ways that allowed the companies of Silicon Valley to best visualize and identify with the fluidity of peninsular destinations of commute, in ways that effectively mirror the truly heterotopic spaces in which the Tech workers of the Valley moved:
Eric Rodenbeck/Stamen Design
The swarming of Silicon Valley itself transformed a space that once enjoyed clear boundaries into a new sort of space for investment as well as workspace, almost paradoxically, erases what was there and exists as it grows without any actual center or sense of fixity, even as its place-name is co-opted all over the world map. If the name is often reproduced or coopted, the lost or absent nature of the Valley–or the ambivalence contained in that ever-popular playful oxymoron “Silicon Valley”–seems as good a place as any to start to consider its current creation, by reaching back in time before the 1980s life shown on Judge’s show, to recuperate the metaphorical vitality that the term first coined in the early 1970s sought to capture.
To discuss the displacement of the Santa Clara Valley offers a sort of conceptual base-map to begin to describe the story of corporate growth in an actual terrain. For even if the current corporate-campus-laden valley denies either its polluting or increasingly polluted nature, mapping the rise of its congested campuses might begin by taking stock of the surrounding sunlit counties were fed by rivers and agriculturally rich–even if few of the farmers’ markets in the Valley now feature the local produce once grown right outside San Jose along Coyote Creek or the San Joaquin River. The notion that space and community are only created in the same site now among the shoppers at farm-fresh markets, a destination valued as a “walkable space” uniquely able to “create a sense of place in Silicon Valley,” suggests a deep vein of romanticism for the current disappearance of the Valley that once was–filled with local garlic, strawberries, eggs, and chard–even if it paradoxically means growing acres of lettuce in large warehouses under pink and purple LED’s, among other innovations in “Smart” agriculture–as if to compensate for the metamorphosis that the Valley has itself undergone. Yet despite a clear fascination with green tech, and a boom in the commitment to clean-tech investment and “enviro-investing” in 2012, from Solyndra to Kleiner-Perkins, the joy expressed at the market’s oscillation away from “trendy eco-projects that failed” and to a commitment to addressing “market needs” celebrated by the Wall Street Journal as a return to its sensible role of enriching the world.
The oscillation between two deities in the Valley of Heart’s Delight–between nature and money, between green environmentalism and technology–is evident in the vanishing nature of the one-time Valley itself, whose topography is now erased, for all practical purposes, by the concentration on freeways on which one moves, and the almost universal historical amnesia with which one proceeds along its freeways to work.
While the water is no longer nearly so clean and the same region is marked not only by superfund sites left by the toxic chemicals of semiconductor industries, the region’s rich groundwater aquifers are replaced by the “Purple Pipelines” of waste-water re-use, providing recycled water to the region once filled with cherry orchards from East Palo Alto to south of San Jose.
For the oxymoronic transformation of the Valley of Heart’s Delight into a “paradise for engineers” was based on far more than an apt slogan of marketing or metaphor for corporate synergy or change: its fecundity as a site for IPOs has both replaced and erased its former wealth of apricots and prunes. Silicon Valley reflects the transmogrifying reality of industrial parks spread over real estate lots in a matrix of freeways, without fixed center, boundaries, or terrain and spread across multiple municipalities, and is a quintessential heterotopia of intersecting worlds and spaces, lying on the edge of mapped space, and actualized only on cyberspace rather than in space. Oddly, Silicon Valley is also defined by its replacement of the once-bucolic landscape that was there–and more a distributed network than a collection of defined lots, or the boundaries of property drawn by classical Roman agrimensores, as well as being unbounded quintessentially defines a site whose its inhabitants lack many of the fruits of their community–even as those new fruits are trumpeted as the most productive of the world–that is both obstinately opaque to outsiders beneath a smog-filled haze and demanding a greater transparency.
“Silicon Valley” is almost an ironic toponym of the tongue-in-cheek, a metonym orienting one to a mythic space that sharply contrasts to the clarity of late nineteenth-century maps of Santa Clara County–a landscape predating even what Steve Jobs quite evangelistically ironically termed “B.C.”–before computers.
San Jose Public Library
The current clustering of a network of corporate campuses around San Jose, a new Stanford and encroaching San Francisco Bay invites mapping its hidden network of trust, corporate proximity, and investment upon the metaphorical perpetuation of a lost land of orchards that an image of apparent cleanliness and idyllic expanse. For a half-century no longer an expanse of orchards, no longer divided by clear municipalities, the expansive sprawl has served as an incubator than a launching pad of Microsoft, Google, “Silicon Valley” is truly more of a metonym than toponym. Burgeoning sprawl, having displaced the orchards, has endured as a site where the production of microchips fostered a mental space in a network of venture capitalism, patent applications, and IPO’s. The transformation of the site from blossoming orchards to a site that, as an “edge city” for journalist and geographer Joel Garreau, more fully exist as places for its inhabitants they share clear boundaries or municipal identities, exist as an interlocking framework of industrial parks, almost like a theme park than a stationary location.
22. Yet Silicon Valley, as much as being only an “edge city,” is a concept that resists being mapped for a variety of reasons that are built into its very construction as a landscape of almost infinite ingenuity and invention: if it were bounded, this would be to constrain the proliferation of the provides of platforms and unbounded nature of the internet itself. Indeed, the contours of this Valley are not open or subject to public observation, perhaps because they define a site of experimentation and neigh fifty years of advance, and the mindset perpetuated at the site of work behind closed doors of corporations indeed suggest the secretive nature of what actually happens in the Valley as a reason for its fertility: if we were to actually map it, we might be able to understand what occurs there, and the mystique of its centrality would wear thin. Indeed, the corporate landscape of the Valley as it has developed seems filled by a seemingly healthy competition between entrepreneurs, coders, and franchised trademarks who compete not only for being identified with quality, but seem to fence for connotations of its one-time fecundity or abundance in the 1880s–back when the South Bay was indeed nourished by rich networks of estuaries, rather than venture capitalists and entrepreneurs. The small [ockets of green space belie the nature of the region’s fertility–and reveal the radically shifting groudcover of any areas that can or might be built upon from Menlo Park to Mountain View to Santa Clara to San Jose.
Perhaps the planned obsolescence of many of the electronic products and software platforms that most of us cycle through, forever obtaining new updates, creates a cycle of forgetting what the Valley once was, that both makes the early maps of Desrosiers look so very quaint in deed, and the maps of the earlier appearance of Santa Clara valley as if they had receded into the past with a velocity that surpassed much of the traditional landscapes of the nation, as if memories of what it once held recede such rapidity to erase any sense of their pasts. If the folks at the Museum of Jurassic Technology posit forgetting as “the inevitable outcome of all experience,” the past truly seems especially irretrievable, and its passage irreversible, in the supersession of the blossoms and poppies of the former Field of Dreams.
For although many investors have recast themselves as stewards of clean technologies, and Silicon Valley is a decisive global center of clean tech, from wastewater to manufacturing, the conceit that memory of the distant past remains the greatest illusion of all in Sonnabend’s concept “obliscence” seems especially to hold for the landscapes of Silicon Valley: and their past to have receded furthest from the maps that we makes of the same region to day to the extent that it takes a huge force of remembering to imagine what its past landscape consisted of apricots, plums, cherries, poppies and flowering trees.
San Jose Public Library (c. 1872)
Settlement of Silicon Valley (from Alum Rock, 2004)–Wikipedia
The repeopling of Silicon Valley transformed is small community of rich ranchos in the region that bordered San Francisco Bay, nourished by streams and open estuaries, to obsolescence. Their clear lines of property ownership were dissolved by the corporate heterotopia of proliferating poured concrete buildings that have replaced, and been superimposed across, the land in ways that opened its fruit-growing trees to colonization and suburban sprawl.
Calisphere/San Jose Historical Society
Rather than receding into the past in the manner of other regions across America, the region of Silicon Valley has strikingly changed from a regularly mapped set of Ranchos as the Rancho del Refugio/Pastoria de las Borregas to a landscape that, definitively, can’t be clearly mapped because its corporate population is ever-growing and ever-fertile. “High energy people blossom in this industry,” boasted a manager at Intel as he relaxed in his indoor hot tub in 1982, perhaps unconsciously appropriating an agricultural metaphor to describe the ethos of an industrial environment.
Can it be mapped? The very illusions of objectivity, control, and fixity are least apt to imagine across SiliconValley, where one can best map fixity in terms of motion, transit, and expansion, and might better map without imagining fixed boundaries or centers, but view cohesiveness by valuation, salaries, or broadband access, the disappearance of greenspace, the commute-space, or even, and, perhaps most definitively, the production of toxic waste. But if the microchip first promised to redefine the region as a site where one could declare the “future was here,” the growth of broadband and wifi across the region–then the current iteration and reminder that the region had arrived, the definition and preeminence of Silicon Valley as at the cutting edge, several steps ahead of the country, has managed to be maintained in ways that redefine the Valley beyond and as much more than a space or place.
Despite the striking elasticity of the Valley as a work environment–its satellites have migrated to the East Bay, Marin, or Half Moon Bay, and the region may seem to be overtaken by San Francisco or China–the continued gravitational pull of this non-place without a clearly mappable center have persisted over forty years through at least four generations of entrepreneurs, from the manufacturers of silicon-chip microprocessors to the first software companies to the behemoths of globalization. Rather than designate a specific place, the phenomenon of the proliferation of corporate campuses supported by capital investment recast the Valley as a quite surprisingly placed network of collaborators and capitalists that staked out the purported revolutionary nature of the enterprises they advanced.
23. The powerful myth of Silicon Valley is closely tied to the capital it attracts as Appland, as much as the federal grants to Stanford University of the past. But the symbolic prominence Silicon Valley has assumed a site for arrival in the future–a vision that is remarketed on HBO show attempts to narrate our unique relation to place–has demanded a constant remapping of the Valley as the site of future growth to maintain a place on the map that was impossible to find before the late 1980s. The relatively small pond of coders who congregated between Mountain View, Milpitas and Palo Alto created a community that reshaped the fertile valley that, in the late twentieth century, eventually overshadowed the prominence of investment in transistors or semiconductors, or even the landscape that Netscape helped fashion after its initial foundation in 1995. In this sense, Silicon Valley never existed as one place so much as it has become a search for the promise of integrating the open spaces of the internet that first appeared as real–or were first seen–by folks who worked in the Valley’s industries, or in the meet-ups that preceded the first IPO’s.
One of the clearest definitions of Silicon Valley as a region emerged with the attempt to define it as an early WiFi space. In ways that definitively showcased its transformation from a center of manufacturing, linking the valley by wireless placed it in the future by imagining a network of communication that seemed open to all. If the plastic bounds of the Valley as a place have nonetheless lead its boundaries to be redrawn almost an infinity of times over forty years, as folks have tried to identify the aura and energy of the Valley on a map, in attempts to describe what the Valley might be, or what would be needed to unmoor it from its setting. And even if its bounds have been reconfigured and spread along regional highways to encompass San Francisco and the East Bay and reach south to Half Moon Bay, the network has particular symbolic staying power even after over forty years. A new state in this elasticity began from 2006, in a sense, when what had long been a workplace site for semiconductors and became the largest open regional wireless broadband network to offer internet access across nearly 1,500 square miles, creating an extra-urban collective showcasing Cisco’s umbrella wireless mesh network as its infrastructure–the Joint Venture Silicon Valley Network, privately built and operated by IBM, Cisco, Azulstar and SeaKay, created a prototype and illustration of a linkage and site-specific technology upgrade to which the world could aspire–as well as, if then unwittingly, a model of surveillance. (Is it too much, in an era of the recent revelation of the mass-surveillance of internet communications, to imagine some sort of early realization of the broad opportunities for the back-door interception of signals that a single broadband network could provide?)
The self-described epicenter of innovation united the largest regional wifi of its time both as its own advertisement, and in a manner that no other collective had previously done–and which still provides an unreachable ideal for most nation-states, that effectively remapped its own inter-relationships, by 2008 imagined to comprehend thirty-seven cities in what seems a new means to map both economic territoriality and insularity:
The coherence within the same area of wireless access still stands in sharp contrast to the uneven access to Broadband available nationwide by 2011, according to the National Broadband Map, although much of the rest of the United States seems to have caught up to the Bay Area:
The spread of a fiber-optic networks across the Bay Area have hugely facilitated the growth of the Valley outside the topographic contours of the past, allowing it to realize new hubs in a more mobile–yet still strikingly concentrated–manner across the Bay in ways that expand the more limited mesh network of 2006, and allow rewriting a ground plan for future corporate expansion on fiber pipelines across county and municipal lines:
The effects of creating cohesiveness across Silicon Valley’s penumbra have been rapid. It is striking is that by 2013, software developers were both better-paid and more sought after in and around San Jose, where a premium seems to be placed on specific skills and programming languages that are more sought after than elsewhere in the country–defining a unique labor market in itself for software developers in a surprisingly dense geographic location–garnering them salaries of over 130,000, some $4,000 over the national average.
The above visualization of recent salaries of software developers attests as well as anything to the continued prominence of the Valley in the national economy.
But “Silicon Valley” emerged as a numinous a network of start-ups from the 1970s, and the term gained wide currency out of digerati in the 1980s–shortly before I moved to California, when the campuses of Xerox and IBM dominated the scene with Microsoft, and Google was yet to be born out of the dream of a universal digital library out of the World Wide Web. The density of software developers’ salaries came to define the Valley as a place, but it was always linked to the topic idea of defying geographic specificity, as is often observed, and a truly utopic place, linked to industry, but unmoored from a geographic setting to present itself as a state of synergy; if Silicon Valley was closely tied to Stanford University, the very placelessness of the Valley has both led it to be imagined to be replicated (in New York, Berlin, Boston Ireland, etc.), and to be a network, or space, rather than being geographically defined, despite its resemblance to a toponym, and the continued status that it has enjoyed as an enduring epicenter of venture capital and patent applications. Of 141 global internet corporations valued above $1 billion, whose global reach suggest the apparent limited relevance of geography to the the internet start-ups–a preponderance continue to be located in a restricted area on the peninsula or near the Valley.
“‘We value your work-life balance, you know, the calibration between your online life here at the company and outside it. I hope that’s clear. Is it?”
–Dave Eggers, The Circle
24. The surprisingly local concentration of founding software companies in sectors from gaming, security, commerce, social networking, or gaming of billion-dollar valuation was mapped by Atomico, using markers of place to designate blossoming of billion-dollar valuations by dots of differently colors that suggest the site’s continued fertility for different portfolios, casting the region as a site that proliferates portals to online platforms. If Silicon Valley is not bounded, its evanescent contours match the basis of many in the perpetual obsolescence in an economy of platforms needing to be nourished by continued updating, even if many make the majority of revenues from tried-and-true tactics such as advertisement, taking cuts, and client services:
A comprehensive “Geography of Start-Ups” might be rendered as follows to pose questions about the geography of programming taken that go beyond the pithy statement that “something is in the air” or “location matters” to decipher some of the reasons why physical proximity was facilitated by wiring and by offering both advice and stealing possible future employees from one another in a relatively small but well-fed pool: corporations are cluster in the map designed at the Economist in regions, erasing all specific toponymy in a landscape of giants of the net economy:
The rage of start-ups remap the region of Silicon Valley as a new insider culture. It is hard to map what it is like to work at one of these companies, or to describe it as a new geography of work when its expansion seems so relentless.
The illusion that Silicon Valley is a center of a specific cluster of open web-based industry conceals the fact that the economies of many are based in traditional forms of revenues, though linked to user experiences on interactive platforms. Indeed, the prominence of “user experience” as a category of specialization–and indeed, of work–captures the truly heterotopic nature of Silicon Valley. The proliferation of a number of diverse internet platforms that seem to have bloomed spontaneously in a landscaped marked by an identical coastal configuration in the above visualization of the international investment firm Atomico, an efflorescence of pastel dots suggest the diversity of services rather than designate their location, almost renders place irrelevant: each platform provides services for sectors from finance, social media, e-commerce, gaming, enterprise apps, enterprise data, travel, transport, security and much more. Although the uniqueness of the region has been identified as lying in its “flexible spaces of interaction” on an (sub)urban periphery, it seems to have become its own center for the swarming of capital that cannot be reduced to lifestyle alone, but a density of entrepreneurial investment that was so clustered in the Santa Clara Valley.
That such multiple global platforms originate in the same place reveals something of an inner contradiction demanding to be explained, beyond blandly essentializing it as a landscape of innovation–if only since it is remarkable that this network remains so very rooted in space, and closely located to capital as well as government initiatives that could serve as a possible business model. The persistence of this sense of geographic rootedness may derive from the early establishment of a “trading zone” within a market between entrepreneurial investors and software engineers, that nourished modes of net-based interaction have both developed and been cultivated in ways that are more accepted and recognized than other parts of the world. The global expansion of Silicon Valley has, if nothing else, added a further wrinkle to the displacement of the Valley as a privileged center of software industries. Indeed, recent maps of the Valley seem to try to imagine and fix the global economy in its growing space, as if to explicitly picture the Valley as a microcosm of a globalized economy.
The link of a geographic site to such multiple web-based platforms in one geographic area may seem something of a surprise, if only because of its staying power. Despite the apparent competition from overseas or elsewhere, the proliferation of so concentrated a cluster of software-related corporations valued over $1 billion specific to one geographic region of the United States not only creates a real economic inequality, difficult to explain within the forces of globalization the software industry itself promotes, but confirms the image and expectations of “Silicon Valley” as a place; the influx of capital into a surprisingly non-urban area has promoted investigation of its defining characteristics as allowing a mobility of work, whose holding power almost seems to attract its own inflow of intellectual capital, as well as start-up funds. Of 137 companies world wide, the highest number of billion dollar startups came to be concentrated in San Francisco or San Jose, providing the household words of a global economy.
The proliferation across the peninsula of a network of industry reveals the resilience of a geography over forty plus years, from transistors to micro-processors to software worlds, tied perhaps to a local culture of its fertility–not agricultural, but metaphorical and man-made. Although never able to be clearly bounded on a map, despite attempts to locate its center or expansion in wall calendars or corporate clubs, and the deep demand to orient oneself to its changing topography. (If, as the journalist Alexis Madrigal, recently relocated to report on the Valley for Fusion, has observed, “Silicon Valley has been marketing speak from the jump” its robust sense of placelessness seems to speak volumes to the flexibility with which it more approximates mental spaces than it encompasses territory, defining the shifting parameters for a market for specific sorts of expertise as well as inflated salaries.) The boundaries of the Valley are mapped in vain, at the same time as we struggle to arrive at a reason for the specific clusterings of companies as if it was indeed a place that had the status of the cities, suburbs, regions or counties at which we arrive with help from a highway map; we map and remap to orient ourselves to the incredible economic expansion there, and the implied fecundity of the name “Valley” sticks, since it captures the difficulty of defining the “place” or bounding what seems a conceptual space, but seems so hard to concretely represent, and perhaps exists more as a region the enjoys some privileged relation to an influx of capital than anywhere else on the map. (There is something quixotic in the fact that this region introduced a whole new meaning for “search,” as well as, “history” compels us to search for it on a map with such limited success.)
We want to find it, since we want to go there, or partake of it however vicariously, even if we are related to watch T. J. Miller solicit coders on HBO. That Silicon Valley is so problematically mapped and consistently re-mapped across forty-four years into the game reflects the particular holding power of this construct as a destination as a center of the semiconductor industry and an image of a center of innovation. The construction of Silicon Valley as a destination exercised attraction due to the difficulty with which it can be made present for viewers in geographical terms–or indeed pinned down to a region, or a fixed center. The superimposition of a yellow-line over a printed map nicely expresses the enduring sense of Silicon Valley as a network of freeways–now a network of commute, along the central vein of the 280 and bound by the 280, 880, and 680, and fed by US 101.
25. The increasingly impossible commute routes that have long distinguished the peninsula suggest the nature of the Valley as a space through which passes through immense numbers of cars, workers, capital, and parts–as well as one that launches platforms, software programs, and IPO’s. (Needless to say, these networks of transit were not in place to ensure the diffusion of dried fruits: they have grown to service what has become the most economically profitable region in the United States.) The malleability of these boundaries are perhaps best illustrated by the expansion of its boundaries shifted from a region that radiated from Palo Alto, contained by the Bay and Santa Cruz mountains, in 2000, to encompass not only Santa Clara county and Cupertino but Fremont, Brisbane, Scotts Valley to the south, and South San Francisco and Half Moon Bay: as the inter-related networks of the region expanded over the next ten years, the metaphorical “valley” extended far beyond the region–self-proclaimed futurologist Timothy C. Draper imagined it as encompassing land far beyond the bucolic county where it once lay, and even a fiscally separate state.
The expansion of the “Valley” to a region that even itself contained the entire Bay Area, peninsula, and coast suggest the autonomy of the region from “California,” for Draper, but also the expansion of the network to instantiation by the map, was something of a hope for its future expansion, and the ultimate statement of the difficulty of identifying its now-global reach, most evident in its high prices of renting square footage–now more densely focussed around Palo Alto, but still also considerable in San Jose–or triumphal maps of a tactile microcosm of globalization that have made it a magnet for investment and jobs. Indeed, the echoes of rising real estate costs have now driven up the market throughout much of Oakland, Berkeley, and South San Francisco, as the Valley has steadily, intrepidly progressed up to the North Bay.
Zillow
To be sure, the distortions on the Valley have been widely noted as a result of the gentrification of the Valley on account of receiving such a local injection of disproportionate incomes in recent years, to make it prohibitively unaffordable to live in the directly adjoining towns in the peninsula or South Bay:
Kwelia
even as rentals near the Valley are wildly distorted by its presence:
Kwelia
The growth of Silicon Valley attested to on pictorial maps used as conspicuous objects of display and a corporate directory of the region suggest its ever-changing boundaries and constantly expanding frontiers. Indeed, while in 2012 the Valley was imagined as mostly in the South Bay,
the Valley seems to have effectively moved far further north in recent years, rather than migrated, or being “challenged” by the San Francisco and Oakland.
“It took a day or so to get used to, seeing so many people nodding so frequently–and with varying styles, some with sudden birdlike jerks, others more fluidly–but soon it was as normal as the rest of their routines . . . “
–Dave Eggers, The Circle
26. Silicon Valley’s expansion has been sustained by a corporate swarming of tech industry, whose unreal success obliterates the “Valley” as a place. The remapping of that place by Silicon Maps affirms its uniqueness, and affirms the utopian nature of Silicon Valley as a place outside of the norm, and outside of the usual skills that are used to map place, even as they only raise questions about the pasts they obscure. The density of the proliferation of industry across the region was soon such that the crowding of corporate logos dominated the landscape in a cornucopia of corporate presence that has altered the once-bucolic landscape of the Bay Area:
What seems to remain its epicenter has been now rendered illegible toponyms, truly erasing any information by directing attention to its true sources of capital investment and new competitors for attention beside the oldest producers of electronics:
The corporate density was briefly–if unsuccessfully–taken as a target of attack of the Occupy movement:
But the pictorial map of corporate blossoming is more the cherished icon of a modern fertility cult, although it has echoes of one. Such much-recycled and enriched projections of the Valley’s corporate landscape depicts a transparently triumphal vision of corporate colonization almost seems to consciously be displacing an area once filled by orchards. The image of a naturalization of tech abundance, if long ironic, has perhaps led to a new self-knowledge of the malleability of place–despite the continued hold of the region in our nation’s economy. The multiplicity of its centers has created a challenge of orienting oneself to an extra-urban spread of corporate campuses on arterials, extra-urban or urban rim–removed from San Francisco, on the horizon, or Oakland, whose freeways seem to have themselves pushed back the receding hills of green in the below pictorial map, which magnifies the valley as a network spilling beyond its origins to the South Bay, to Scotts Valley and Cupertino but also Concord or Marin.
For “Silicon Valley,” even some forty-five years after its first naming, remains a quintessential conflation of nature and culture (and of nature and commerce, or orchards and transistors).
Since its coinage at the start of the 1970s, in a rare moment of optimism preceding the political “nervous breakdown” of 1973, suggested a marketer’s promise to sell its wares, the application of a metaphor of agricultural abundance to the center of semiconductors seems the industry misleading. If the term was diffused by Don C. Hoefler to describe the dense local proliferation of silicon computer-chip industries around Santa Clara Valley, probably first overheard the term when it was first bandied by industry sales’ forces: it gained appeal as the oxymoron that designated the first hot-bed of synergy that would hatch the golden egg, leading Hoefler to employ it as the name of his column (“Silicon Valley USA”) that concretized a set of commercial practices and industrial values in the area around Stanford Research Park, where venture capitalism exploded after 1980: “Silicon Valley” became a symbol of the Steinbeckian wealth of the new produce that outshone the Central Valley, as what had been the “Valley of the Heart’s Delight” ceased being only a landscape, but carried the new hopes for California in ways that conjured a new Gold Rush, even before microprocessors were made, and a suburb entered the internet before the rest of the world, and arcade games constituted real work, and the World Wide Web a form of ecstatic liberation and a space of collaboration that mapped loosely onto the region’s geography, but which has now become the territory of the net’s globalization–if one that was never that diverse, and where more “lip-service” was paid to diversity than institutional changes, in the words of the CEO of the Palo Alto-based non-profit that promotes the remediation of the gender imbalances in tech, the Anita Borg Institute.
By 1986, the appearance of a view of Silicon Valley a decade after the famous Saul Steinberg depiction “New Yorker’s Veiw of the World,” 1976 New Yorker Magazine cover, responded to the proudly provincial primacy of New York on one mental map of the United States with an alternative view from the West coast: Kitty Sperber imagined the prospective above the box like structures of Silicon Valley not to rank the companies in the region, but to present the view from the Pacific of a Valley bisected by the 101–
–as a view that placed the remainder of the nature in perspective, from the prominence of Apple and Varian to Sun, 3Com, and Tidewater Associates, which now seem a graveyard of old properties but posed a concentration of capital, intellectual and financial, that shifted the landscape of the United States, a region that might be prone to fault lines, but reoriented a national economy, offering a rich canvas to viewers that invited east coasters to measure themselves against it, a decade after the appearance of the Steinberg cover.
“‘Individually you don’t know what you’re doing collectively.'”
–Dave Eggers, The Circle
27. The landscape is of course, anything but the verdant Santa Clara valley of the past. In fact, what the Valley was is in danger of disappearance–although the somewhat convenient creation of a protected “Green Belt” around its system of freeways, almost identical with the changing topographies of the surrounding hills, seems to guarantee only several specific redoubts of green:
These “remnants of the Valley” suggest an expulsion of most protected areas, however, far outside of the fertile Valley once linked to agrarian dreams, and now more likely to be preserves near wealthy suburbs or country estates.
One might note that the amazing concentration of capital incongruously allows the persistence, amidst such suburban sprawl, by the proliferation of the illusion of often year-round access to nearby farms–although these are few and far between in the Santa Clara Valley itself, despite the flourishing of local Farmers’ Markets there as a sort of micro-economy of the well-fed:
But even though we like to map the region by its dark and light kelly greens, is the area still so pristine as the bucolic baggage of its name suggests? The blend of marketing and optimism at the origins of its the curious coinage, now marking its 44th anniversary, caught like fire by word of mouth. After it made its debut in Electronic News of Jan 11, 1971, it introduced a destination, long after the first work on silicon device manufacturing in the region in 1958, just outside Palo Alto, to which one could arrive, and created something of a market for work in itself, and which he popularized through his. The story goes that Hoefler lit up when he first heard the term over lunch in San Francisco as it was mentioned by some marketing guys as a term bandied around in the office, and the term coined by the sales team in the semiconductor industry grew into an actual place that Hoefler happily termed “Silicon Valley, U.S.A.” for its commercial fecundity, as microprocessor manufacturers slowly started to line its roads. Since then, the moniker has readily migrated out of newsprint to highway signs . . . as if to meet the demand that we know we have truly arrived.
The region’s identification as a destination and critical mass of microprocessors grew around the transistor, and only later the silicon chip, but remained a center of innovation, cross-pollination, and an ideal for how possible future centers of technology might work to foster the somewhat “serendipitous synergies” of a supply of cutting-edge computer knowledge, design, and a culture of open-ness–although the tradition of the US government investing so extensively in R&D activities and firms in Palo Alto made it a unique setting for collaboration difficult to recreate, even among the networked set–and as difficult to attract funding.
.
Silicon Valley it has, of course, as a place of opportunity and progress also become a mythological place in our sense of the global imaginary–as an area bursting with IPO’s, venture capital investment, and risk-taking, nourished by a web of freeways that transported networked workers from nearby cities.
Yet the image of the bucolic nature of the “Valley” as a nourishing site for corporate growth, entrepreneurship, and the needed venture capital provided a nice manner not only to orient oneself to a growth of tech firms in the region but to illustrate one’s own place in the proliferation of firms in an area where gentile ballooning seems still the motif, and the greenery of the landscape a continued metaphor for economic flourishing and a narrative of economic opulence. Even as the Valley seems to be challenged by San Francisco, the elasticity of cartographical formats allows it to be pictured no longer as concentrated around Palo Alto and San Jose, but stretching northwards to the now-greener hills of the East Bay and Marin.
Silicon Maps
The 2014 mapping of the icons of corporations that have colonized the what was once a Valley of fruit trees between Sunnyvale, Palo Alto and San Jose suggests a critical mass of corporate intermingling and synergy south of San Francisco, depicted in ways that continue to echo the bucolic tones of its first coinage–and if long seen as an outgrowth that ramified from Stanford University, what was once a “valley” has spread across much of the Bay Area and South Bay, so that, in this pro-corporate prospective map from Silicon Maps, trademarks threaten to overwhelm toponymy– in ways that makes one wonder whose interests the map actually articulates, and what the dissonance might exist between the advance of trademarks and the all-so-green topography of the region. The swarming of tech, however, seems to know no clear bounds, and we are poised to open up Concord, Sacramento, and Marin to the expanding corporate space.
Silicon Maps
The map tells a story that is reliably upbeat and optimistic, inflated by venture capital, and captures the image of the plenty of produce emerging from fertile ground in the former Santa Clara Valley to foster all of the 87,000 companies that have settled or been fostered there; the now largely figuratively verdant terrain is a dominant metaphor that this pictorial map of the region sets forth–even if trademarks come to crowd out whatever is left of the surrounding green as one moves south to its historic constellation of Palo Alto, Sunnyvale, and Mountain View.
Silicon Maps
Of course, the story that the map tells to viewers conceals a valley of manufacturing now vanished or almost gone: the industrial campuses that fill the landscape were built atop the original boom towns, now eclipsed by the trademarks of globalization that litter the lawns: this past industrial landscape, before microprocessors were all made abroad, was a rich center of manufacturing jobs, we often forget, as well as agricultural jobs that coexisted cheek by jowl, all fed by the sunlight of Sunnyvale, if it is now filled by superfund sites created by the storage tanks that were built, from 1981, to store the waste of the semiconductor plants which are the best evidence of the production of the past. These buried footsteps of the toxic deposits of Superfund sites is concealed by the pollution-free concentration of industries it presents.
The dense tangle of industries that are the landscape of Silicon Valley, free from industrial waste, has settled a still-green expanse, which seems to prove the continuity of the metaphorical construction of an ever-fertile region, now pushing forty years. The heart of the corporate flourishing of Valley lay in the incongruous appropriation of a term for the acreage that was once dedicated to fruit trees, to be sure, along the freeways that encircles Palo Alto, Mountain View and Sunnyvale, where microprocessors have replaced transistors as the currency of choice, feeding off of the circulation of employees–and its venture fund backers–the region attracts, for industries that seem embedded cheek by jowl in its fertile landscape, as if in a techno-garden glorying in joyous masking of the complex contradictions of a radically re-written landscape where workers arrive daily along paved arterials from increasingly lengthy commutes.
Silicon Maps
To be sure, the flourishing of corporate America by streams of venture capitalism in the meadows of Silicon Valley was never for all–back in 1982, the residents of Black, Hispanic, and Vietnamese who lived in East Palo Alto and worked on the assembly lines of Apple Computer and others were barely touched by its wealth, even if they were attracted by its dream.
Of course, as much as the map sustains the metaphor to imply that the blossoming of fruit is indigenous to the place, as Bloomberg Businessweek has helpfully revealed, in something of a counter-map of place based on the American Community Survey from 2008-12, the actual origins of its workers–predominantly from Mexico–that keep the chips whirring, and microprocessors on the move, and that announces it as a destination. For all the recent discussion of the predominantly caucasian tech firms based in the Valley–if some 83% of tech jobs at Google’s workforce in the Valley were held by men, 93% of those workers were white or Asian, while true that more lip service is paid to diversity than programs for change, it is striking that of the influx of residents into the region, a relatively large number of folks speak a language other than or in addition to English at home. Since 2010, a majority of the tech workforce has been Asian Americans, among whom migration to the valley has continued to grow even during economic downturns, in ways that compel mapping as a skewed sort of microcosm of globalization, as well as of the United States–a microcosm that reveals the profoundly transient nature of a region bound by highways, which seems more an icon of social and geographic mobility than a geographic place. The aggregate workforce that reveals marked actual geographical diversity densely packed peninsula–the leading companies in the tech sector are rarely diverse, and despite net migration, and the insularity Valley seems something like the reverse of a melting pot: it is a site where folks arrive on well-worn paths, and which the range of geographic birth-places cannot conceal the fact that it hires the folks it knows best.
Bloomberg Businessweek
The big draw to the valley from over 6,000 miles away speaks volume to the value that its industry places on specific expertise, and its prominence in an international marketplace who often receive work H1 visas because of their corporate desirability. And one can imagine the nearly identical pathways for their arrival:
It’s easy to compare this map to the density of corporations that the fill–whose names seem to drown out the actual place-names of the region.
Does the burgeoning of an apparent plurality of logos conceal the pretty uniform nature of its residents? The trademarks make up the valley as a place that is not even rooted in space-time, and removed from local roots, so much that one might almost miss the toponyms that indicated the old centers of manufacturing that filled the valley not long ago. Now, if conjoined to the name of the local branch of Carnegie Mellon, globalized corporations colonize the face of the local map–making it a true artifact of the global that compels one to try to imagine a time-lapse graphic of corporate settlement across the region over forty years, as Microsoft appeared, Google was born, and LinkedIn emerged, replacing Raytheon, Advanced Micro Devices, and Fairchild Semiconductors, and leaving Hewlett Packard, Intel, and Varian Associates as less prominent parts of its topography, while prominently placing the logos of global companies–LinkedIn; Microsoft; Google–in its stead as the prominent pit stops along the freeways that commuting workers move.
Silicon Maps
The costs of the swarming of innovation lies underneath the verdant landscape of the Silicon Valley superconductor industry. Even as the connotations of the region’s historical fertility metonymically survive in our collective imagination, the seeds were planted for the expansion of the region’s sites of toxic waste–and indeed the work in a number of carcinogenic metals and chemicals created one of the largest clean-up sites in California, reviewing a state-wide survey of Superfund sites.
Wikimedia
Indeed, the lack of absence of any federal regulation of underground storage of toxic chemicals and even volatile organic compounds seems to have created a loophole large microchip processors exploited to ensure the appearance of a pollution-free industry–and ensure the image of propriety, even though the region includes more superfund sites, clustered cheek by jowl, than any location in the nation, many already leaking chemical waste since the mid-1980s. The absence of regulation again defined the region.
Stanford University commissioned one early map of the many contaminated “hot spots” across the Valley, which might best define the region’s coherence by some measures, in 2004–long before it was suspected to in fact be “home to one of the nation’s heaviest concentrations of toxic-waste sites,” but around the time that local residents began to first complain of respiratory problems. Local clean-ups, already paid for in the first decade of this century by chip corporations from Intel to Applied Materials Inc. to Advanced Micro Devices, stand to define the region since its time as a center for the fabrication of transistors, and contains deposits of toxic waste from as early as 1956, even if violations for unauthorized storage of waste only emerged recently.
Is this legacy another sense of defining the efflorescence of industries in the Valley–and did the established practices for under-the-radar concealment of wastes indeed provide a rationale for the explosion of microchip processing in a region where the EPA could stand to turn the other cheek? Whatever the reason, the swarming of industrial manufacture to the Valley, if erroneously linked to labor practices, has left a clear record of its material substrate in the number of Superfund sites that still swarm around the South Bay, where individual clean-up costs of up to $5 million are now regularly declared to be “bad chapters,” but might prove to be the norm. (And even when “cleaned up,” to be sure, entails a shell-game of moving it from Mountain View to be treated and burned in less-populated and far less affluent regions in Oklahoma or Arizona, often discharging toxic wastes and still more harmful chemicals on Native American reservations.
28. Notwithstanding the verdant foliage that crowds the landscape mapped by Silicon Maps to present a mirror of prosperity, evidence of those underground storage tanks old manufacturers left in the region, it’s well known, are not only concentrated in Santa Clara County, but regularly continue to leak and leach into the water and ground around them–the concentration of Superfund sites in Santa Clara county is far greater than any US county. Their toxic legacy signals not only a return of the repressed of the costs of hiding pollution that old manufacturing plants, long abandoned, have left along its major thoroughfares from Sunnyvale–epicenter of the “old” Silicon Valley–to San Jose, but a boondoggle of its own. For concealed far deep beneath the illusorily pristine nature of those firms that provided microprocessors–prohibited from revealing smokestacks, ducts, or waste–were left deposits in storage tanks that are destined to crack with time, as if the forgotten footprints of the powerful corporations who walked the streets. The map emerged at about the same time that Alexis Madrigal came across a collation of corporate headquarters that crowded the Valley already in 1983–“Rich’s Guide to Santa Clara County’s Silicon Valley”–which he mapped against the twenty-three Superfund sites across Silicon Valley: if the toxic plumes are now under control in the Valley, and chip-making a thing of the distant past, it remains a notable shock that manufacturing continues to provide some 20% of the region’s jobs, a concentration which stands out for regions outside of major metro regions, and seems to be growing from San Jose to Livermore and as stable as it’s been for the past decade.
Yet it is not clear how long this can last. The recent discovery of a hazardous discharge of a solvent used in making chips, trichloroethylene, or TCE, of 7.8 micrograms per cubic meter, that exceeded the 5 microgram EPA safety levels within air vents at a Google satellite campus employing a thousand workers in 2013 seems an unwanted inheritance from buildings of Intel, Raytheon, and Fairchild Semiconductor on the same area.
Paul Mison/Stamen
Promoting itself as a land of verdant fertility continues to serve to conceal the multiple sites of waste storage that are in danger of being released in the soil and groundwater that seeps into indoor industrial spaces and the grassed over lands of somewhat bucolic corporate campuses, is indeed an odd wrinkle in corporate time. Indeed, it seems necessary to have recently introduced one of the largest and most advanced state-of-the-art water purification plants in the Santa Clara Valley Regional Wastewater Facility, employing microfiltration, reverse-osmosis, and ultraviolet disinfection at a cost of $72 million, funded both by the water district and City of San Jose, as well as $8 million from the American Reinvestment and Recovery Act. As if tracks in the La Brea tar pits, the Superfund sites of Silicon Valley, mapped by Paul Misonon Stamen tiles, reveal the residue of manufacturing that was so long concealed by the appearance of box-like structures and manicured lawns, which were mandated to conceal the waste they generated–although the density of these twenty-three footprints of toxic underground pollution were long known to the EPA–as were the nineteen left by tech firms and their manufacturing, largely of site scores of thirty to thirty-five, save Advanced Micro Devices in Sunnyvale (37.93) and Fairchild Microconductors in South San Jose (44.46).
The quite toxic not-so-past of Silicon Valley offers a map of the former manufacturing industry reveals a clustering of superfund sites that paradoxically coincident with stratospherically rising property values, making the region exceptional for being a site of toxic pollution and valued lands. To be sure, the state of toxic pollution is effectively hid by the current industrial giants in their own maps of the region, and its hopeful hue of verdant green. But they are pretty prominently placed in the distribution of Superfund sites in the state, as the only continuous stretch of red, rivaling the San Gabriel and San Fernando valleys in its toxicity, in a clustering that one might do well to meditate on again and hold before one’s mind while buying local real estate, or on the dangers of sea-level rise in a region whose demons are thought to be safely buried underground.
To be sure, in recent years, the local presence of pollution has shifted from underground to the air in ways increasingly evident in recent years in the air overhead in the Valley, where a spate of perpetual highway expansion has been added to accommodate commuters–without reducing traffic congestion, but only feeding haze of traffic jams, fed by the interminable commute from outlying areas where one could most readily afford rent in 2012.
Kwelia (2012)
Questions of how to move around this tech-induced suburban spread of rim cities has led Lyft to introduce a satellite of ride-sharing into Silicon Valley, extending its service much further south, even as it balks for now at offering rides along the commuter corridor from the Valley to San Francisco.
All of which makes important to reiterate the difficulty of mapping Silicon Valley with fixed bounds–save in a numinous way and as a true heterotopia of commuting capital and workers. For the way that capital, entrepreneurship, and innovation have swarmed to the valley in clustered corporate campuses, each defining itself by its own platforms and in buildings that stand as if apart from the world, has produced a second-swarming of commuters and commute buses, as if in a third dimension of the heterotopic expansion of Silicon Valley as a Valley of Dreams. Indeed, the difficult to detect costs of its ongoing environmental impact can now best be read by the swarming of commuters who stream into the South Bay, and across the peninsula, despite the earnest attempts of its bicycle coalition to reclaim alternate modes of commuting on El Camino Real–the only mode of transit that connects Daly City in San Francisco to San Jose that is not a highway.
While such new modes of connecting the multiple communities that exist in Silicon Valley suggest a new perpetuation of the utopic vision of the Valley as a site of innovation and growth–and indeed link the vision of innovation to the welcoming of eco-friendly transport, the hopes to introduce a new infrastructure of bike boulevards seems more successful at getting kids to ride bicycles to schools than workers to rethink their commutes. In part, this is due to the distance that commuters’ travel demands. It’s possible to map the network as a convergence of freeways that have become massively expanding commute roads to scratch beneath the surface of an encomiastic map that privileged the industrial icons of the area, but renders the pressures of commuting to sites of startups on Google Maps that describe the reality of swarming commuters take daily on eight freeway’s paved roads–the network that primarily defines Silicon Valley for most.
29. The Valley might well be seen in recent years, as a network of freeways engorged by traffic jams, englobing a bit of green that survives around San Francisco Bay. The built environment created around the coursing freeways between Milpitas and Los Gatos that have pushed the forests and green lands out to the margins of the Sunol Regional Wilderness or Henry Coe State Park, which are able to be protected as they lie outside the lines of commute that serve as Silicon Valley’s true bloodlines of vital nourishment:
Google Maps
The displacement of much industry to San Francisco has led, to be sure, to an expansion of the WiFi buses that the giants of the Valley have offered their workers as a means to lure them to their campuses at low cost, in buses that promise to create mobile workspaces that make the commute apparently instantaneous, since they guarantee a workplace environment as soon as one steps aboard:
The need to expand new avenues of public transit, as BART, to San Jose or the Valley seem, for now, on hold, unless we want to continue to test the synapses and alternate routes for workers, undoubtedly driving with smart phones wired to their ears or on speaker phone, to improvise expeditious routes down the peninsula or through Fremont and Foster City, hoping to arrive in Sunnyvale and Palo Alto by a curtailed commute.
Of course, the problems of the commute depend on time, and increasing amount of time that is consumed in inbound commute hours to the Valley among a demographic not so habituated to long commutes. This is most nicely envisioned as an increase in commute traffic just last year, according to a 2014 report by research firm Inrix, in which San Jose suddenly rose four levels to the seventh worst commute city in the nation from 2012, with drivers losing some 35 hours weekly, and Palo Alto showing the worst inbound commute and job-to-residence imbalance, aside from San Francisco, despite the construction of increased traffic lanes in recent years that were built at considerable expense to accommodate the number of commuters:
Inrix
In ways that can also be read in a dynamic map of the best and worst commute times in clickable form, the map offers a new sense of the topography of traffic that has grown congested around the space, erasing its bucolic connotations, and even suggesting high commute times from residential areas of those earning six figure salaries, creating an odd sociological profile of high commute times. When one focusses in upon this landscape of commuter times, and maps either inbound commute times or those times greater than 45 minutes, the definition of the valley’s topography of traffic best emerges above San Jose, focussed in residential regions Sunnyvale and around Palo Alto:
Inrix
Inrix
Mapped in a closer record of minutes of inbound and outbound commutes, suggests the degree of congestion by locally ranking commutes in static form–and making the problem of finding residences in nearby regions all too evident:
The explanations of the expansion of commuting distances along a formerly suburban expanse appears partly due to the low-density housing of the same area, to be sure. But it is also true that most of such residences are quite prohibitive to relocate to, and in an era when all are consulting Redfin and Zillow maps, mapping costs of property against costs of commutes in a calculus of expenditures, school districts, and acreage, the twenty-five minute commute from Scotts Valley seems quite a good deal indeed. This makes commuting to Silicon Valley much better understood not only a choice of lifestyle but economic reality with the Bay Area-wide escalation of the valuation of potential sites of residence. As more high salaried workers are attracted to the region, the expansion of housing costs throughout the Bay Area has been rapid, and the escalation of costs of Bay Area homes no bubble.
The normalization of expanding commute-times, in line with those across the country, seems increasingly tied to the imbalance between jobs and housing costs, already apparent from 2007, the valuation of homes above $600,000 had already expanded throughout most of the formerly small towns of the Bay Area.
–an imbalance which revealed in even greater starkness in the 2014 Kwelia maps of median income across much of the greater Bay Area, and the huge spikes of real estate values in Palo Alto and Milpitas.
One can understand the map of property values in terms of Bill Rnakin’s “Donut Maps” of income distribution in urban space:
Is one consequence of this distribution of wealth that crowds out many of the area’s own employees not a massively toxic release of carbon dioxide due to commuting that endangers the toxicity of its day-to-day air quality?
The metric tons of CO2 generated from commuting as far back as 2009 already created an image of dense pockets of commuting, even despite the existence of other options of public transit. Predictably, the amount of time spent in automotive transit per household overall most rapidly escalated from the Oakland Hills to the South Bay and Santa Clara County–due to lack of access to public transit, as well as greater disposable income.
The foregrounding of alternate transit options in the recent New Places, New Choices report has emphasized the benefits of urban lifestyles. But with workers often pushed out by the distorted real estate prices–here mapped in terms of median incomes–one result of further commute distances is that congestion is even harder to escape. The below maps the extent to which the Valley not only devours ground-space, attracting a groundswell of workers to the Valley of Dreams, but sucks cars down to central San Jose at clogged times of commute, creating crowded freeways where commutes devour a week of peoples’ lives each year.
Infix
The concentration of the 23% rise in traffic showed pronounced congestion across the southern peninsula.
Of course, the dynamic of the commute is less tangible in the map of the San Jose’s Chamber of Commerce of the golden region spreading southwards from San Jose over what was once agricultural lands, as they’ve adopted the term that Hoefler first used in his now-historic 1971 column in Electronic News.
All too often, we’re tempted to see the disconnected dots of hubs of the global computing industry as a specific market for software engineers not only as providing a basis of the continued relevance of geography to the internet economy–but how the internet economy is revolutionizing the ground.
30. If there is any irony in mapping the residues of waste left by this concentration of corporations, this seems multiplied by mapping the probability that rising waters of global warming threaten their future leakage into the grounds of such desirable real estate. For despite the current appearance that a tech-centered gravitational pull with which it continues to draw folks to work is likely to continue to endure, the apparent inevitability of those upright pushpins may be erased by the coming rise of ocean waters over the many of the same corporate campuses that ring the bay, which, built along the South Bay, seem particularly exposed to the danger of sea-level rise, so tightly clustered are they along a shoreline of particularly low elevation. If we allow ourselves to map the threatened rise of ocean-level based on current climatological predictions we can staggeringly map many of the largest players of the “Valley”–Intuit, Google, Facebook, Yahoo!, Dell, Cisco, Citrix, Motorola . . .–as lying geographically underwater in coming years.
Unless the Valley can, through the increasing integration of cross-platform technologies, make the world a better place purely through cloud-based platforms instead of a land-based workplace? What would happen if all the ample expanse of App-land, no longer protected from the rising San Francisco Bay, were to disappear? The current inevitability of seal-level rise–predicted to advance if current rates of carbon emission rise unchecked a further twelve feet in the coming century, placing much of the region underwater–suggest that the fluidity of the shoreline might be taken far more seriously as an eventuality.
Climate Central–Surging Seas/Mapping Choices
Already, much of the area faces considerably high hydrogeological risk, and suggest considerable density of vulnerabilities that Silicon Valley is just beginning to assess.
And a view from San Francisco projected several years past with Carto tools by Amanda Hickman showed the scary problems that developers in the region will face as the high-end projection of sea-level rise might raise water-level by about eight feet, in ways that would inundate a large part of low-lying coastal areas where many of the same region that is most highly colonized by tech, but providing a far more hard-nosed view of the danger of surging seas than the future-oriented boosterism endemic to Silicon Valley’s vision of itself.
The potential erasure by the bay’s waters seems not only an apt elemental revenge of global warming, but a fitting end of how a non-place might very well be the first places to actually disappear under the surface of soon to be rising seas.
We do well to see through maps, Denis Wood enjoined, urging us to detect the “human landscape” that lies superimposed upon the land in maps, and uncover the ways that the landscape has been changed–and orient ourselves to those changes that have been wrought by the “huge arrogance” that “we can name and we can claim.” Maps demand to be interpreted by scratching their surfaces, as if we could uncover how one might best “see through them,” to explore the landscapes that lie underneath the layer of words that lies on their beckoning if often all too opaque surfaces. Webmaps allow this level of interaction, often by playing on the conceit of the paper map. Indeed, the symbolic surface of the paper map–and the London Underground map in specific–have been used in a variety of web maps to suggest different notions of the “underground,” and to suggest the power of maps to alter one’s relation to place and space in provocative ways.
To take stock of how maps work by asking us to go about imagining the landscape that lies beneath those words is a way of uncovering their arguments about territories. The format of the audiofiles linked to a map of London’s Tube provocatively invites readers to explore its surface, in the clever pun advanced in the web-based maps of the London Sound Survey. For its links invite us to explore soundscapes that would otherwise lurk beneath cellulose surfaces, treating it less as the modern relation to space and place that the Tube Map advanced in its early twentieth-century iterations–than as a sort of recovery of a lost sense of the sense-base experiential waterways underneath the expanding city, that the paved city has in many ways repressed. The river that snakes across London today, mapped for its sludgy muddiness in many Google Earth terrain imagery, marginalized if not expelled from London’s built urban landscape. If the sinuous light blue line of river returns as a sonic reality as it laps along old unused docks and concrete pillars as one approaches its banks, its sounds letting the city disappear for a moment, the sounds of the Thames returns int this may that adopts the form of the underground Tube line of the built environment of the twentieth-century resurfacing of the city.
Web-based maps such as Sound Survey of London’s waterways indexed offer modes to remap the known environment of the city in new ways: the choice to map the riverine network that is rarely seen in London seem specially suited to the conventions by which Harry Beck‘s almost universally recognized diagram of its Underground specifically invited users of the London Underground to re-see their own environments, offering a way to encourage map-readers to navigate the built space and neighborhoods of London as able to be readily accessed by the Underground. The striking modernity of the circuit-like 1933 Tube Map that invited users to so successfully read the access to space the Underground offered at a distance from lived space, yet in ways that its simple form foregrounded utility, it offered an icon of the modern urban plant.
It was, of course, as it happens a radical revision of the attempts to picture the London Underground. The space of the tube was not only a new way of understanding place, but time, in strikingly modernist tones by artist Hans Schlegel–he signed the lithograph as “Zero”–suggested, as a new way to navigate space, adopting icon of the Underground to a map, as it offered an ability to negotiate urban time,–
–as the surrealist invited on to experience space by a new tool that “gets you there” in ways never possible before, warping space-time in ways that were entirely to the modern citizens’s advantage, a user in this case typified by the new subject of urban space–a man in a suit, bowler hat, and white gloves–who meets the demands of his job by the circuits that lie beneath the city that allow him to arrive on time. He is checking his watch in ways that suggest the timepiece had been replaced by the Underground to affirm its utility beyond only navigating a built space. London Transit used graphic arts to promote the new Tube as a basis to experience the city in many ways, and indeed experience to navigate the Thames, just a few year earlier, that suggest not only their investment in graphic works to reorient viewers to space, but to remap urban space by the river–the most important, perhaps, orientational path of the city’s neighborhoods, even as they were replaced by city blocks: streets were organized in relation to the Thames, historically, but the underground, in this lovely 1933 poster, proposed its utility as a way to access views of the river–
The Boat Race: Oxford-Cambridge Boat Race Map, 1926
–and specifically of the Cambridge-Oxford Race that was run annually on London’s Thames in one section–that in 1926 mapped the stations of the Underground to “travel to your view point” to watch the race–but took the river as the main course by which the riders of the underground would need to be oriented. In contrast to a map of taking public transit to watch a race–or to arrive at place on an urban river’s course–the new Underground map that was designed some seven years later after the diagram of electronic circuitry elevated its geometric form above the urban topography or indeed the urban sensorium. Beck’s innovative design for the map printed in January 1933, took as its logo and model, in many ways, the novel emblem of the underground tube–the Underground, as it was called, or Tube–as a geometric creation that replaced the urban soundscape, and a utopic idealization of space.
This was a new way to understand how one could experience the river that the Sound Survey may have not known, but offered something of a symbolic foil to in asking us to view the river–or The Boat Race–in new ways via the access points the Tube provided to out-of-towners who arrive for the popular sporting event, akin to later campaigns to use public transit to access football stadia. The actual boat race–The Boat Race, as it were, founded in 1845, beginning half an hour before high tide on the River Thames, which has been from its founding timed to start on the incoming flood tide, and allowed numerous viewing points on piers, breweries, football clubs and taverns that lie along its 4.2 miles, or the steps that front upon the river, for crowds of spectators to gather and assemble. But the distortion of the river was, already by 1926, the point. The race between Oxford and Cambridge teams for which an umpire provided a running commentary for the first time in 1927, perhaps to accommodate the larger crowds who took the London Underground to preferred viewing points, accommodating the river’s course to the transit stations’ locations–even suggesting the degree of punctuality of arriving at a station to view the winding paths that the boats actually took on the river, comparing the directness of the transit line against the course that were taken by the crew teams.
It’s no surprise that the Underground map from the late 1920s distort the path that the Thames takes between bridges, as Londoners well knew, was actually a far more sinuous course–navigating the bend is the point of the course!–on the four point two mile course running between Putney Bridge to Chiswick Bridge. But to illustrate how the Tube accommodates to its path, the straightness of the lines of tube track are privileged far above the actual riverine path in the 1926 map , , to which the tube accommodates.
But the attempt to reconcile the tube’s course to that of the river may have been a question of epistemic orientation by the 1930s, as a new geometry of the Underground first proposed by Beck in 1931 redefined the space of the underground. Beck used a geometry of 45 degree angles and diamonds to illustrate interchanges and stations that invite observers to reorient themselves to urban space free from the river’s course–indeed to focus their orientation to the network of tubes on which public transit ran. The map conceals massive effort of labor of building an underground infrastructure where immigrants laid track and dug ditches beneath the city, but the infrastructure soon became far more prominent for many Londoners in future generation than the map of the city’s landmarks, and was intended as an icon of British engineering if not the urban metropole.
The Sound Survey Map of waterways offered a sonic counter-map on in online form, as an attempt to reverse the building of anthropogenic space, by examining the sonic sites where the river returns to audible presence. In orientng its users to the presence of the Thames over the urban hubbub that defines London today, it shifts atteniotn from the anthropogenic built space, providing auditory evidence of the presence of the water that the Beck map overlooked. If the oval emblem that served as the key in the circuit-like map at forty-five degree angles that cast interchanges as diamongs and stations as notches was proposed to shock and consternation, remapping the built city for users of public transit in utopic ways in then following years–
Harry Beck, Tube map (1933; designed 1931)
–now akin to a Union Jack as an emblem of pride in English engineering ability to provide the smoothing of space in an infrastructure of smooth movement, both to escape urban congestion and arrive across the city in record times for work, as the lithograph by Zero–Hans Schlegel–affirmed in stark modernist terms in 1935. The promotion of the Tube as affording (and promoting) a modern form of urban space suggested a revision of all earlier urban maps–“All that is solid melts into air . . . “–as the known form of the city melted into the geometry of a circuit map, untangling the tangled streetpaths of modern London in crisp terms readily navigated by its perfectly symmetrical and smooth routes, a technological progress that was a sort of symbolic metaphor of the smooth modernity of the smooth ride that the Tube offered its passengers. (The aptness of the visual metaphor made the form so much more effective, promoting the Tube as offering a new way to move through urban space, in ways that the Sound Survey Map–and we will come to it soon!–seems to seek to pull back for its users, uncovering the lost sounds that the built city plant sought to erase.)
The images of the Underground break form the alluvial settlement of the expanding city from its past in definitively modern ways. While in a day when the London Transportation Authority offer City Mapper, an the ability to track one’s place on the London Underground on handheld devices, without every really needing a map, the smoothing of space has been accentuated–even as the actual lines of transit infrastructure has become considerably more complicated and tangled, both with the exponential expansion of the city that sets new standards for urban growth and neoliberalism. Perhaps the greatest sign of neoliberal achievement is that the map devolves onto our handhelds, as if consigning paper to the past; but the old pocket transit maps are given new life in the web maps that folks as the London Sound Survey have devised to bring the river before our ears, and invite us to reconsider the benefits and losses of mapping urban space.
Of course, the point of such interactive maps is to orient us as urban residents to the surroundings that the built infrastructure has long elided, and increasingly threatens to obscure. There is something remediative and restorative in a map of London’s everpresent river, that reorients us to the river of the riverside city. The Sound Survey Map asks us to use our ears to acknowledge the iconic map’s utopic nature, as it asks us to reorient our sense to the river waterway that the tube replaced, by excavating the sounds of buried waterways. Indeed, wherea pocket guides to the London Underground sold by UER before Beck’s design were startlingly sinuous, as in 1908, displacing the river from attention, in favor of an alternative infrastructure of railways–
–but almosty investing the tubes of the Underground Railways with a sinuous aspect of its own, respecting urban topography, if acknowledging the new transit web lay beneath, apart from, if ancillary to urban streets.
Whereas Beck’s iconic map promoted the primacy of the drafting table and the engineer, a form of engineering that might have well seemed overly radical and ecxessive in the lived environment of pre-war London, the web-based map is a sensorial register reminding us of the presence of water that the underground displaced.
In the Sound Survey, all “transit” lines are shown in their entirety, as if to return tthe river to a prominence it long held in London’s plant. Indeed, save the District line which is only shown as far as Mile End, the rest of the stat image offers an apt way to invite viewers to excavate audible aspects of the city absent from a drawn map, in a truly phenomenological map of the circuit of hidden waters beneath London. If subways are often noisy, the sounds that the Survey has compiled offers a somewhat synesthetic compilation of the hidden waterways that might be seen as corresponding to metro stations, less as a disembodied circuit–as Beck’ map–than as the subsurface lying underneath the engineered world. Beck’s map sanitized the subways in streamlined fashion to attract Londoners to the Underground, readers are asked to explore the waterways that emerge only in its parks, bridges, and channels linked to watery paths which we rarely see which run under and about its surface before they enter the central artery of the Thames.
Rather than by mapping the city’s space in reference to its individual streets or intersections, but by placing the rivers of the Survey maps waterways’ sounds in ways that recuperate their perhaps forgotten presence. Wood remapped the lived community of Boylan Heights so that is not only as a place in Raleigh, North Carolina, but charting the “metabolism” of the community in maps of the light street lamps cast, lit jack o’ lanterns placed on porches at Halloween, paper routes Wood ran with a tightly knit cohort in his youth, or “squirrel highways” of aerial wires, which collectively serve to unpack the often invisible ways of “how it works.”
One might compare to this set of maps the ways in which maps in the London Sound Survey invites readers to enter an overpowering pointillist accumulation of local details, and similarly serve to map a setting in which everything sings–or at least we can enter its audible surface at distinct points.
We read more maps than ever before, and rely on maps to process and embody information that seems increasingly intangible by nature. But we define coherence in maps all too readily, without the skepticism that might be offered by an ethics of reading maps that we all to readily consult and devour. Paradoxically, the map, which long established a centering means to understand geographical information, has become regarded uncritically. As we rely on maps to organize our changing relation to space, do we need to be more conscious of how they preset information? While it is meant to be entertaining, this blog examines the construction of map as an argument, and proposition, to explore what the ethics of mapping might be. It's a labor of love; any support readers can offer is appreciated!

 Nuremberg Chronicle (1491); fol. 13 (Anton Koberger, Nuremberg)
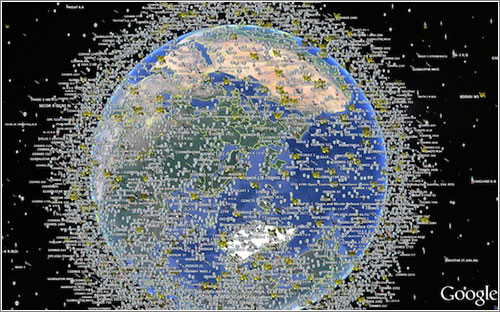


 New York Times Magazine
 © Matthew Pillsbury / Courtesy of Benrubi Gallery, NYC
 New York Times
 Oakland, CA
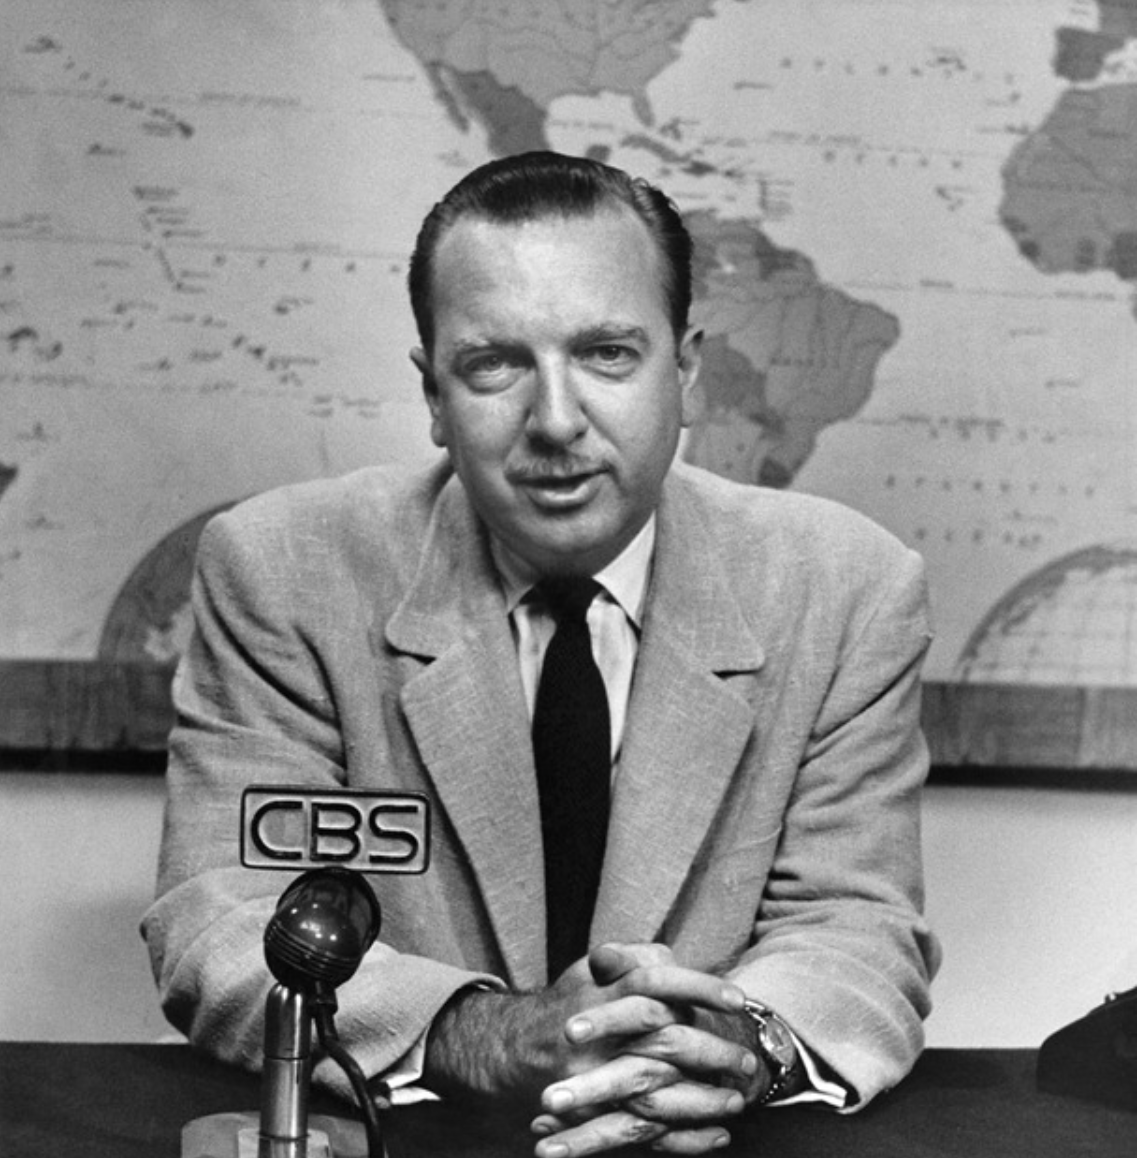


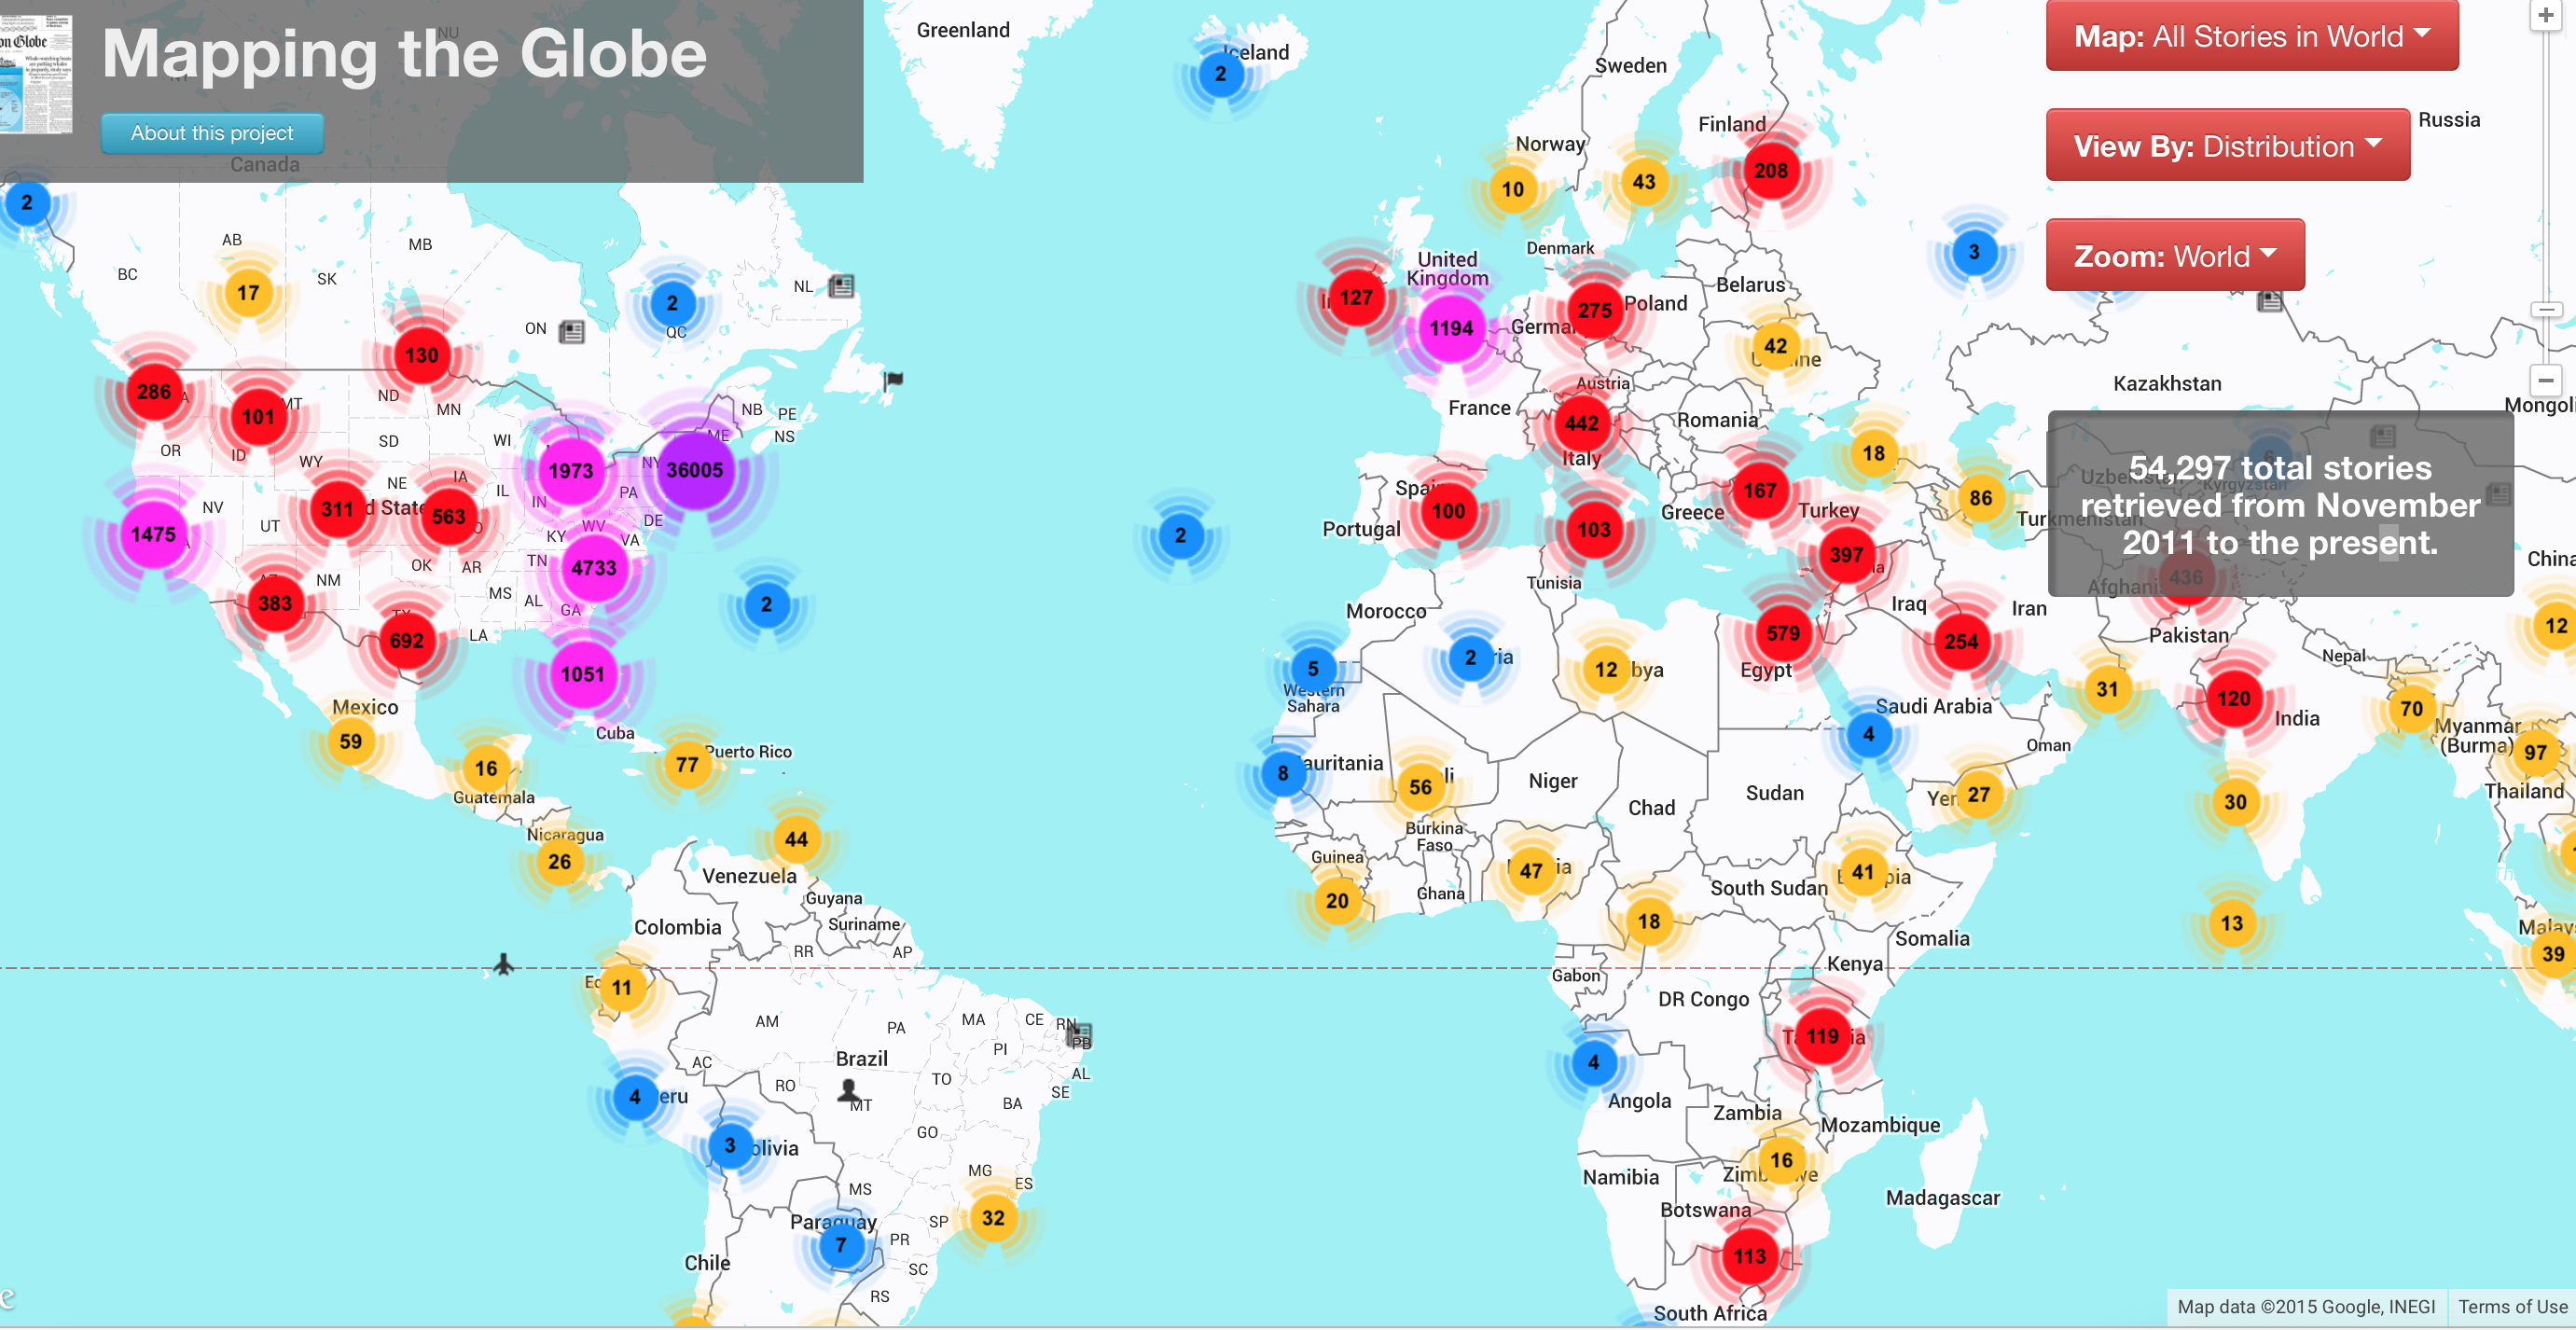


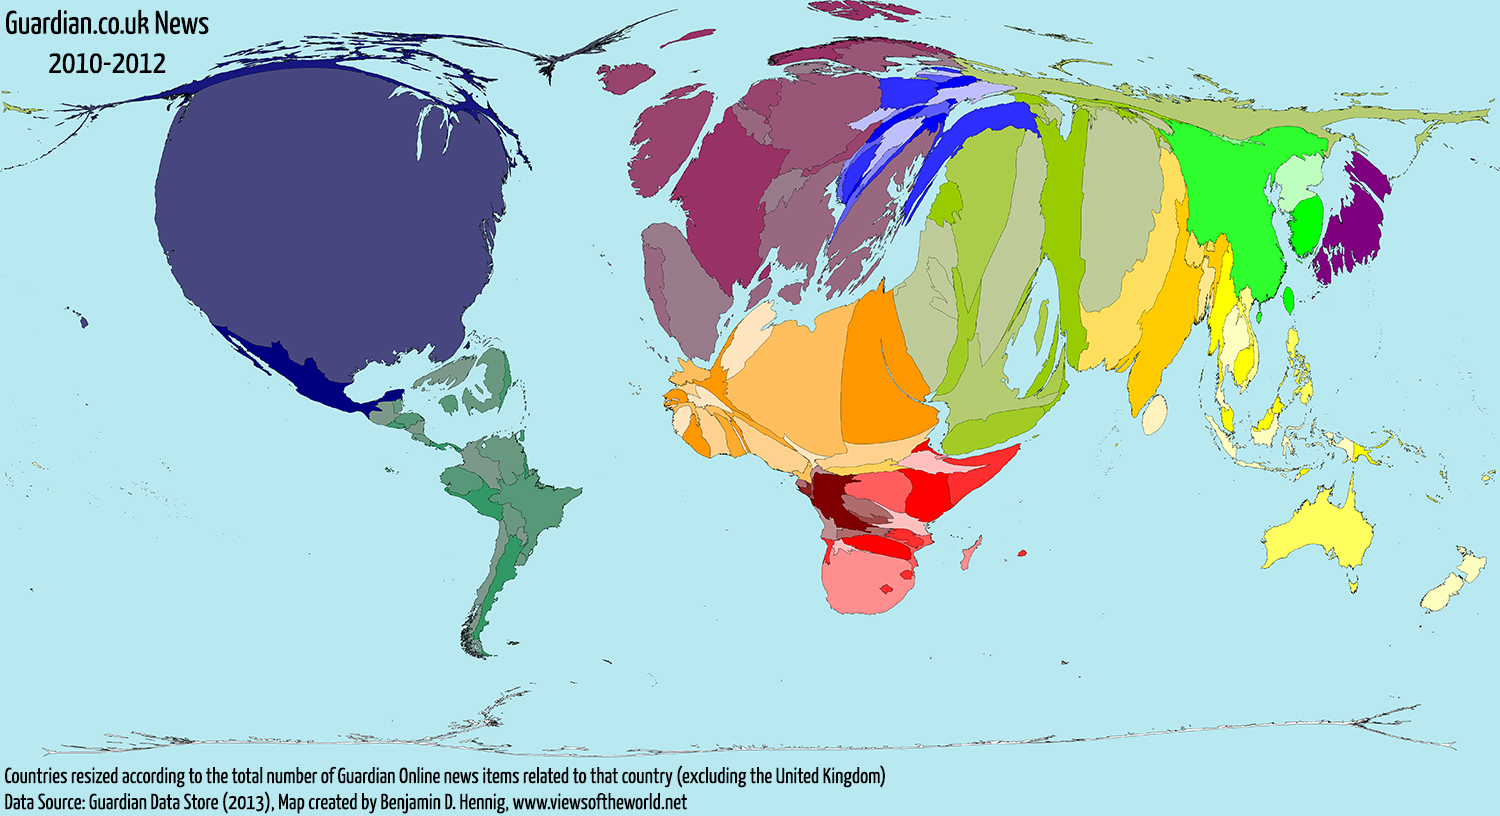
 Cattelan/Ferrari
 Cattelan/Ferrari (detail)
 New York Times
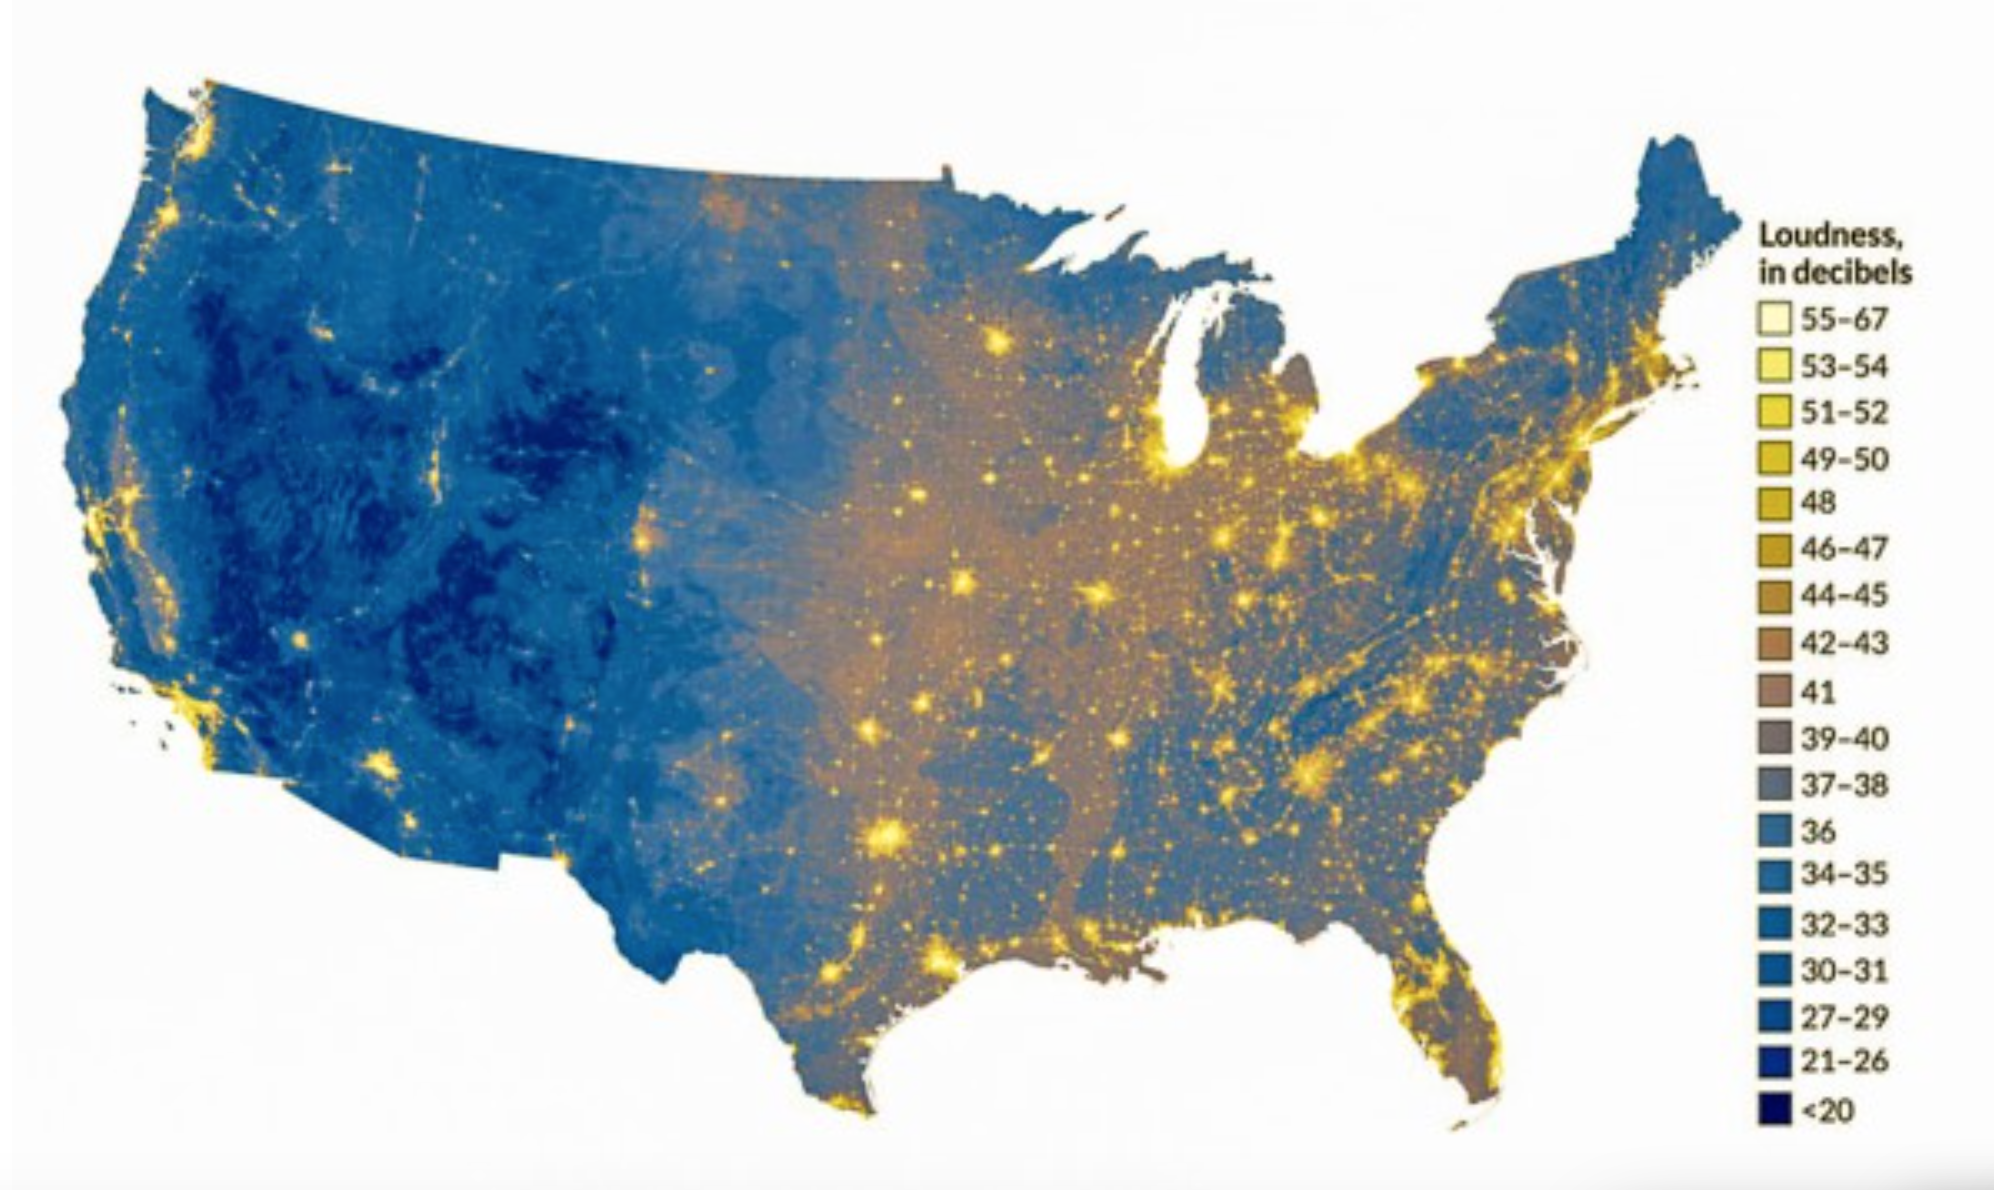

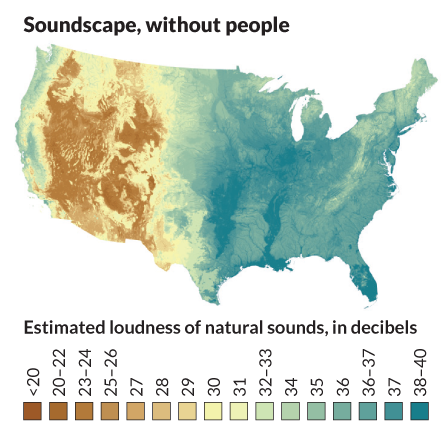
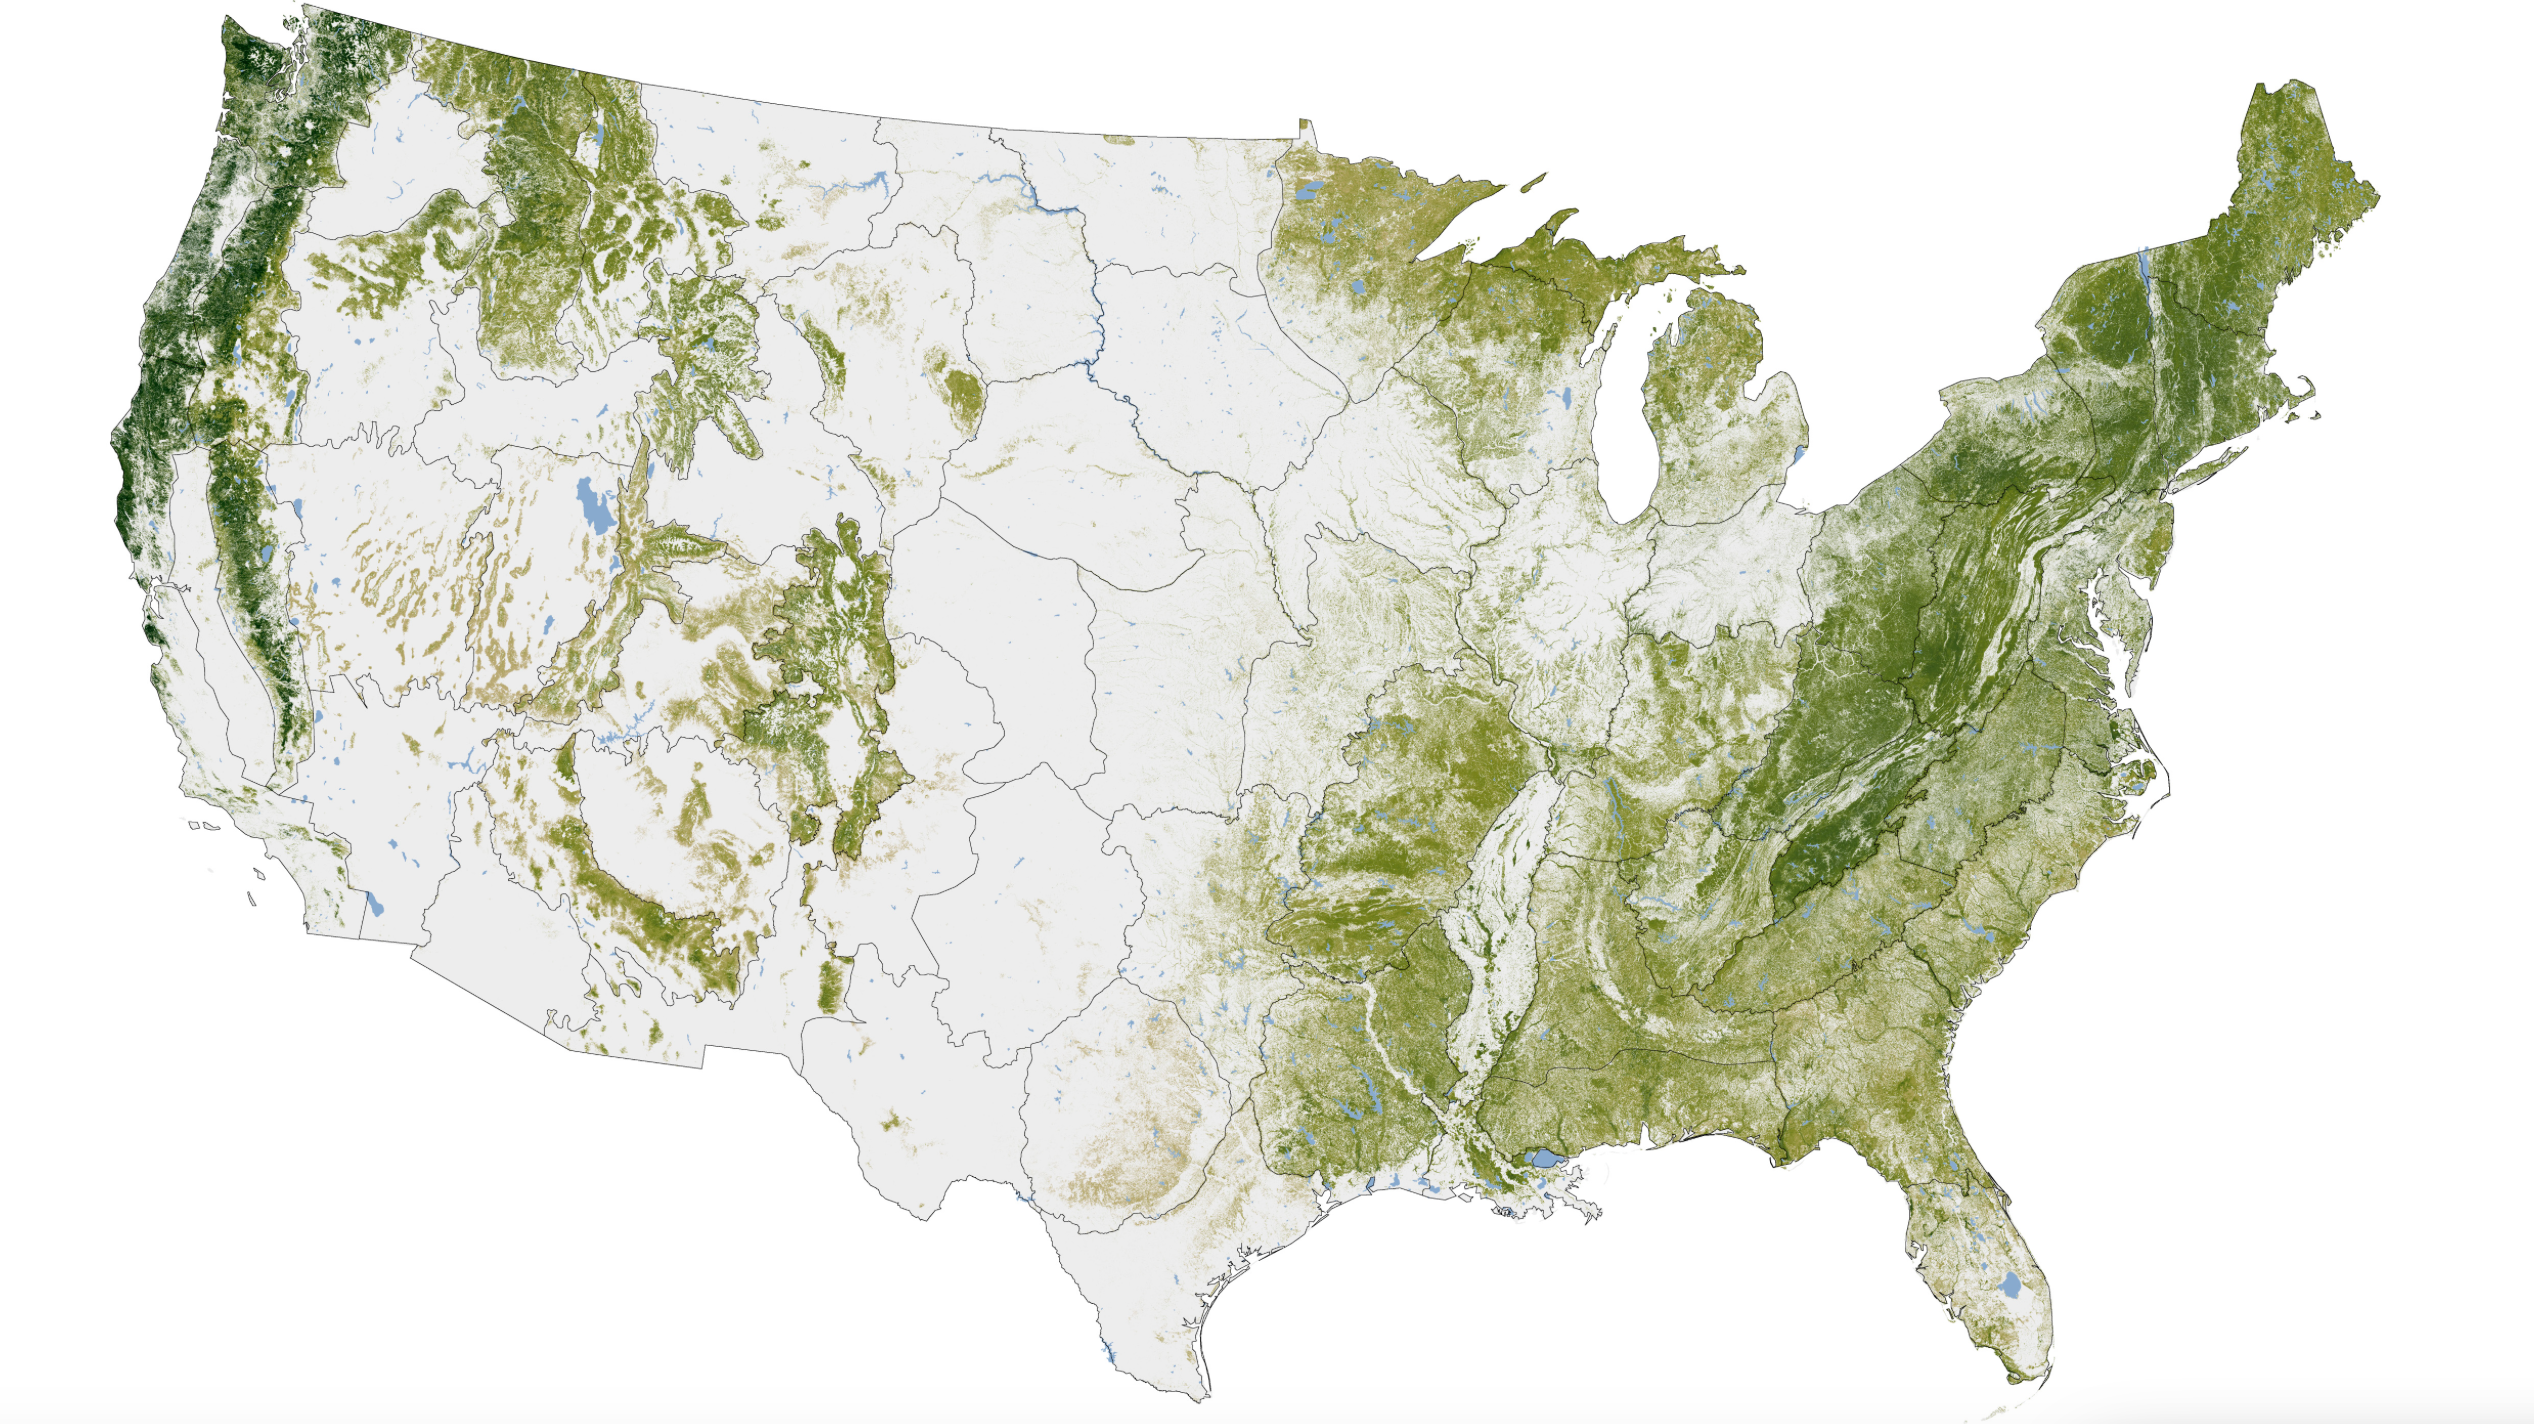
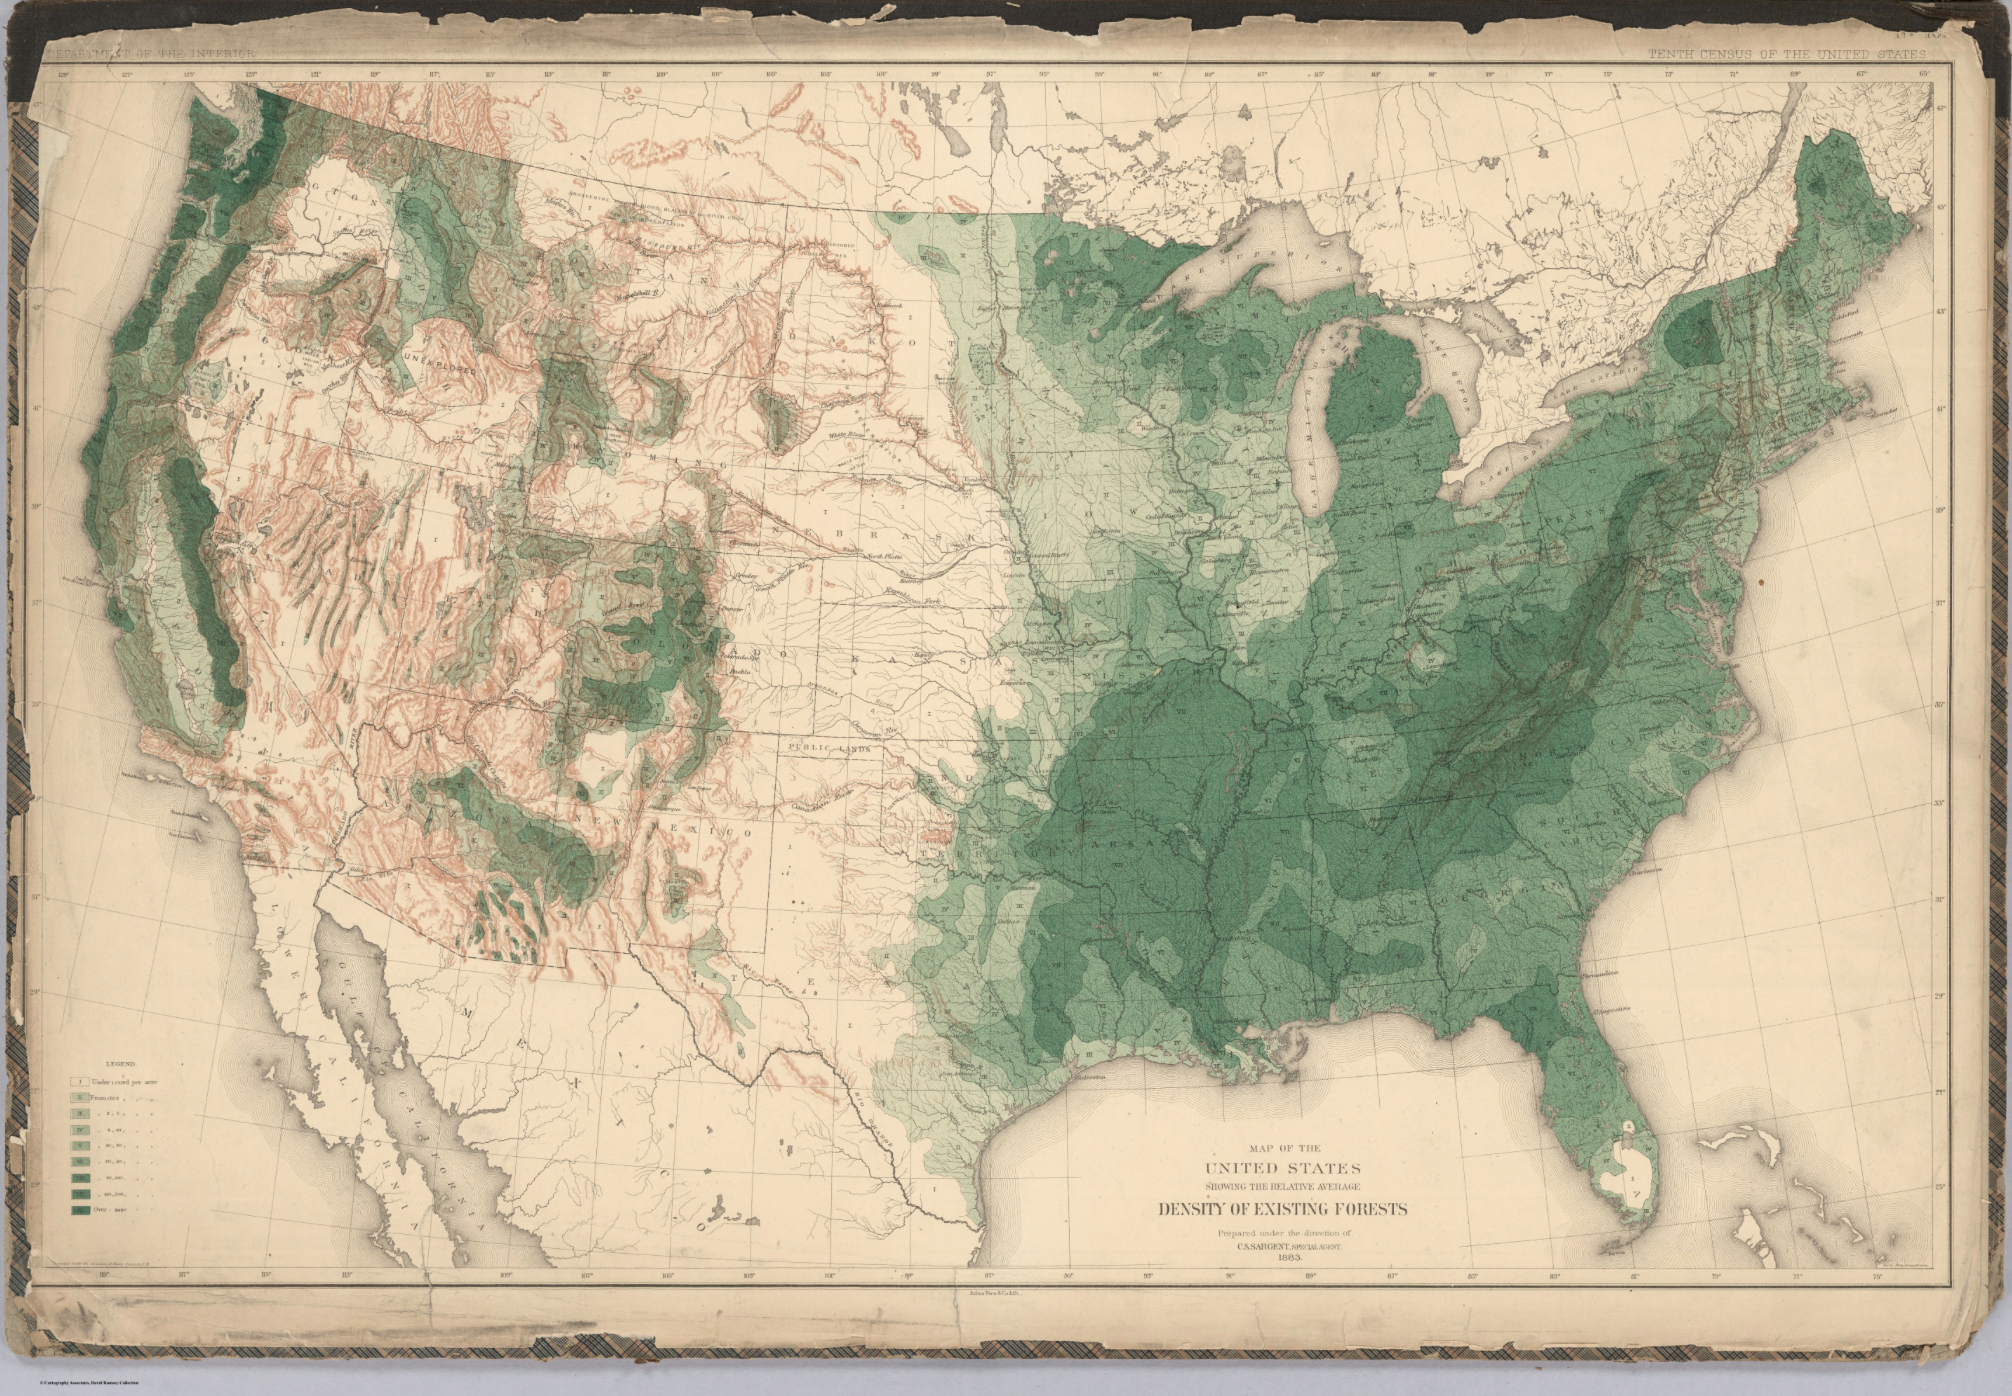
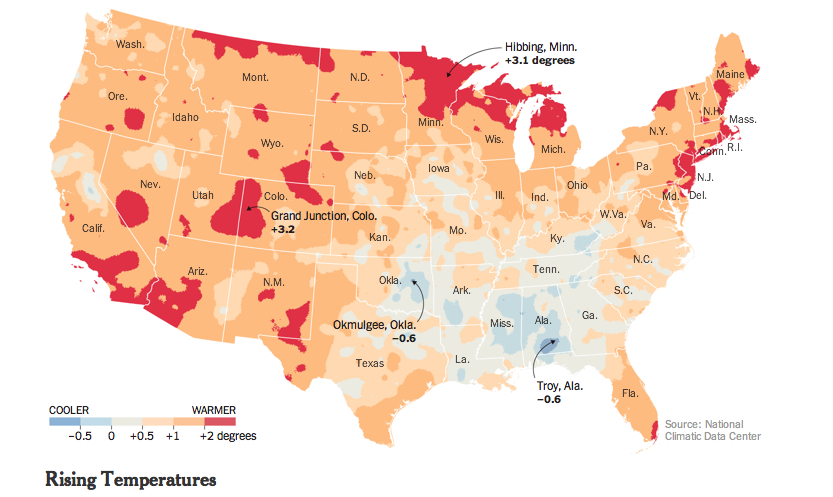
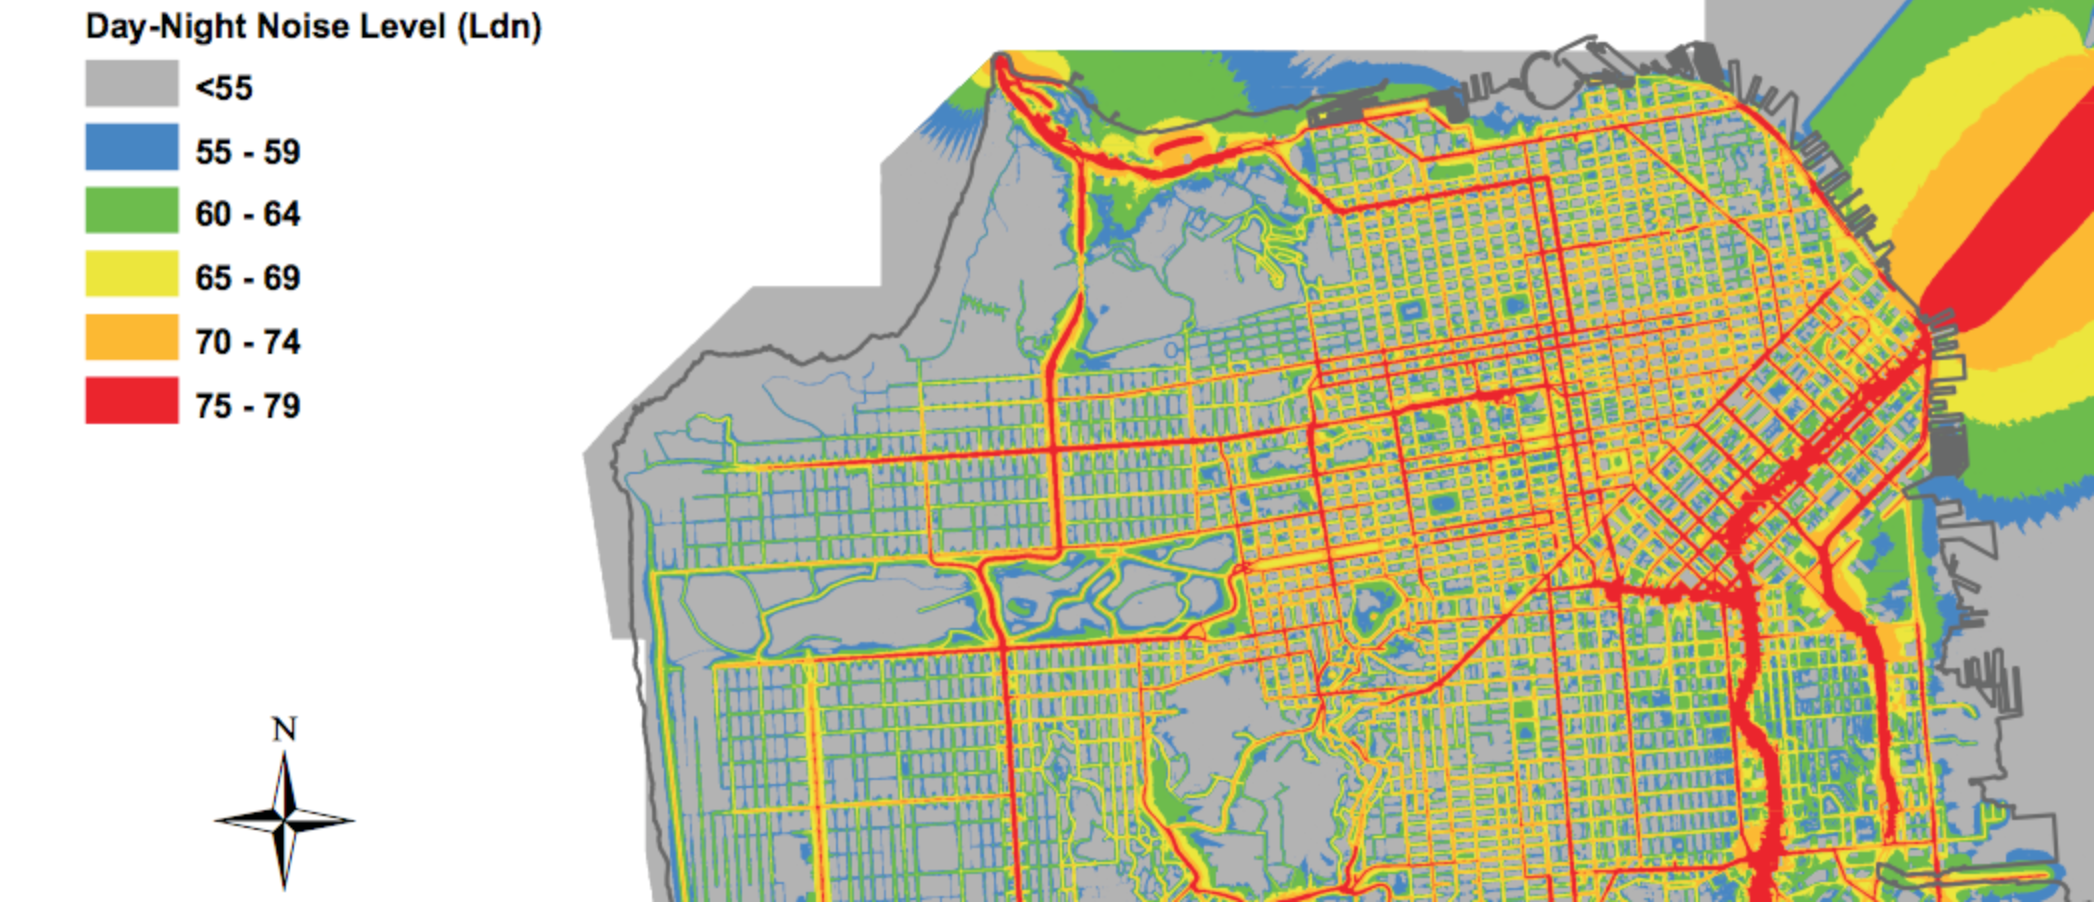
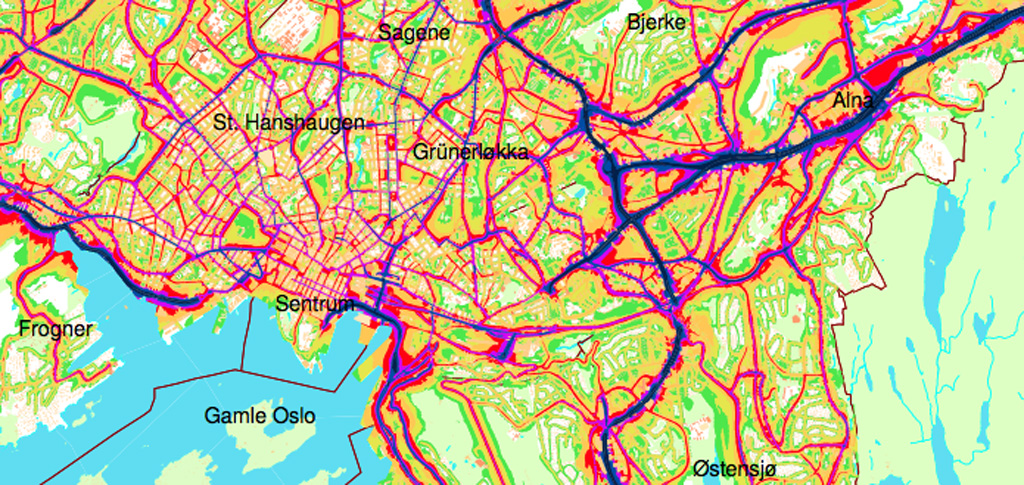
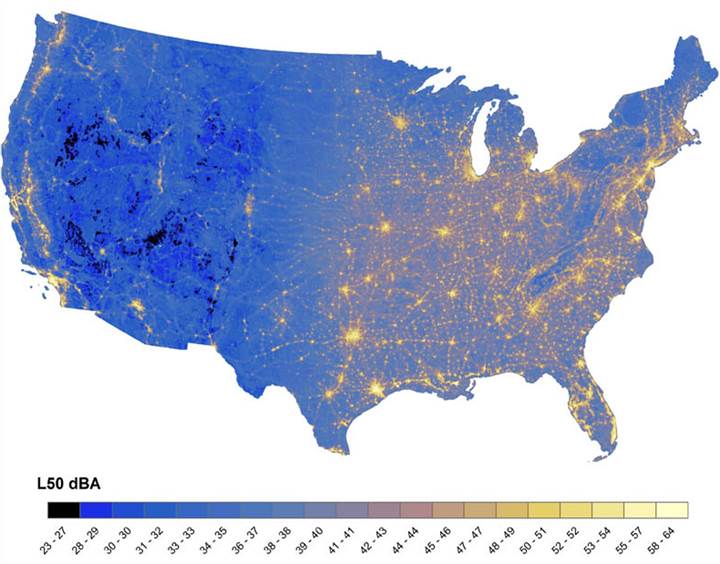
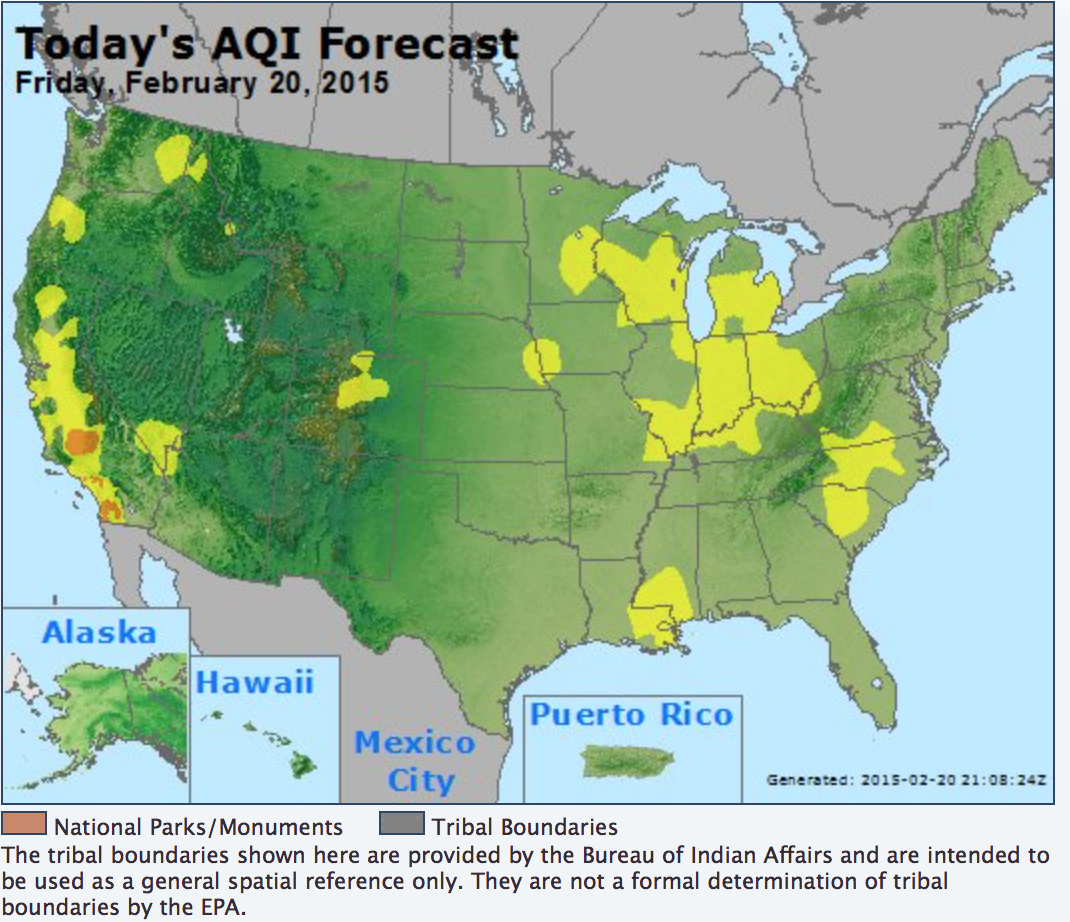
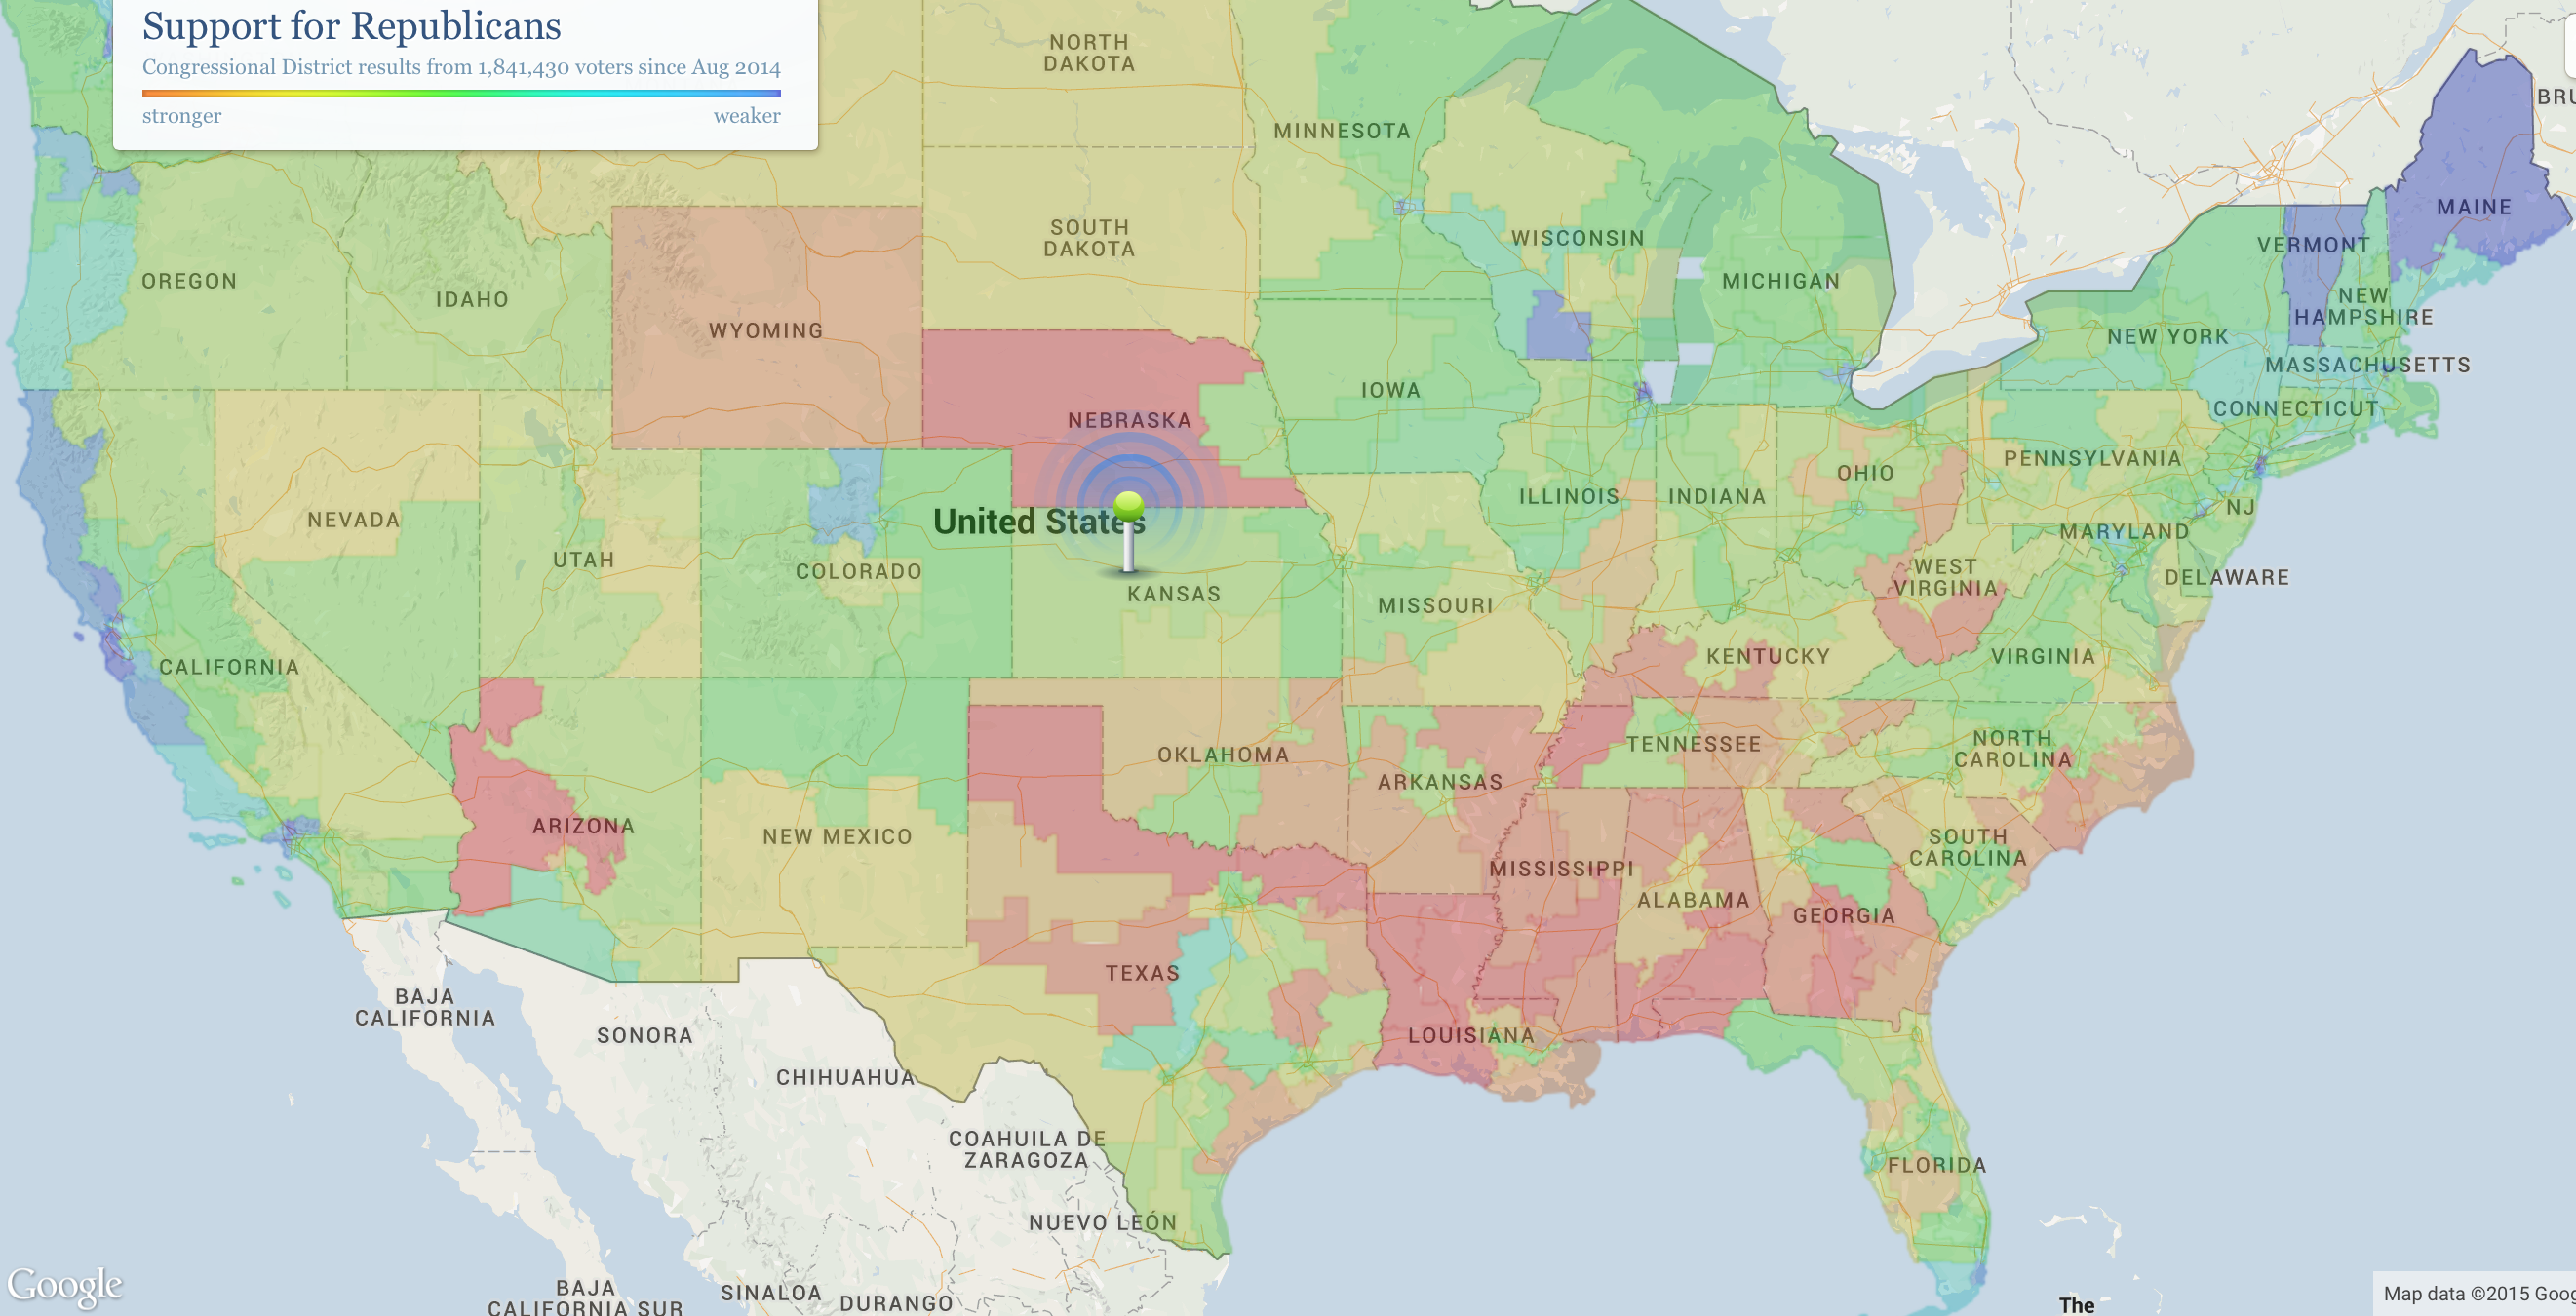
 Davis, Good Roads Everywhere (1912)

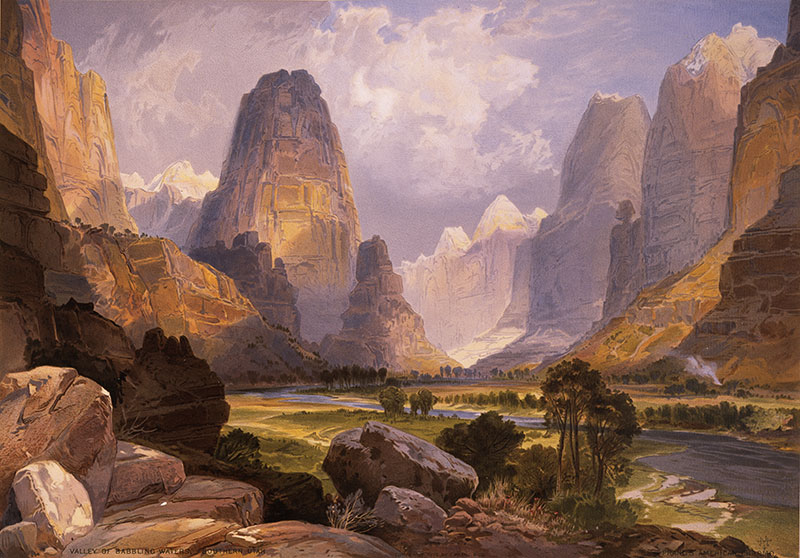
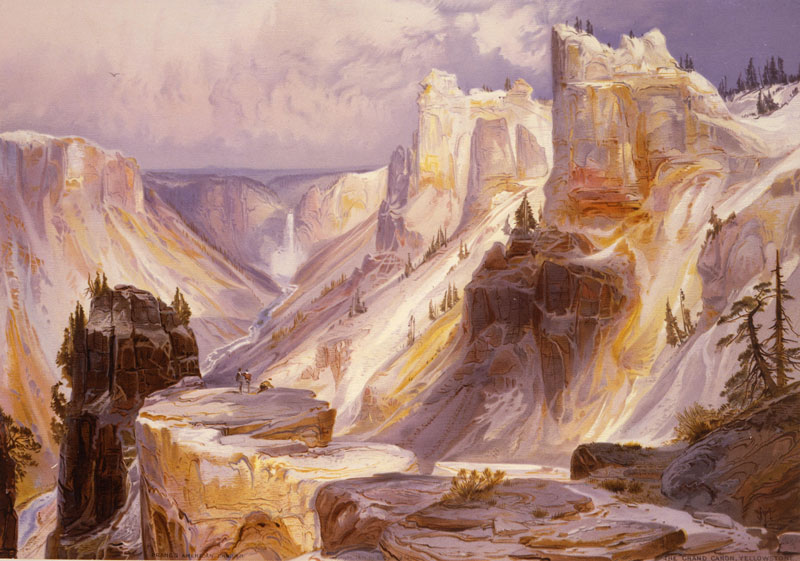
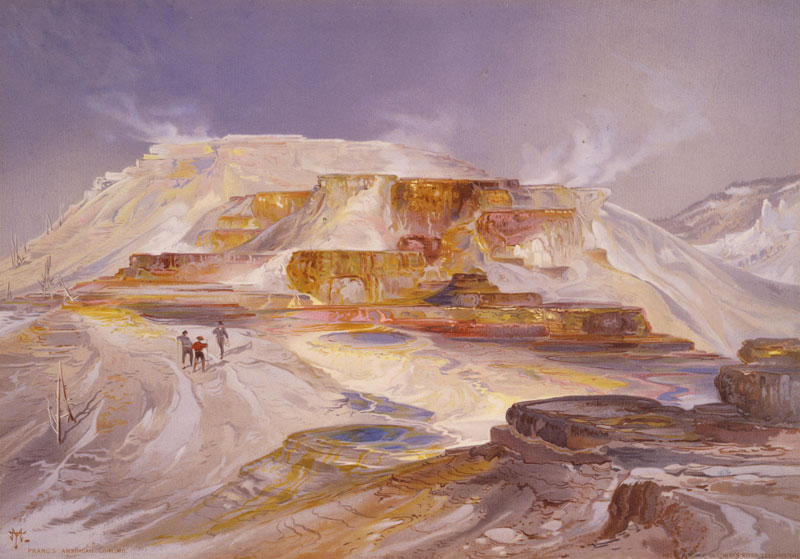

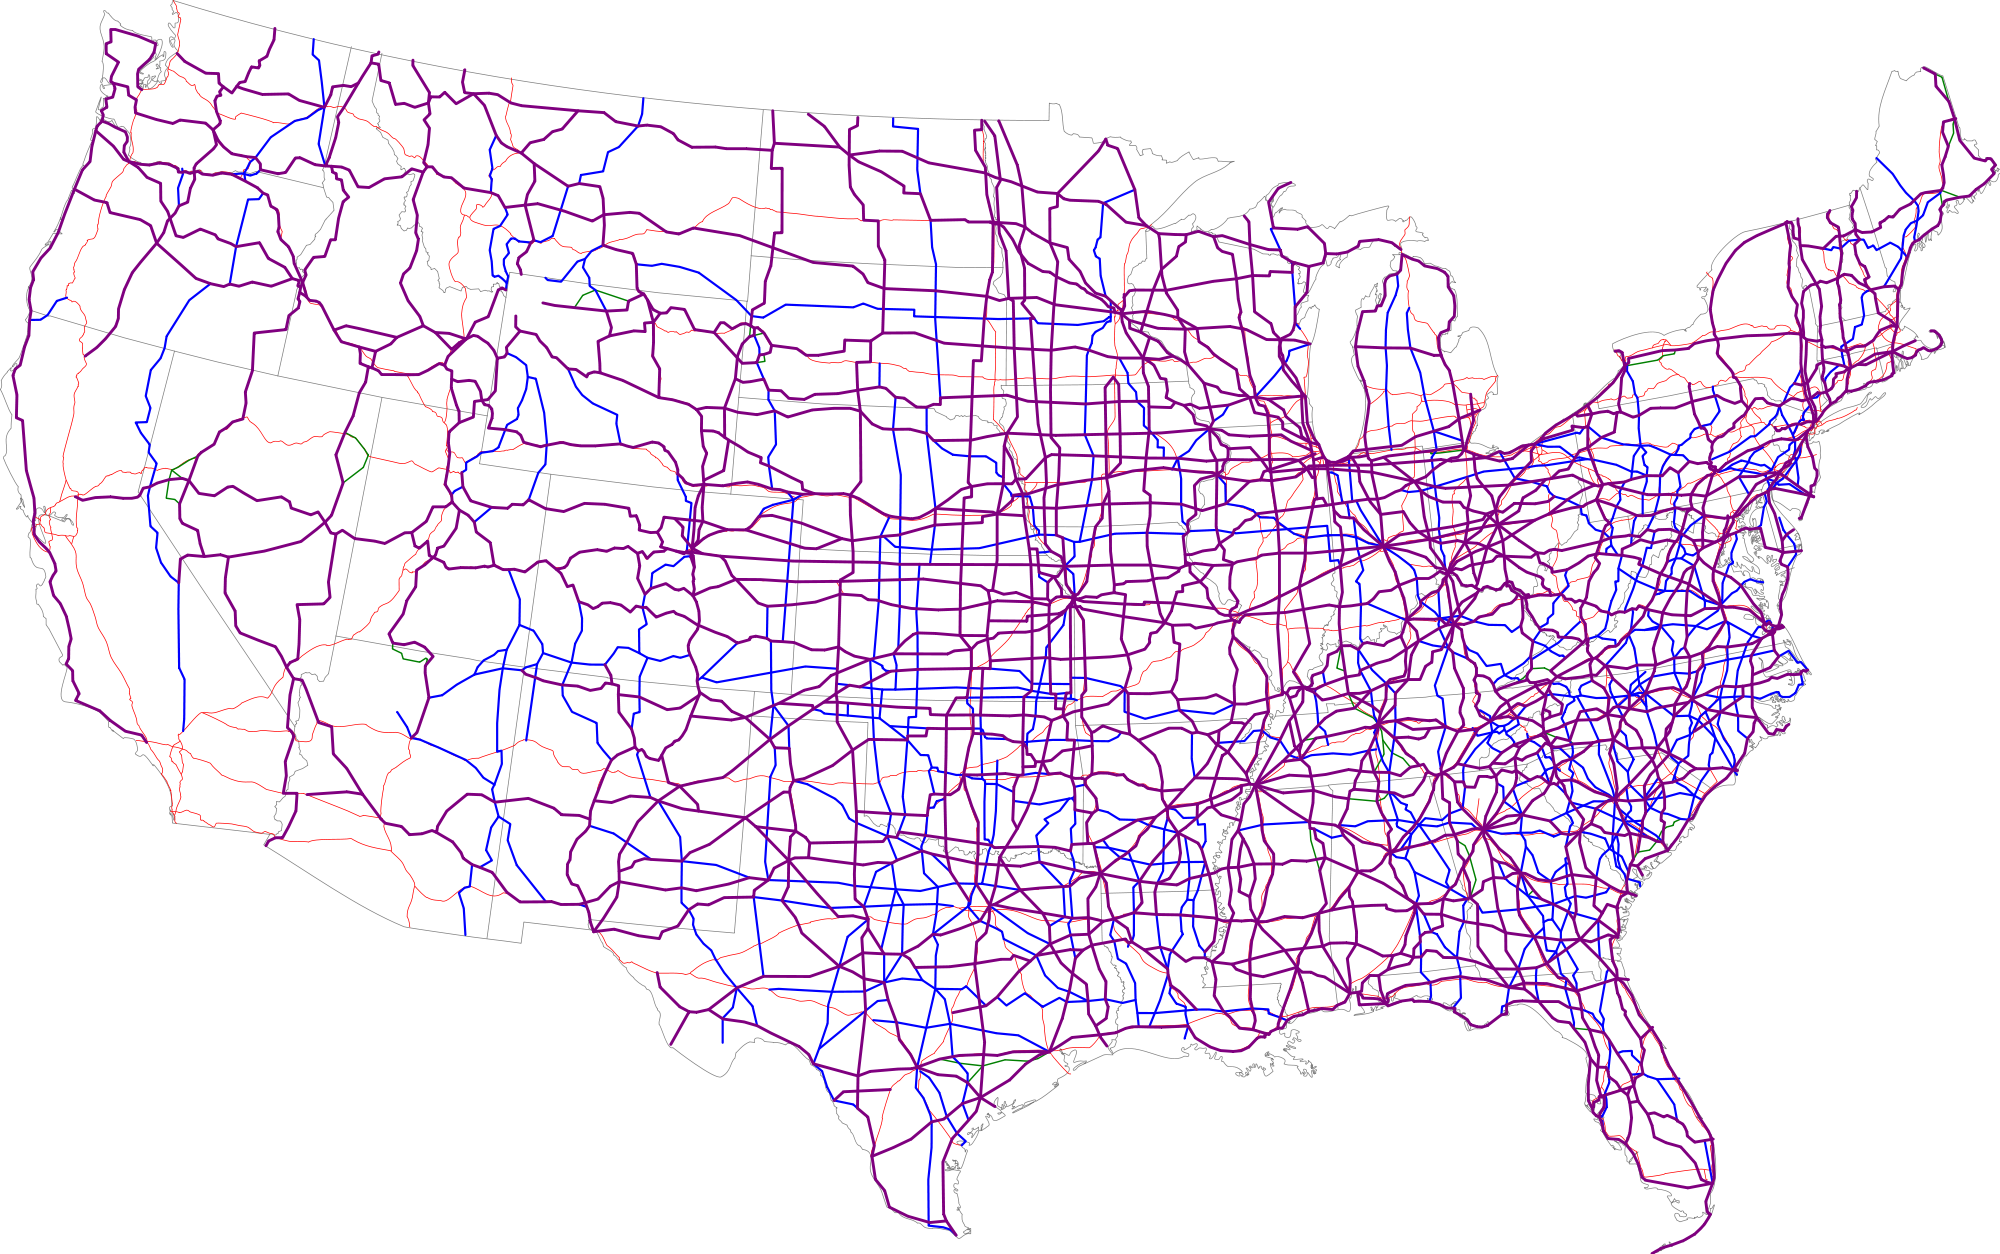

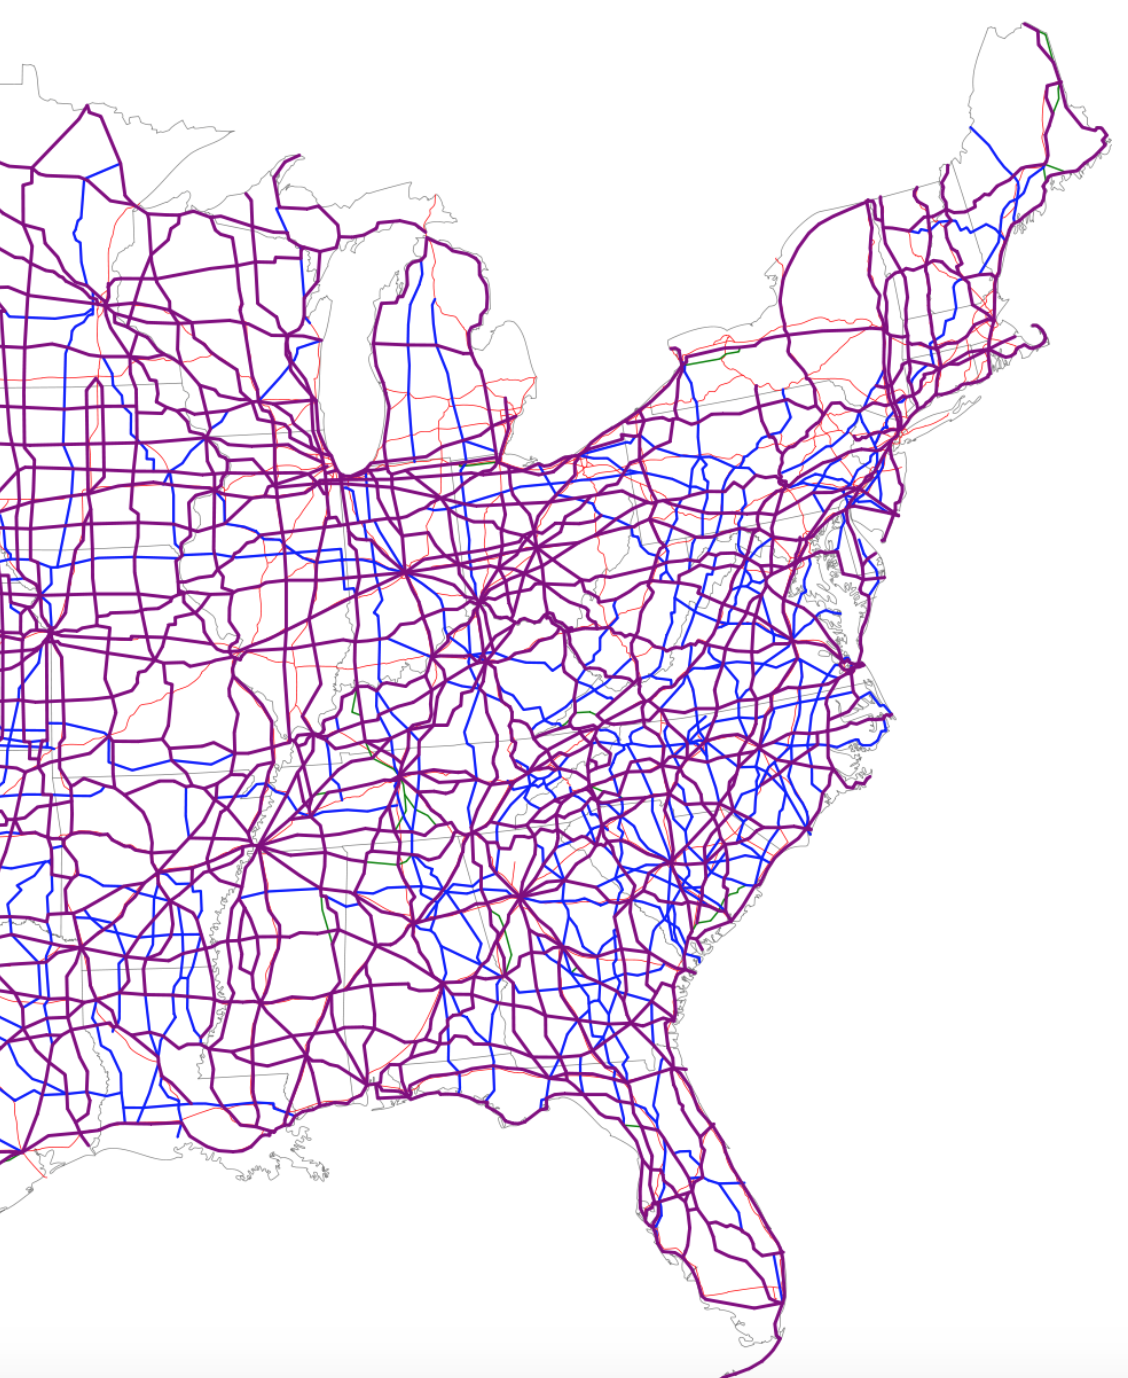
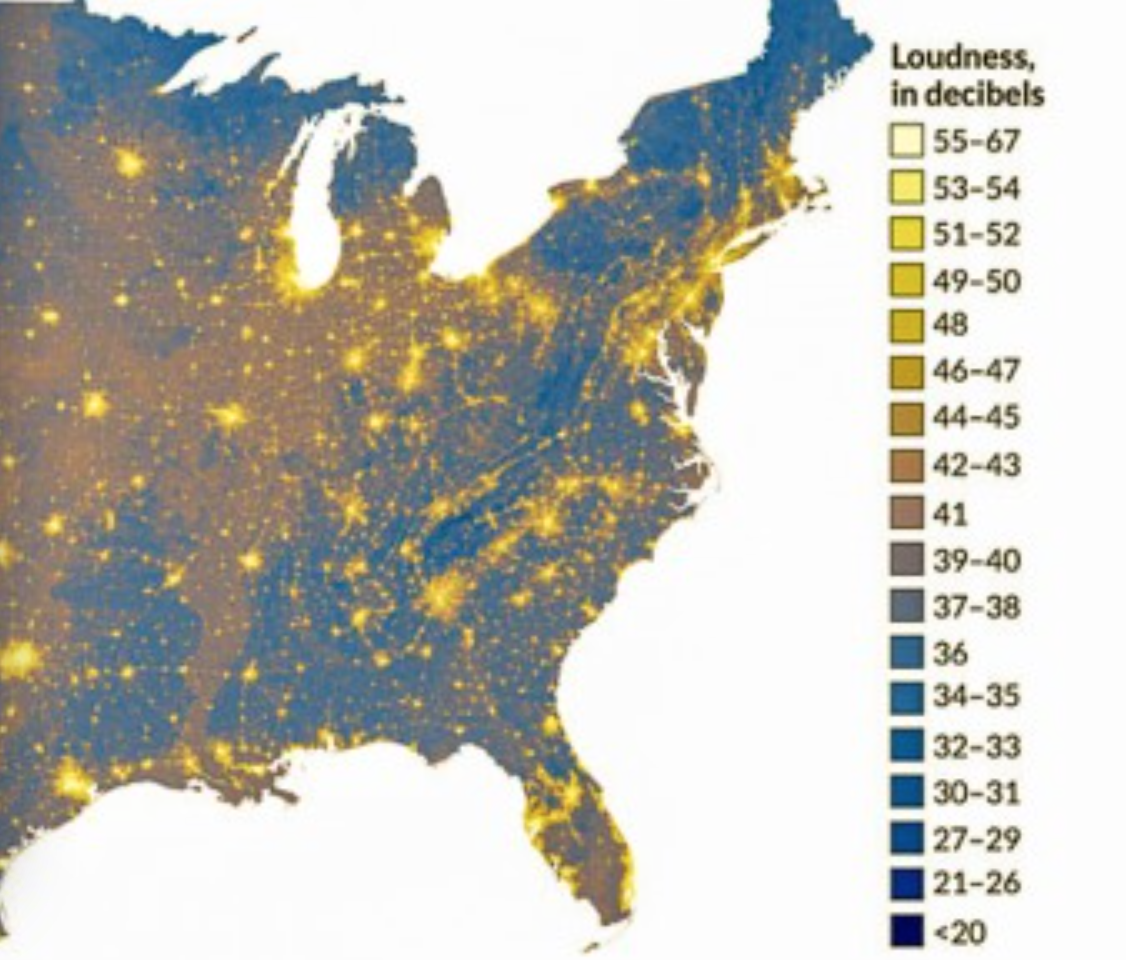
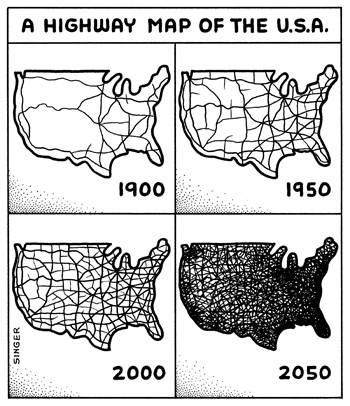

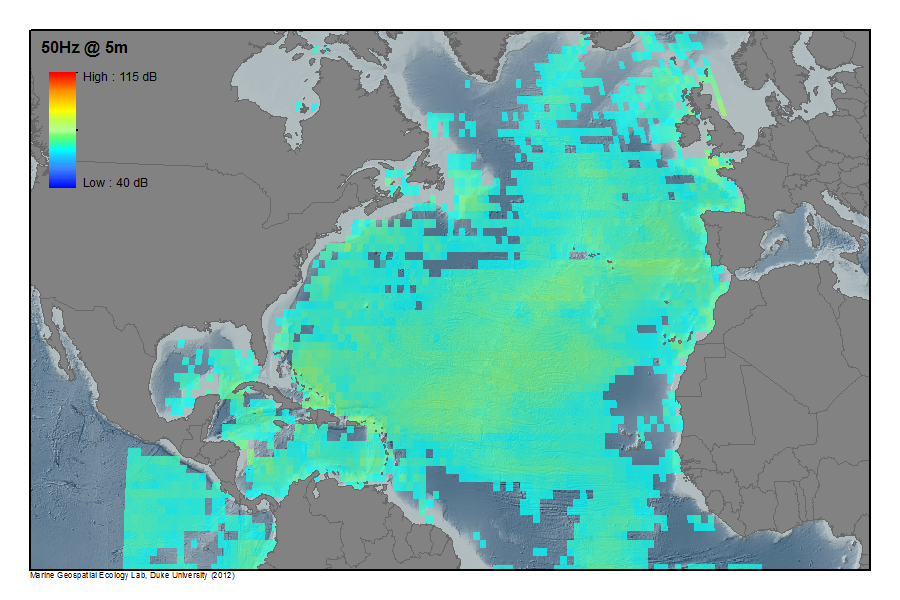

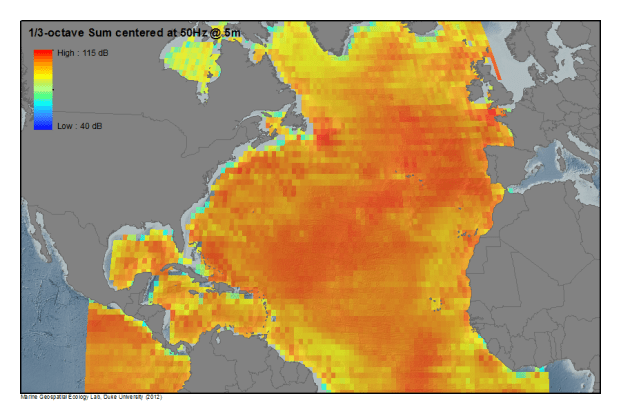
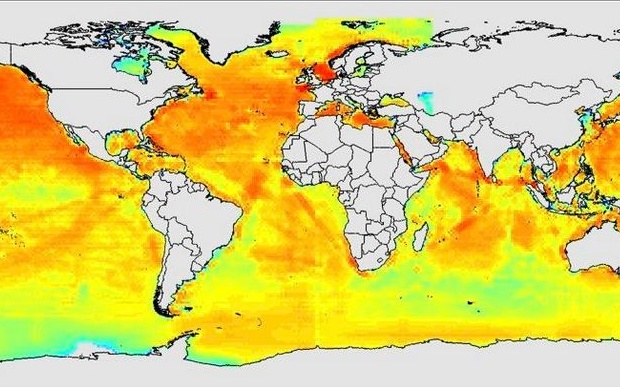
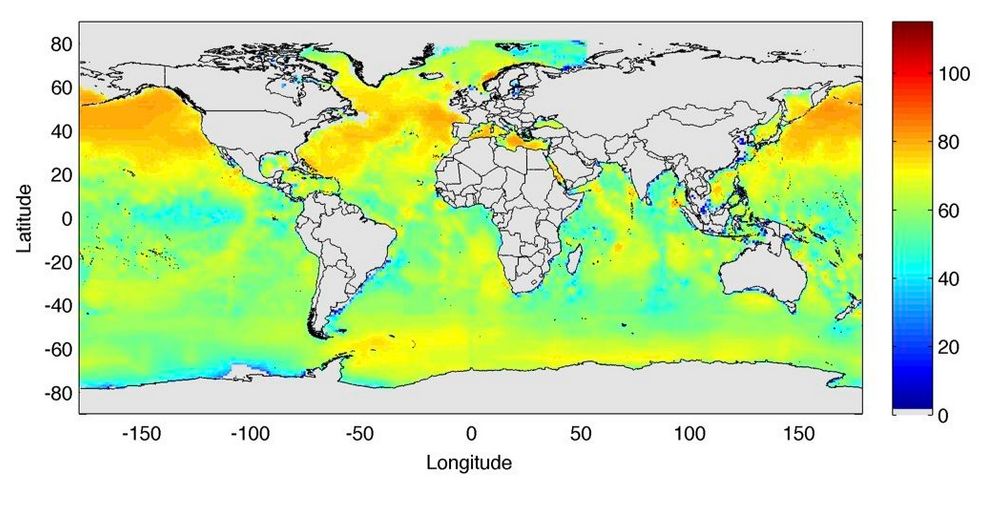
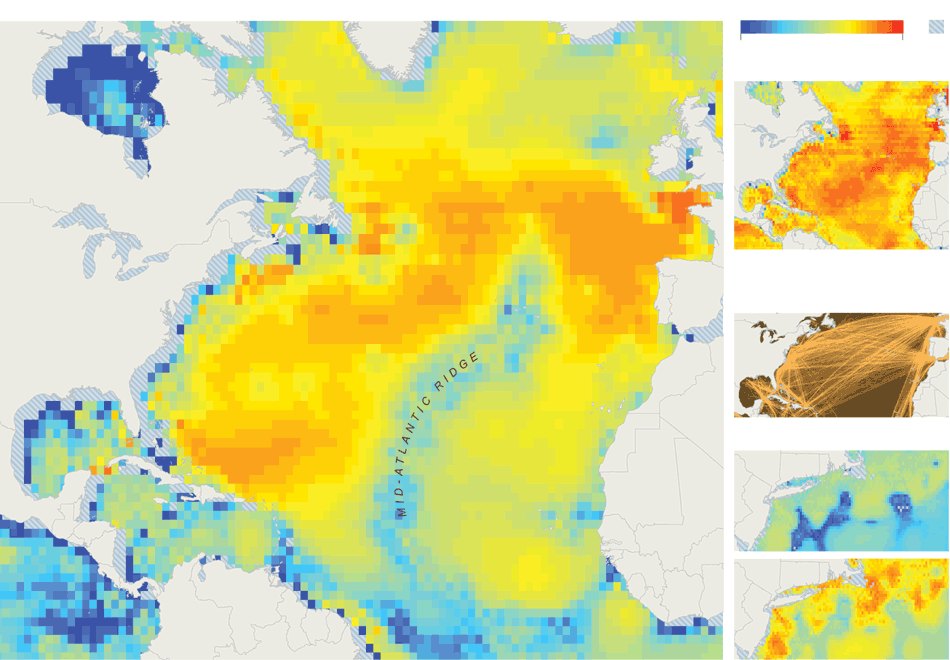


 R&D spending intensity in California metro areas/Source: Milken Institute
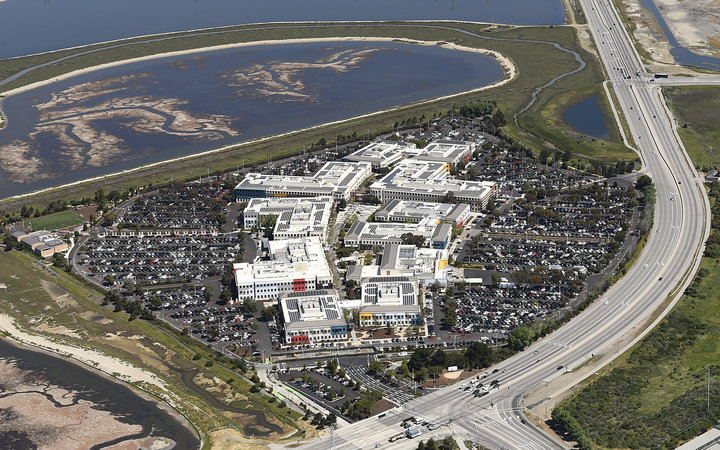

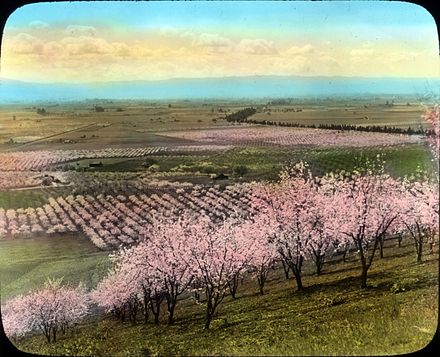


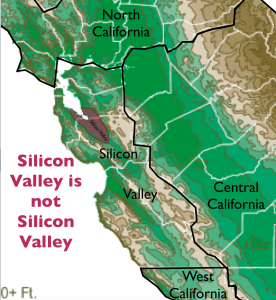


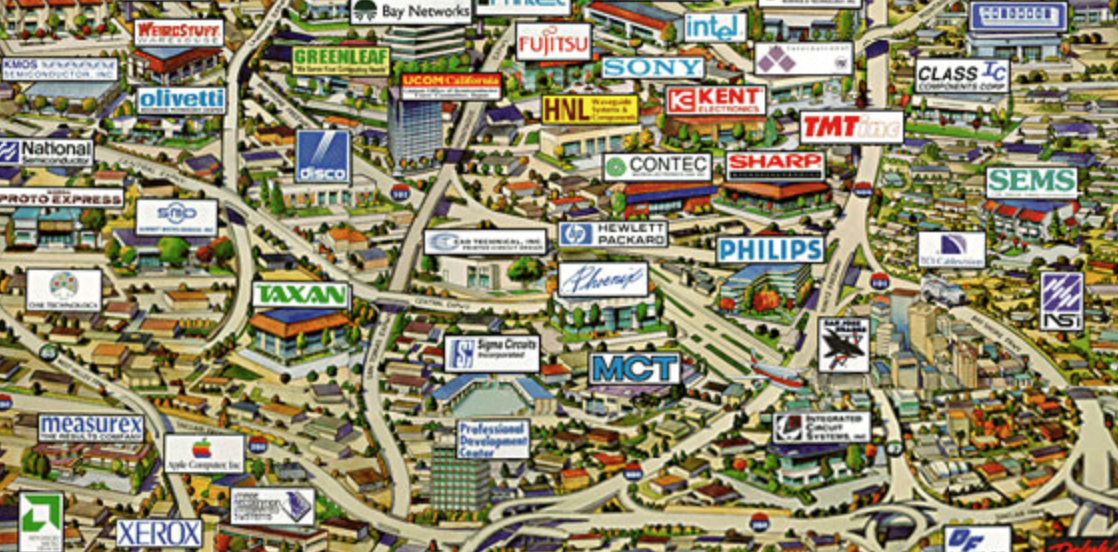

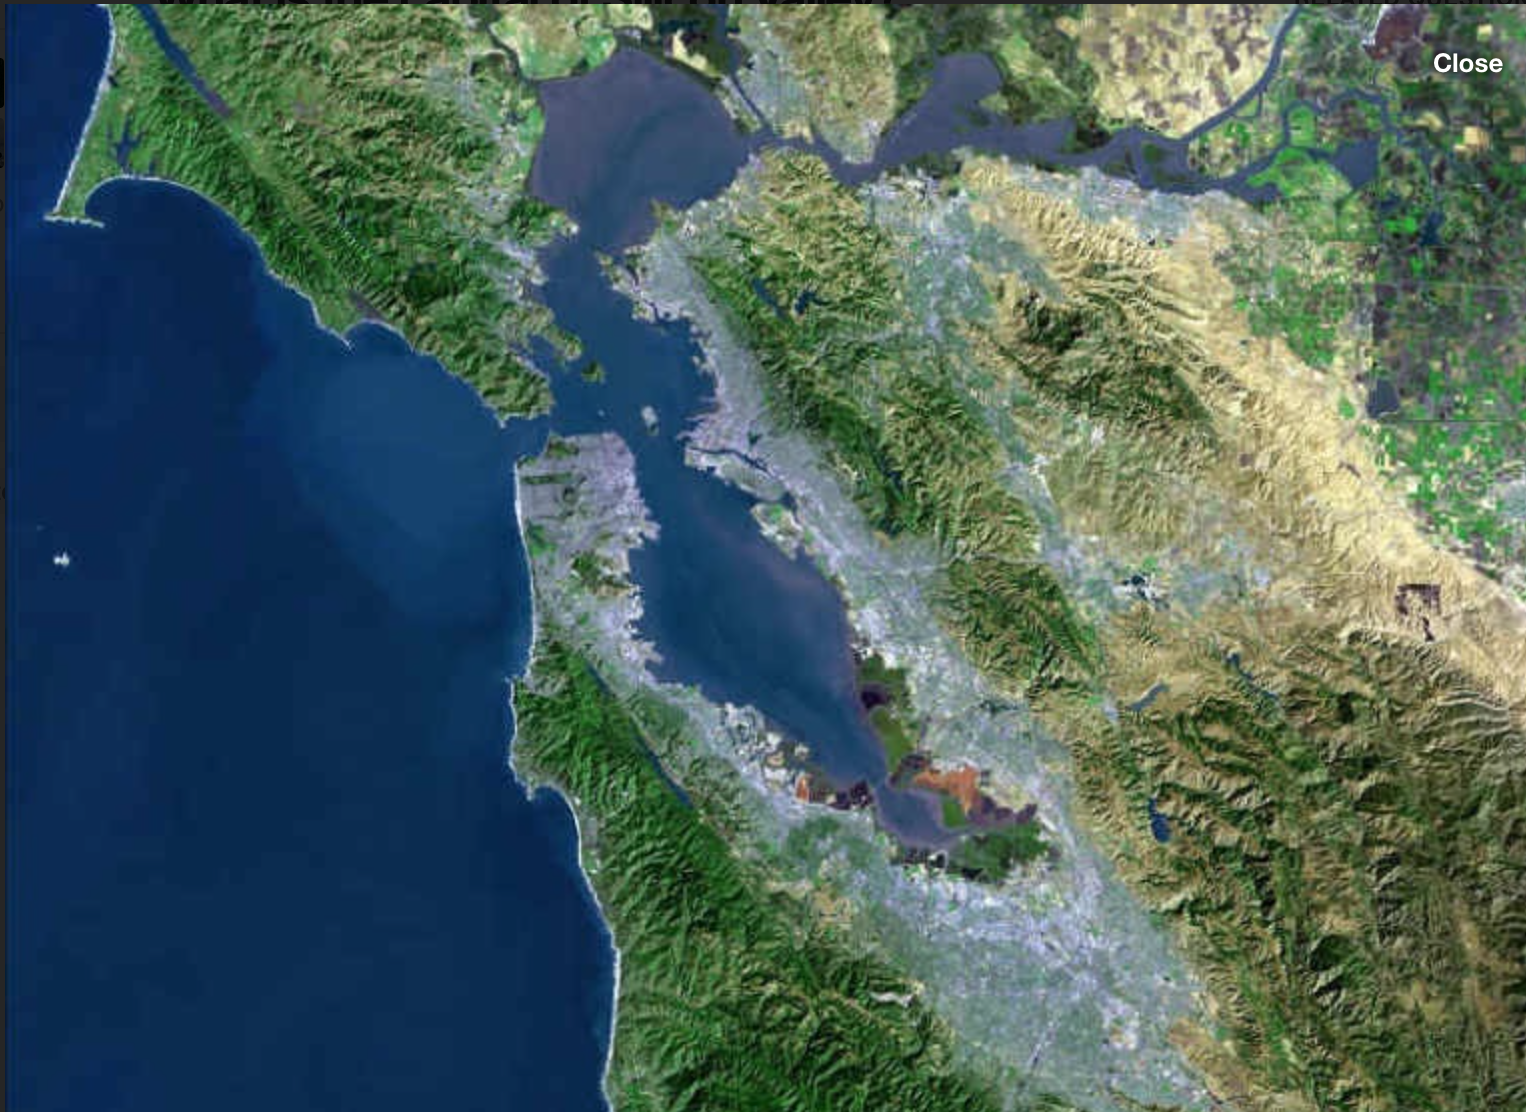


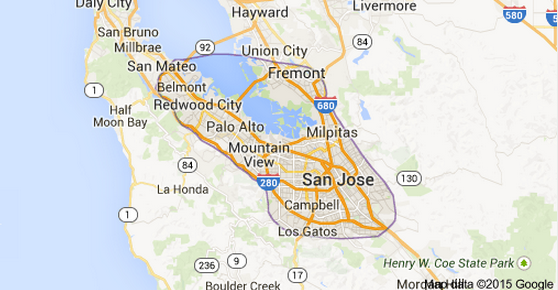


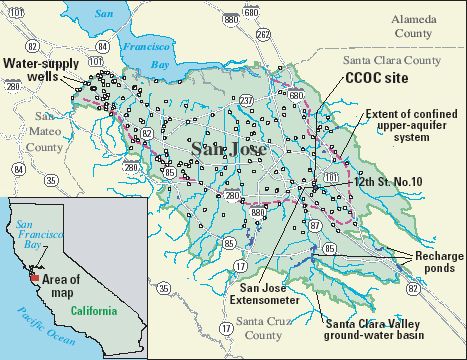
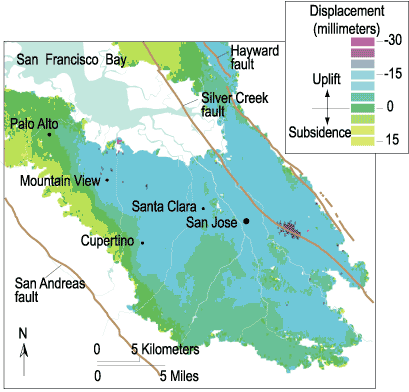


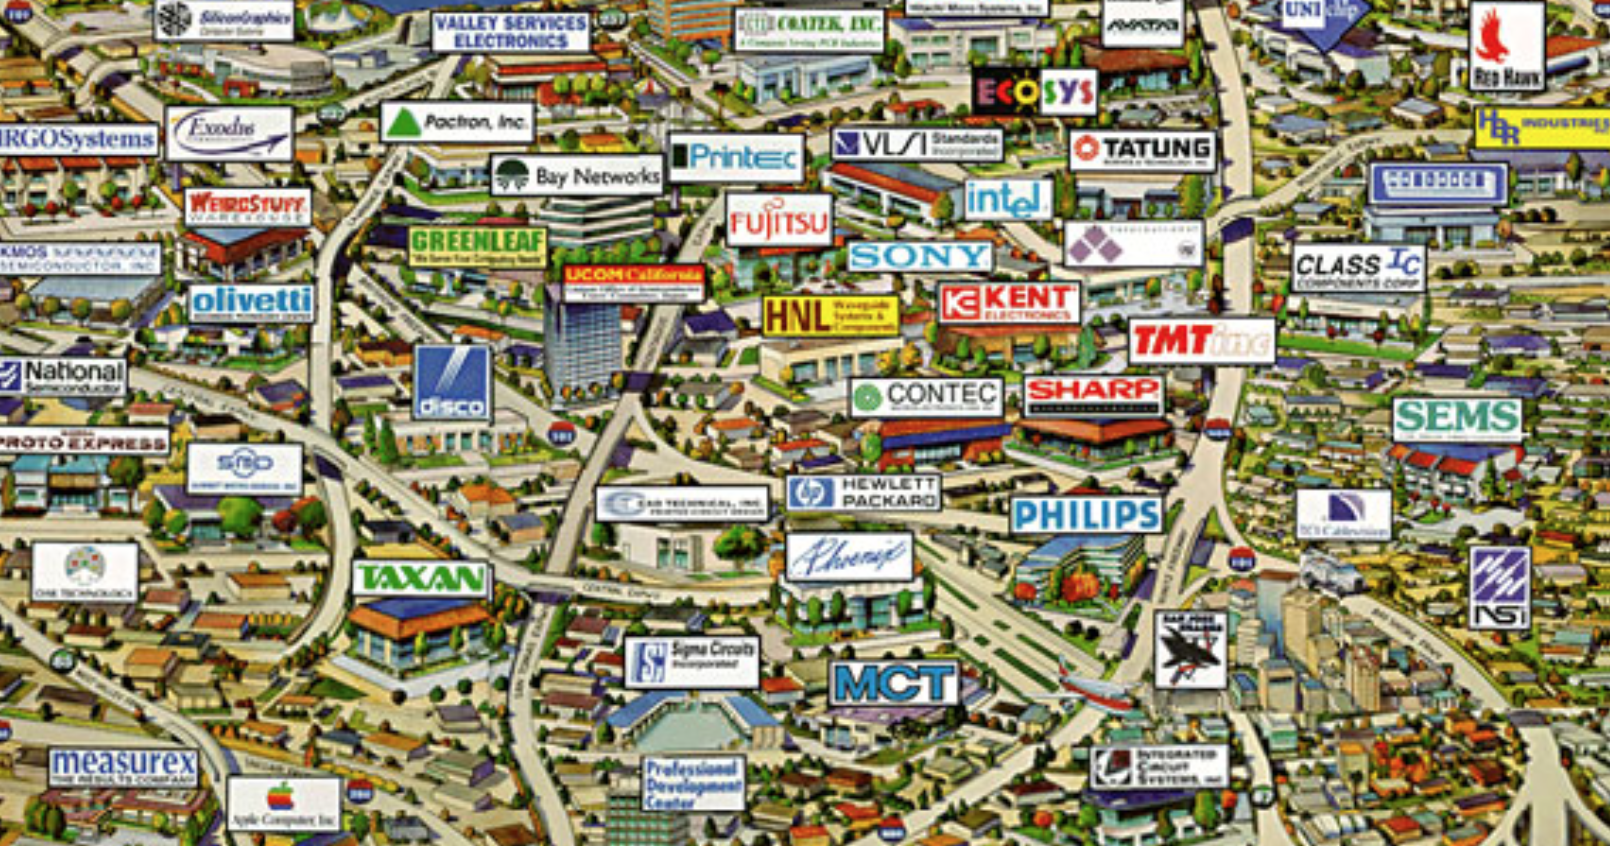

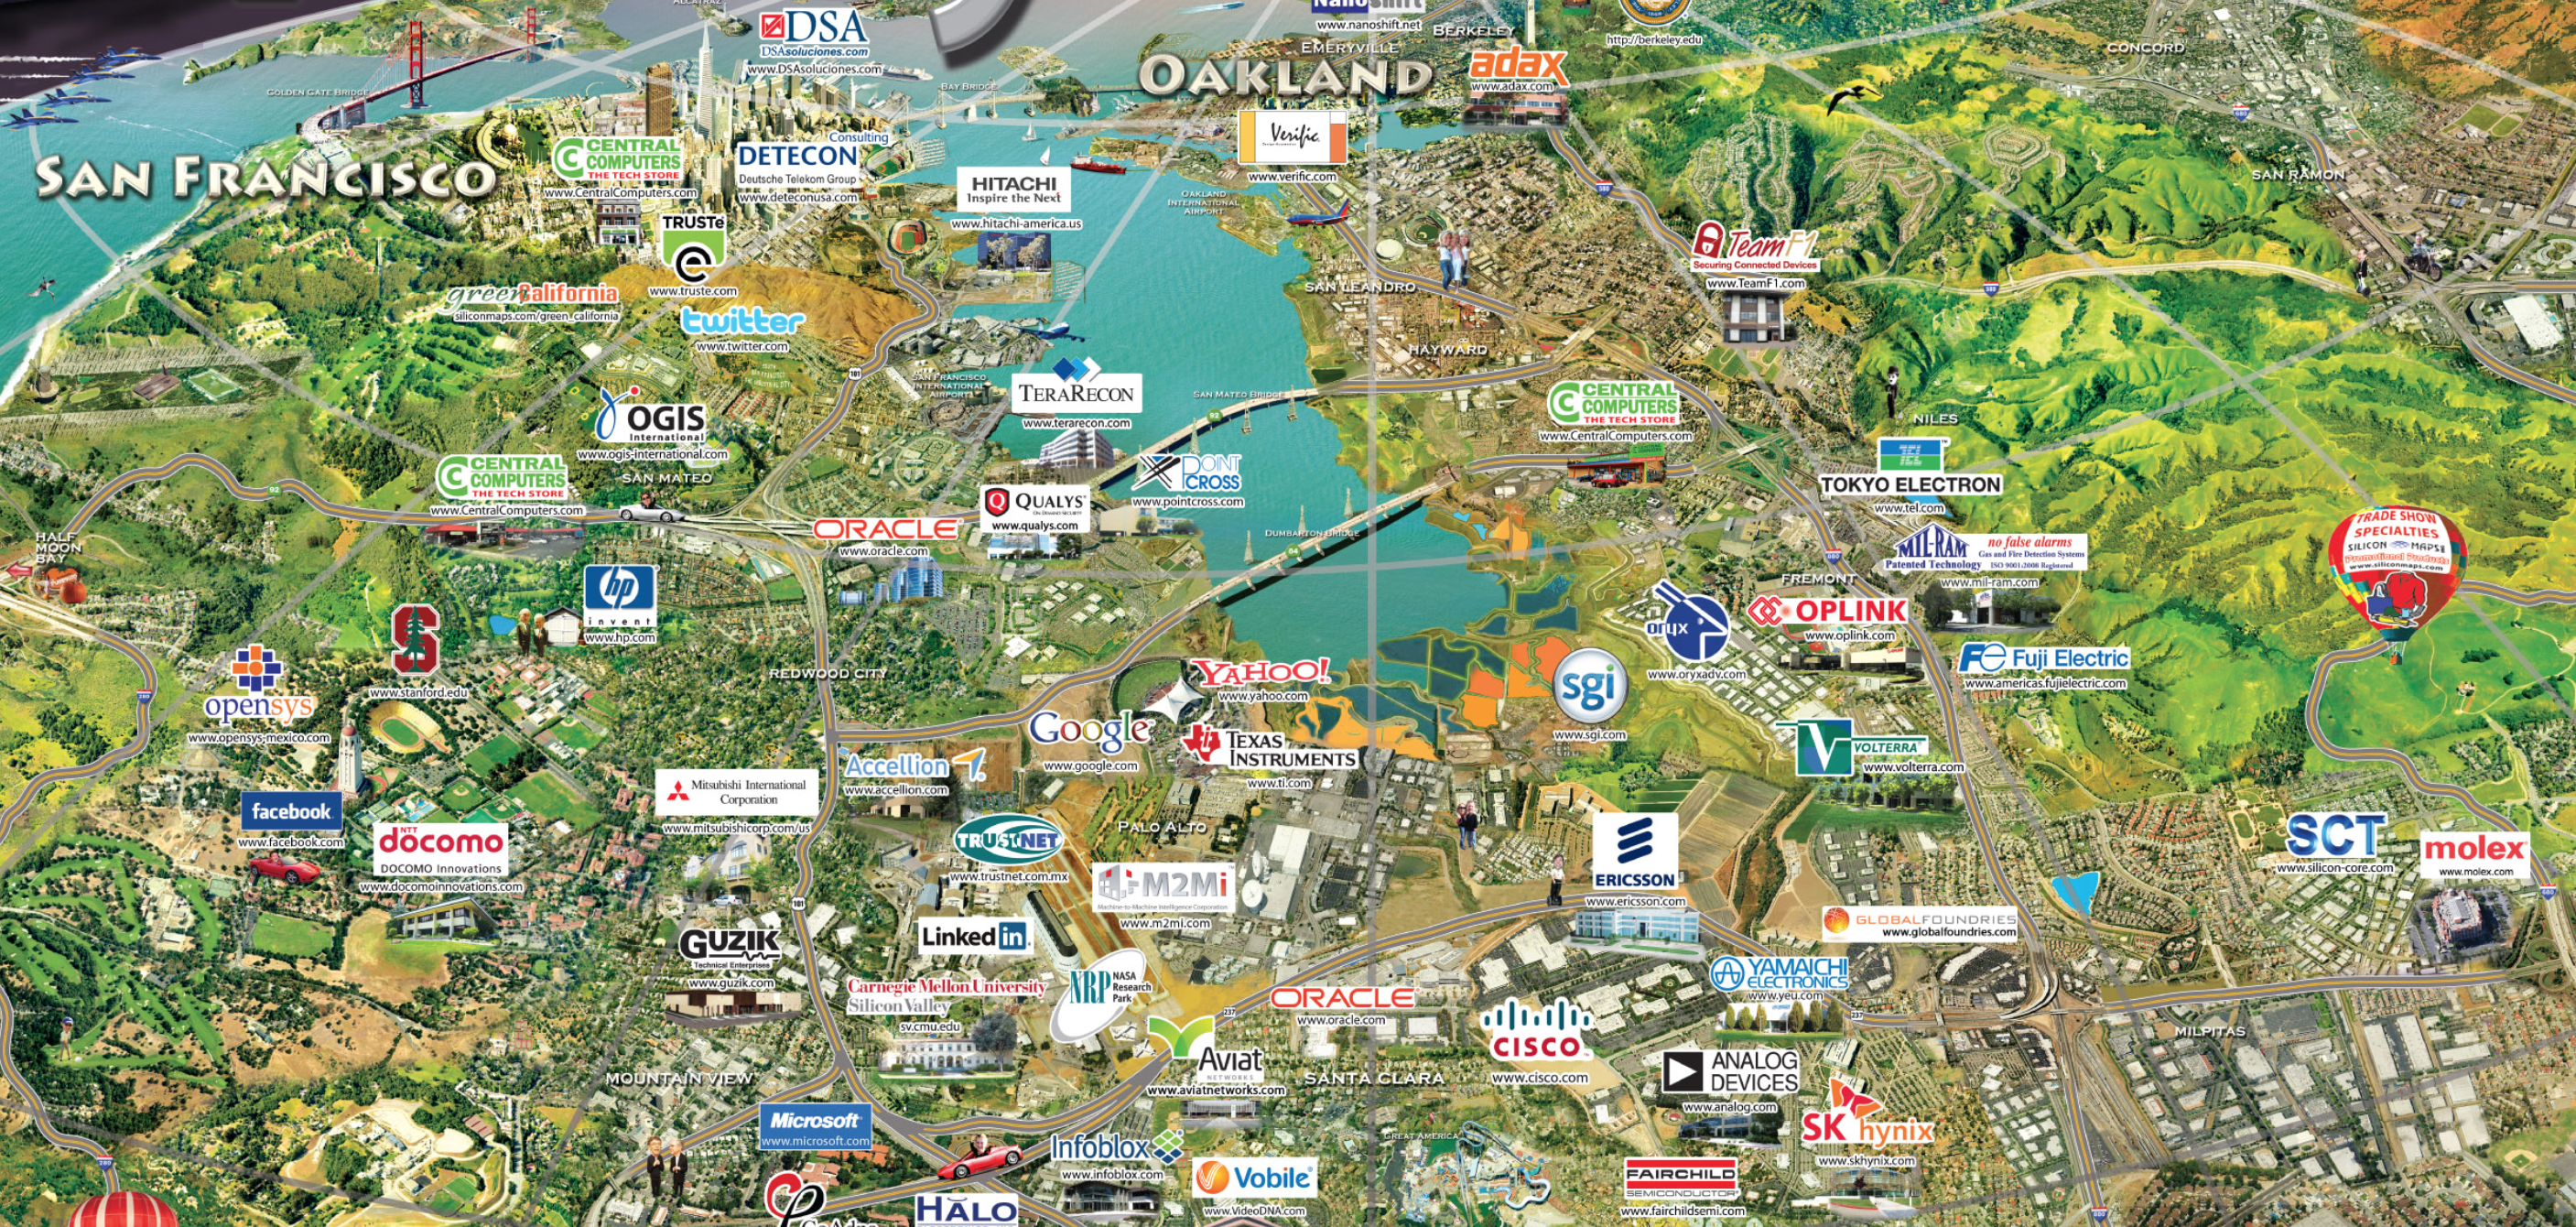


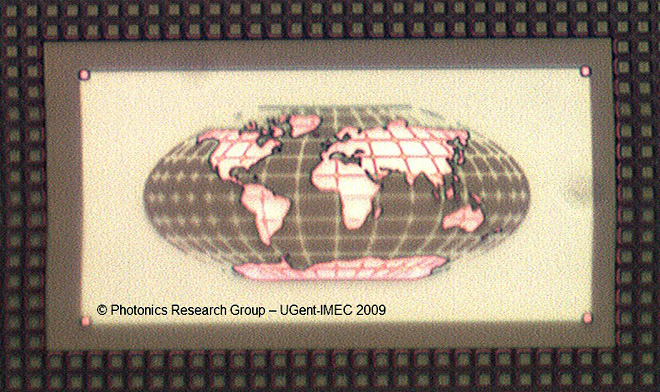
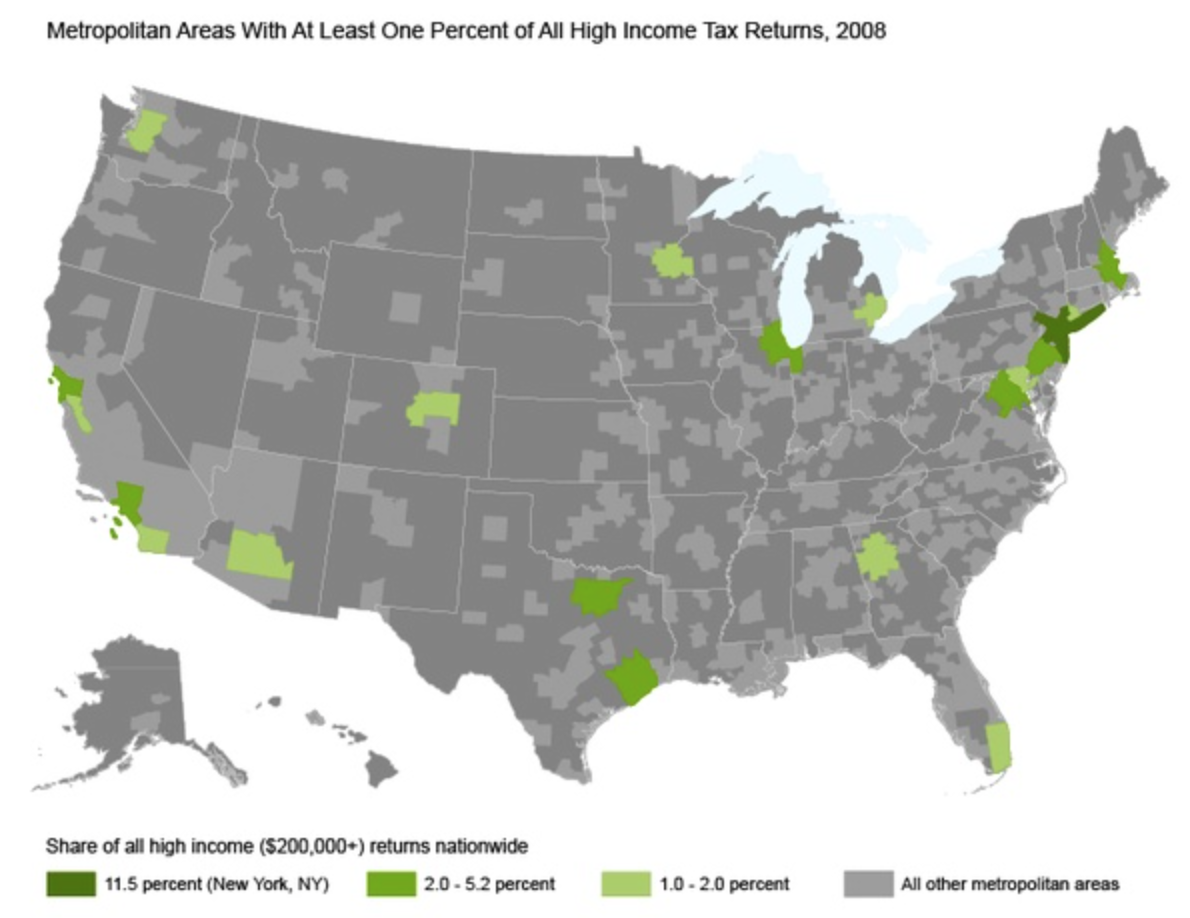


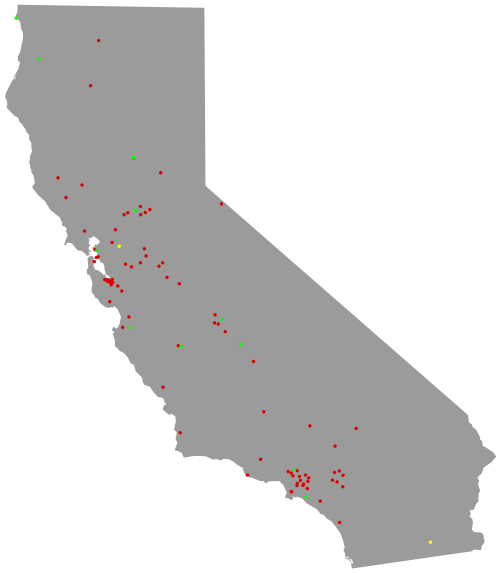
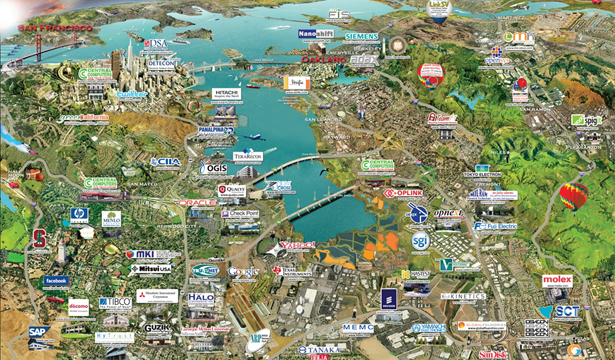
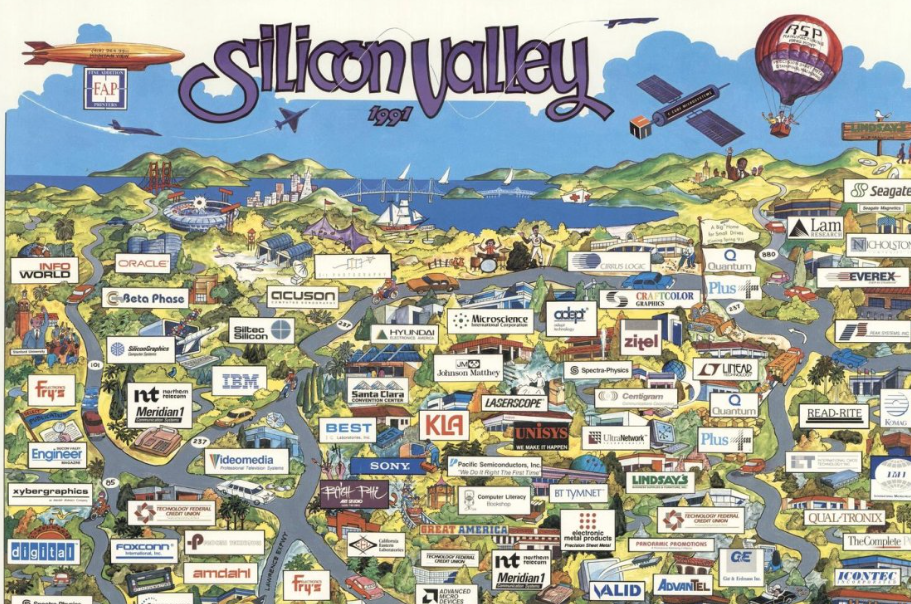


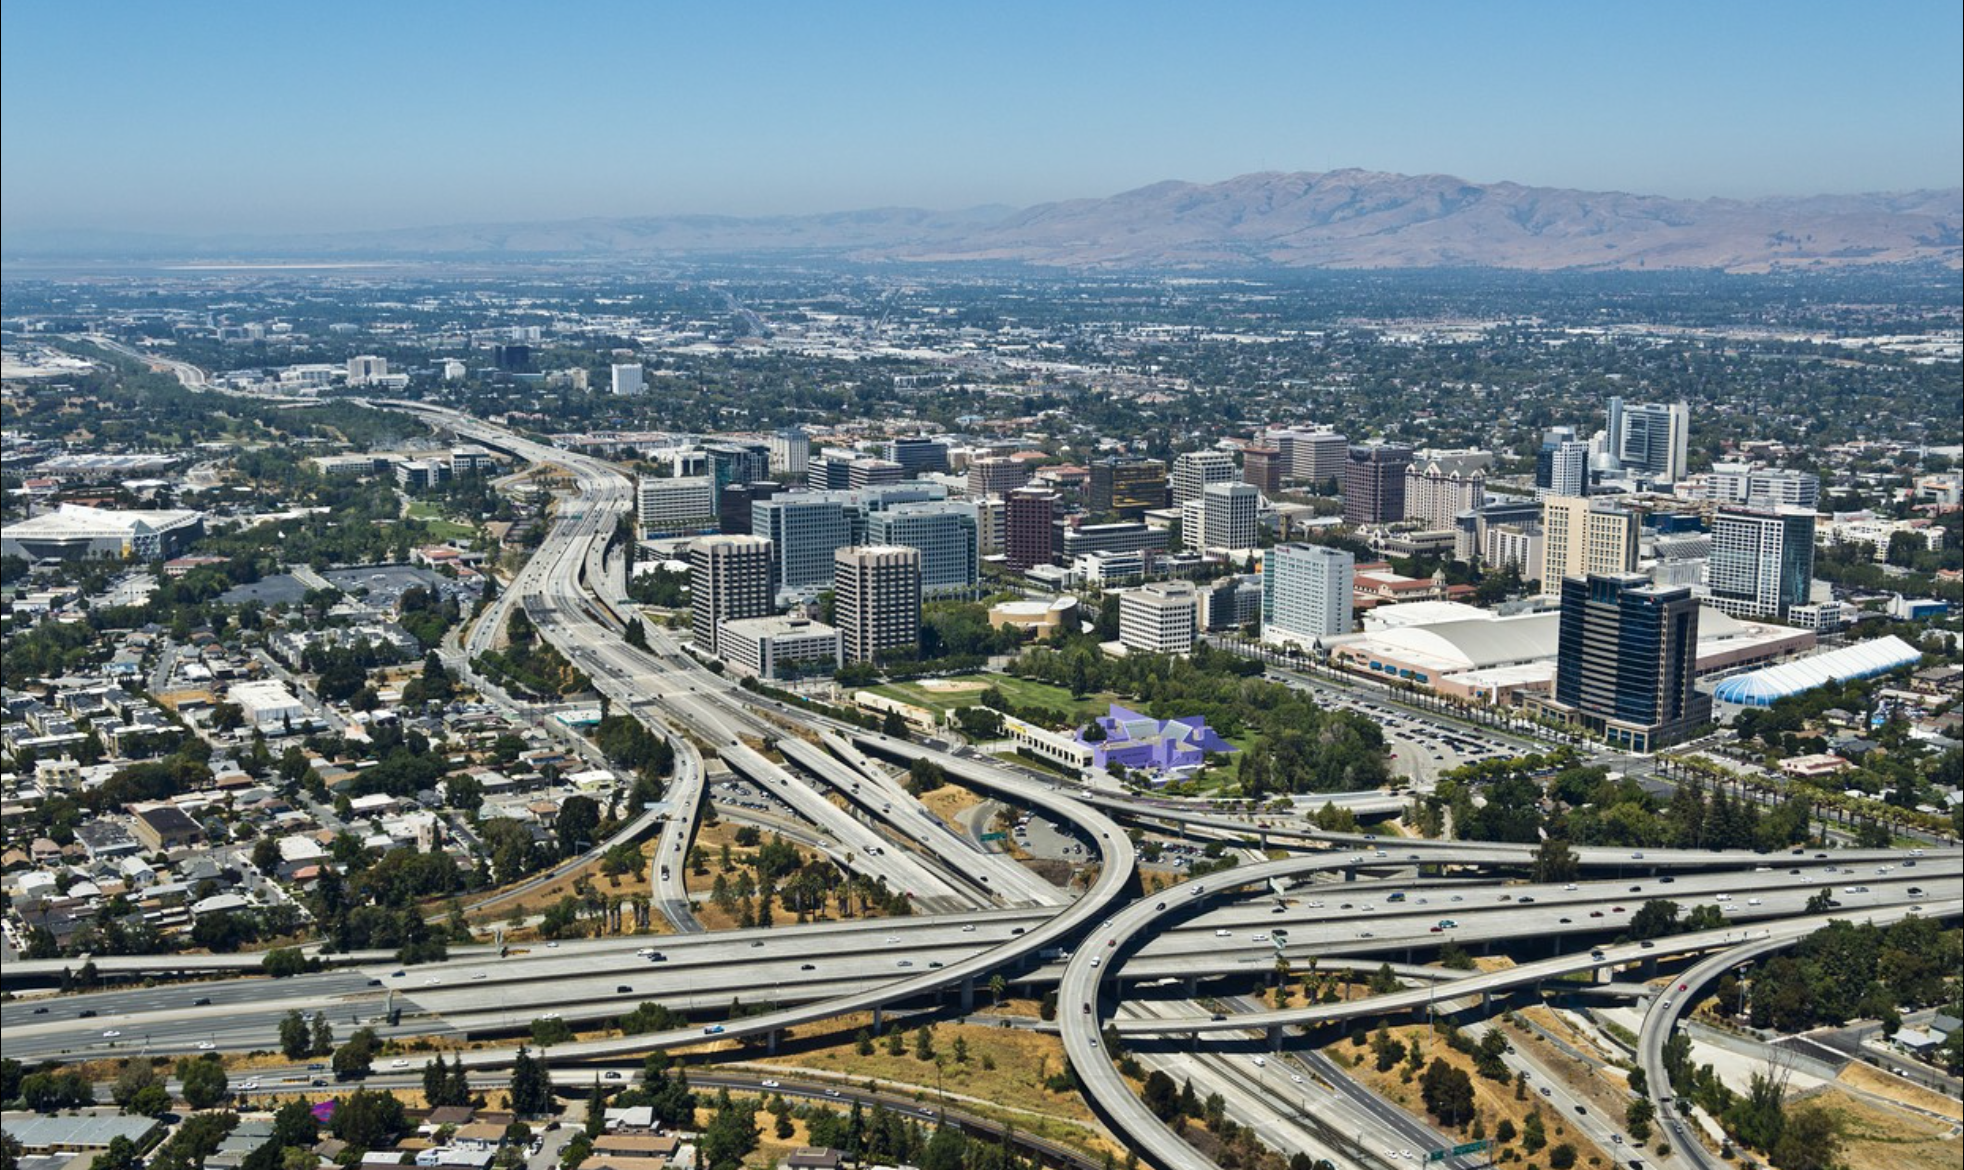


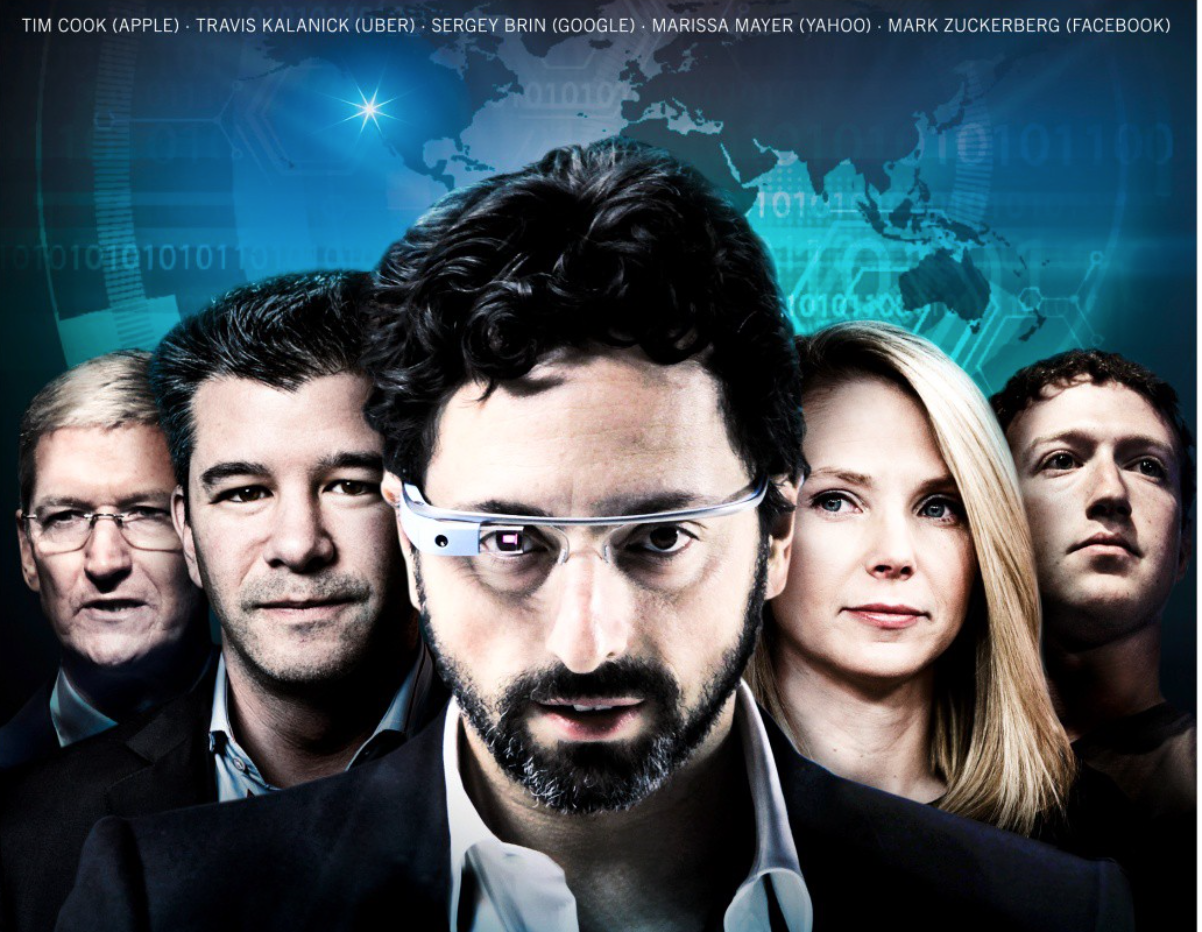
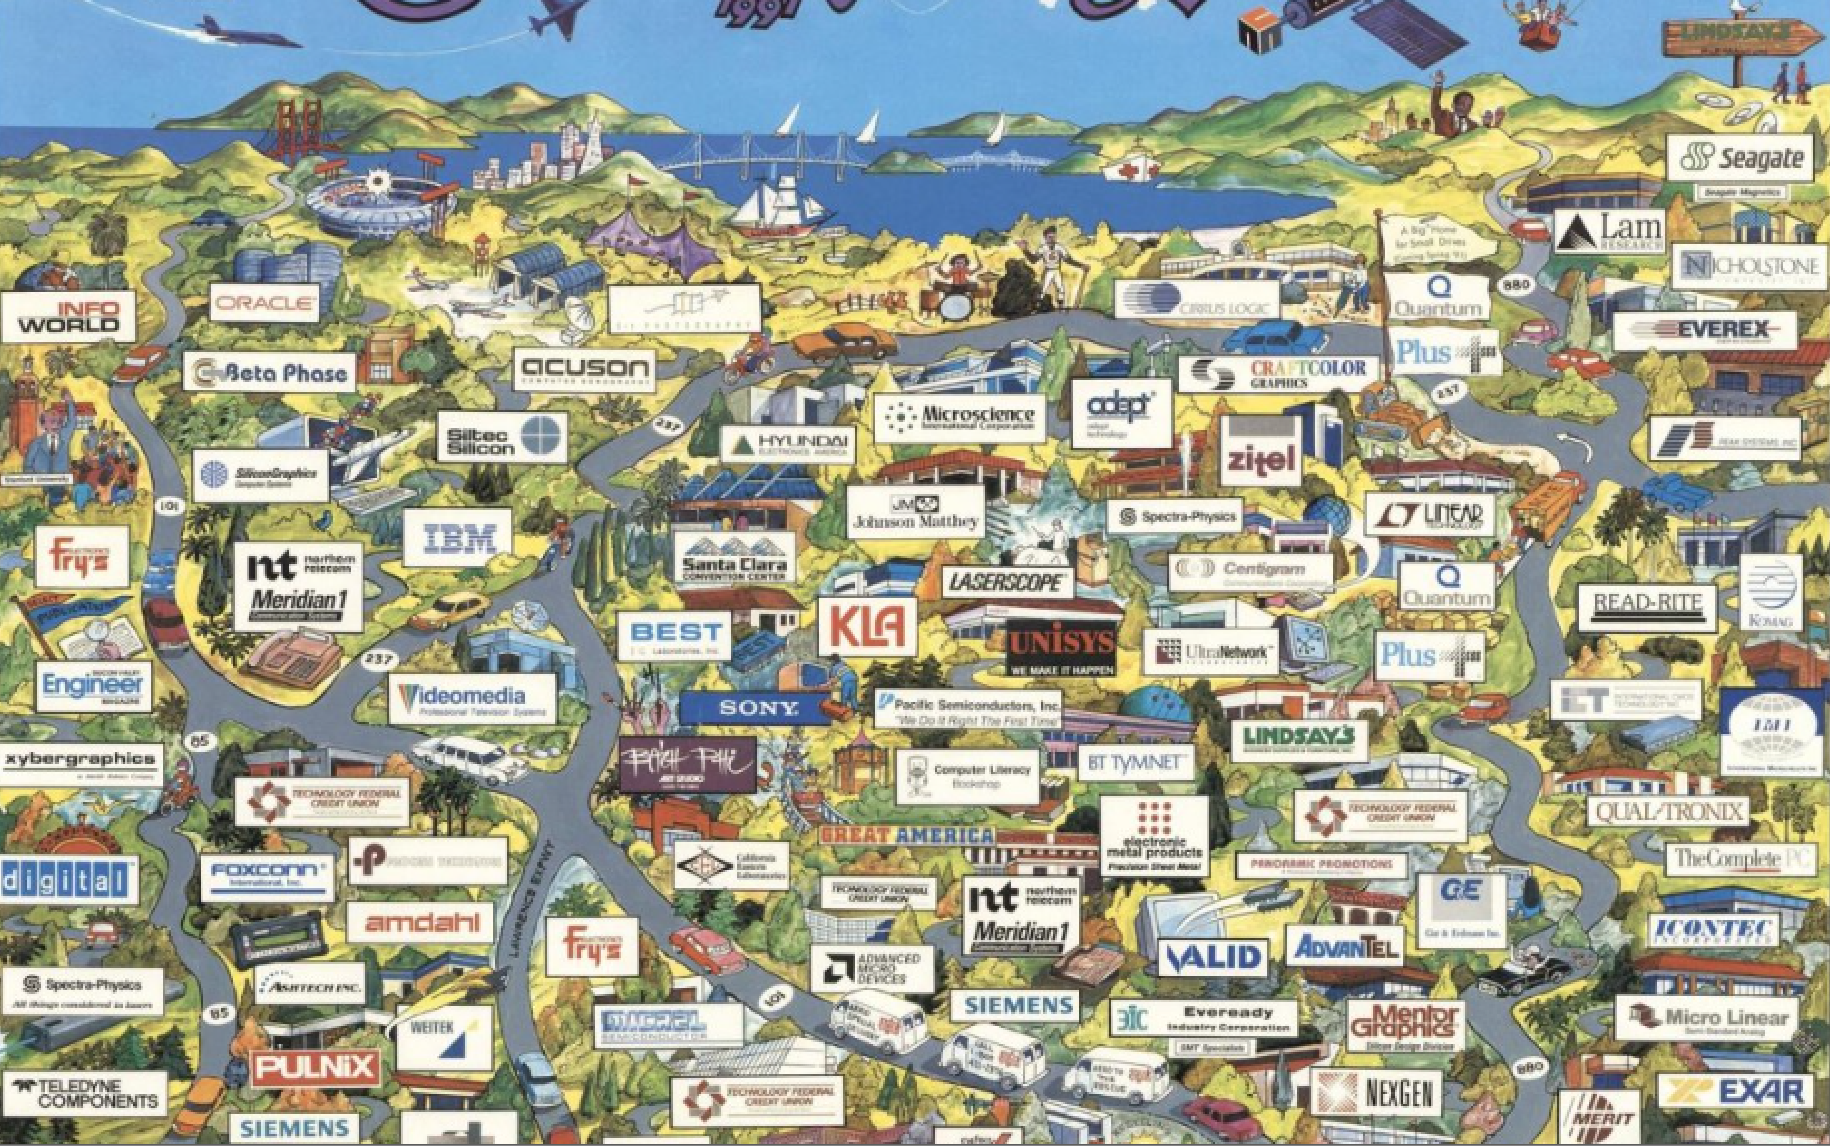


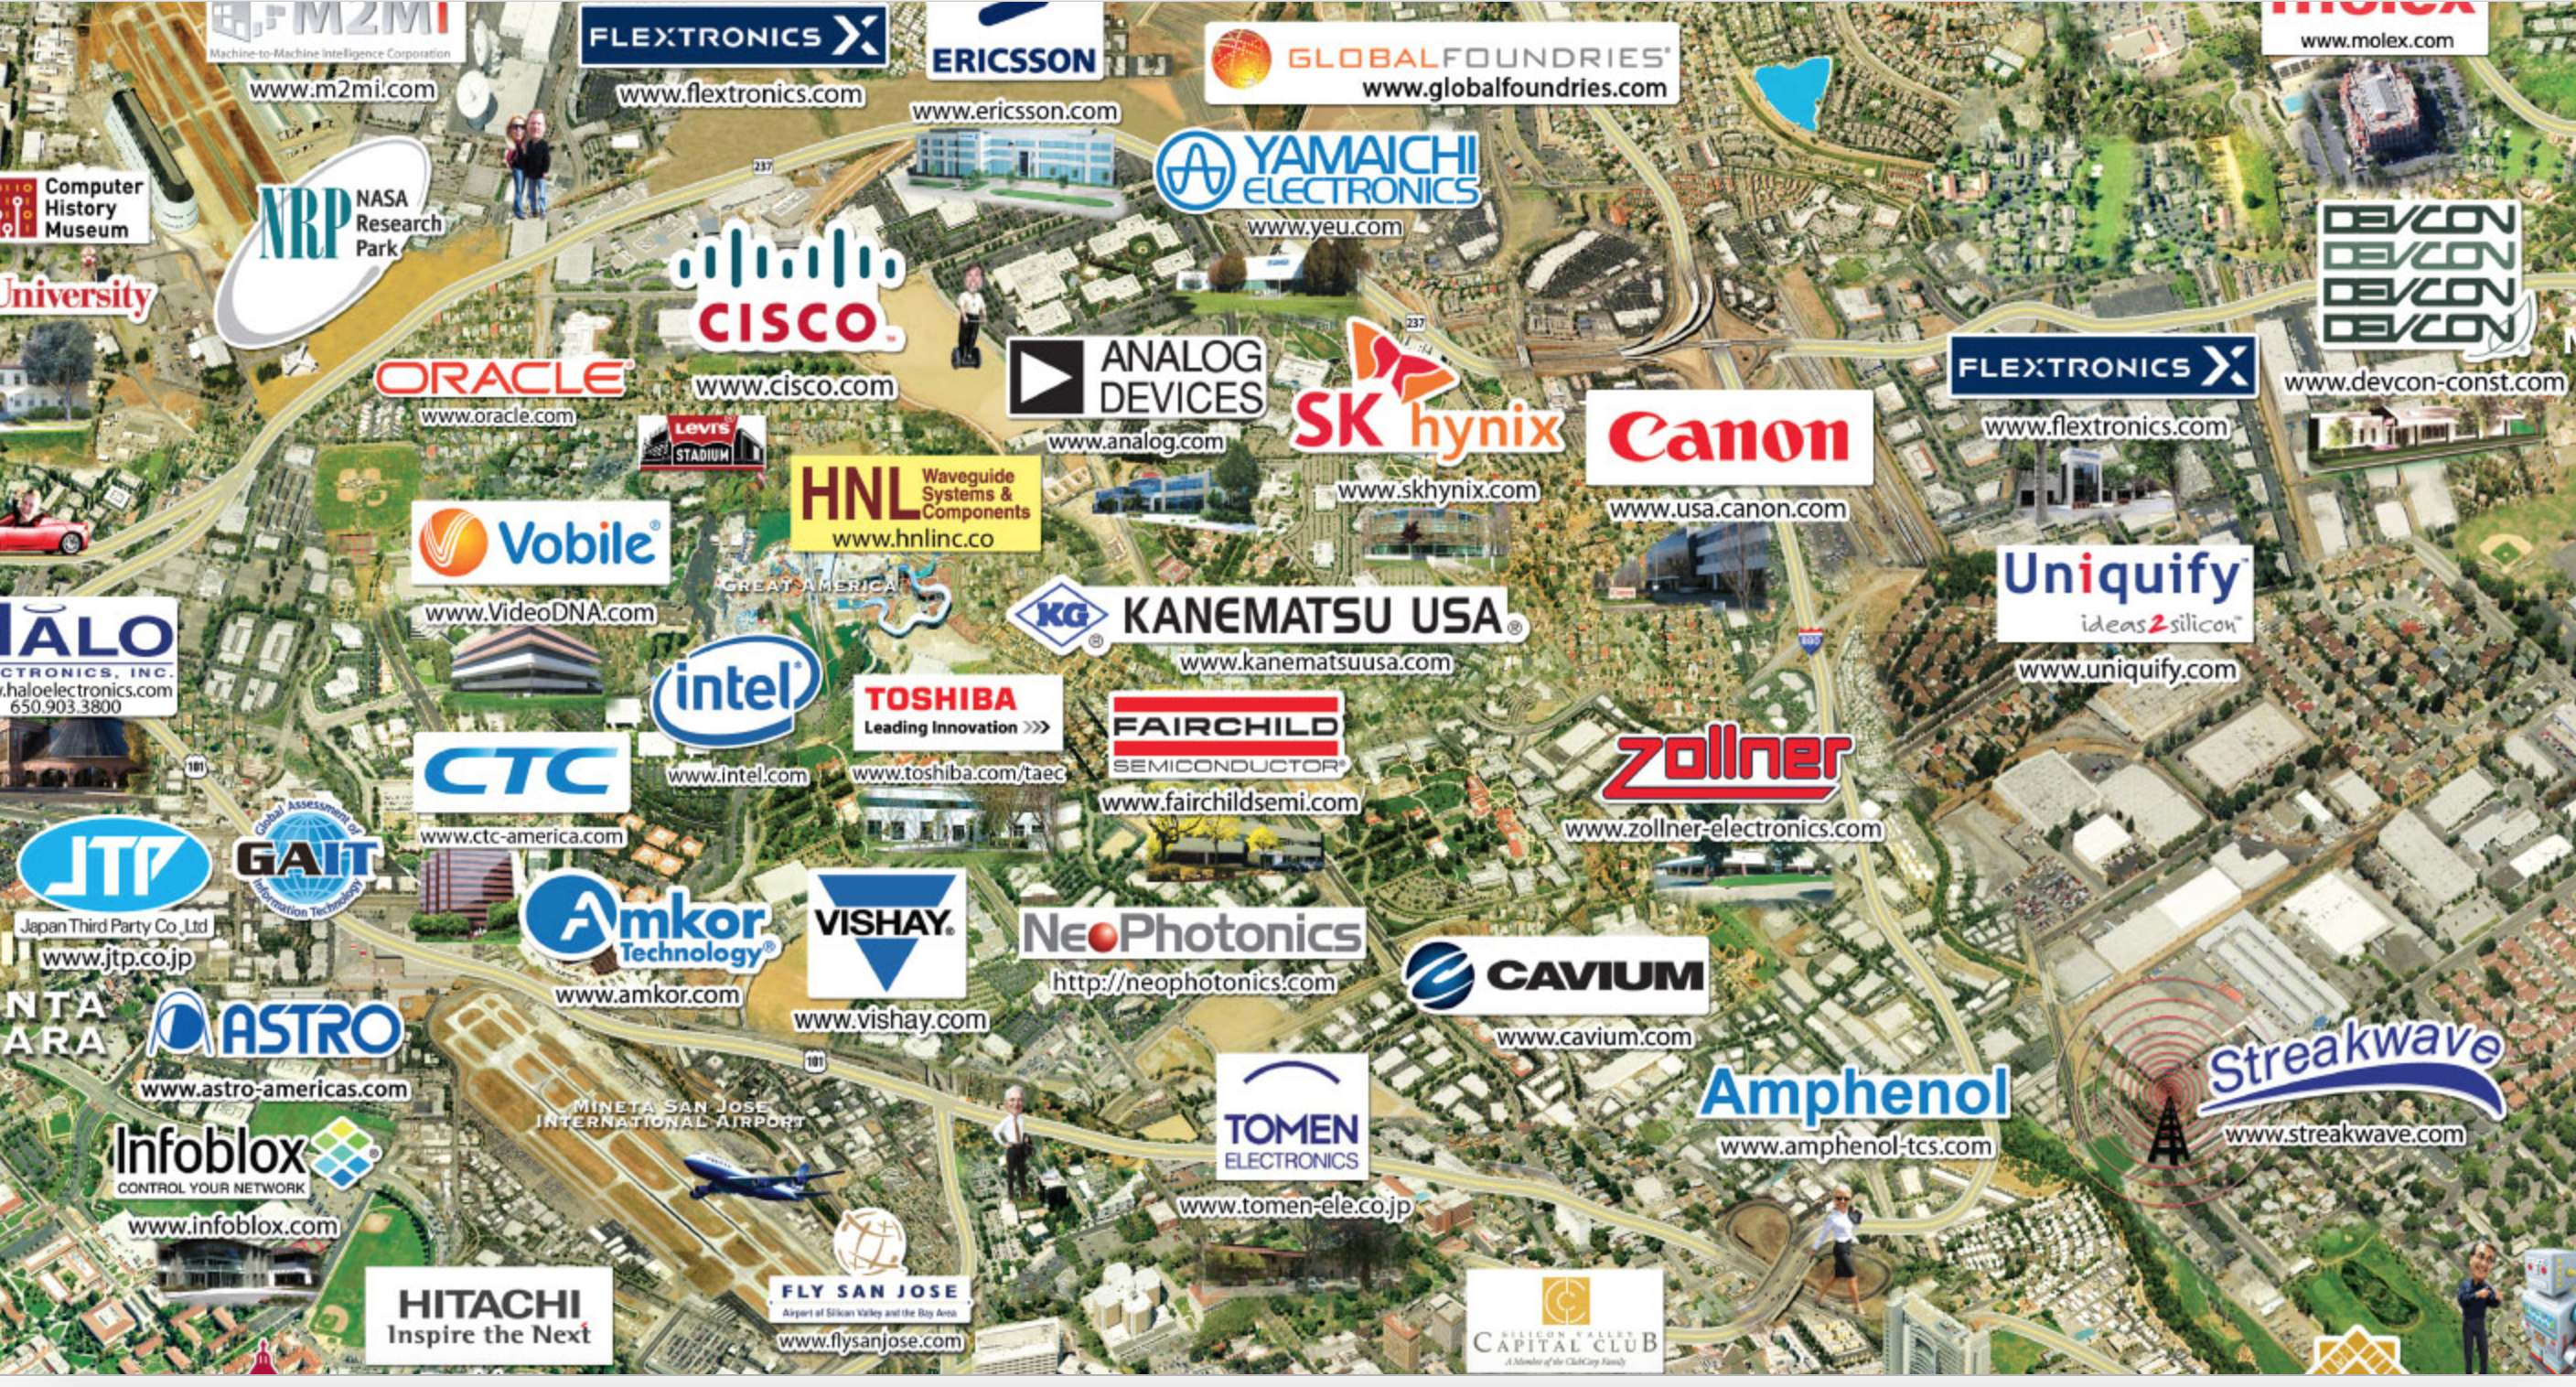
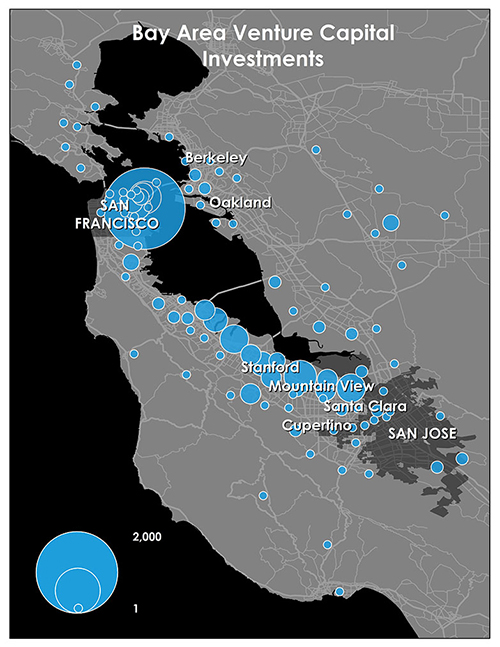


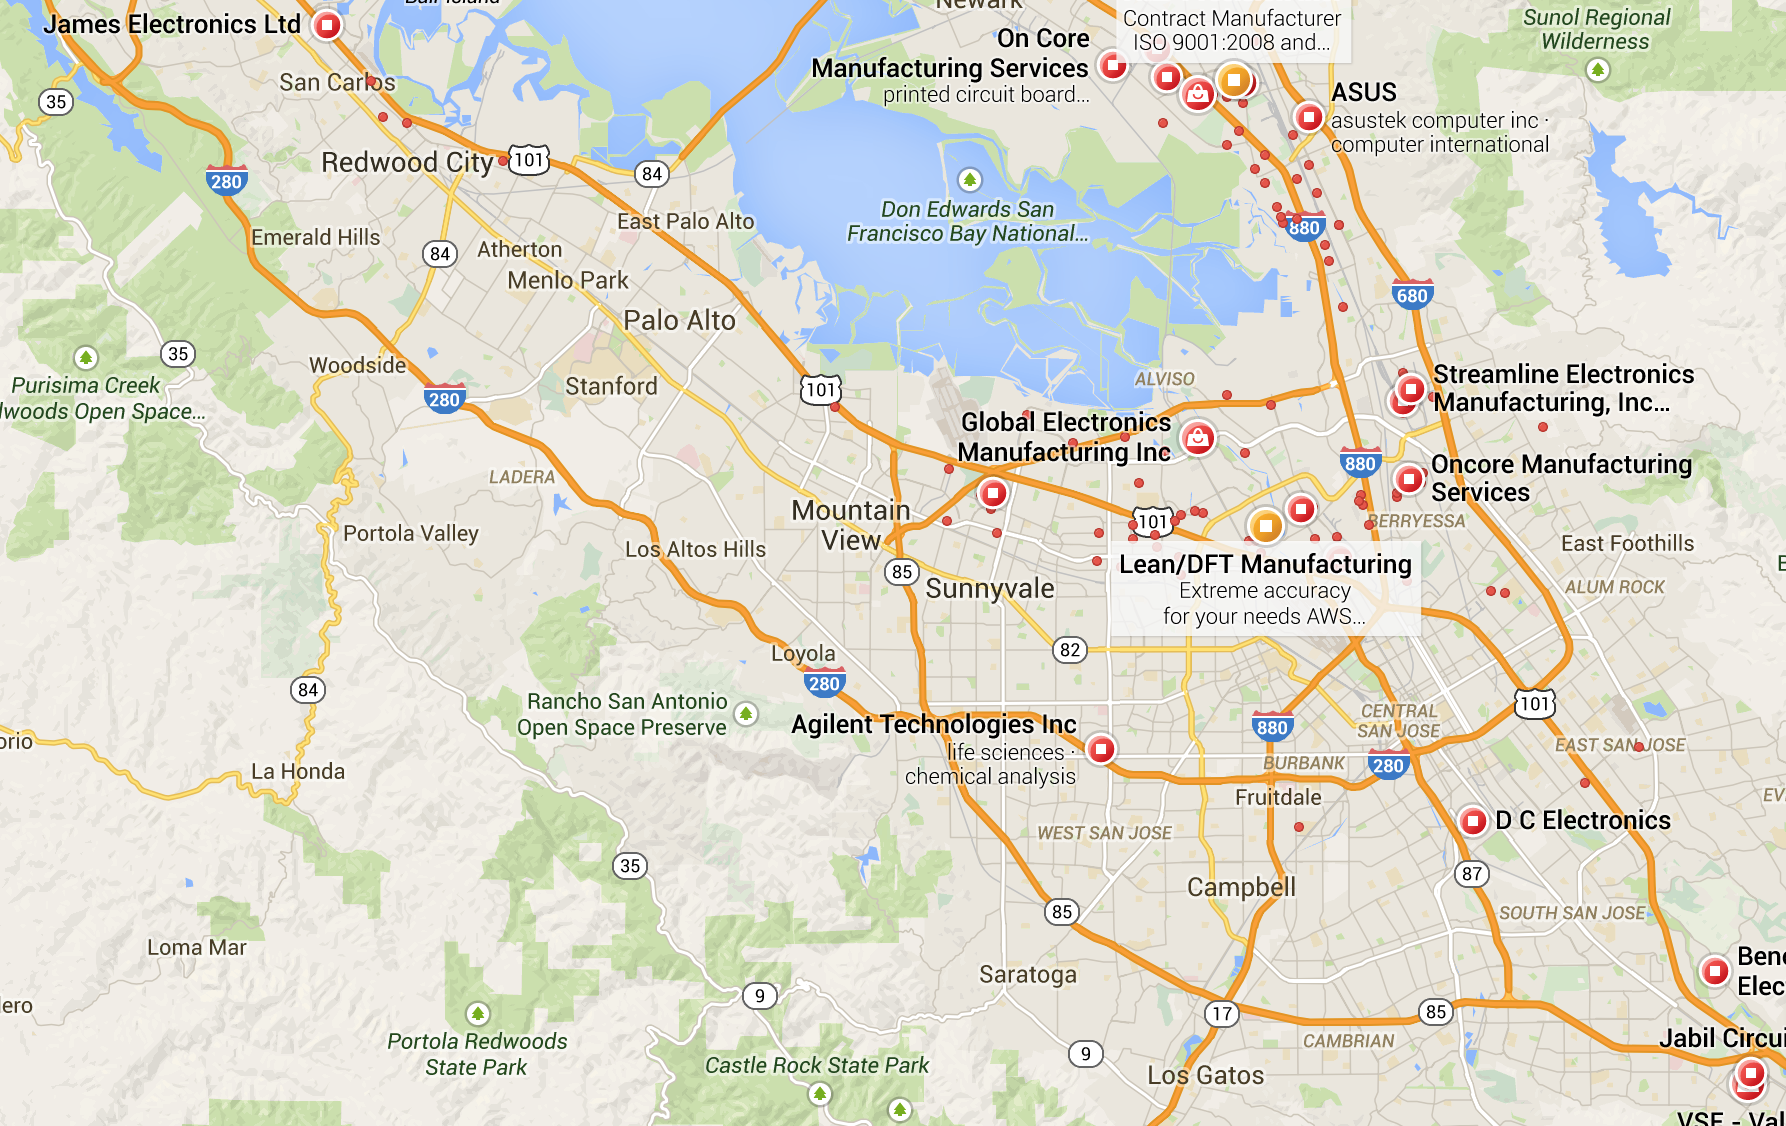


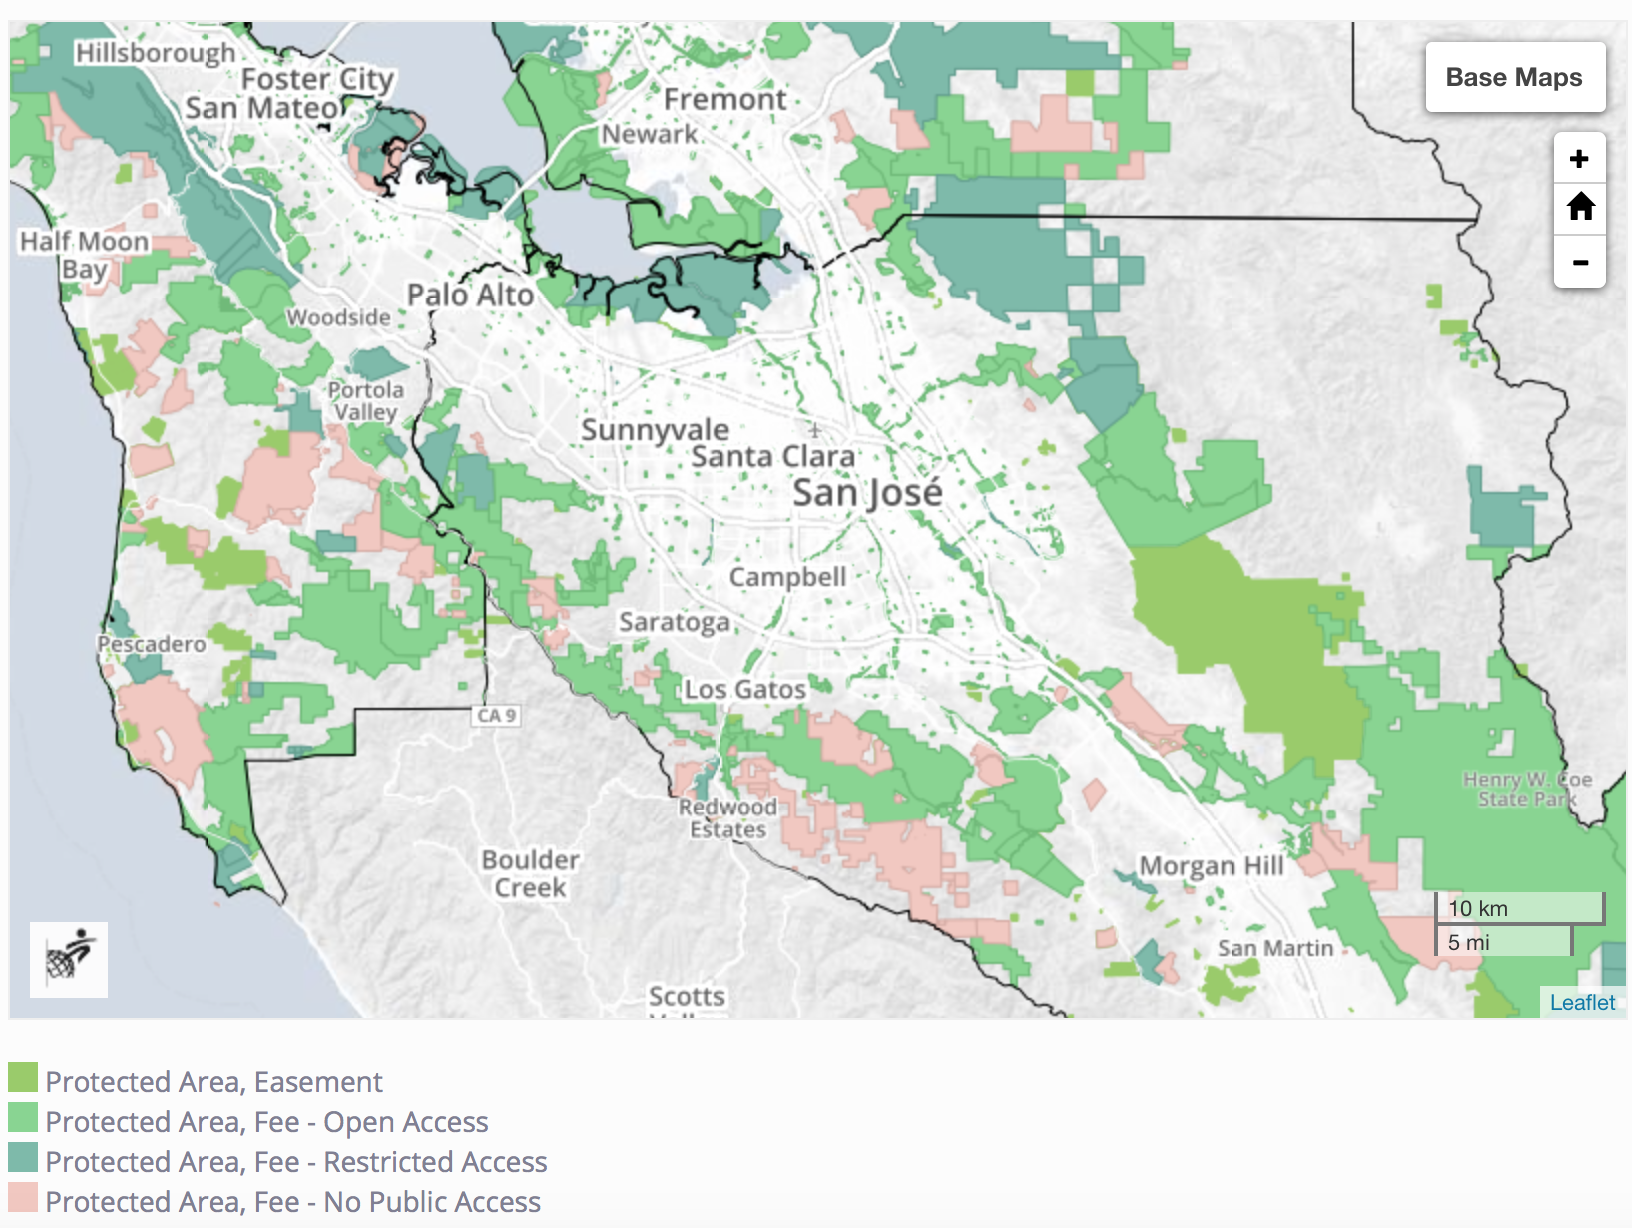
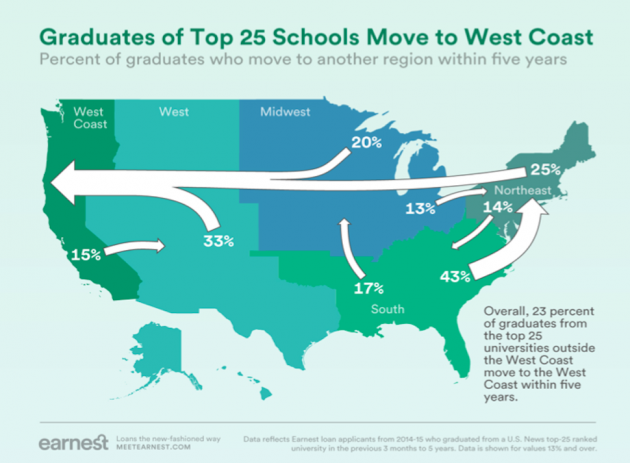


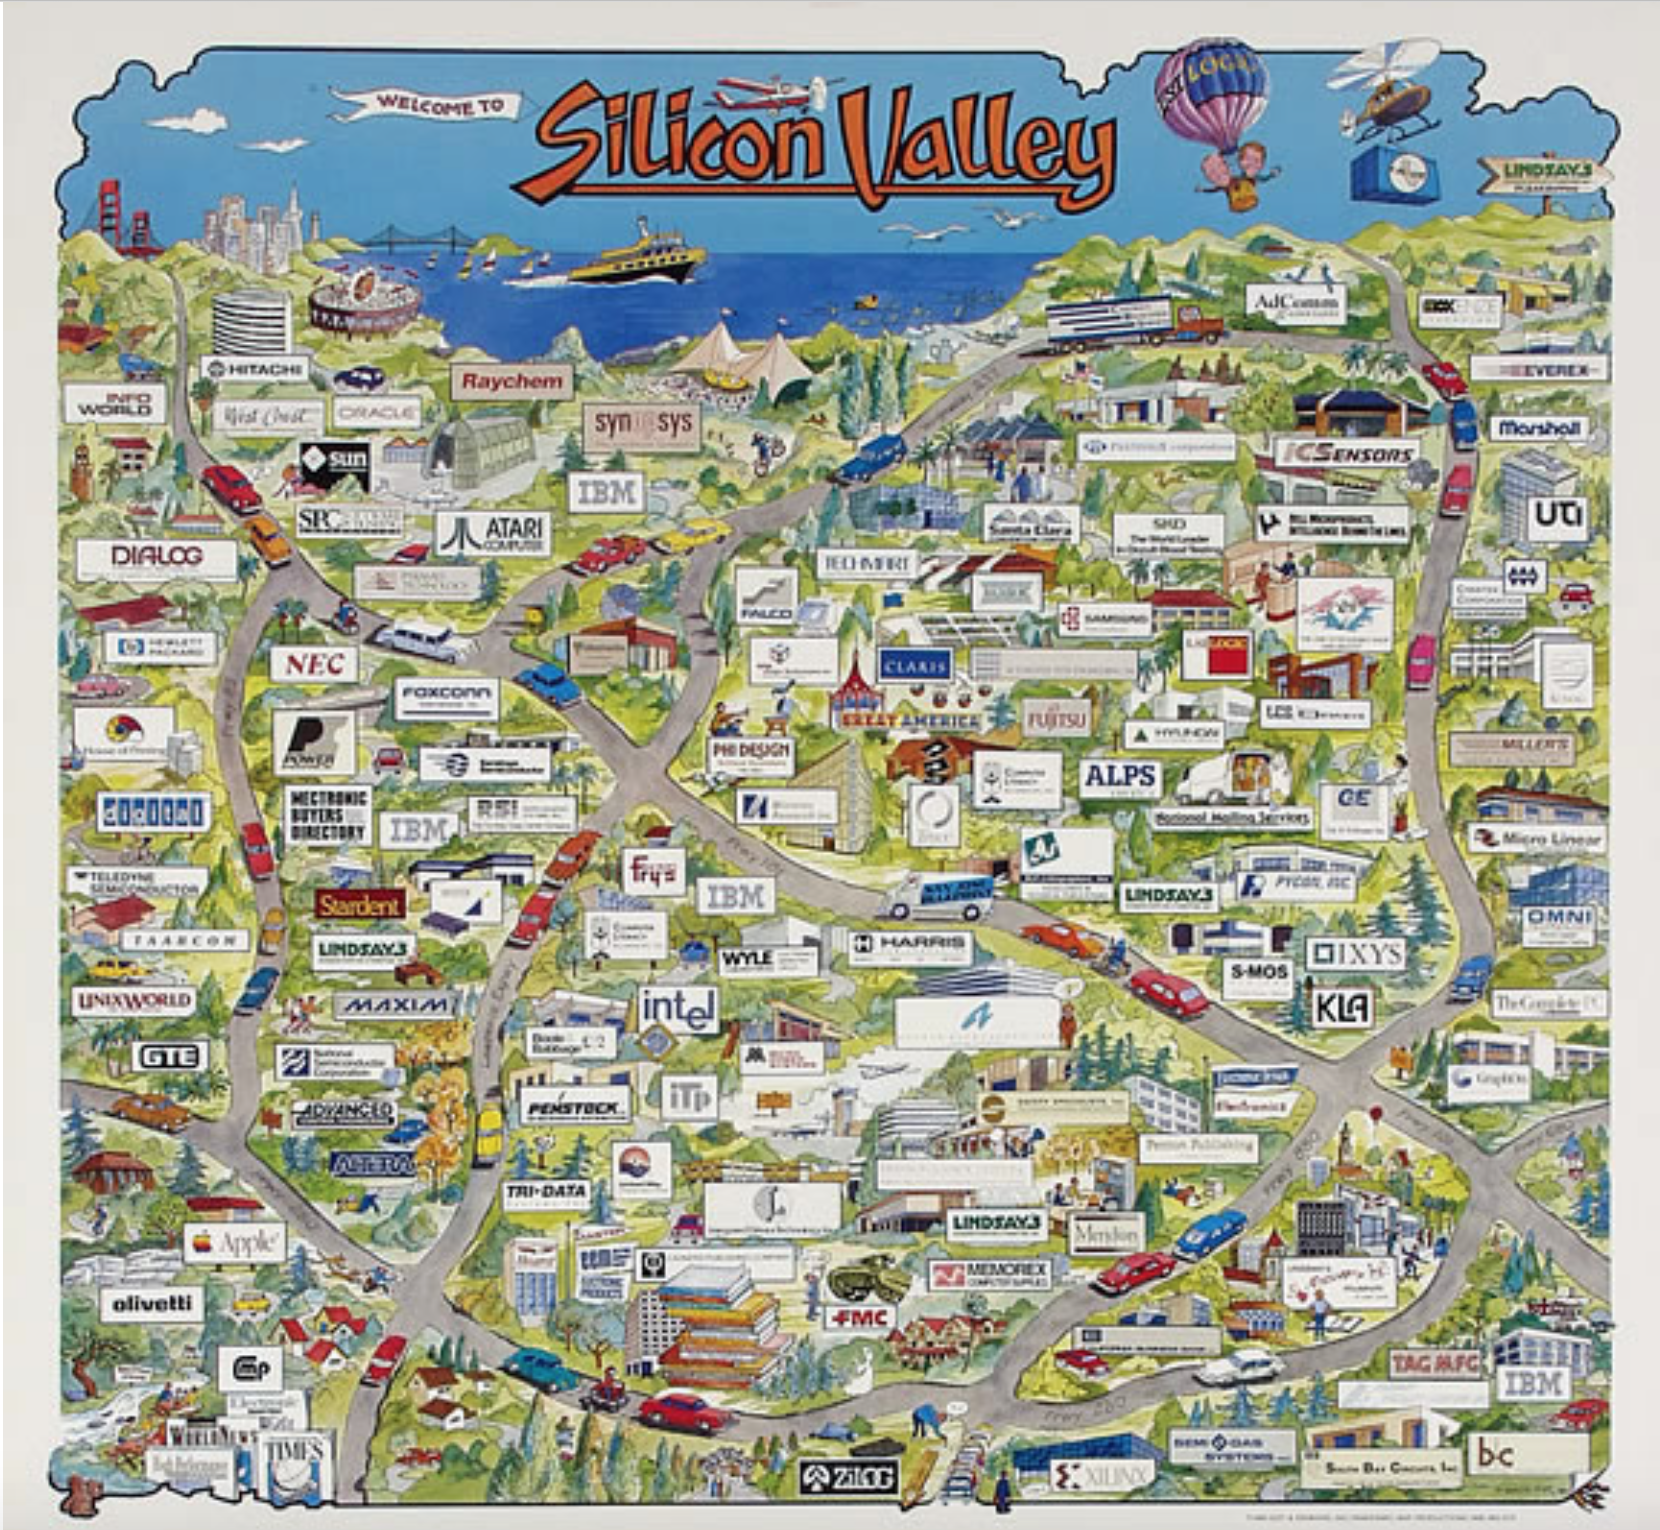


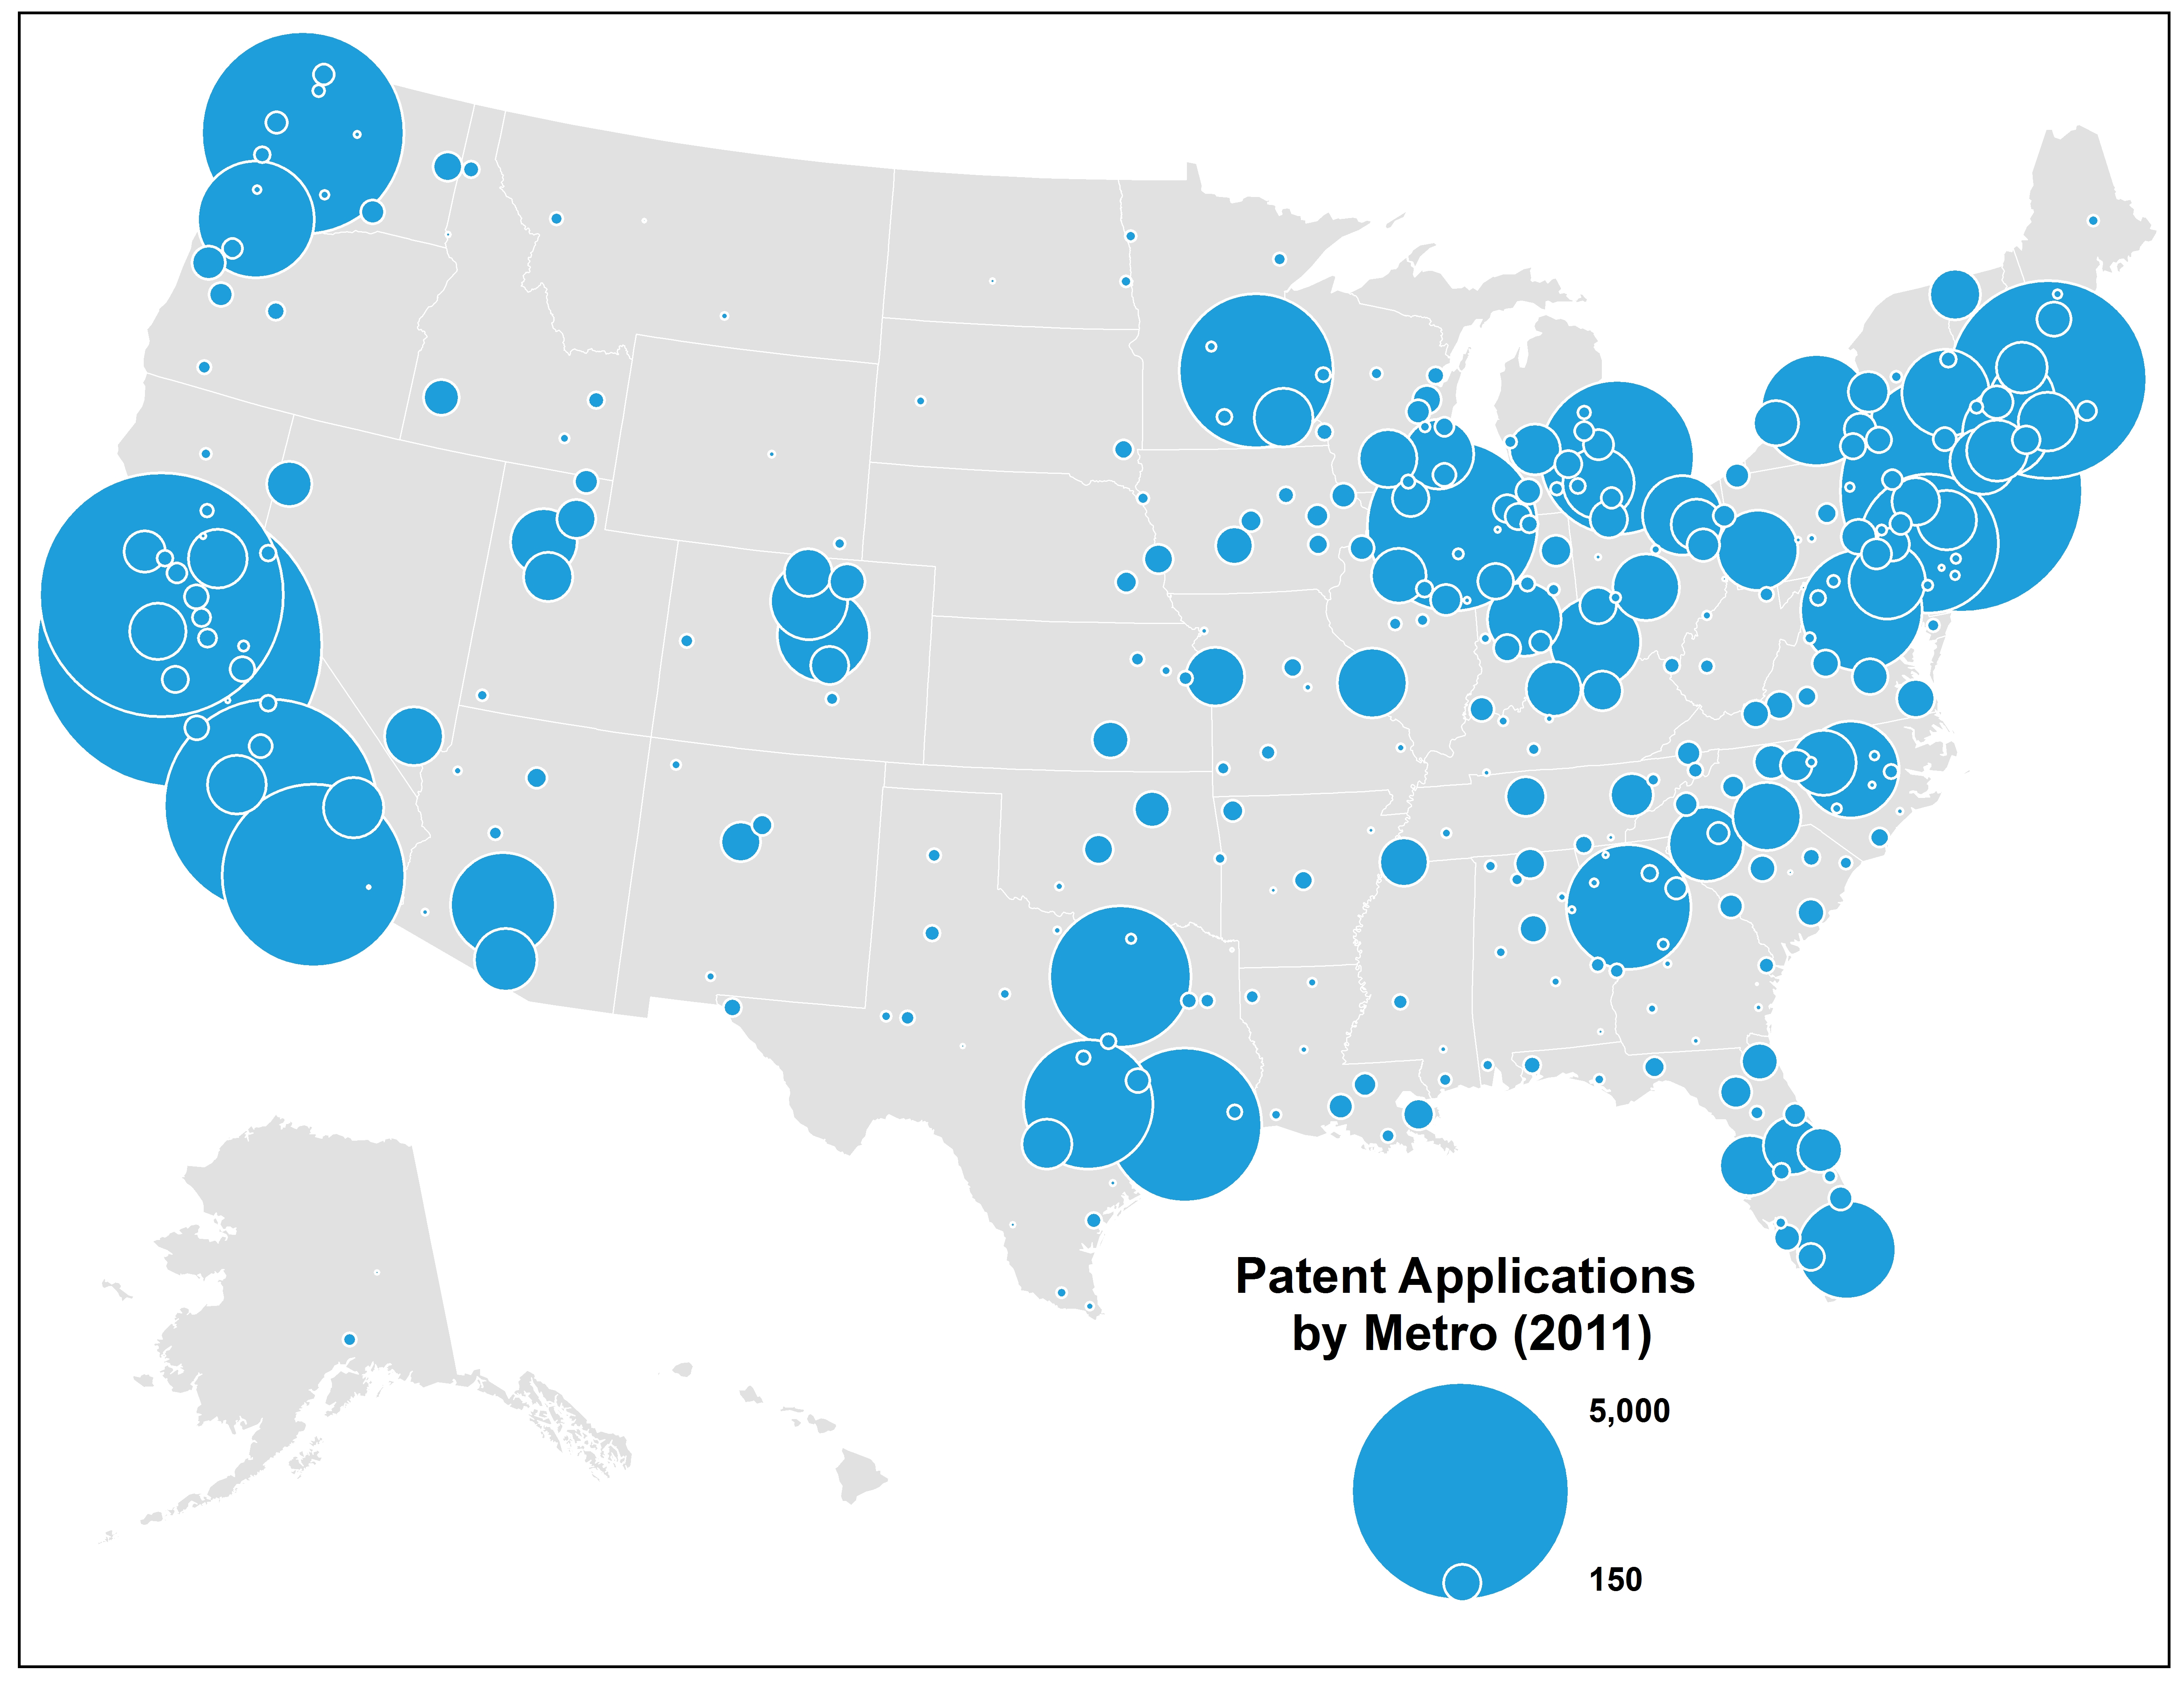
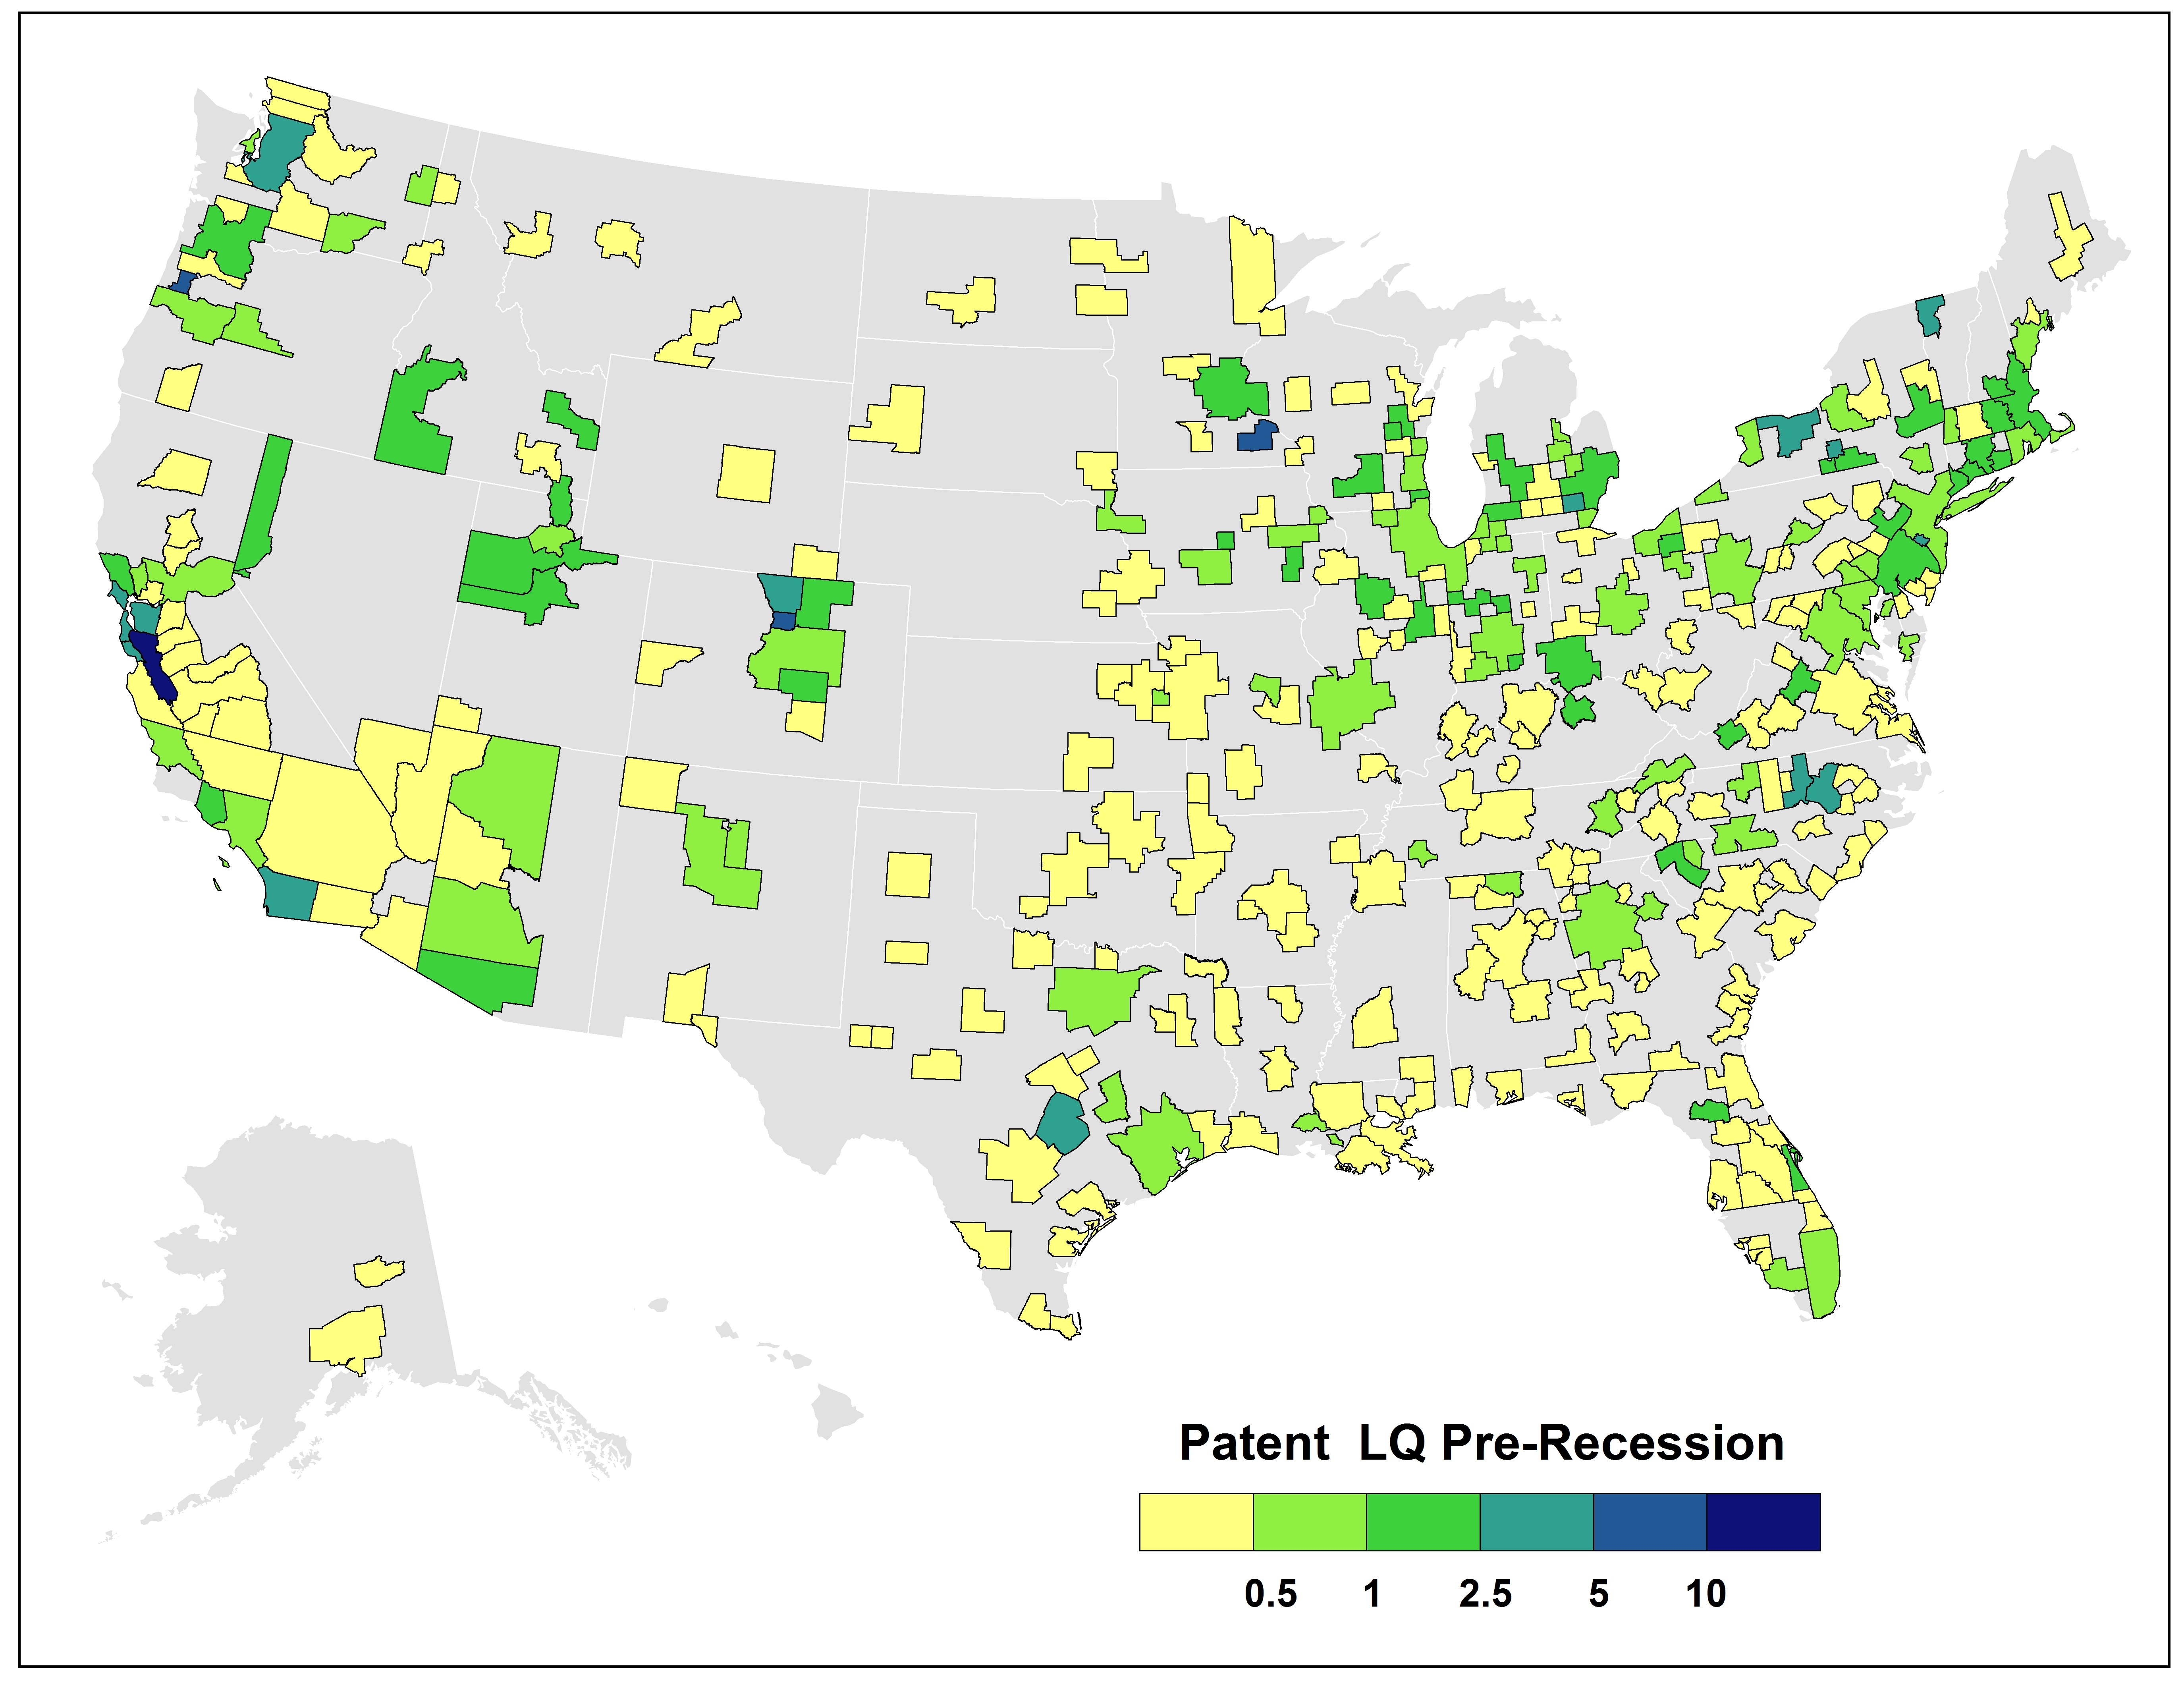


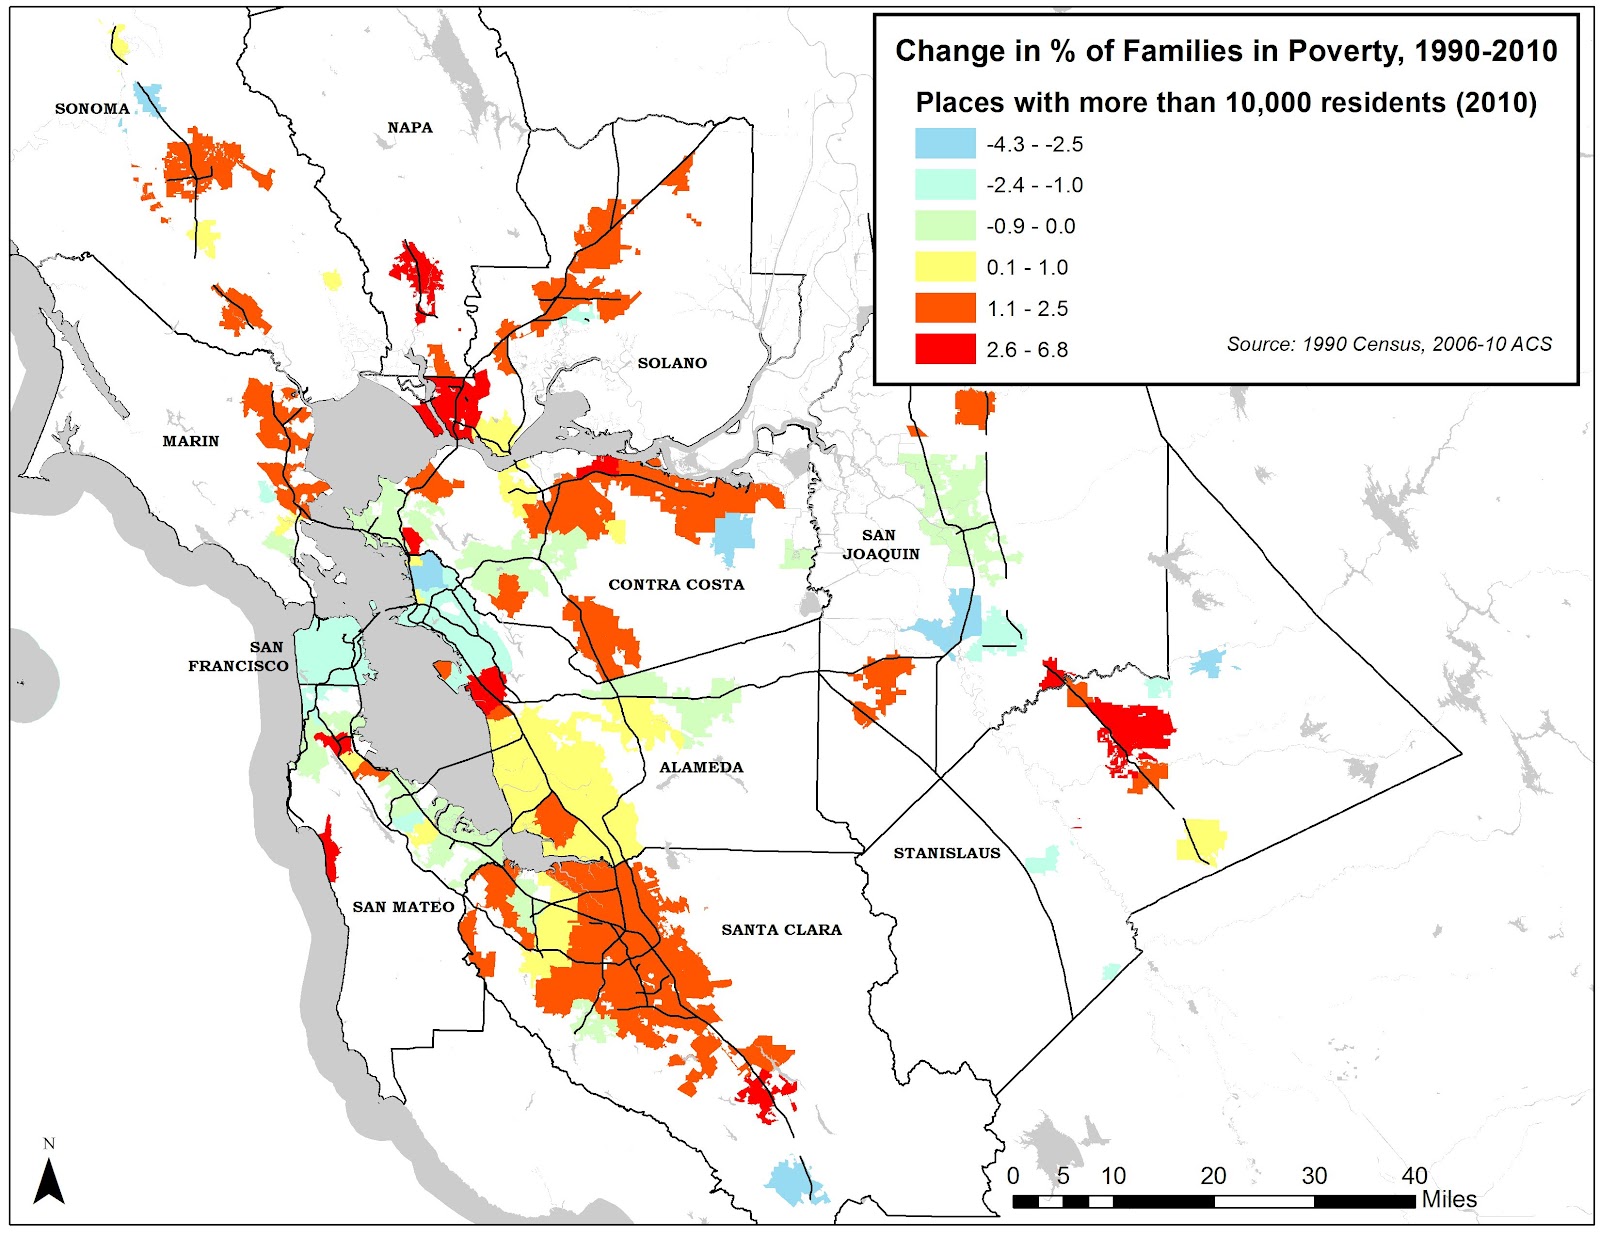


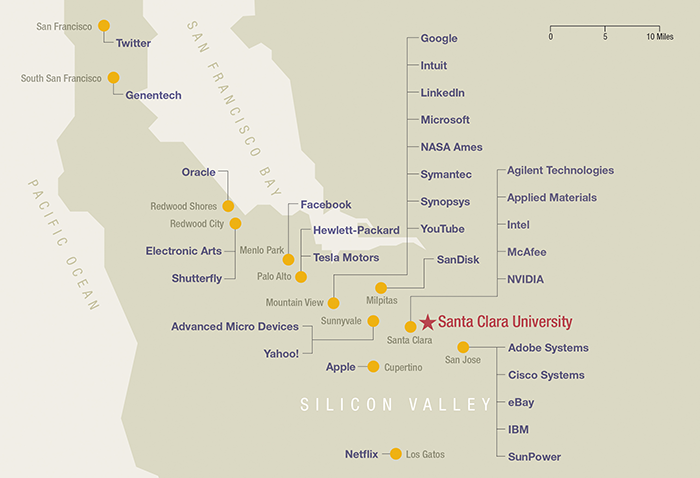


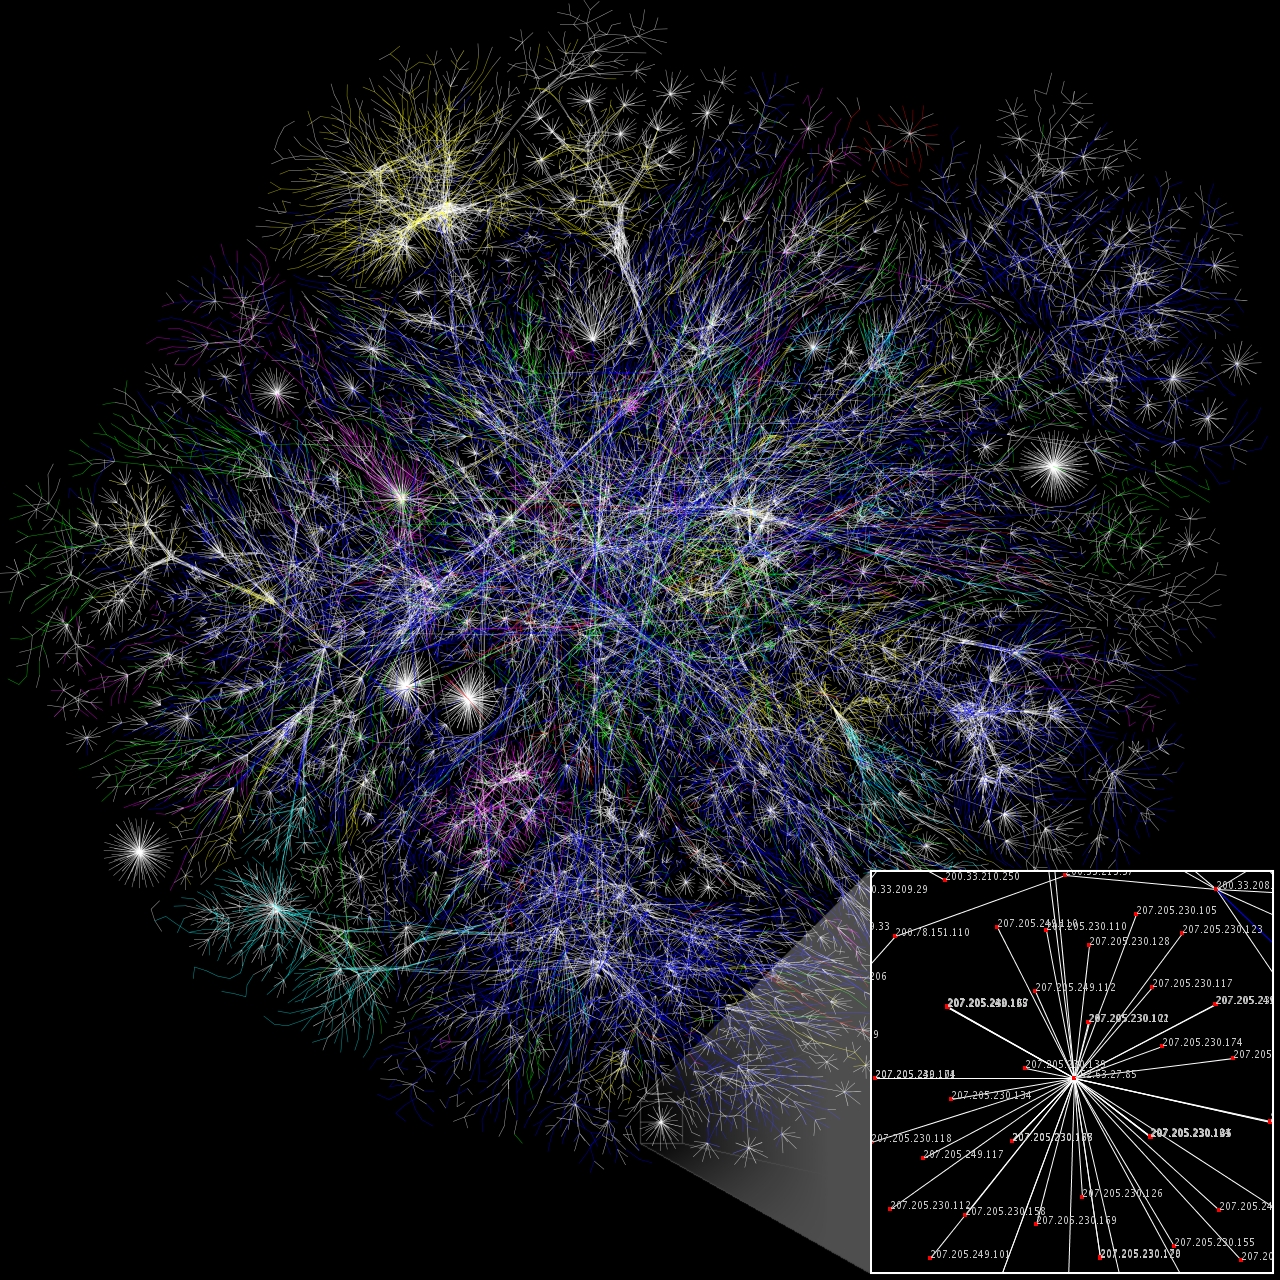


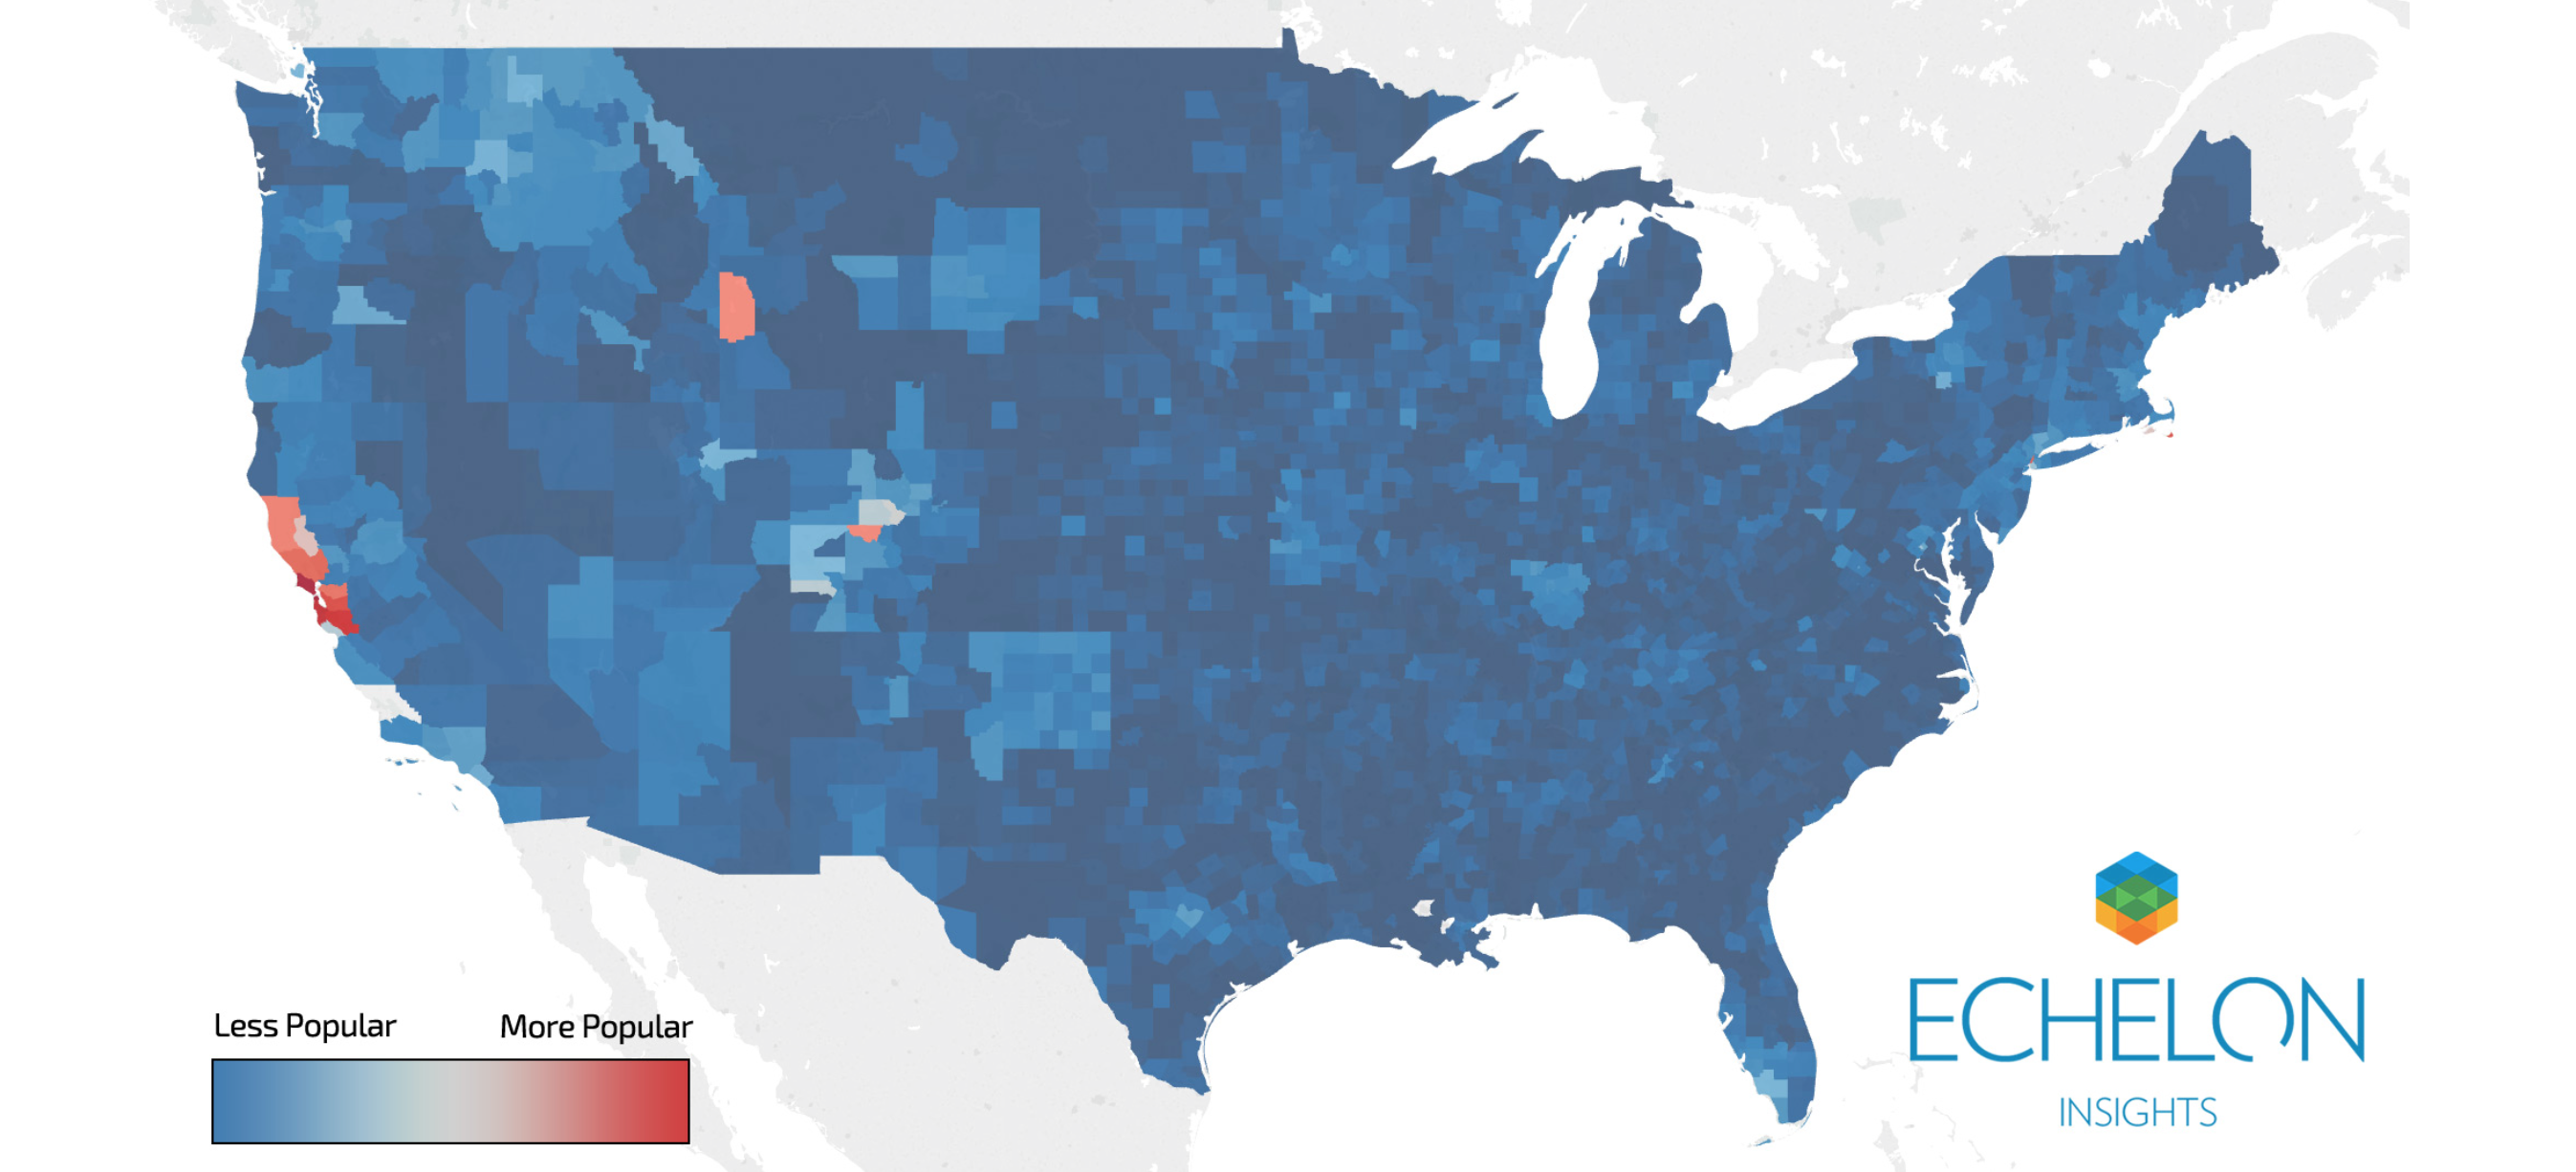

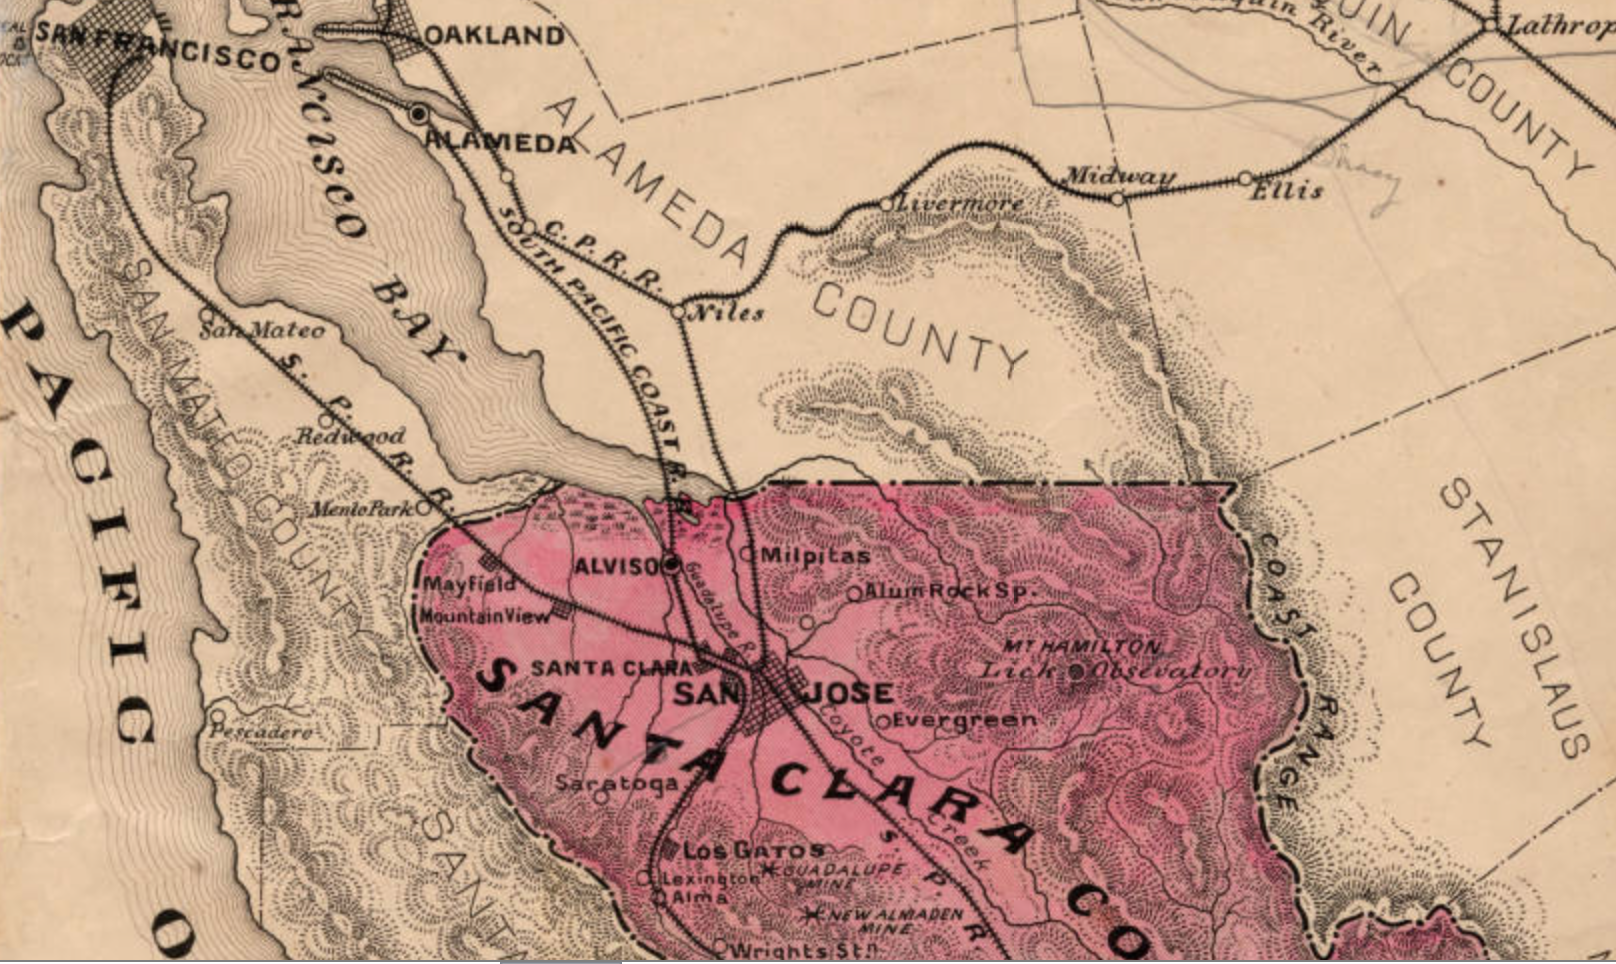

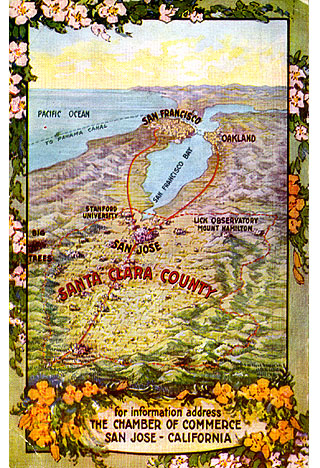
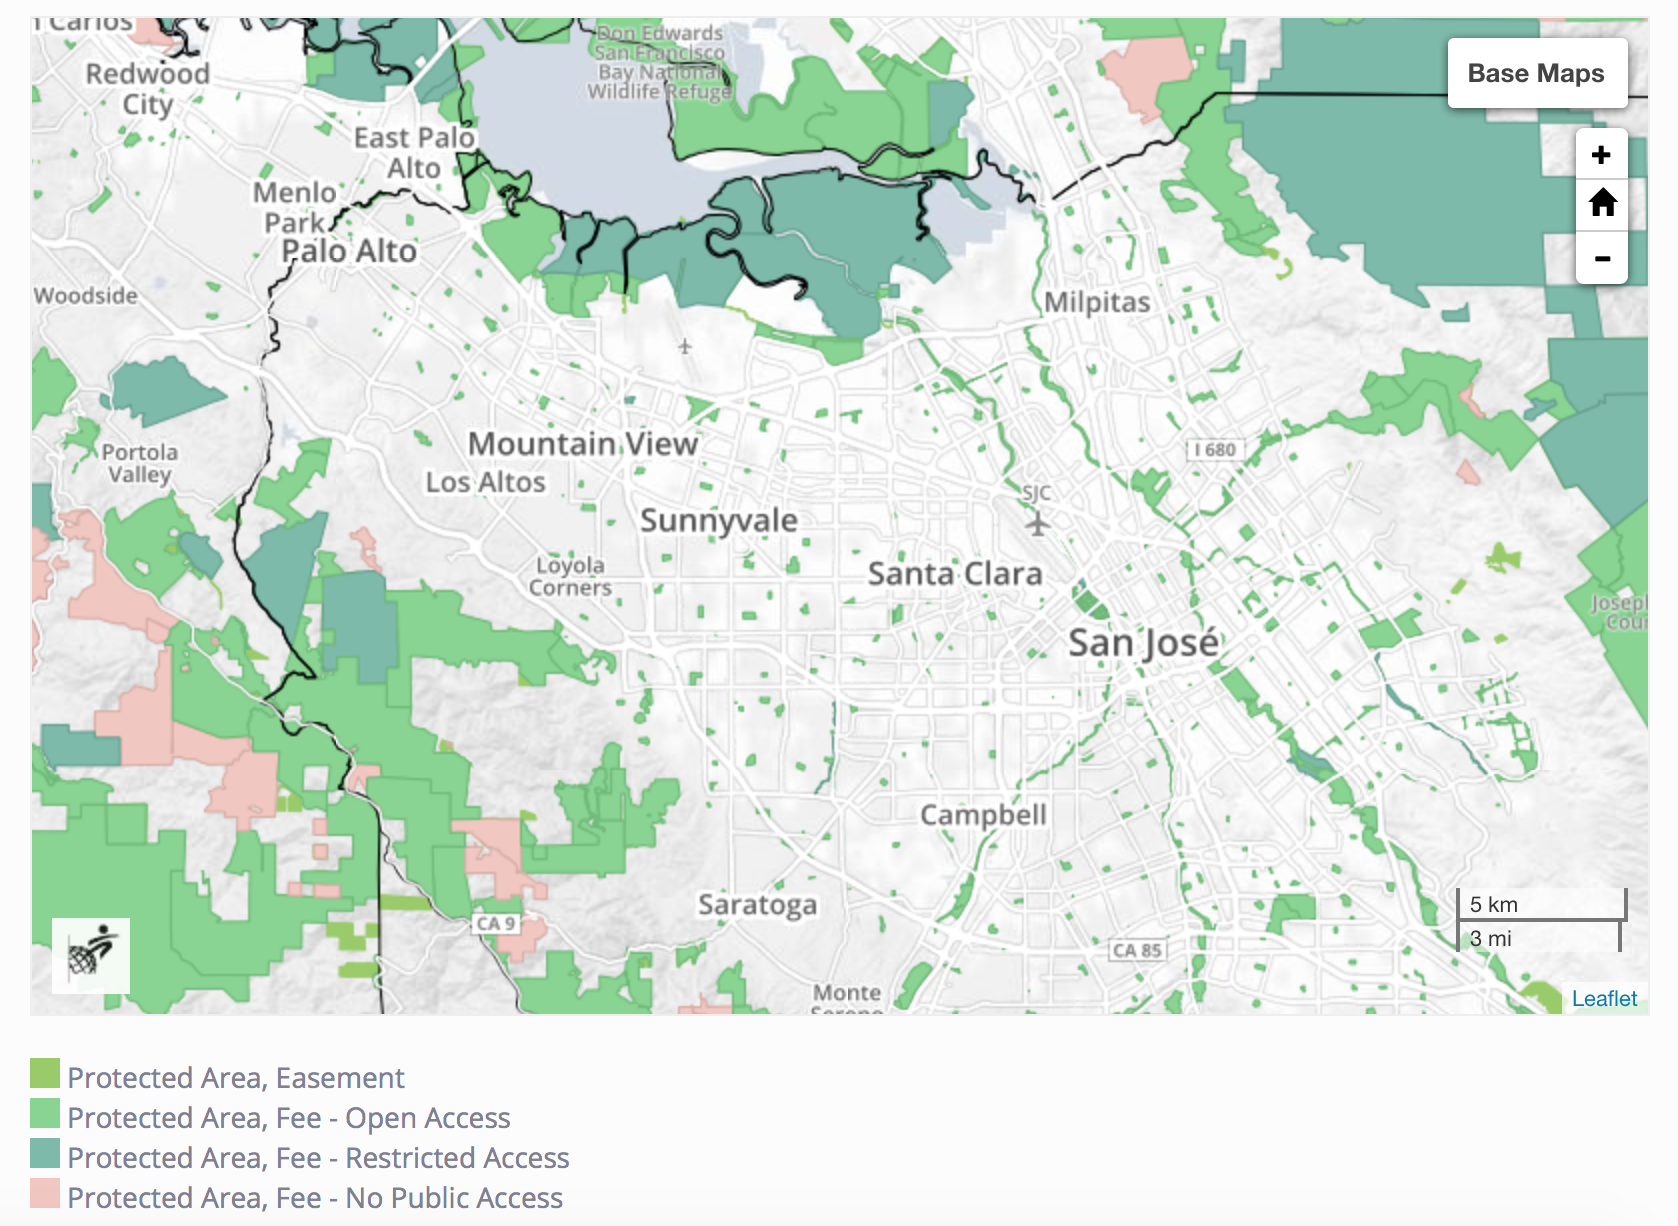
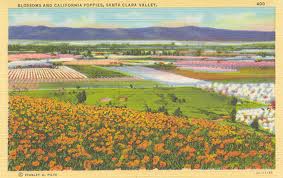
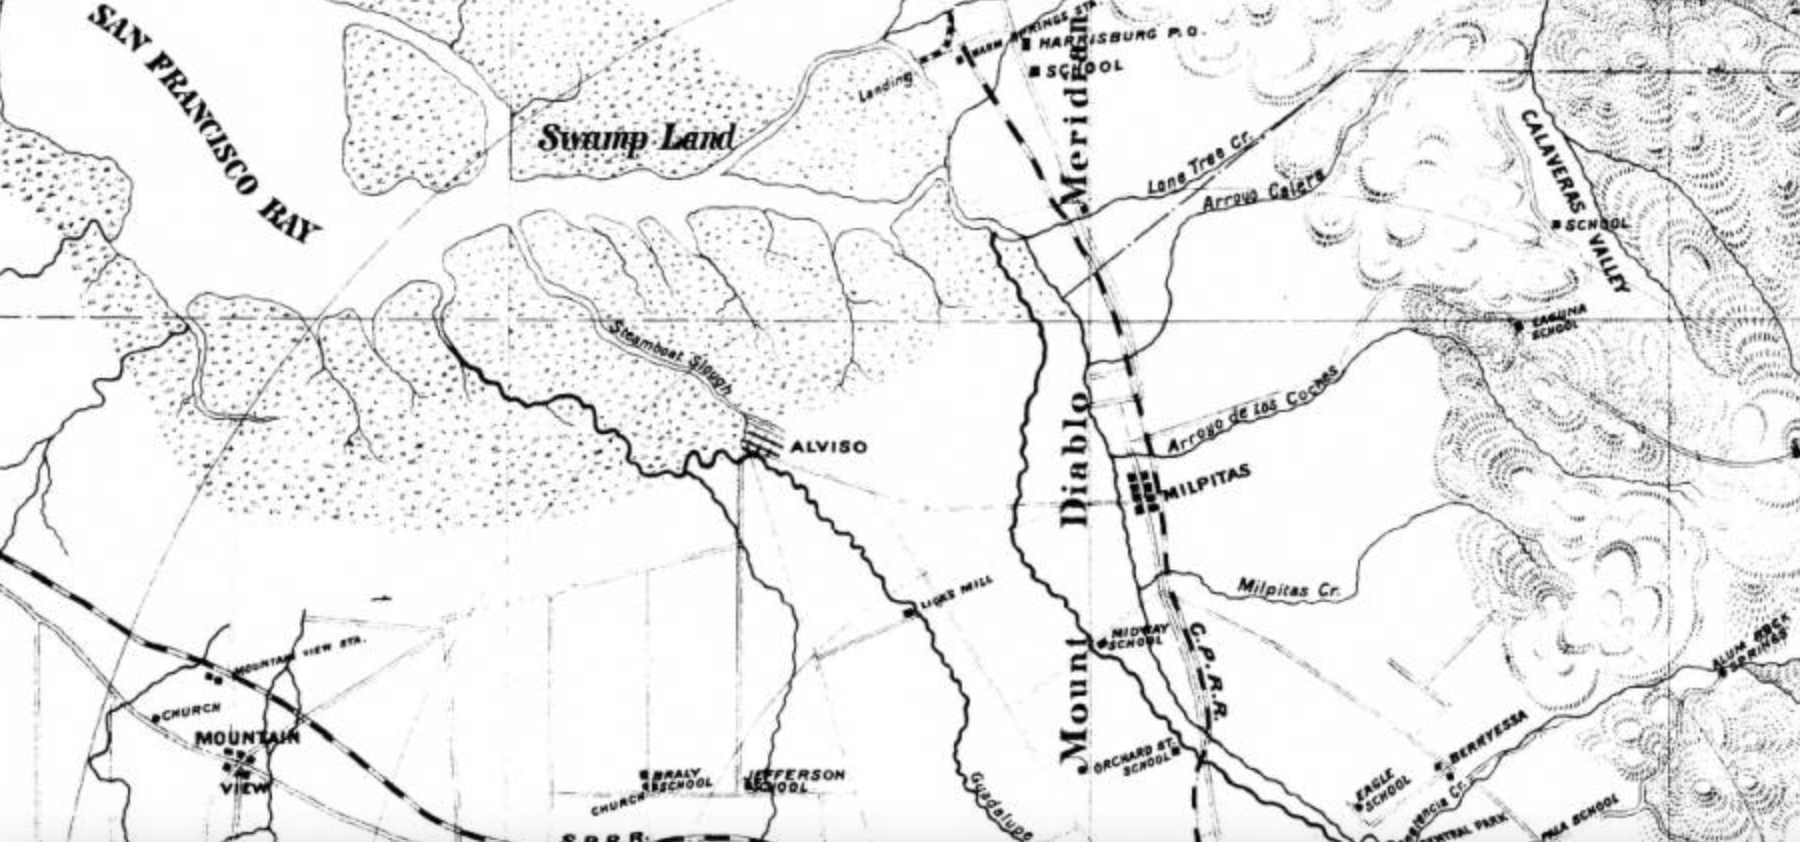


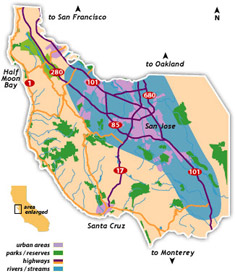
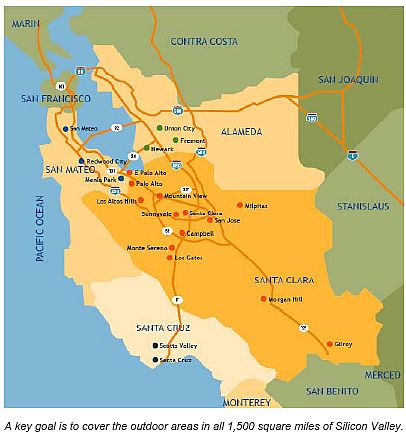


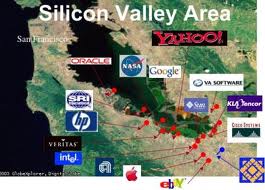
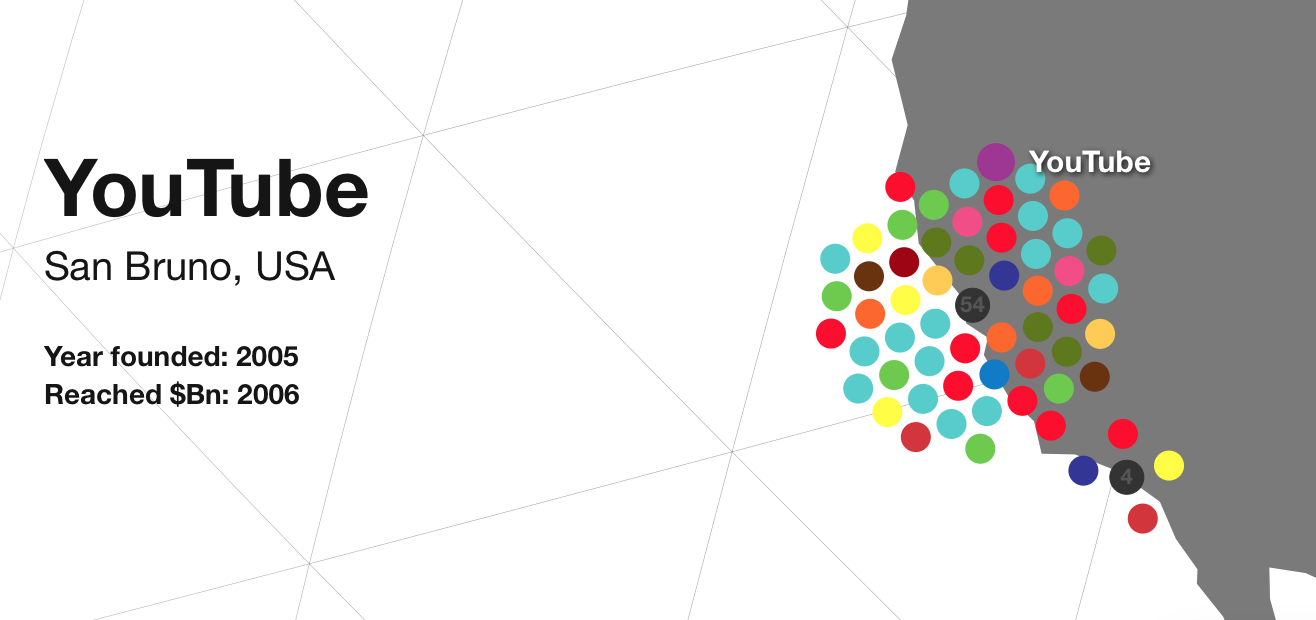
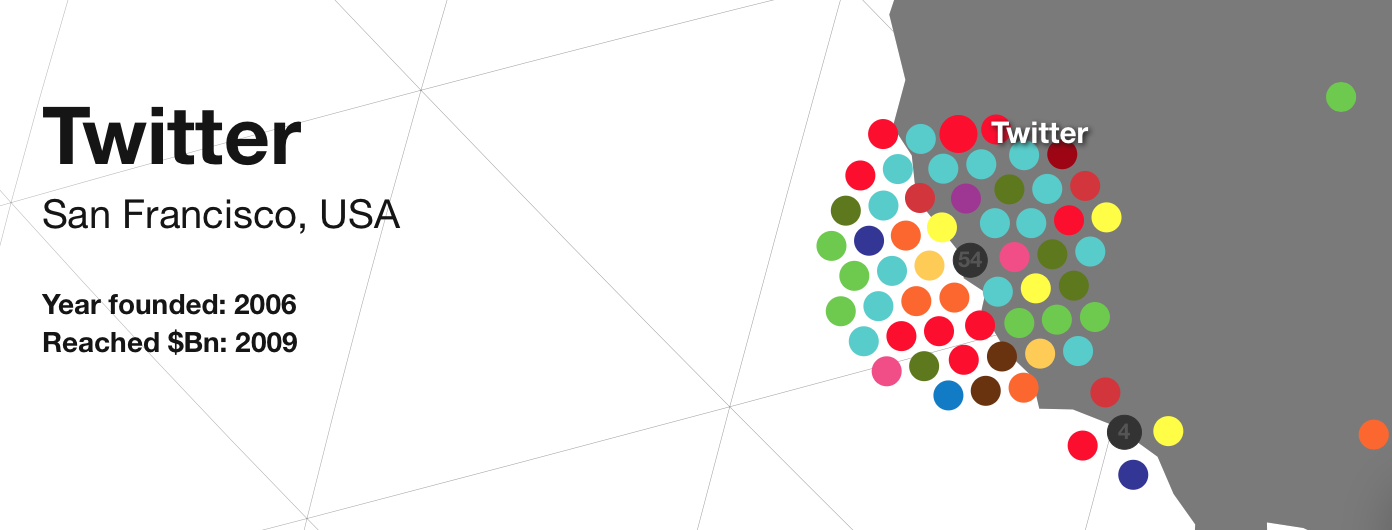


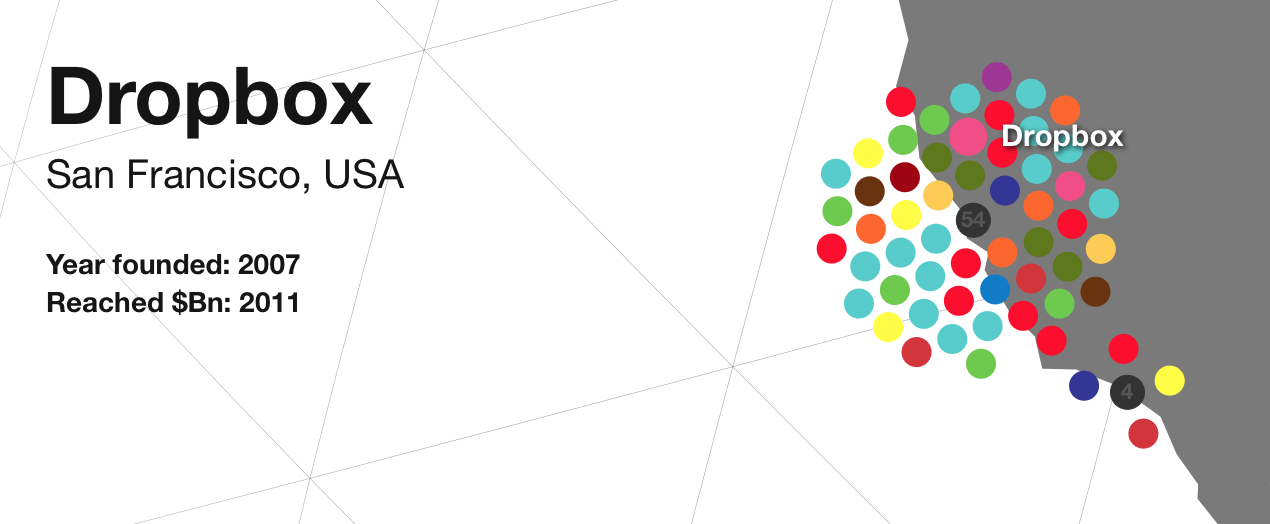


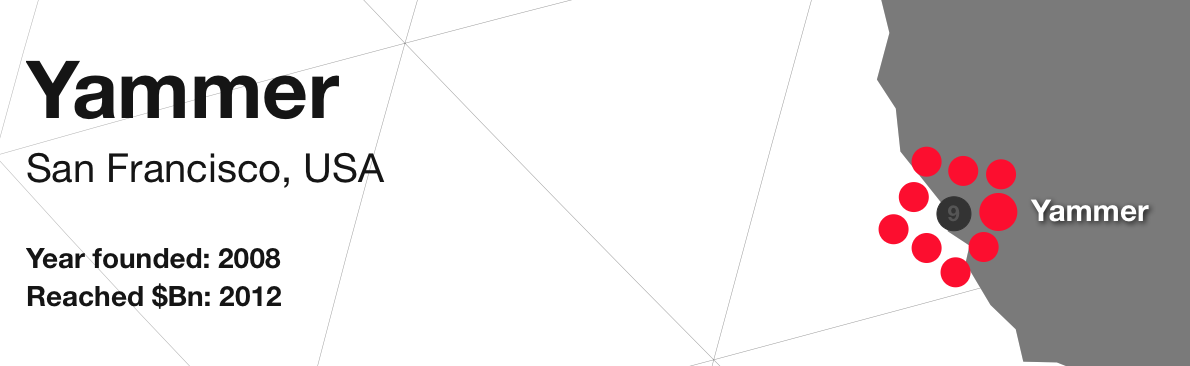


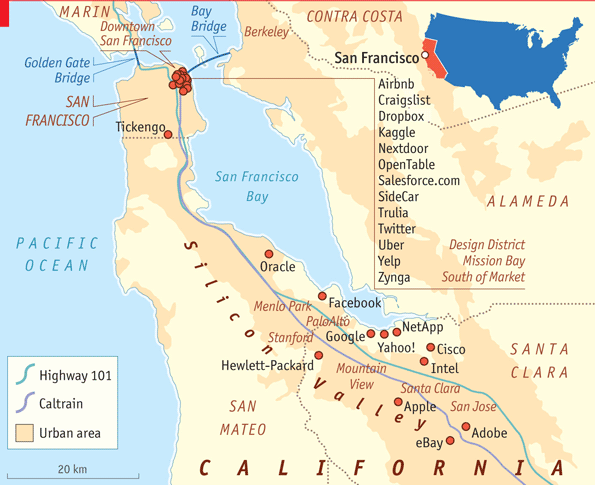


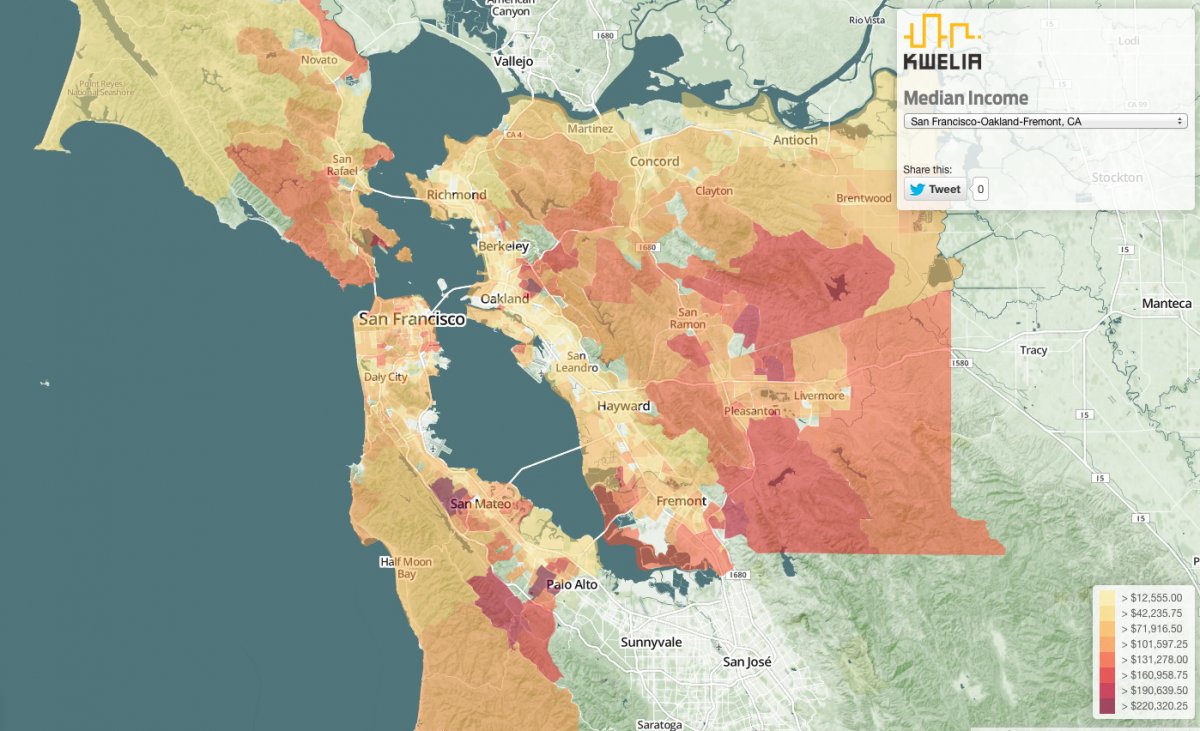


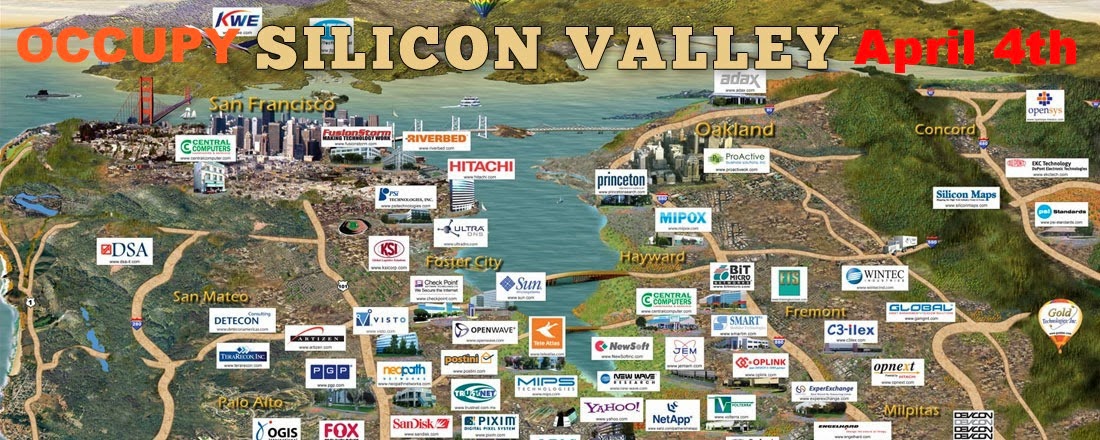

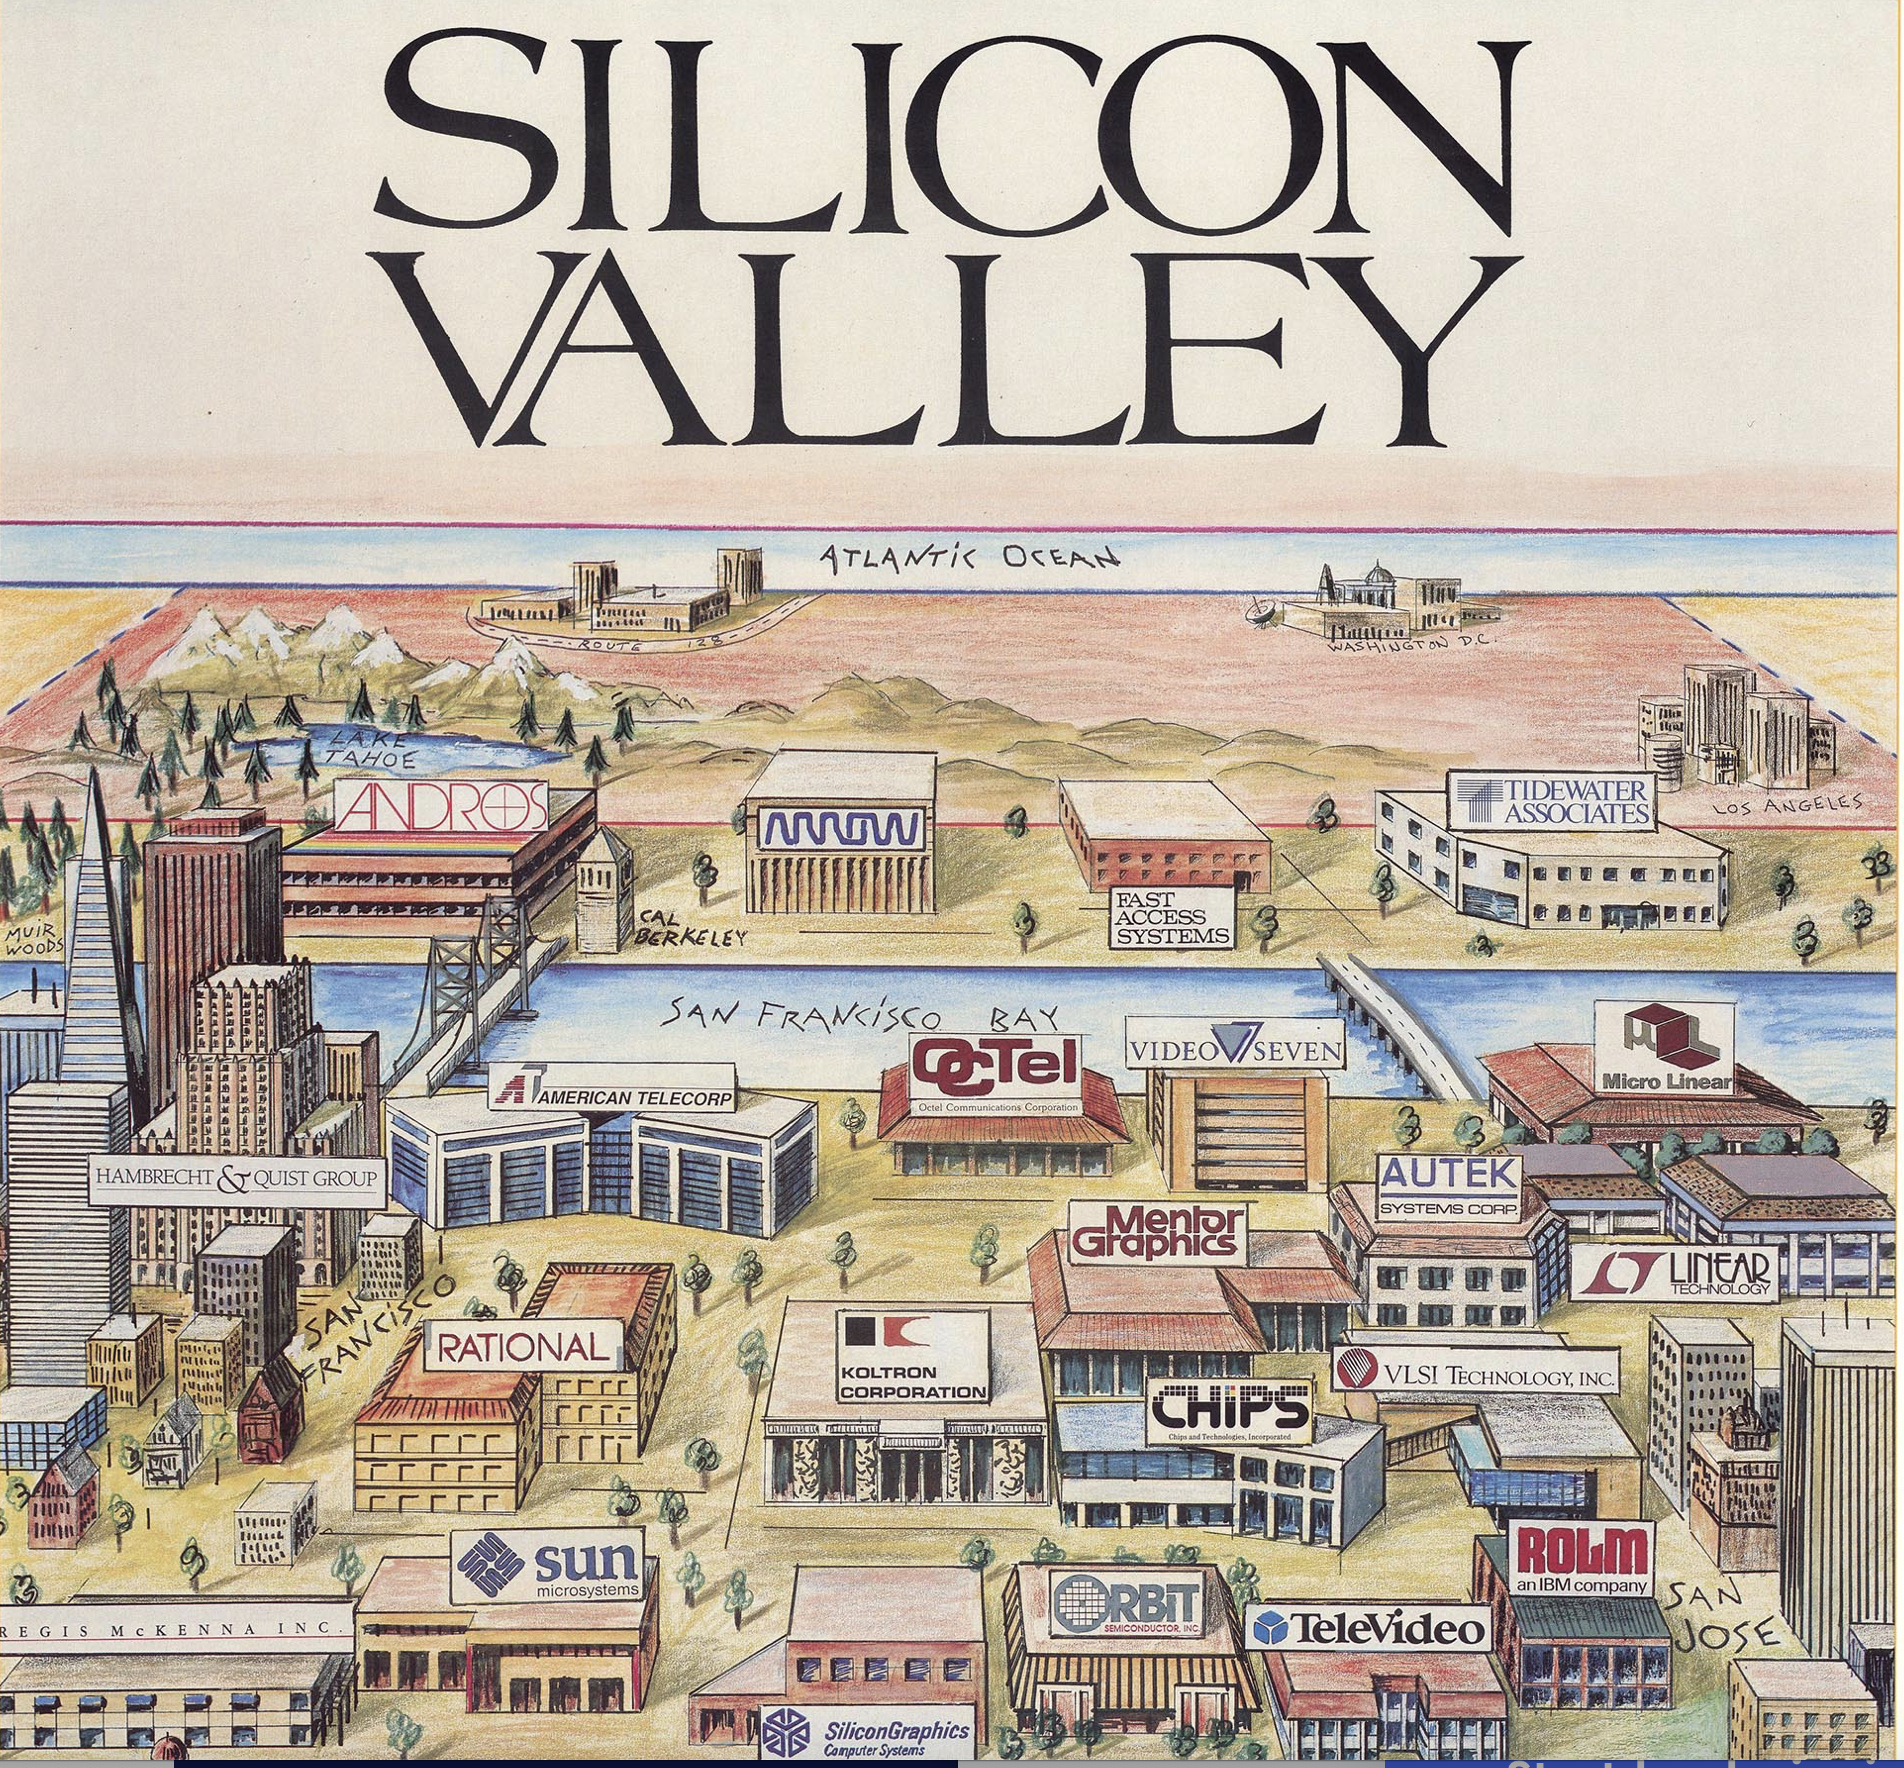


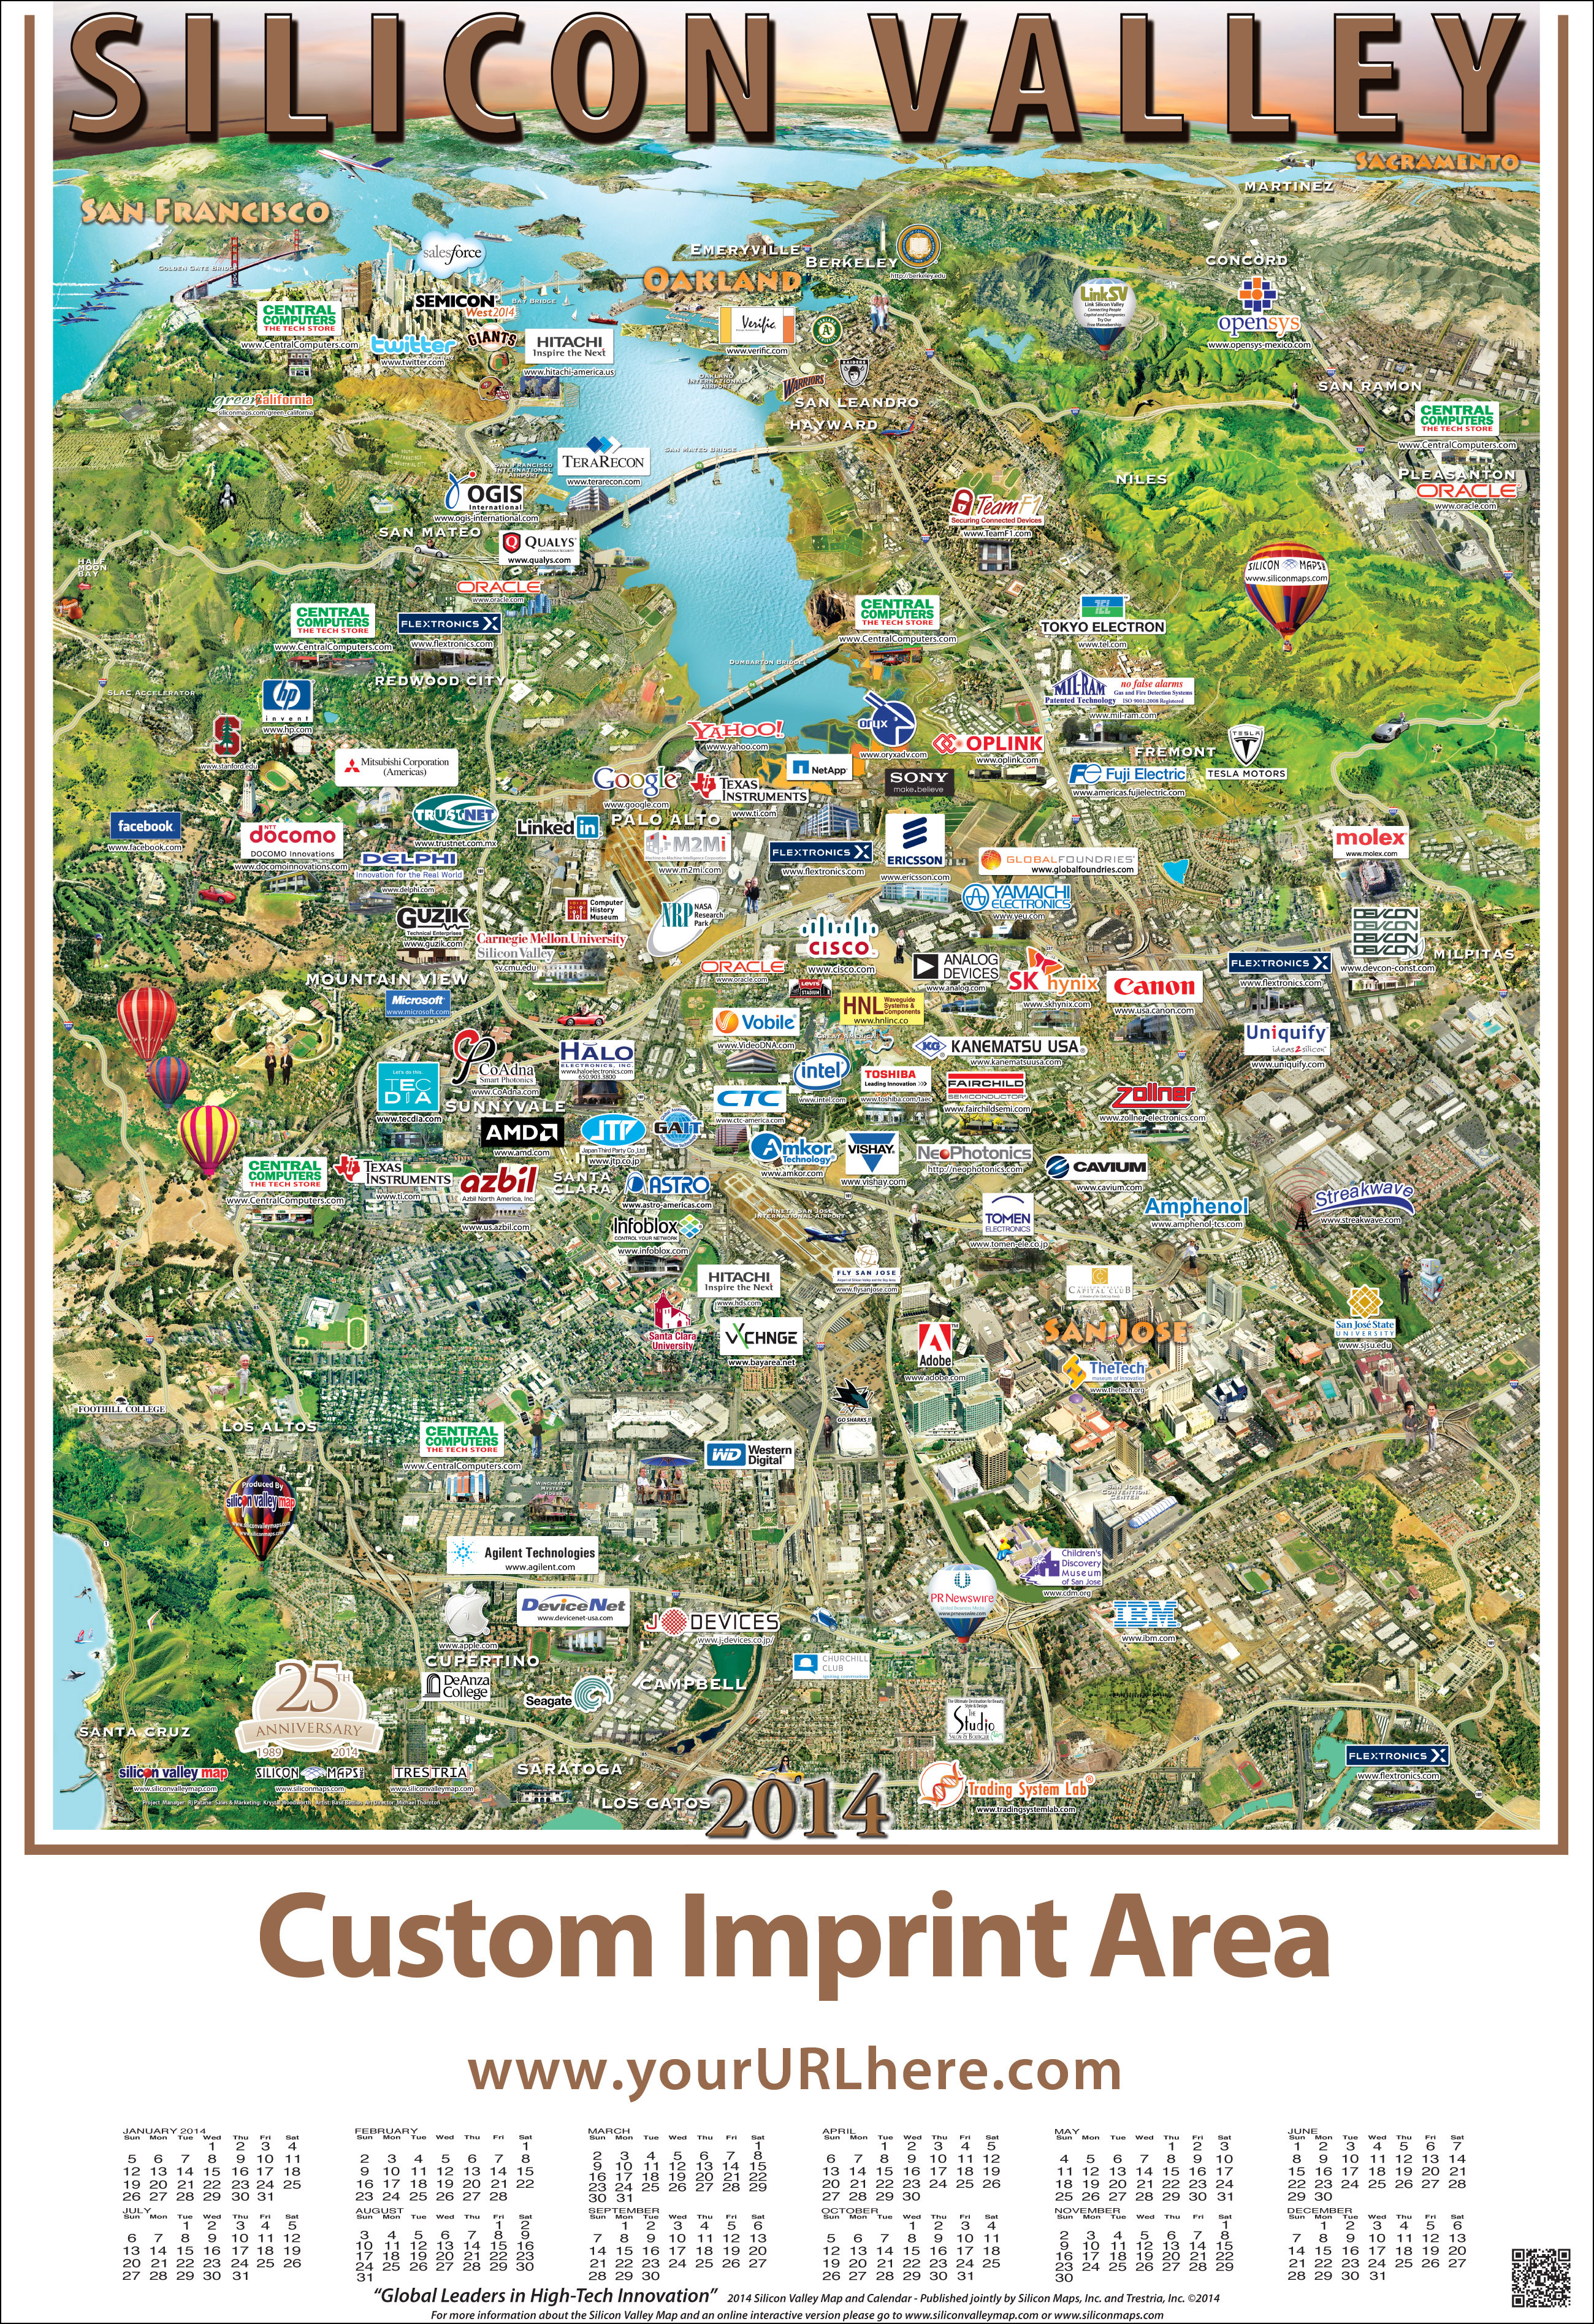


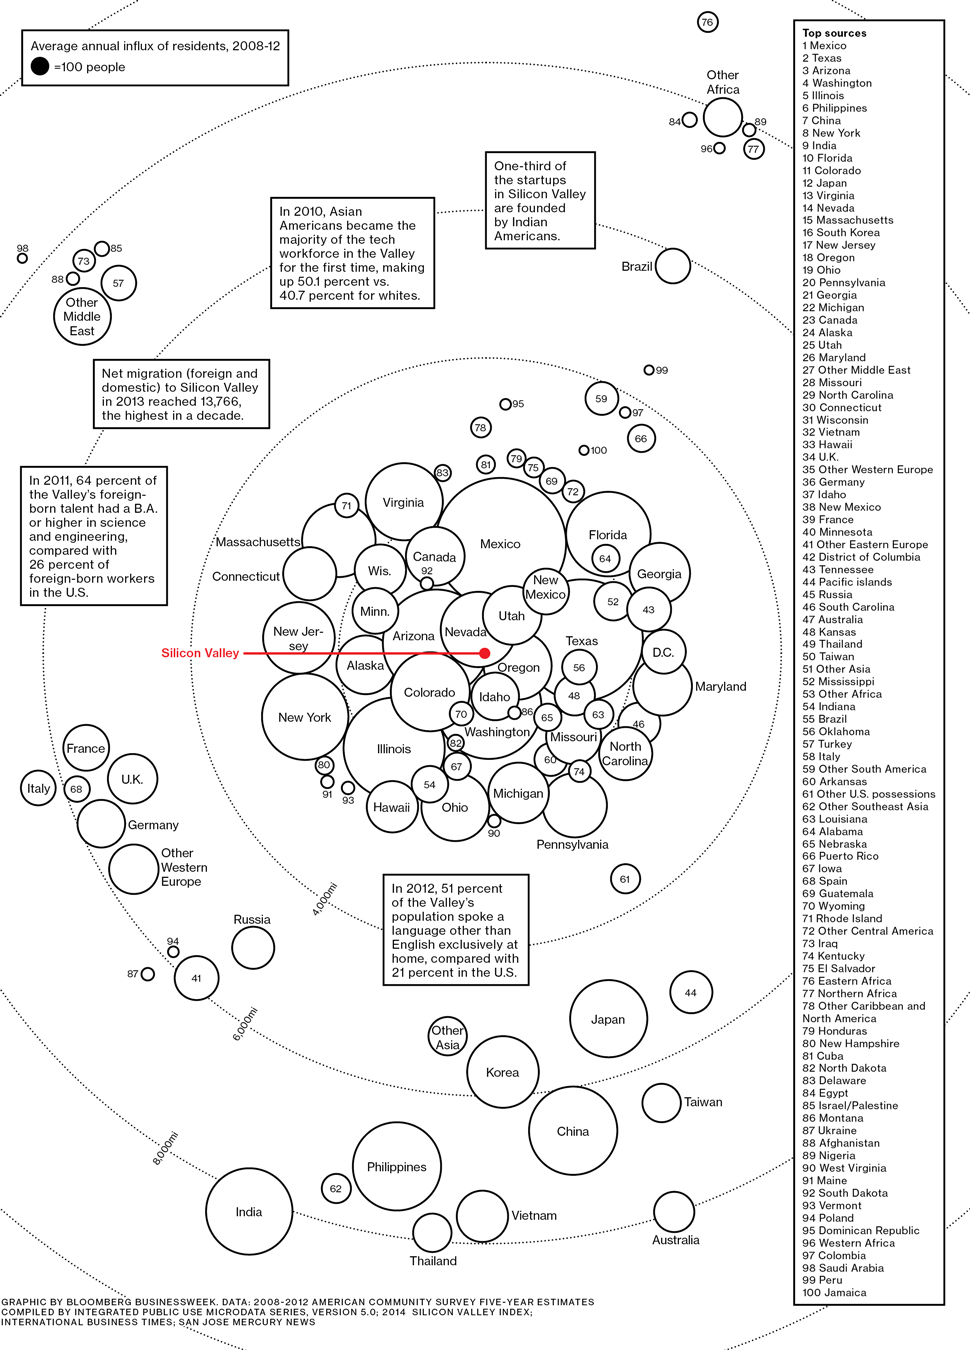


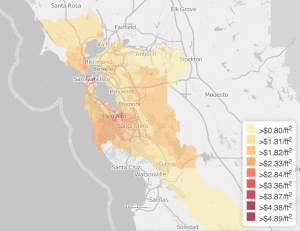
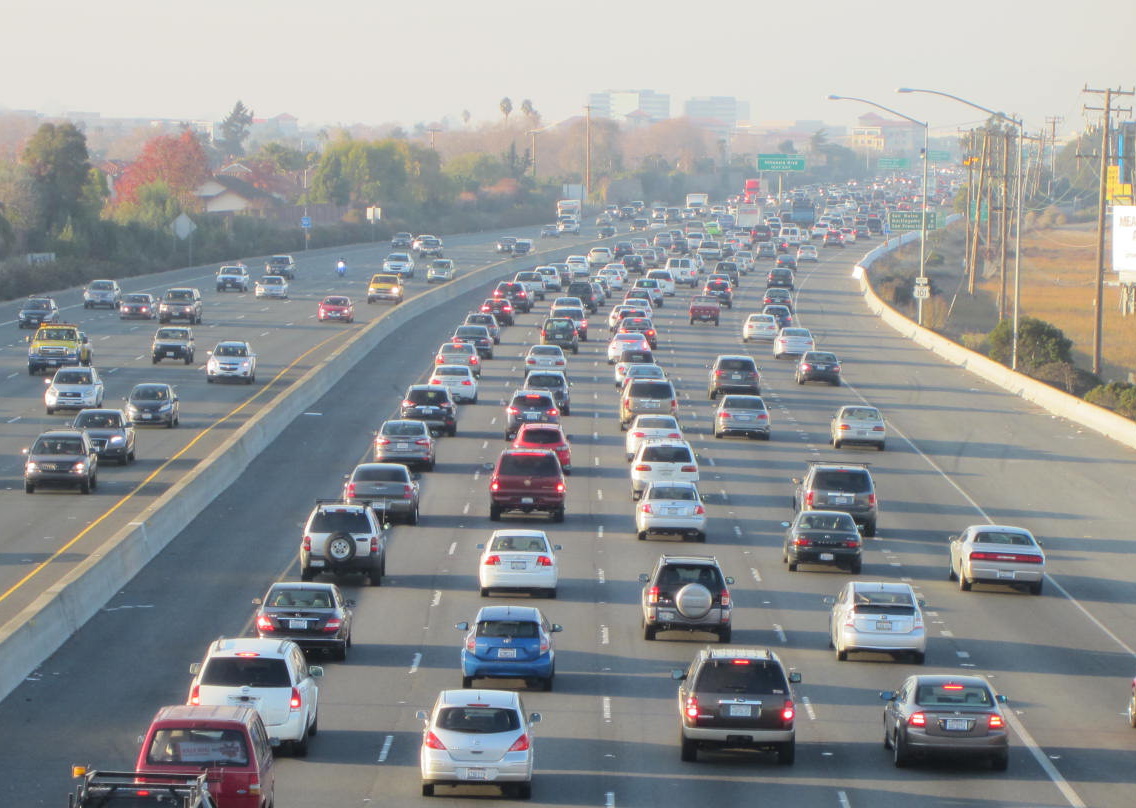

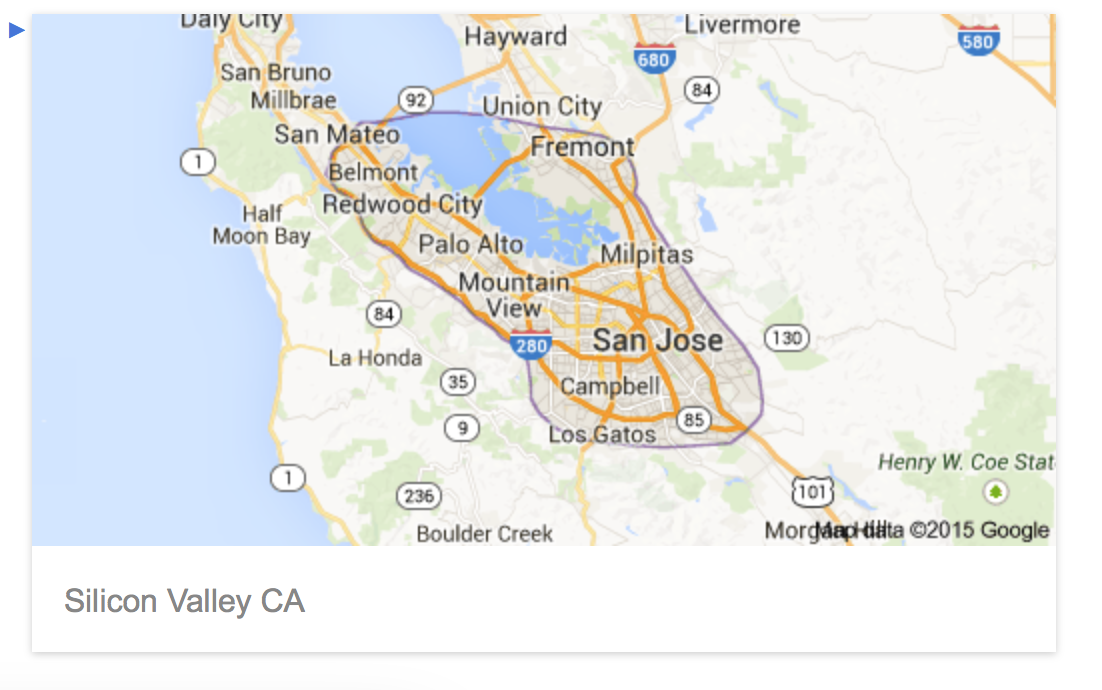

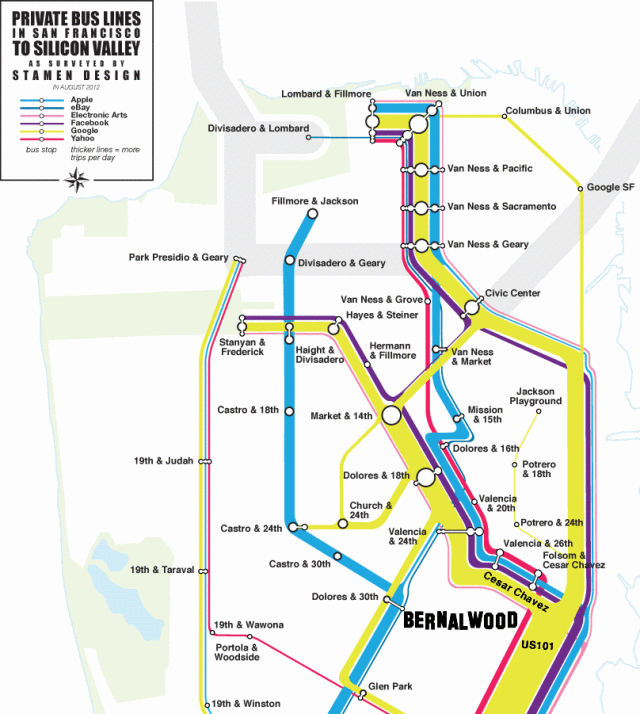


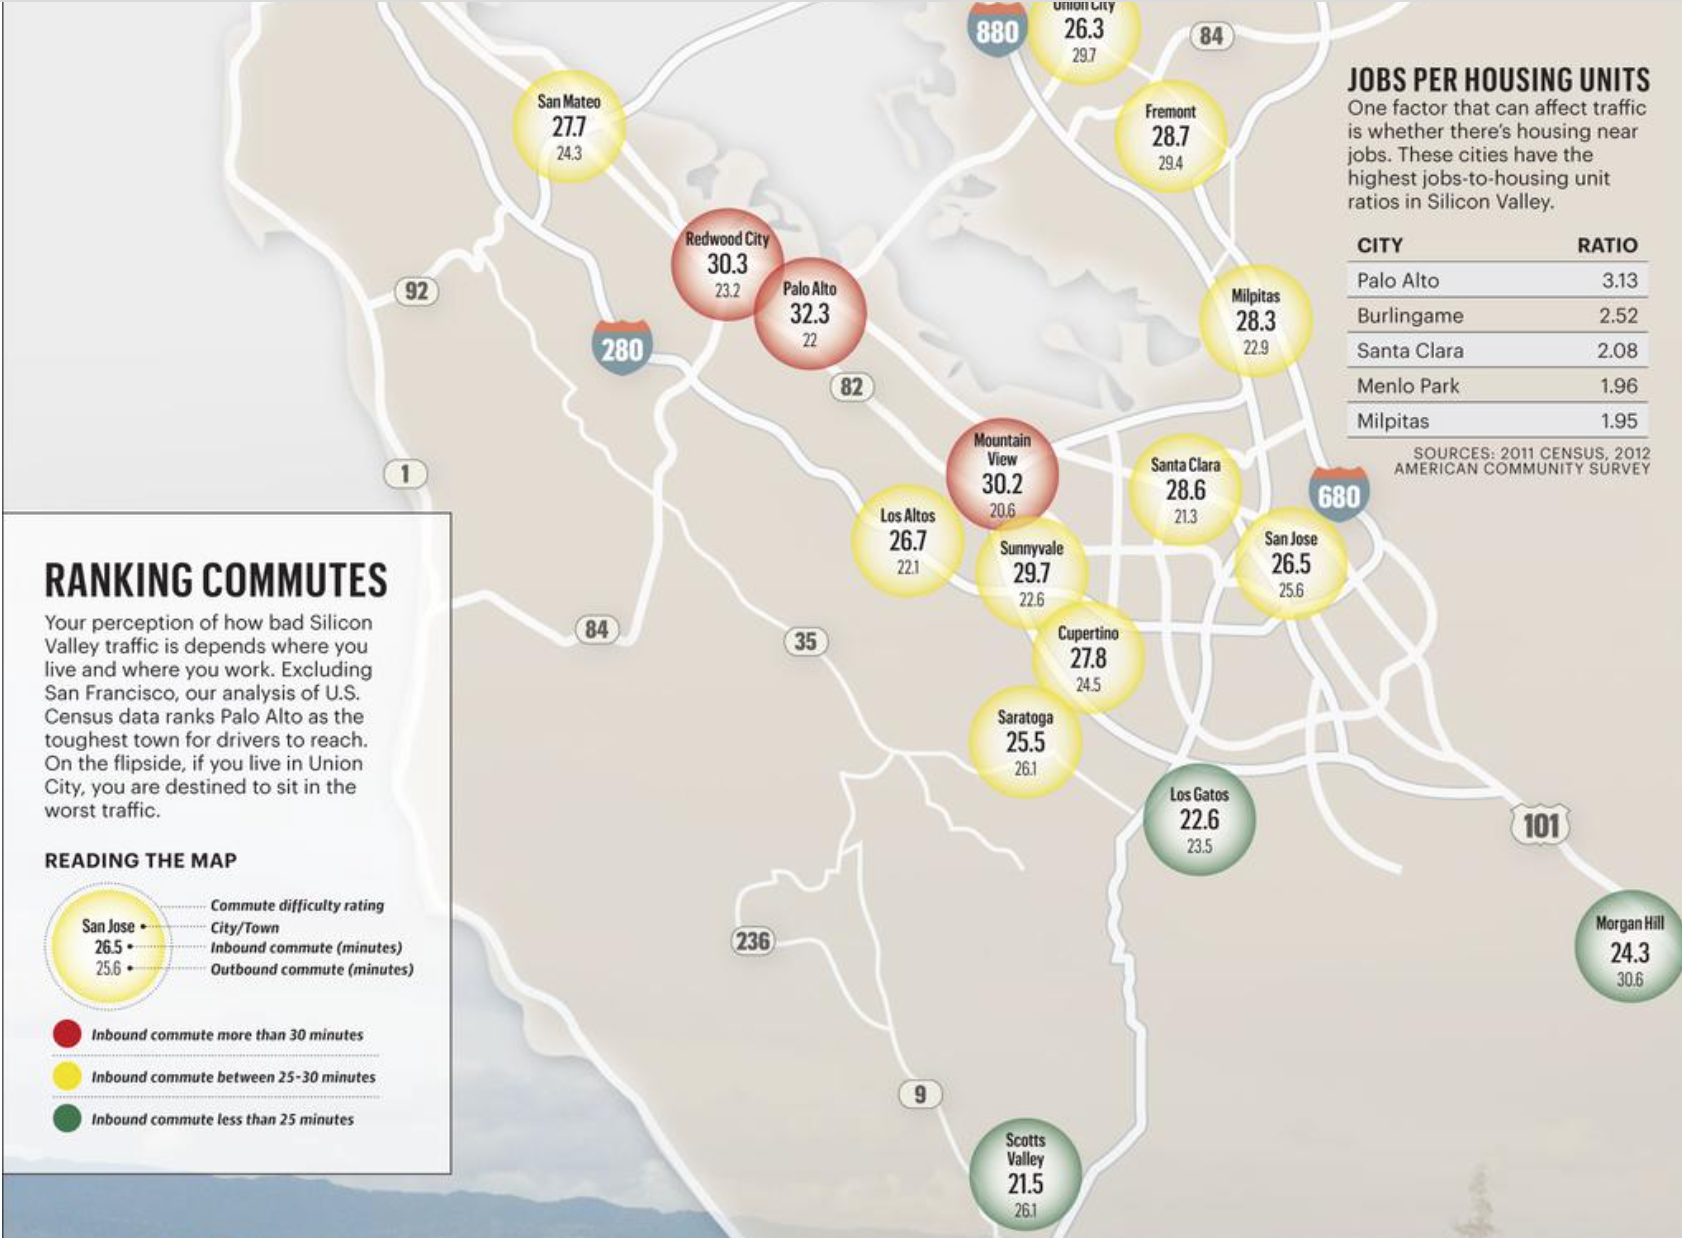


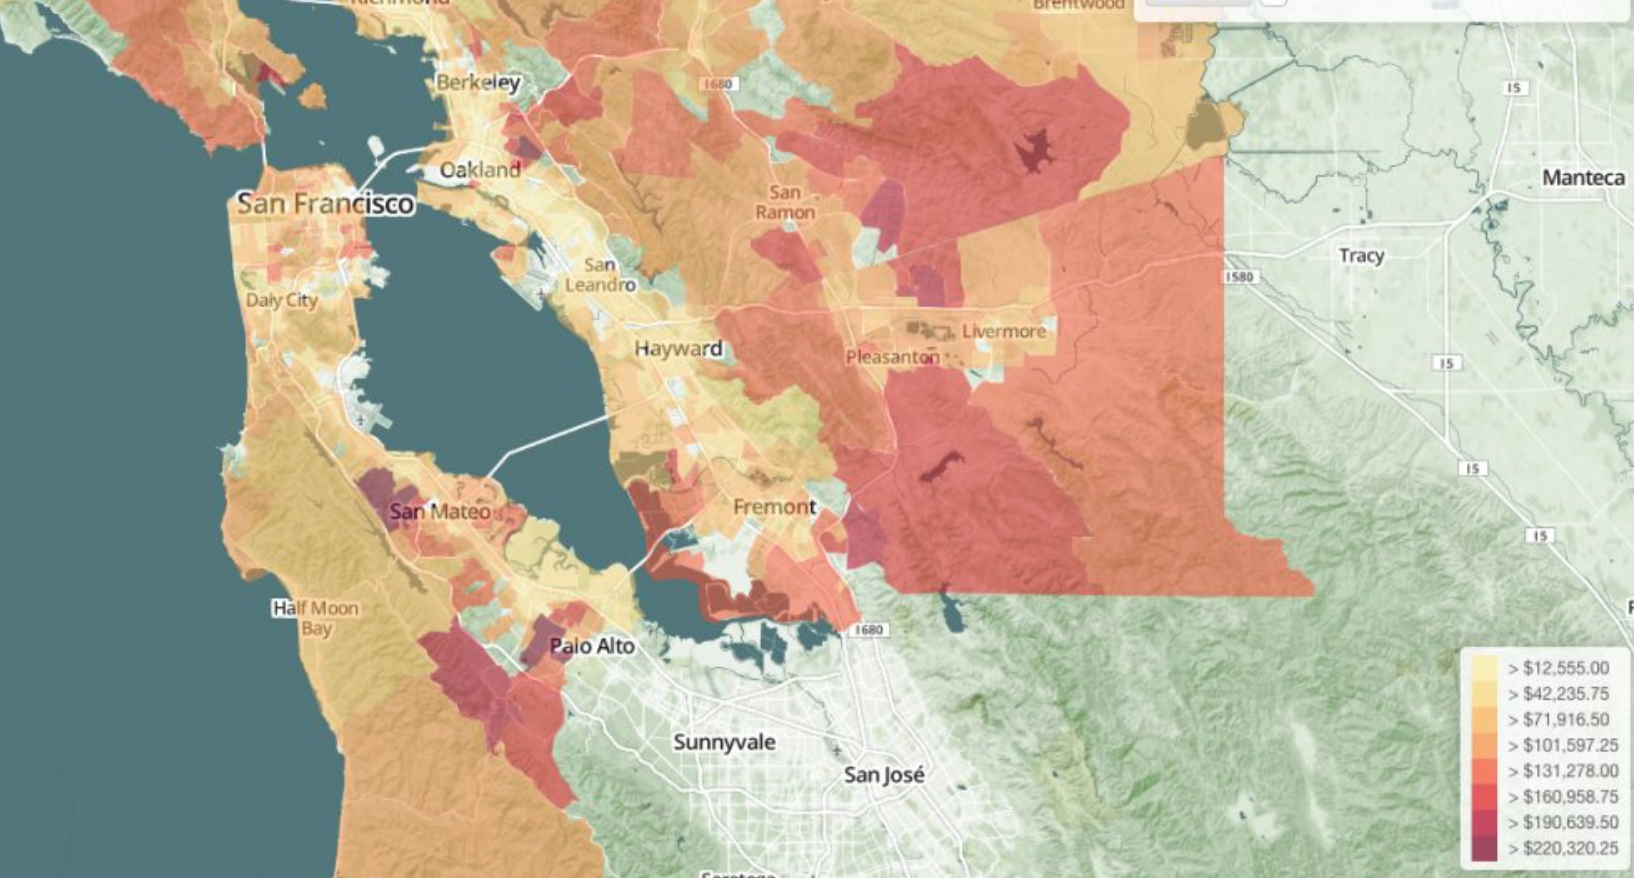
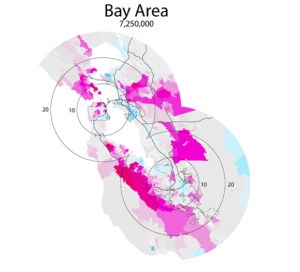
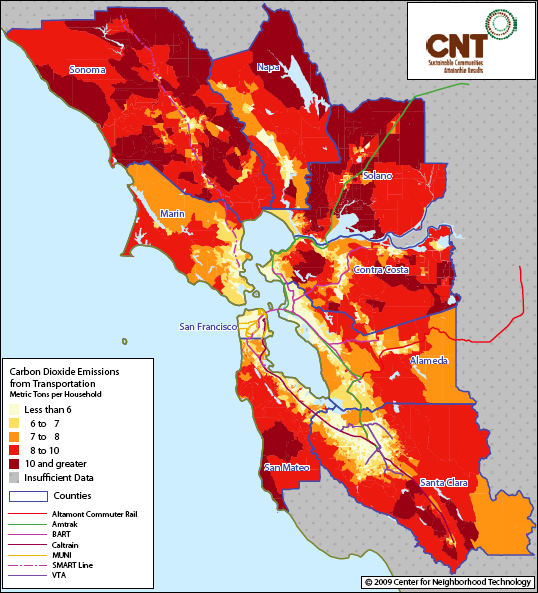
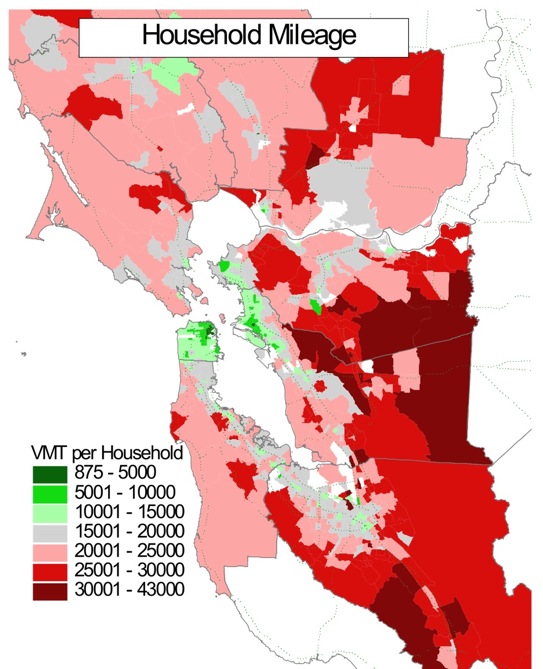
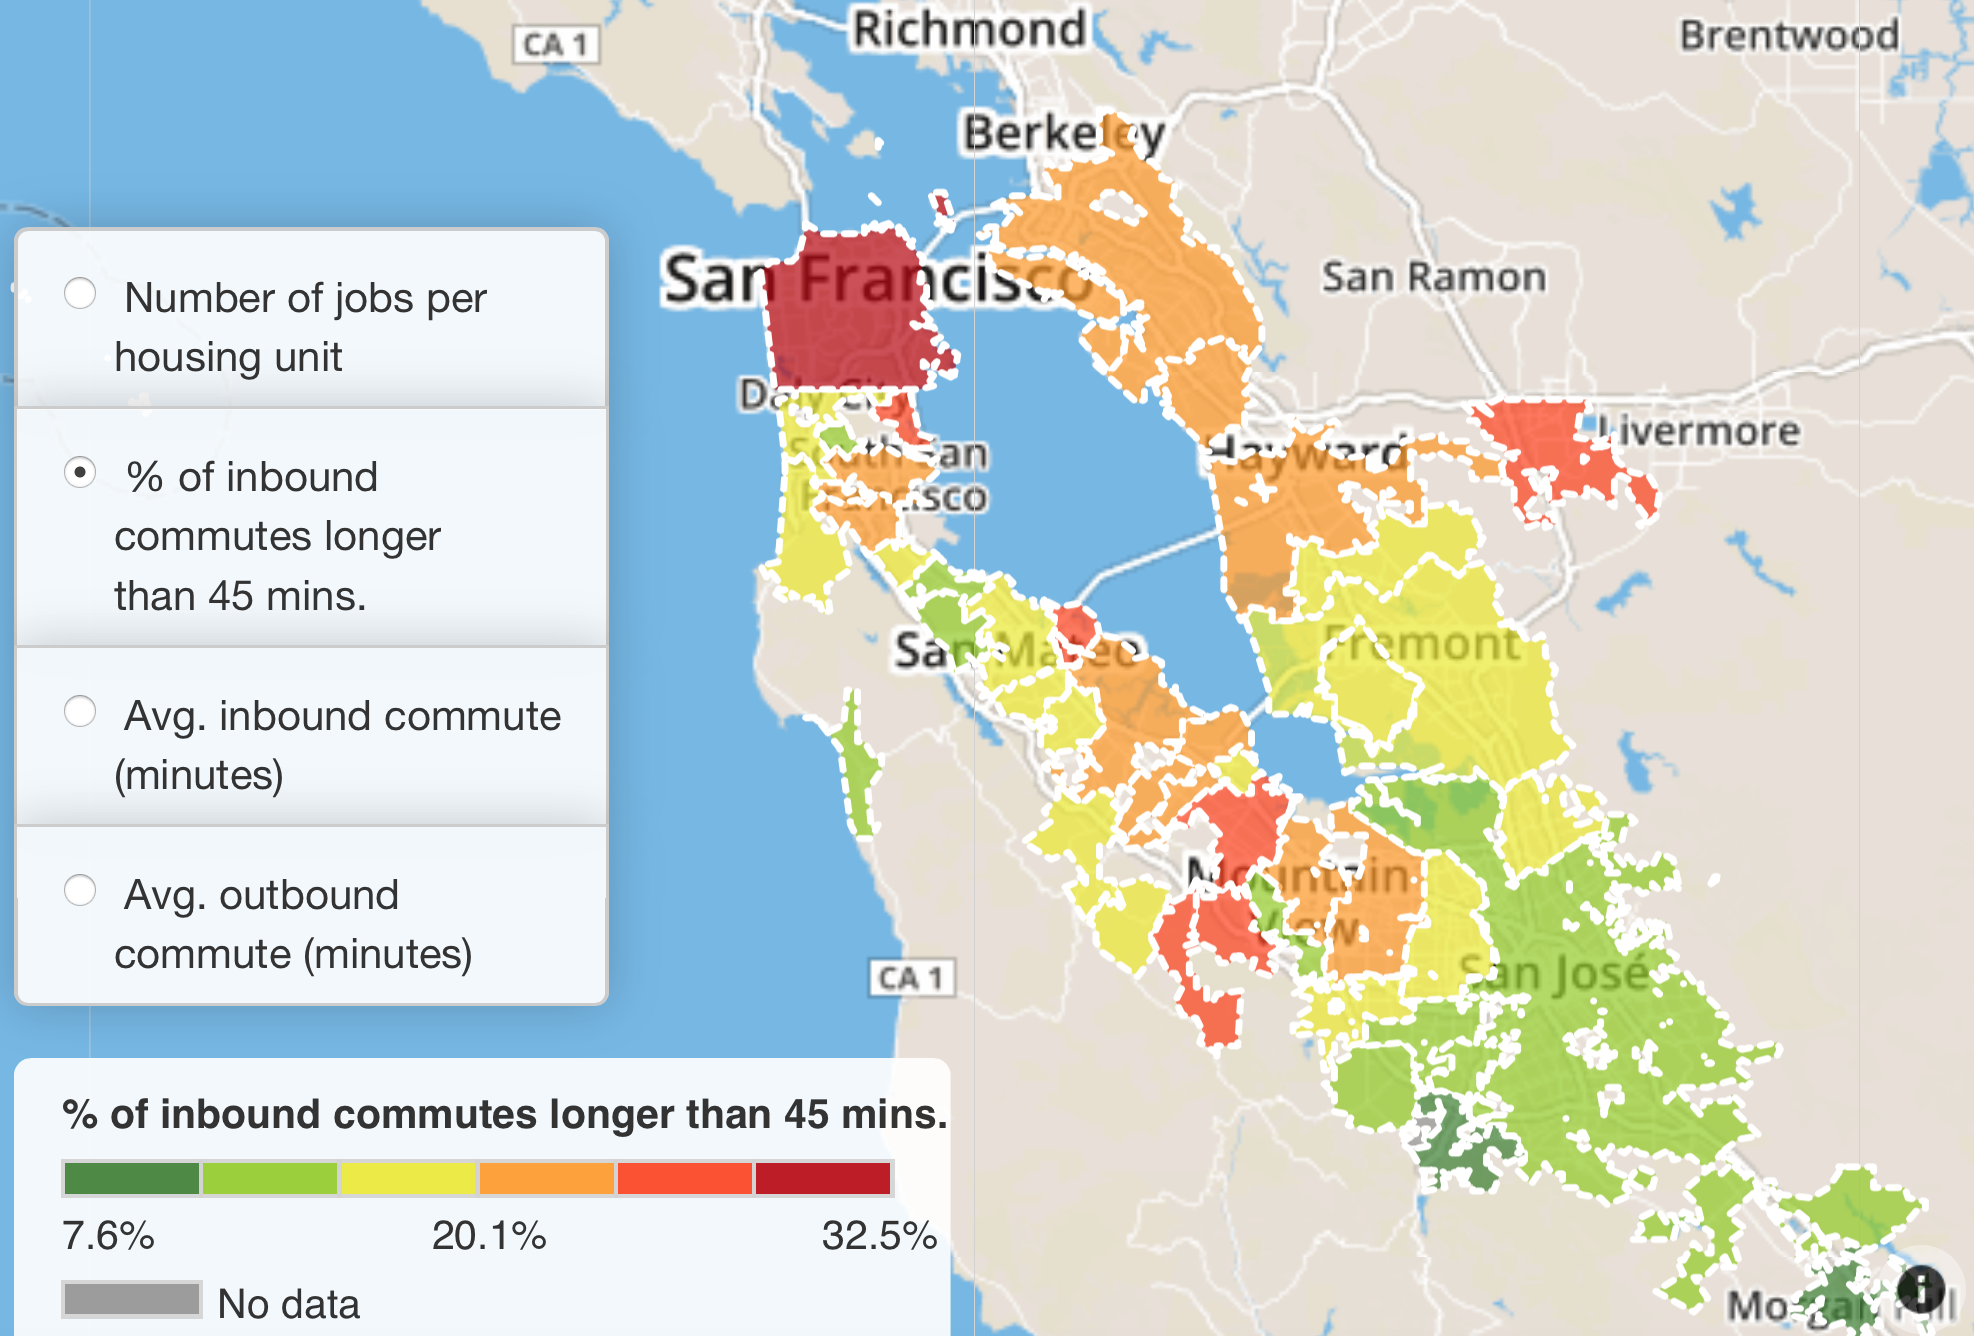
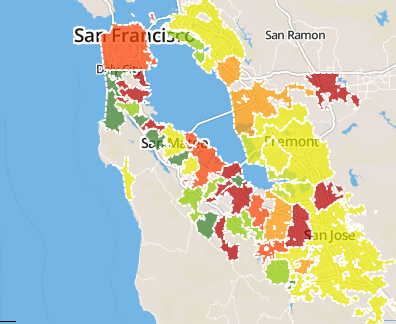

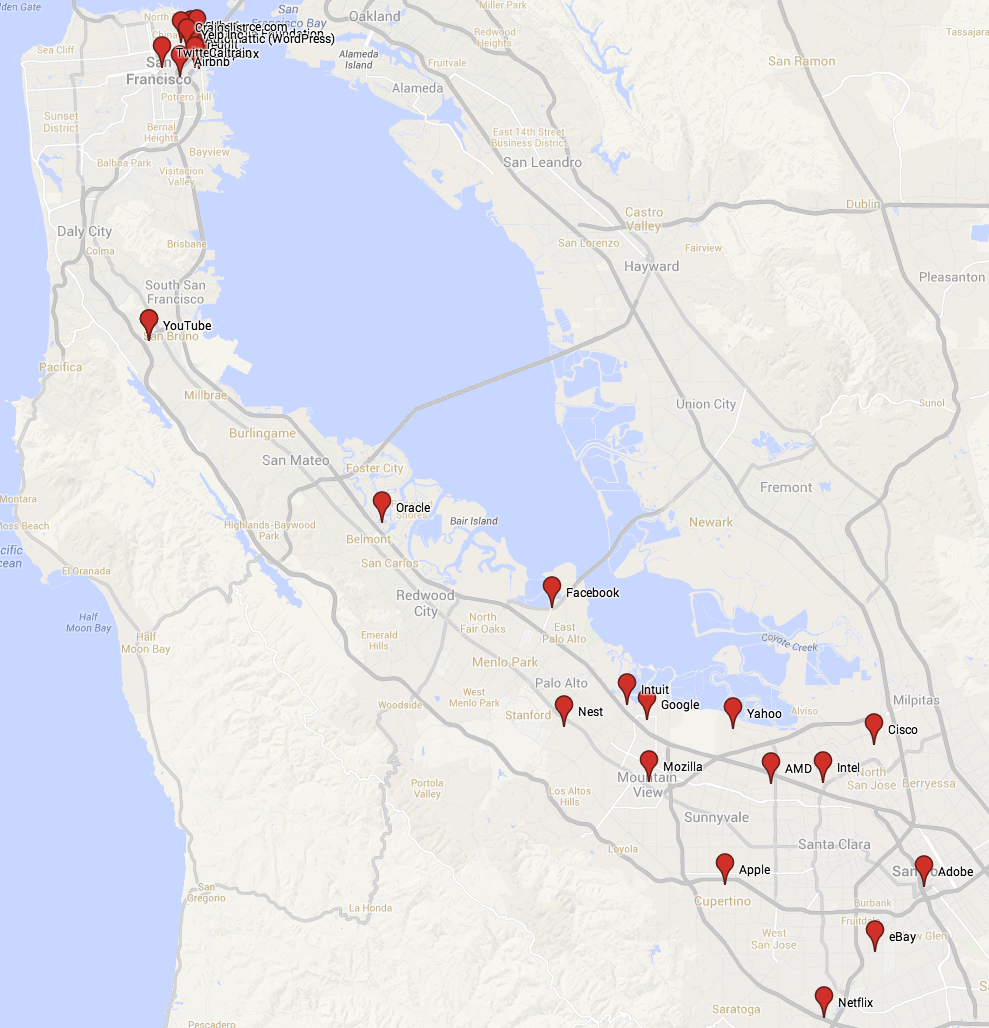


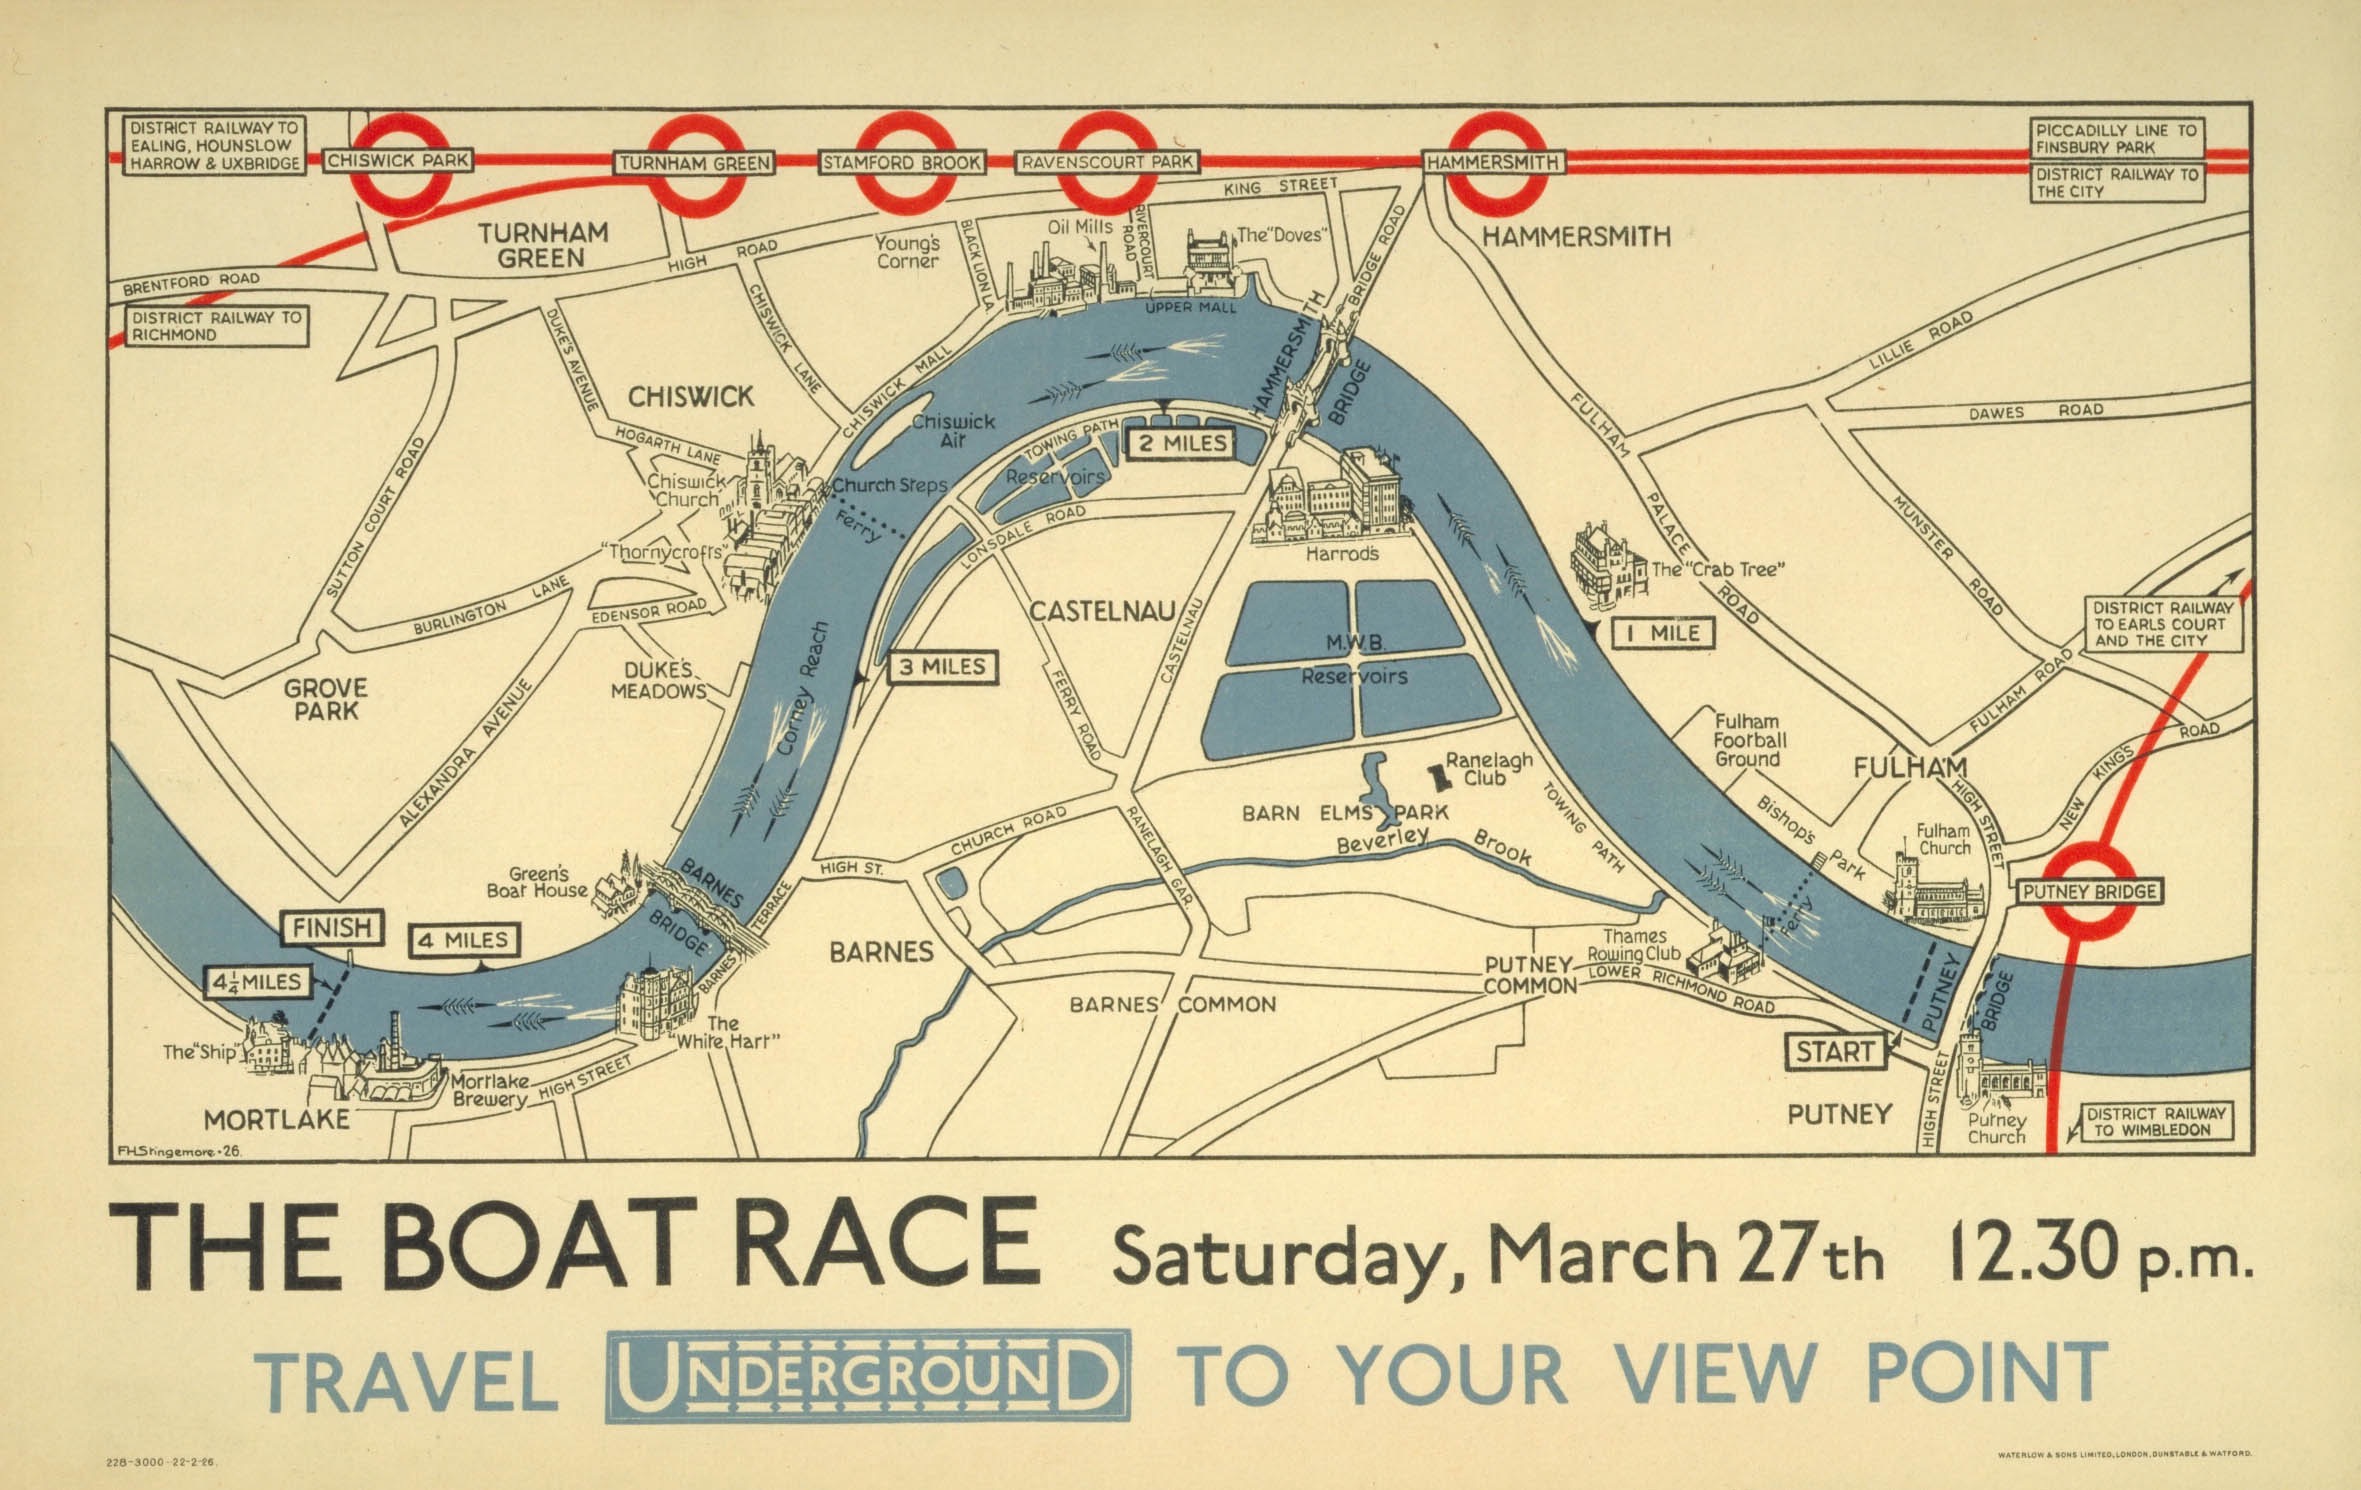


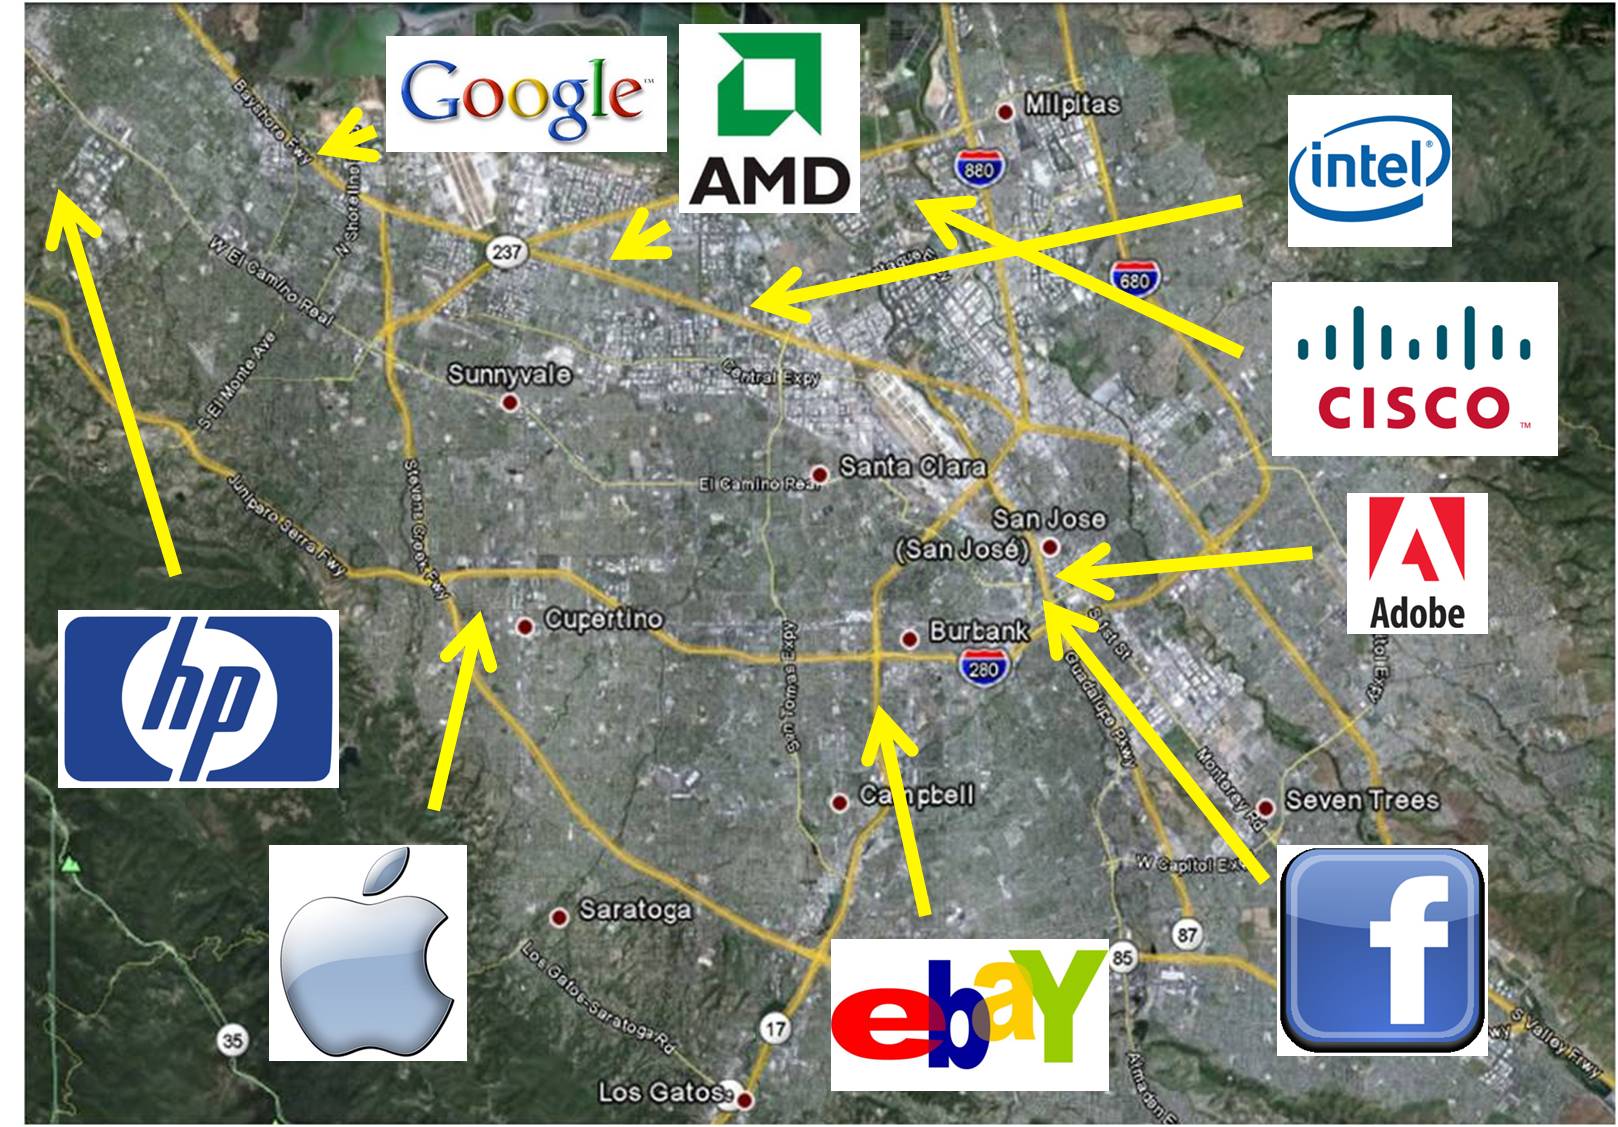