Tag Archives: remote sensing

The Growing Global Landscape of Glacier Loss

With frozen glaciers disappearing into the oceans at an unprecedented rate, the rise of an ecotourism of glacier viewing is hardly unexpected. The new heights of glacial melt that are feared for much of the arctic this summer–even if the disappearance of sea-ice predicted by late summer won’t be radically different or worse from previous years–suggest cause for environmental alarm as monumental as the burning of dry forests that spew smoke across the nation. The arctic sublime is, perhaps, more deeply rooted in our imagination, as the fascination of the edges and margins of the arctic as a timeless region and place. The contraction of those margins by melting glaciers suggests that our notion of acclimating to a wandering pole seems more time-stamped, in the mode of current maps, than timeless, a warping as well as a melting of time and space.

The disappearing glaciers map conflicts between two logics–a globalized world of smooth surfaces of the Anthropocene, and image of a timeless arctic wild, whose purity is frozen and lies preserved just beyond our reach. The blurred boundary of the Arctic Sea is a consequence of the blurring of boundaries wrought by globalization: warming temperatures that have been created by escalating emissions of carbon and other greenhouse gasses are creating an age of global melting–and glacial melting–where icebergs are fewer and harder to see, and the sea-ice in the former Arctic Ocean is far less likely to strand ships. The erosion of an edge of the Arctic circle, already nudged north at a rate of just under fifteen meters a year beyond  66.6° N, is mapped in anticipation of arctic melting, a surface of pristine blue bound by a line–despite questions of the margins of thawing permafrost, meltwater flow, ice-thinning or of sea-ice. Drawing a clear line for the Arctic Circle is the vestigial inheritance of print cartography, whose conceptual authority hinders us from mapping the critical margins in which glacial meltwater moves into the northern oceans and warming northern seas.

The shrinking mass of the patchwork of glaciers, mapped in part by satellite, reveal rates of disintegration more rapid rates than the ice-sheet of Greenland, in the new millennium, marked by accelerated reduction of mass, of hydrologic consequences that demand local observation. After twenty-five consecutive years of sea-ice los, late season warming created melt conditions for over a third of Greenland’s ice sheet, revealing the new face of global warming of spreading icemelt–as well as surface melt on 36% of the ice-sheet, surface melt at its highest altitudes were fed by surface air temperatures the sixth warmest since 1900. After sustained sense of limited loss of glacial mass in previous decades, among small glaciers over three decades 1961-90, even given the difficulties of accurately mapping time-series for glacier mass before satellite observations, increase loss of ice mass set off alarms. The far lower mass lost by glaciers sharply contrasts to current levels of ice-melt and widespread glacier loss, here alarmingly noted by a cautionary color ramp of orange-red.
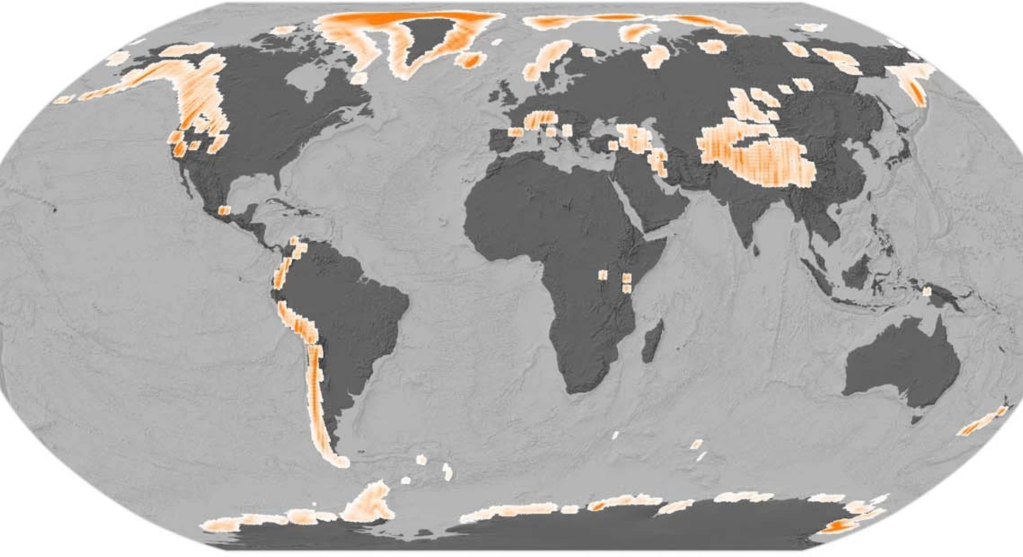
Accelerated Global Glacier Mass Loss in the Early Twenty-First Century/Hugonnet, in Nature (2021)

To be sure, the increased interest in preserving a recording of the arctic’s vital signs–the changing soundscape of ice crackling under ships, and glacial waterflow, seek to register the vitality of the glacial landscape to bring the arctic regions to greater prominence, relating to the new scale of anthropogenic disturbance able to be sensed by their own “vital signs”: the Arctic Report Card issued annually by the U.S. National Oceanic and Aeronautic Administration since 2006 offers a rich database virtually accessible of the disturbances of the global arctic,–although the report of 2018 predicted the entrance of the arctic into “uncharted territory” as a lead research scientist of NOAA warned, with an irony firmly based on new data of surface-air temperatures, sea ice decline, wildlife mortality to erosion to ice-melt that had previously long been difficult to access. If we feel the weird weather systems as a local deviation, more than a consequence of arctic melting, they may remind us how rooted our sense of place is in the frozen remoteness of the upper north, whose icepack reflects more than absorbs solar temperatures–as melting stands to end the idea of a frozen timeless purity, as the survival of sea ice more than a few years precipitously declined, even if some fraction of the Arctic Ocean seem to still remain frozen year-round.

How can we chart these uncharted territories in maps, or can we develop the tools for a conjectural cartography as sufficiently orienting even while we face the prospect of a migration of due north–a change as radically unsteadying for mappers as removing the carpet from beneath our feet? The long-term movement of magnetic North toward Siberian islands is indeed on an uncertain course–

–shifting from Thoreau’s time to the Siberian shores, making us rethink arctic margins, and indeed the stability we were long accustomed to associate with magnetic north, a motion partly tied to melting, and which makes us take stock of glacial health, whose vitality has less to do with warmth.

Conceptual artists as Julian Charrière, whose Swiss origins have perhaps left him particularly sensitive to Alpine landscapes and glaciers, have made it an artistic mission to preserve the fragility of ice fields, sea ice, and underseas sounds of the new Arctic, offering a sense-based record of melting in images able to act as repositories of a new visual relation to a fast-melting world in collaboration with scientific explorers of the reduced levels of sea ice and growing glacial melt.

Julien Charrière, Towards No Earthly Pole, 2019 in Erratic (SFMOMA)

The arctic landscape is also made more alive by the sounds of arctic landscapes, all too easily black-boxed from our world in a denial of climate change. The sounds of glacial calving that are so resonant with the catastrophic consequences of polar glacial collapse offer a sonic register of a collapsing arctic world; the multiplication of YouTube videos of glacial calving seem a yearning to make more concrete the awesome spectacle of glacial collapse. Attempts to extract ice cores from glaciers to preserve the evidence of climactic history before it melts has also inspired attempts to record the interior sounds of glacial vitality in sound recordings of the snapping, crackling, and crevassing as evidence of glacial vitality not from the margins but center of the arctic landscape that remains–somewhat akin to how bioacousticians recorded Humpback Whales circa 1970 to preserve vocalizations as ecological affirmations of balene humanism, revealing sonic expressive sequencing and improvisation never before heard by an innovative “hydrophone” in a nature recording so famous to grow consciousness for a global moratorium on whale hunting.

But if the perception of the aesthetic beauty of whale calls were background music for mindfulness, the melting margins of the Arctic are rarely mapped they demand–or mapped at all, as they are so reduced.

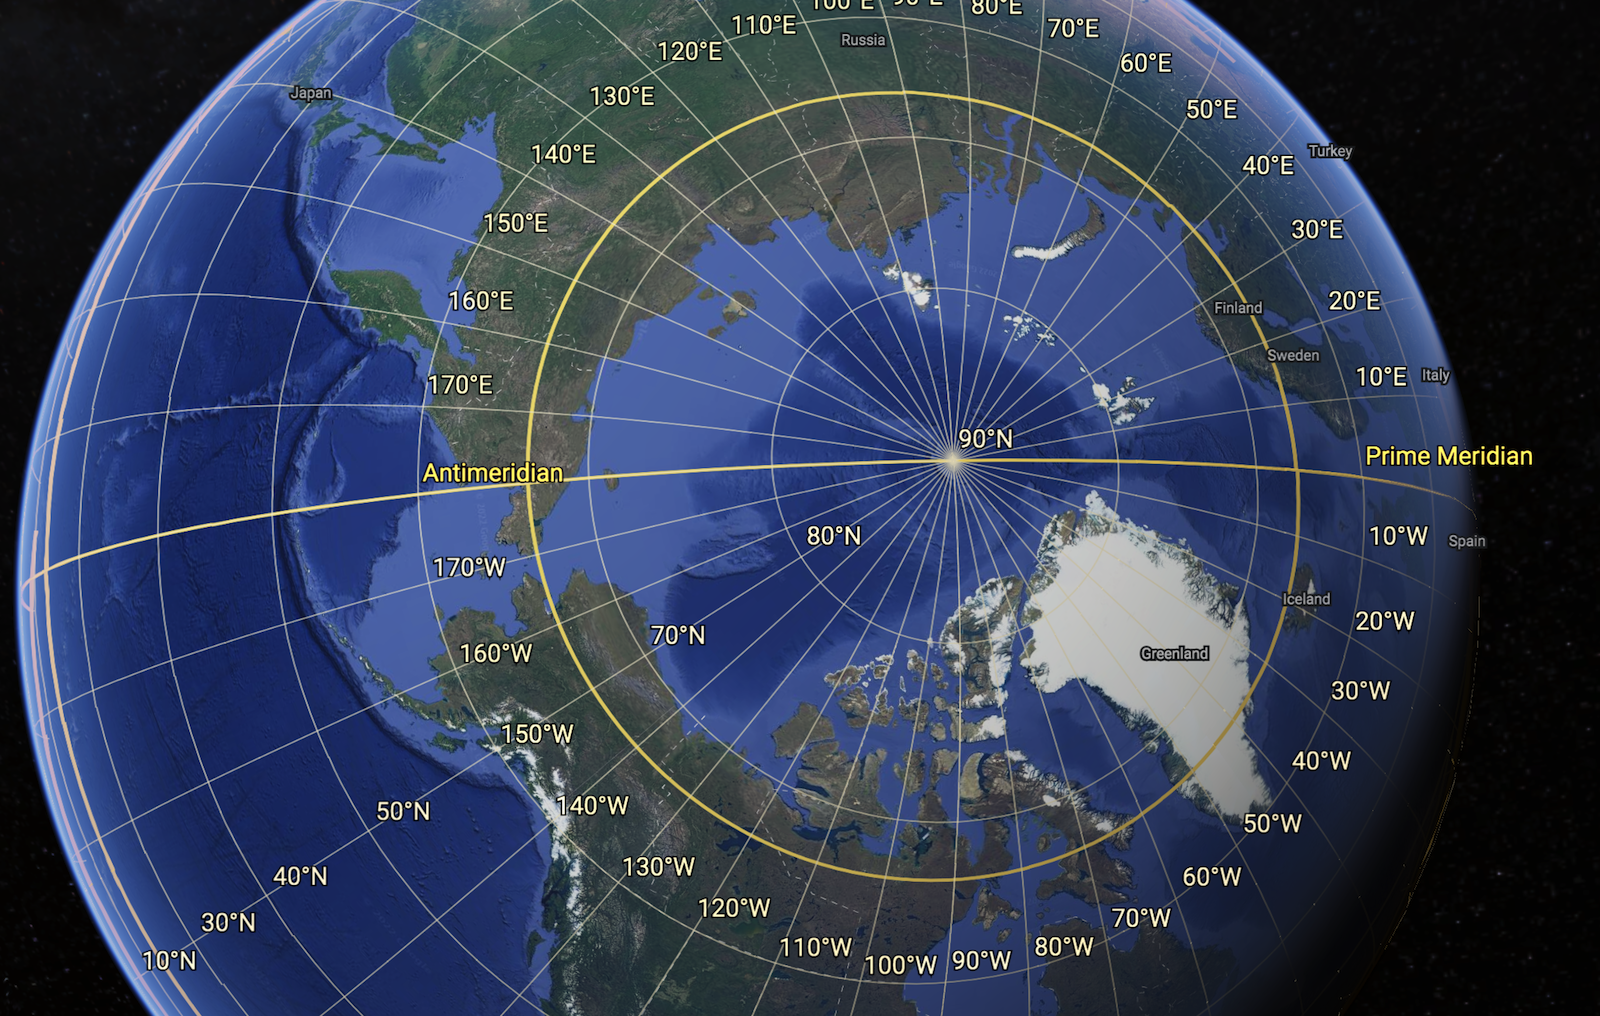
The arctic circle above alaska

Global warming stands to erase the arctic as an extreme frontier, and to change the flow of sea temperatures in ways that will dramatically accelerate sea-level rise. The archetypal romantic Arctic explorer, Robert Walton, marveled at the “beauty and delight” of desolate frozen fields, even as his blood froze in his veins on the Greenland whaling ship he commandeered to reach the North Pole. , marveled at its “beauty and delight.”

Only as Walton’s whaling ship is trapped by floating ice and cannot move did his arctic reveries conclude; before the ice breaks and frees the ship, he spied Victor Frankenstein, the sled on which he pursued the monster who had perhaps duped Frankenstein to follow him to the North Pole, impervious to temperatures his creator could not survive. The novel inspired by ghost stories may invite us to track the monster from a ship that lay at the edges of sea-ice in the Arctic Ocean–

Walton’s Course and the Edge of Average Arctic Ice Edge from March through August in Nordic Sea/ ACSYS Historical Ice Chart Archive, Boulder CO, Frankenstein Atlas by Jason M Kelly

–she was informed by the frustration of numerous polar voyages sponsored by the British Admiralty to the North Pole that were stopped by ice sheets and icebergs beyond the Barents Sea. Mary Shelley seems to have mapped a desolate arctic landscape to conclude Frankenstein’s search for forbidden knowledge, perhaps as she revised the manuscript with grading contributions from Percy in England, and access to the records of the Admiralty. The arctic setting became the fatal conclusion for the “Modern Prometheus,” before the backstory of Frankenstein raising ghosts by alchemical incantations send him to fuse Paracelsianism and natural science that would long haunt histories of science. The very setting of Alpine glaciers where Shelley conceived the story found their conclusion in the arctic, both haunted by accelerated glacier loss. The register of glacial melt is a current register of the Anthropocene, whose own Promethean character is only just beginning to be understood. The northern arctic margins where Frankenstein and Walton crossed paths was still continued to be charted through the mid-nineteenth century, the Polar Sea resistant to staking territorial claims as solid land, the sea-ice unable to be mapped within northern polar seas–

British Admiralty Chart of North Polar Sea (1855, rev 1874) noting Coasts British Explorers Discovered pre-1800 (Dark Blue) and post-1800 (Brown); noting coasts explored by Americans, Germans, Swedes and Austrians 1859-74 in Red Ink

–in ways that we are currently coming to terms with as a mapping of ice-melt and sea-ice melting, in a horror story of its own that has transcended territorial claims.

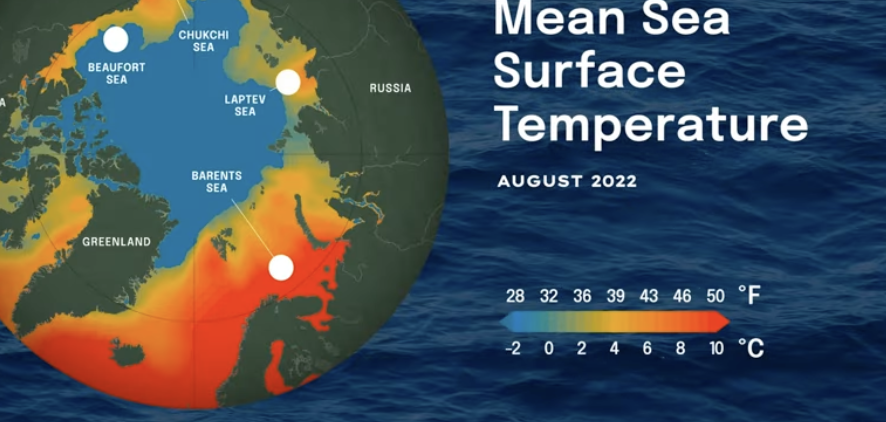
The current landscape of arctic melting frustrates bounding the arctic by a simple line. Rather, we are challenged to map the rates of glacial retreat and the melting of ice sheets, that stand to erode the sense of the Arctic as a fixed frontier, whose margins are remapped as remote sensing provides data of the increasing rates of melting. While icy breezes refreshed Walton’s senses as he passed to the Arctic, if not overwhelming him with the vision of filling long-nurtured hopes of sea-faring at the edges of a geographic extremity, we lack map signs adequate to register fears of polar melting in our warming world. Niko Kommenda’s 2021 visualization in the header to this post of the increased rates at which global glaciers melt bravely tries to sound the alarm. The schematic projection captures the terror of the impending glacial melting, a flattening of the polar surfaces of the globe, where trans-arctic commercial pathways are finally being imagined and plotted, two hundred years after seeking in vain for a northwest passage across Arctic Seas.

By 2016, as the ice had already retreated from the pole,  nine hundred passengers had signed up for spots on a luxury cruise liner, the Crystal Serenity, to sail through the sudden access that low sea ice offered to the lost geographic imaginary of the Northwest Passage, a sea route around the top of North America that had become open to commercial ships, and has since become a route of commercial yachting, if it was only first crossed in 1906 if attempted long earlier. While once passing some 36,000 ice-bound islands, some seven routes have opened for ships today, and innumerable routes by yacht, stopping at the site of the unfortunate 18445 Franklin expedition and recent polar catastrophes,

Jason van Bruggen/Boat Iternational

as well as some pretty spectacular vies of calving glaciers, but demand constant navigation of the shifting sea-ice and floating glaciers by yachtsmen, and super yachts able to cross sea ice who often retrace the popular “Amundsen route” first made in 1906, when sea-ice retreat allows navigation.
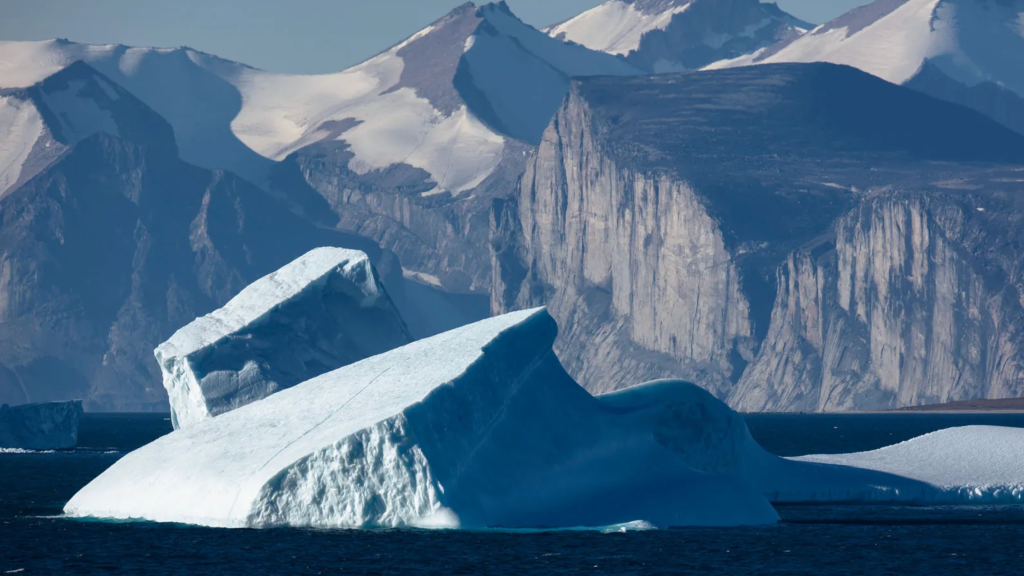
Entry to the Northwest Passage in 2022/Jason van Bruggen

As we anticipate the ice-free arctic, we will brace for a shifting global axis, potentially upsetting our mapping tools, and a rapid rise in global sea-level, if the melting rate of sea ice proceeds at currently revised rates. As the shifts in global mass distribution due to the melting of glaciers and polar ice-sheet seem to have progressed to throw earth off its axis, we are increasingly disoriented not only by raging fires, or torrential rain, but by ice-melt–the sea ice of the arctic is predicted to melt by the summer of 2030, polar archipelagos melting two decades earlier than once projected, when 2050 was projected as a watershed for an ice-free Arctic Ocean, even in low-emissions scenarios. (Observed sea-ice area in the arctic dramatically plunged 1980-2020, but even in the face of such authoritative models, it is difficult to imagine the disappearing act to conclude.)

Although global mapping companies are beset with worries at the possibilities of a wandering and irregularly migrating or wobbly north pole, as extreme melting has sent the arctic regions and magnetic north into uncharted waters, we rightly worry we are headed not only into an era of submerged landscapes, but unstable relation to old orienting points. The “post-glacier” era not only has started to shift stability of the earth’s axis, on account of the readjustment of mass melting of the polar ice-sheet and global glaciers have already caused in the new millennium, but may well be tilting our bearings and sense of being in the world. The unsteady migration of the North Pole in the new millennium is a deep unsteadying, warping our sense of mapping and being in the world, whose strange behavior has accelerated since the nineteenth century in unsteadying ways, moving from Canada toward Russia in a weird consequence of globalized economies that may be accelerating its motion and force necessary geodetic adjustments to our GPS. If the geodetic maps that Henry David Thoreau devised for Walden Pond were seen by some readers as a comic send-up of the mapping of national waters of the U.S. Coastal Survey, magnetic north offered a framework for transcendentalism for Thoreau to map Walden Pond and the adjacent lake country,–tangible and quantitative even if it diverged from the compass, an accurate frame of reference for surveying and an ethical framework and way of life to liberated from social constraints, a firm foundation to a imagine a more ethical world, firmer than the sailors who vainly sought to arrive at the polar cap.

4. The nineteenth-century American explorer Elisha Kent Kane’s accounts of arctic icebergs that had trapped the search vessel on which he was surgeon soon became a media sensation of sorts in the mid-nineteenth century. Indicating the global lines of the arctic that Kane courted vicariously for his audiences in newspaper articles, public speeches, and indeed the watercolors and drawings he displayed on the lecture circuit and Philadelphia’s American Philosophical Society, of which his father served as secretary from 1828-48, seems to have engaged the nation’s attention to the arctic in ways that appear destined to parallel the upcoming attention to the glacial retreat by which the quite sudden melting of long-frozen polar ice merits action in an age of global warming. Despite a growth of climate expertise, we are painfully without guides to the disappearance of glacial markers and glacial melt that has already changed the axis on which the earth spins.

It is disturbing to find a landscape once seen as timeless to be mapped as time-stamped. Can the awe of the arctic landscape still hold awe? Elisha Kent Kane’s audacious account of first-hand contact with the Humboldt Glacier–now the Sermersuaq Glacier–off of Greenland, while now forgotten, was so vivid Henry David Thoreau even felt jealousy, as he doubted polar explorers like Grinell, for all their public celebration, had ever needed to travel to Greenland’s coast. (Thoreau echoed Ralph Waldo Emerson’s doubts in “Self-Reliance” about the value of currents fad for travel abroad, calling the rage for visiting Rome or Greece less a real destination than “a fool’s paradise” that follows from neglect of one’s own backyard: “the soul is no traveller, the wise man stays home;” the rage for ravel as an amusement only leads only to travel away from one’s true self.) The conflict or the terrain for conflict had perhaps been mapped: among the personal papers of the doctor served as senior medical officer in a polar expedition, Bones McCoy to Grinnell’s more elegant Capt. Kirk, except that Kane was chosen to head the attempted polar expedition that followed recent maps of the open polar sea, imagining they might find a northwest passage, before they were trapped by sea ice, and forced to abandon their ship for a long trek south, subsisting in the wild on walruses and having dressed in animal skins amidst the frozen landscape of towering icy peak.
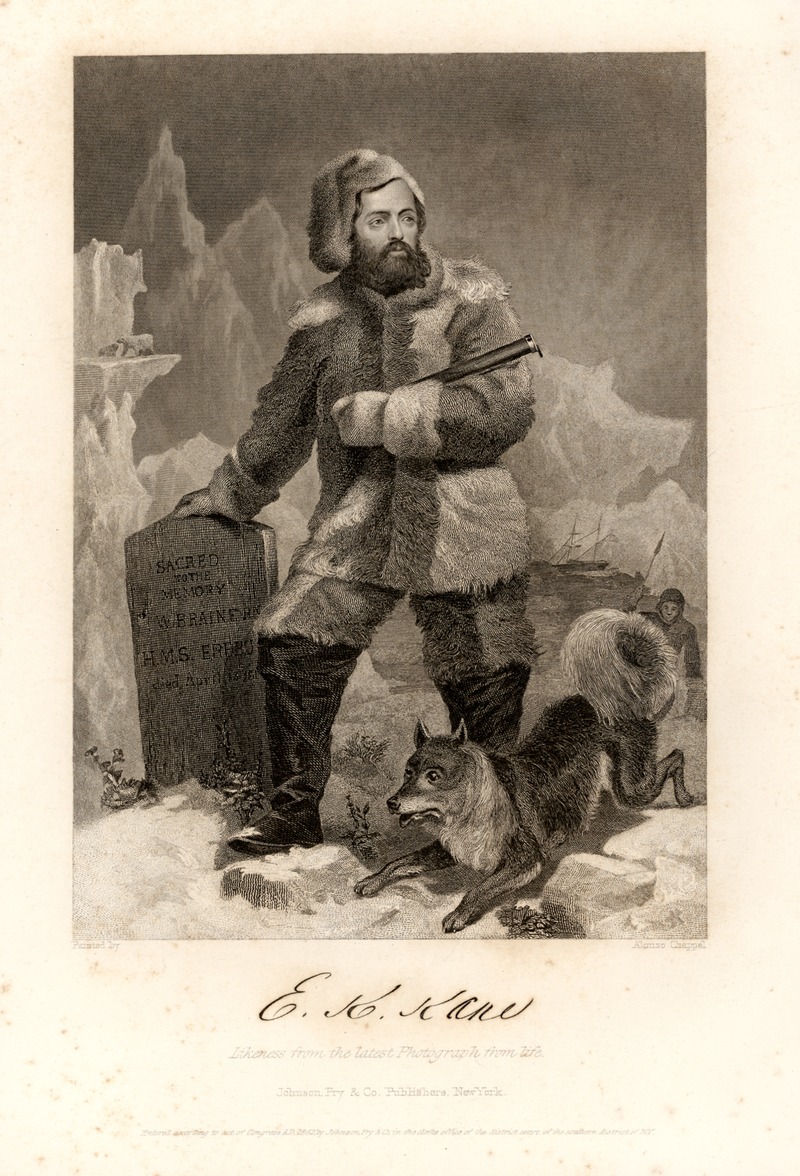
Kane

The U.S. Grinnell Expedition in Search of Sir John Franklin: A Personal Narrative (1853) 

Kent Kane had fronted the wild as a scientist-explorer published in a personal narrative of 1853, a year before Thoreau’s condensed narrative of the twenty-six months spent at Walden Pond, based on lectures that had made good on many newspaper accounts he had filed while at sea. In his escape narrative of the arctic, the surgeon rejected scientific jargon to evoke the terror of arctic landscapes of an uninhabited wild. He rendered its uncanny spectacle by watercolors to capture his fronting of the uncanny unknown arctic wilds that escaped the impoverished dimensions even of architectural panorama, placing adiences in a harrowing story barely avoiding shipwreck on massive icebergs that threatened the vessel in arctic seas where the compass itself froze as a romance of confronting the nature of a frozen north, as if the snowy lands were uninhabited, as a Robinson Crusoe of the northern hemisphere, in a melodrama against magnified elements.

Ship Wrecked on an iceberg, from Elisha Kent Kane, Arctic Explorations in the Years 1853, 1854, 1855

Emerson’s maxim about the vanity of travel is often cited proverbially, perhaps imbued with new tones in an age of globalization, apart from the Sage of Concord proviso about the pleasures of solitude that “Our minds travel when our bodies are forced to stay at home.” The range of remote observation that we are able to access about the arctic this warming summer–and warming summers previous–are cause for alarm, as the number of glaciers have declined rather precipitously in recent decades, as the oceans have warmed, and their melting across the northern hemisphere have contributed and stand to contribute more to the rising of sea-level, as well as exhausting one of the largest storehouses of freshwater in frozen form.

Whether or not the heroes of arctic exploration never fully explored their own back yards with due diligence or not, Thoreau framed a prospective from Walden on the world, as he cultivated his perceptual abilities–refining his own study of the local landscape and its morphological characteristics. To be sure, Thoreau appreciated his own backyard as a source of rich meditation informed by his avid reading of Darwin’s discussion of Patagonia, Rev. William Gilpin’s accounts of the depth of Scottish coasts and Lochs, as well as Kane’s spectacular accounts of his approach of Greenland’s glacier, to view icebergs calving from its coast at first hand. The edge of Walden Pond emerged something of a standard by which he was to judge them all, and for each natural history text (from Lyellian geography to historical bird migrations pioneered by Gilbert Whyte’s Selbourne) to measure Walden Pond against. They offered a basis for Thoreau’s mind to travel, while he was rooted on the banks of Walden Pond, and even to imagine, the actual engineering of Walden Pond and the ponds of Sudbury Plain as excavated by glacial retreat, long before the “Hyperborean” workmen (Irish day laborers) came to export its precious if undervalued ice for a global market.

Kane’s sensational voyages to the arctic had made him an American hero, against whose narrative of an arctic picturesque narrative or so, Thoreau might well have sought to define himself against, but in the past sixty years, Thoreau has remained the model of local observation. Recently, as one tries to process the extent of global warming, remote sensing gives some strength to Thoreau’s point–and Emerson’s–given the possibility of considering the world from one place, without braving the elements to risk being trapped by sea-ice and ice floes of the arctic north in the rather sensational manner of Elish Kent Kane, heroized in his time as a public speaker, American hero, and arctic explorer, before Thoreau began to gain popularity on the lecture circuit in Massachusetts. He was a bit of a competitor, and arrived in Boston with the huge drawings he had made of arctic icebergs that his ship had encountered and seen at first hand as an actual arctic sublime.

Arctic Glacier, Melville Bay from US Grinnell Expedition in Search of Sir John Franklin Grinnell (1853)/ American Philosophical Society Library

Thoreau famously prized Walden Pond as a site of purity from which to apply himself to watching the world, perhaps recuperated in the enthusiasm for viewing glaciers today in an era of ever-decreasing contact with the wild, the uneasiness of watching the retreating remaining glaciers in the warming waters of the northern seas is more than tinged with a sense of melancholy, capturing the sight of the few remaining glaciers and icebergs, and summoning what is let of Thoreau’s deep admiration of the wild. Thoreau would indeed be shocked at a shifting North Pole as a surveyor who, Patrick Chura has shown, prided himself on determining magnetic North by a “true meridian” if modest in many ways: accessing the “true meridian” was a more elevated sense of moral purpose and direction, as he navigated at night-time by the North Star that escaped slaves followed to secure their freedom. Thoreau was proud of his exactitude and precision as a surveyor of farms and of the woodlots around Walden Pond, mapped “so extensively and minutely that I now see it mapepd in my mind’s eye,” he wrote in 1858, to plot his motion across lots’ property lines,–as if the exactness of magnetic north was warranted to navigate the woods accurately.

Thoreau prized the ability to detect the undisturbed wilds of America just outside of Concord, Massachusetts, and in his own back yard, cultivating his perceptions of the wilds of the continent that still survived even in the age of the railroad and outdoor lighting, the timeless glaciers–or seemingly timeless iceberg–offer one of the last sites of the wild, a fast disappearing margin of nature, in a warming world and a world of warming oceans. Now, rather than haunted by icebergs, we are more likely to be threatened by prospects of glacial retreat. In an increasingly warming haunted by polar melting and glacial retreat, twenty-eight trillion tons of global ice melted between 1994 and 2017, raising the prospect of melting of the 70% of the earth’s freshwater stored in permafrost, ice-sheets, glaciers, and ice caps. Remote sensing led NASA to say almost elegiacally, “goodbye, glaciers” in 2012, finding almost 60% of ice loss melting in the northern hemisphere, and much in the Americas, northern Canada having lost 67 billion tons of ice in the previous seven years, southern Alaska 46 billion tons, and Patagonia 23 billion tons. The skills of engineering by which Thoreau, who built his own house in rusticated style, recovering the shingles from an Irish worker as Romans might reuse pieces of ancient buildings, fancied the environmental engineering feats by which glacial retreat had sculpted the ponds he boated, swam, drank, and skated in winter. If Kane had been inspired on his expedition by maps of an ice-free open arctic sea, we have trouble not standing in fear of the prospect.

Augustus Heinrich Peterman, 1852

At the same time as Kane set sail in search of Grinnelle, or 1855, Peterman combined the arctic panorama with intense cartographic scrutiny of the islands and icebergs of the frozen landscape, trying to preserve a navigable open arctic, combining art and cartography to tempt travelers to the prospect of Humboltdian voyages to the many islands and archipelagos of a partly frozen north.

Peterman, Karte des Arktischen Archipel’s der Parry Inseln, 1855

1. The scale of global melting is the negative image of globalization, haunted by a hidden story of dizzyingly increasing global icemelt and global melting. As increasingly warmer waters enter the arctic regions it melts more sea ice, allowing more sunlight to enter the arctic ocean, whose contracting margins trigger a feedback loop as more icemelt reduces the margins of arctic sea ice whose effects we are hardly able to process, let alone to confront.

T. Slater et al, (2021), Copernicus

Indeed, we are haunted by the image of glacial melting far more than we might imagine, and wherever we live. For the mapping of glacial melting–suggested by the data vis heading this post–is best understood as something of a negative map, as well as a map of tragic if not irreversable loss. It is a map that we will not need to travel far to see–per NASA, which has been monitoring glacial loss and ice sheets’ weight since 2002, the prospect of all glaciers and ice sheets melting would provoke sea level-rise over sixty meters or 195 feet. The message of the remote sensing GRACE satellites provided from 2002 to 2017, and GRACE-Follow On satellites after 2018, have yet to hit home, Emerson might say, perhaps as even accurate monitoring is only offering provocation to assess the shrinking margins of the arctic on the ensuing loss of habitat, warming ocean currents, that send ever less cold water to the deep ocean to trigger upwellings of nutrients, and indeed land erosion that rising sea-level can provoke.

Despite its persuasive power, this map remains largely negative, as it tracks ice loss, without the more terrifying consequences of a greater degree of icemelt, with significant consequences downstream. We imagine glaciers as if they had edges, but the margins of ice melt are an image globalization and the only recently conceivable prospect of the margins of arctic melting The arctic must be understood by its margin, not a line, whose changing margins–seasonal margins, margins of melting, and margins of glacial coasts–shown as ‘dripping’ in the header to this post, a projection revealing how much the loss of ice due to global warming has accelerated in the north.

Faced with the burgeoning data of 267 gigatonnes of ice-melt as glaciers and ice caps recede, Niko Kommenda hoped to process remote sensing by statistical data profiles to render the loss of ice at specific as a sequence of spikes at fixed transects. Kommenda long considered possibilities of visualizing glacial melt as a visual projects editor at the Guardian, but the prospect of a recent doubling of rates of ice-melt over the previous two years suggested a need to illustrate the rising rate of flow as a massive shift in the calculus of water flow into global oceans. Recalling the use of spiking red to render rates of mortality of COVID-19 in American cities, if with a downward flow, he mapped a synoptic data vis of global annual change in ice mass. The global continents drip red, in a gripping distribution of the image of ice-loss that almost recall a geo-referenced remix of the classic Sherwin Williams logo, but of a world whose northern hemisphere was dripping with melting ice, as the small rise of several light blue spots suggest rises in ice mass mostly confined to high altitudes.

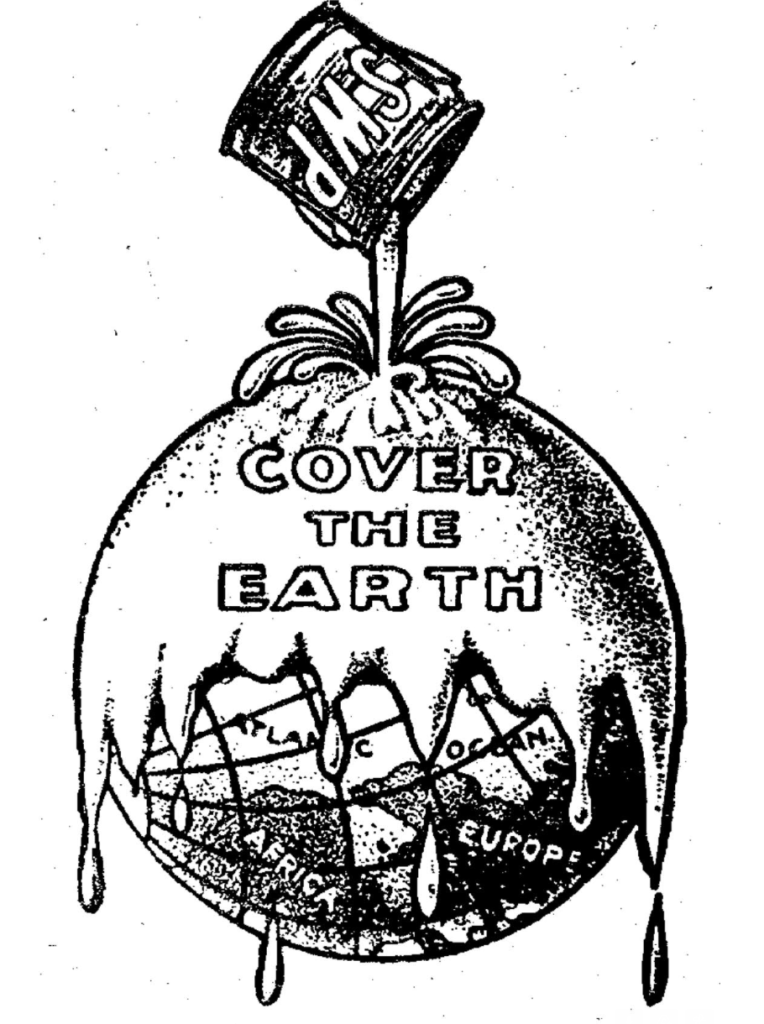
The map evokes geodetic take on the familiar Sherwin Williams globalism, repurposing the promise to “cover the earth”: in a projection akin to a transverse Mercator project like WGS84, flattens the earth to a single legible surface, haunted by the specter of nearly inevitable sea-level rise.

Drop Cloths & Plastic Sheeting - Sherwin-Williams

Henry Sherwin’s logo was, when it appeared after World War I, in 1919, a rebus signifying the victory of American capitalism and enterprise as it expanded to markets to a European theater, across the Atlantic Ocean, in an iconic image of free enterprise that new no national frontiers–

Cover the Earth indeed! The bold totality of Kommenda’s graphic suggests a bold distillation of international mapping tools, a drip drip drip that is almost unstoppable: rising rates of flow from the melting of global glaciers had doubled form the start of the new millennium, sounding an alarm after the first comprehensive studies of ice rivers revealed at high latitudes more meltwater leeched than the ice sheets of Greenland or Antarctica,–putting glacial thinning into prominence as a result of NASA satellite data. Remote sensing may have revealed one of the greatest historical catastrophes of losses of ice in human history, prompted Kommenda to tote up a compelling balance sheet of losses of frozen mass to embody the alarm glaciologist Romain Hugonnet sounded. The work of Kommenda’s mapping continued, as he focussed on the outlines of glaciers and glacial complexes–“The more accurately we can map glacier outlines, the better we can track their melting due to climate change,” Ann Windnagel of the National Snow and Ice Data Center, who has been trying to track the recent reduction of glacial complexes in the Arctic, Iceland, Alaska, Scandinavia, Antarctica, and Central Asia, as well as the Southern Andes, in a global assessment of glacial health–ranking the glaciers’ size and footprints as a long-lasting, enduring flowing mass of ice. To describe the “footprint” of a mobile form may be an unhelpful mixed metaphor, but the inventory of glacial size can map glacial health in relation to glacial fluctuations, ice shelves, ice tongues, ice thickness and ocean temperature, given considerable contribution of glacial melt to sea-level rise–often able to be compared with over 25,000 digitized photographs of glaciers, dating back to the mid-19th century, as a graphic historical reference for glacier extent. By tracking ice bodies and glacial complexes over time, snapshots help appreciate the extent of complexes in different regions.

The awareness of just how much glacial mass had been lost by warming became evident as it set the earth’s axis wobbling off due North in ways that may upset the geodesy on which the global grids we rely in satellite-based mapping rely. The hope to mirror the deep urgency Hugonnet felt to make the remote glaciers more immediate in a multiscalar global water cycle, able to encompass the considerable risks of huge downstream changes in regional hydrology, a fact that Hugonnet appreciates as a long-term resident of the Alps–the fastest melting glaciers offer a microcosm or test case able to contemplate the consequences of a global phenomenon of glacial melting–also known as glacial disintegration, as the over 200,000 global glaciers and glacial complexes have begun quite radically to reduce in their mass and size–releasing a considerable chunk of the world’s freshwater reserves to global oceans.

Although Alpine glaciers are far less thick than their polar counterparts, they risk to by 2050 in current warming scenarios to loose 80-90% of their mass, altering downstream ecosystems by starving them of water, even if not flowing into the open sea. The starving of landscapes from freshwater sources is striking; glacier outlines allow mapping shrinking glacial margins in many regions, including mapping glacier devolution in Alpine areas by a combination of optical imagery and LiDar, as well as old arial photographs, to help to take stock of the loss of about 30% of the volume of forty-eight glaciers in the Austrian Silvretta in Tirol, revealing a rapid recession of glaciers the recent emergency of formerly ice-covered rock face, after gradual glacial retreat, suggesting the loss of a massive repository of frozen freshwater. Zurich’s World Glacier Monitoring Service (WGMS) has already detected a doubling of losses of glacial mass each decade since the 1970s; but the picture of losses at high latitudes and high altitudes needs to be made concrete for those living on near the coasts–despite the North Atlantic anomaly of decelerated mass loss.

Glacial Retreat in Tirol by Digital Elevation Models from 2017 (Black Boundary Lines)

We may lack commensurate memory or metaphors to describe the disastrous consequences of the disappearance of glacial mass, it never having occurred in human history–and any prospect of the growth of glaciers remain quite remote, and if folks continue to feel that “the science is still out on global warming,” the multiple impacts of global thawing will be far more less able to be visualized–or the species that will survive the different possible future scenarios of catastrophic climate change. The scenarios that have been lambasted and demeaned as “theories” but the record-low sea-ice places the survival of glaciers in Antarctica and Greenland that are surrounded by bodies of water at extreme risk of accelerated rates of disintegration that may advance to general collapse by 2050–the record lows of winter sea-ice in Antarctica this June 2023, over a million sq km below the previous record low set just the previous year.

We prefer to view the arctic with awe, and at a move. Or are climactic analogies bound to catch up with us, in inescapable ways?

The current burgeoning riverflow as snowpack melts in California, but may well exemplify the potentially catastrophic effects of raging river water throughout the Central Valley. Increased riverflow from the Sierras have not only rendered rivers dangers, but changed habitat, submerging vegetation and prompting fears of erosion on narrowed riverbanks–and indeed the overwhelming of the drainage systems of the state. The changing calculus of icemelt from the Sierras after a boom year of rainfall and snow said to have ended a multi-year drought will challenge the coastal habitats of the state’s rivers, as well as endangering swimmers: surging rivers stand to submerge older habitats, and suggest the need for more local studies of ecosystems and habitat in the face of increasing glacial ice-melt. The stressors are unknown if unimaginable; icebergs suggested to be linked to awe and abundance and timeless abundance, as much as fragility. Alaskan wild lands, coastal ecosystems in Greenland, the Arctic, Labrador and Newfoundland would be threatened in ways impossible to imagine.
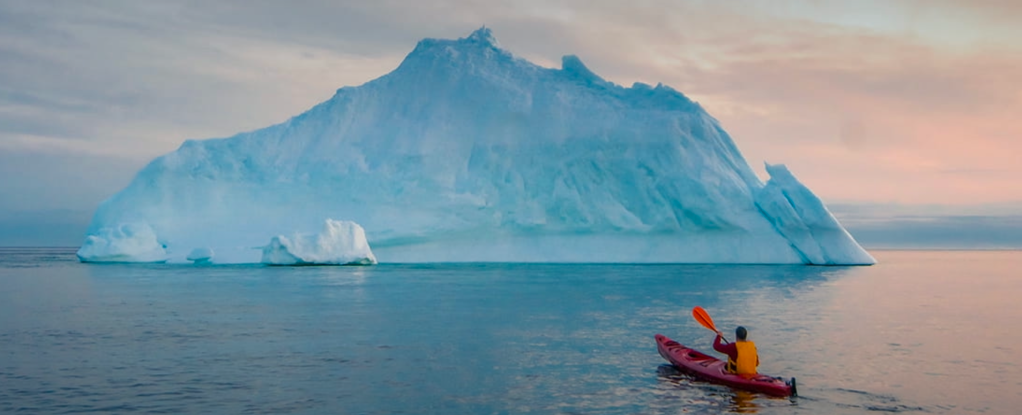
2. The glacial landscape is more acessible to those with the means than ever before, who might well imagine themselves as in a Thoreauvian wild. The expansion of polar melting has created, perhaps paradoxically accelerated, a new sort of ecotourism to search of remaining glaciers of solid blue ice. This seems more of a cross, to be sure, between the expeditions of Kent Kane and for purity channeling Thoreau’s attraction to the wilderness and the wild. Thoreau famously realized the glacial origins of Walden’s kettle morraine and glacial origins of Walden Pond’s purity by a glimpse of appreciation of its deep geological time as he stood by its stony shore. While the memorable image of him seeing himself in the snows of the Winter of 1846-7 preceded his epiphany of the glacial drift across New England, he focussed one spring after the pond froze on the almost animate veins and vessels in the patterns snowmelt created on the sandy banks of Walden Pond, more pronounced beneath the recently built railroad track, as the steep banks revealed “foliaceous heaps” whose interpretation he felt might reveal the secret of life, if not “nature in ‘full blast'” that he had so desired to discover in the wild. As he stood before the sandy banks of the Deep Cut beneath the tracks, as if witnessing ancient treasures uncovered by the construction of subway stops in Rome or Naples, he witnessed secrets of seasonal change and revivification of the vital spirits of Walden Pond in the life of inanimate sand, combining his own passion as a self-styled naturalist and interpreter of global history, in ways akin to the glimpses of calving icebergs, or of the epiphanic blue ice of ice ecotourists witness as they paddle off the northern latitudes in search of ecological grandeur of the wildstill able to be accessed or recouped off Newfoundland’s coast.

Thoreau famously found the most opportune moment for mapping the depth of Walden Pond in the midst of the preceding winter months, in January, 1847 when “snow and ice are thick and solid.” That winter, the arrival of over a hundred Irish laborers excavated ice of Walden for Frederic Tudor, the Boston ice-baron, using saws, ploughs, knives, spades, rakes, and pikes to remove some thousand tons of ice a day–and 10,000 tons in one week–that is often contrasted to Thoreau’s contemplation of the local and the infinite value of the priceless purity of the waters of Walden Pond. Tudor exploited the global circulation of ice packed in sawdust by train and ship that fed a global demand booming in the colonies and plantations for ice future cool drinks and ice cream on a far-flung market, in ways that offers an image of an earlier globalism, based on the growth of markets that failed to grasp the priceless value of Walden’s limpid transparency. But if Tudor and Thoreau are often contrasted, the enterprise by which Emerson was relieved to have the prospect of the “increased value” he might gain from his woodlot in Walden Pond by leasing the rights to harvest its ice to the businessman may well have provided Thoreau with a foil Thoreau detected in how Emerson perceived the “prospect” by which his woodlot by Walden Pond might recoup its cost and gain “increased value” to contrast to the thrift and economy by which he cultivated virtue while living in the woodlot quietly–and indeed fashioning a new sort of exemplary life for himself far from his father’s pencil trade or the commerce of Concord or Harvard’s academic halls.

Few sites of purity remain outside the arctic. But Thoreau discovered a method of sustained local observation of ecosystemic change that the melting of arctic glaciers demand. We risk devaluing how fast-disappearing glaciers feed ecosystems and ocean circulation, at the changed margins of arctic landscapes in an age of ocean warming. Indeed, the extent of expanding icemelt triggers not only feedback loops, but habitat loss, coastal erosion, and changing ocean currents that only local observation can track. If the order of neoliberalism dulled our senses to the disappearance of glacial mass, encouraging an era of denial even as arctic ice thinned, before the melting of 2007 trigered a shift in the thickness of sea ice with less ice remaining in the arctic seas from 2005, undermining the structures of glaciers, we are slowly leaving an era of denial in which maps are able to play an important persuasive role–both to rebut climate denialism and to come to terms with the new margins of the arctic, as arctic borderlands long imagined as permanent are poised to erode: by 2010, Greenland’s coast entered into a thin ice regime definitively, with sea-ice thinning in warming waters over the next decade. By 2019, one of the warmest summers in recorded history, Greenland’s ice sheet was losing some 12.5 billion tons of ice a day in the heat of the summer, in one of the largest events of melting since 2012.

Ice Loss in Greenland, 2013-19

If we have to travel ever further north to experience the timelessness of icebergs–“It’s taken them 10,000 years to get here, but you can discover them in just a click with IcebergFinder.com!”–the latest form of ecotourism seeks to celebrate the contact with a fast-disappearing north, whose “very narrow, very thin margins” have become far more narrow in the face of a warming arctic sea, as the surveyor W.V. Maclean told the pianist Glenn Gould, as we watch the ice floes of Hudson Bay. The stoic surveyor, pulling from his pipe, sought, like a modern Virgil, to summon the scarce abundance of the frozen arctic in ways that maps might ignore, for the CBC documentary Gould produced to show the northern reaches of Canada in a modernistic manner by overlapping audio tracks that commensurate with the “lifelong construction of a state of wonder and serenity” he saw as the role of art. Gathering awe for northern reaches of a nation he saw as generating insufficient awe for many Canadians, Gould clearly channeled his own fascination northward by rail and air, awed by the scarce margins of the northern reaches, the jagged edges of whose the margins of ice, embodied in the pristine barren of ice floes, his documentary reveals as a part of his own conception of art.

Pianist Glen Gould chose as a central subjects of his 1964 CBC Documentary, “The Idea of North,” the cartographer W.V. Maclean, as the surveyor with first-hand expertise of agrarian prospects of northern Canada offered a dry witness to the arctic to invite audiences to the north, far “from the noise of civilization and its discontents,” in an odd use of Freud’s phrase, not as an uncanny, but an the Virgil of unfathomably vast arctic regions entral and on the margins of Canadian identity. The surveyor offered a fitting profundity for the CBC documentary by inviting to reflect on the arctic while hearing a Sibelius symphony, which, despite the thin profit margins, was promoted as a sort of virtue that Canadians had for too long overlooked, daunted by the prospect of extensive rail. despite its thin margins, the arctic was the land of margins, demanding its own poet.

The thinning margins of glaciers and of sea ice are however increasingly hard to convey tranquility. The illusion of the smooth surfaces of global capitalism and markets are perhaps impossible to be reconciled with the jagged edges of arctic ice, or the consequences of the new margins of the arctic, and terrifying realities of the prospect for arctic melting–or global melting, a long neglected component of climate change. If the arctic circle is drifting northward at a rate of 14.5 meters every year, arctic melting accounts for over a third of sea-level rise, and the Antarctic circle shifts south by fifteen meters every year, the warming atmosphere melting long immovable glaciers. Shrinking margins of sea ice have retreated annually, as the Arctic warms four times the rate of the planet, as accelerated Arctic warming in the recent decades–spiking in 1999 and the mid-1980s–suggest that seasonal warming stands to cause massive loss in sea ice that changing arctic margins, and our understandings of the north, challenging earlier simulations and climate modeling.

These are margins that the point-based tools of geospatial technologies are pressed to assess on a local level or “downstream” from the deterioration of the arctic ice-shelf. It is as if we started to loose memories of the past landscape of the north: arctic sea ice has steadily declined since 1979 at the astonishingly rapid rate of 3.5-4.1% per decade. The scarcity of ice in the shifting margins of the north reveals quite different rates of ice melt; warmer waters beside the margins of shores have revealed striking anomalies of ice volume: the levels of sea-ice in May, 2023 were the ninth lowest on record,–considerably below the average of 1979-2022–as the decline of arctic ice elevations, the very age of arctic had precipitously declined by 2016, the “perennial” sea-ice more than two years old now a fraction of what had long been the significant majority of arctic ice.

The consequences felt downstream on local ecosystems, habitat, and coastal health we have yet to map. As impressive as statistical cryosat data on the thickness of ice-sheets across Greenland and arctic regions, we remain fettered by the difficulty of cognitively processing of ice-thickness anomalies, as great as they are, of a pointillistic character–to quote geographer Bill Rankin, whose coining of the term pointillistic cartography may well be steeped in his arctic surveys.

Sea Ice Thickness Anomaly For April 2023, Relative to 1997-2020/CryoSat 2, AWI, v. 2.5I

Only by looking in an iterative, analog fashion at the downstream consequences of habitat and ecological niches can we train our minds to better interpret statistical pixellation of ice-thickness variability, and the consequences of those dark blue pixels that crowd Greenland’s northeastern coast, and much of the Canadian far north on the edges or expanding margins of the once-stable Arctic Circle. Each deep blue dot of a meter and half anomalies in reading the fields of light blue pixels the Interferometric Radar Altimeter notes, where warming waters move north of the arctic circle, driving the rapid rates of ongoing steady shrinking of polar sea ice–and the disappearance of permanent sea ice, to judge by the seasonal retreat of frozen seawater in recent memory from the pole during the past two decades against the 1981-2010 median.

While we isolate this as a northern phenomenon, limited to an “Arctic Sea,” its constitutes nothing less than an undermining of the collective memory of oceans of the flora and fauna who are its residents–perhaps particularly in Alaska and Canada’s north, but also Siberia and Greenland.

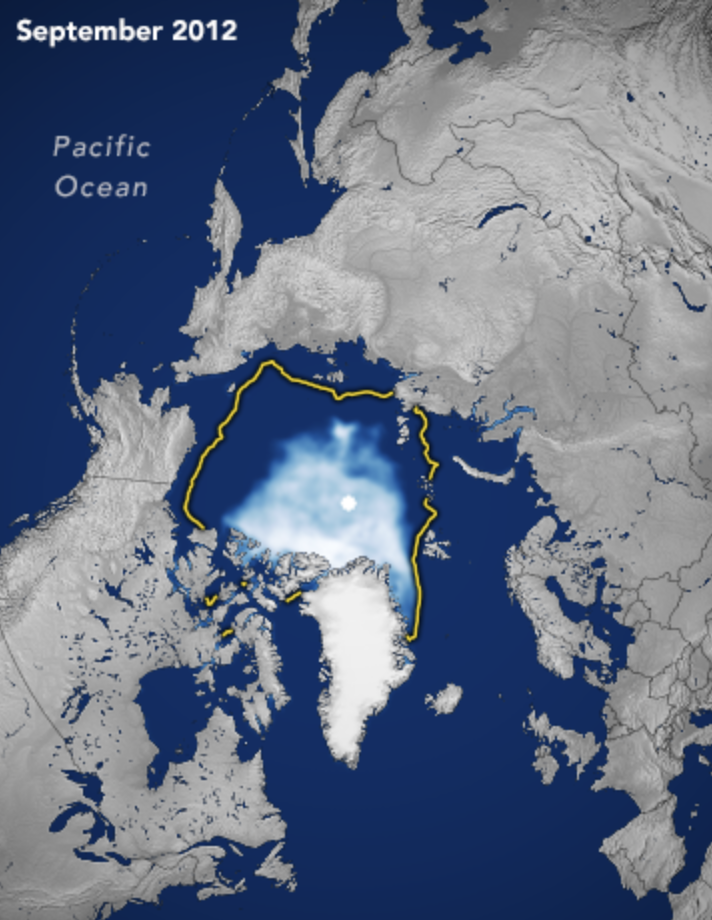
Seasonal Extent of Sea-Ice at North Pole against Median (yellow line), September, 1980-2020/ NASA Earth Observatory

The decline of the age of arctic sea ice is a diminution of arctic memory, and a change in the arctic landscape. It was not anticipated however, in ways that may seem to accelerate the fast-changing nature. Despite longstanding convictions of the immunity of Arctic permafrost to global climate change, as if the coldest areas were somehow immunized or inoculated against thawing.

Yet Google Earth Engine datasets have over the last fourteen years indicated a massive increased in arctic landslides triggered by melted ice in the permafrost during the summer months–“thaw slumps” of long frozen matter able to release potent greenhouse gases as methane emissions in the atmosphere and carbon dioxide in the fastest warming areas of the world of the high Arctic are unable to be stopped–reshaping the arctic landscape in ways that may in time lead to the eventual disintegration of the ice sheet. Glacial melting prompts the growth of coastal landslides created by the collapse of rock glaciers long held together by ice–avalanches and landslides grew in 2014-19 across the warming north, catalyzed or triggered by glacial retreat. In the face of such expansive rewriting of the arctic margins, we risk ignoring the more analog, recursive, local observations of wildlife and habitat that Henry David Thoreau, for one, detected at Walden Pond’s margins, preserving tallies of the dates at which irises, lilies and blueberries bloomed around Walden Pond, allowed Charles Davis and Richard Primack to understand and indeed measure the climate change by howh warming’s shifted the dates of flowering of irises and lilie–giving new sense to Thoreau’s stay at Walden as an experiment,–beyond as one of living in nature or refining his own abilities of sense-perception, but providing an experimental baseline to observe the effects of global warming.

The growing margins of glaciers, including ice tongues form from the flow of ice from many northern glaciers in the northern glaciers of Greenland’s ice sheet and the largest southern glaciers track the migration of long-frozen ice to the arctic sea, increasingly visible in the last twenty years. But can we come to terms with the study of their effects outside of similar analog observations?
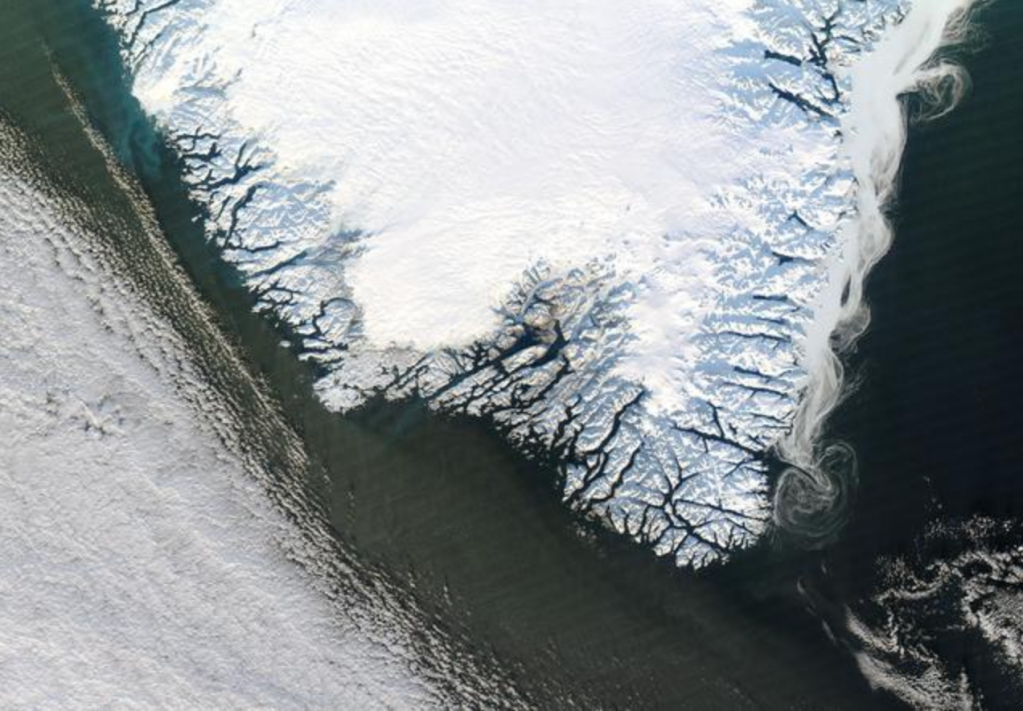
Greenland’s Melting Ice Sheet/NASA/GSFC

3. The retreat of glacial ice sheets in Greenland, which is melting in a warming ocean past the point of no return, is already losing 255 gigatons of ice each year, 2003-16, and while its melting is not inevitable, its melting–measurable by elevation loss–would increase as its elevation lowers to an ever warmer atmosphere. And as the coast of Greenland, long a source of iceberg transit, seems to melt, he viewing of icebergs, those last remnants of a frozen Arctic Ocean, are tracked not as sites of self-reliance, are crowd-sourced for tourists, as if testimonies still promising access to a divine,–

-as if to arrive at the Walden-like purity of a blue-tinged spectacle of ice off the shores of Labrador or Newfoundland, while they are still visible, still floating as remants in the warming arctic waters.

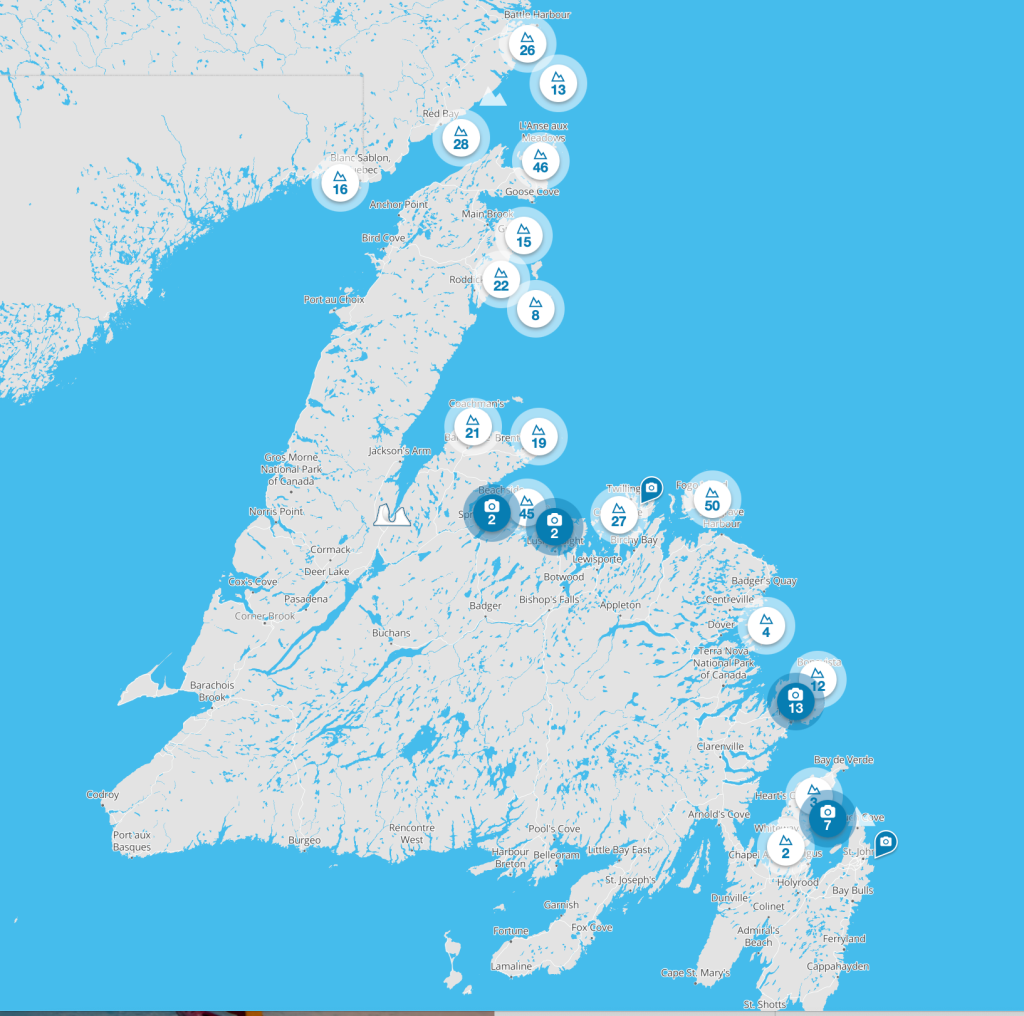
IcebergFinder.com/Newfoundland and Labrador

Continue reading

2 Comments

Filed under anthropocene, arctic melting, climate change, climate modeling, global warming

Drone Warfare, Carpet Bombing, Righteous Strikes

This problem seemed to come from Hell. The “righteous strike” of a drone-fired Hellfire Missile killed Afghan aid worker Zemari Ahmadi, his nieces and nephews was America’s military doing what it did best–a targeted precision strike. As much as targeting a human target who was instantaneously dismembered as his car shifted into park, the “Over the Horizon” strike cell commander who fired the missile from the drone was firing at a coordinate, and trusting in its authority. United States Dept. of Defense spokesperson John F. Kirby vowed “to study the degree to which any policies, procedures or targeting mechanisms may need to be altered going forward.”

The strike was to be reviewed by former senior staff officers who served in Afghanistan, assigning it high priority as an event that was based both on the lay of the land in the territory of the strike and of the unique capacity and liabilities of drones to both survey the area from human intelligence it is fed. But Rear Admiral Kirby insisted that the strike was only green lighted after the American General at Central Command, or CENTCOM, who remained apprised of surveillance found “a reasonable certainty of the imminent threat that this vehicle posed.” The descriptors of a “reasonable certainty of imminent threat” was itself a wartime coinage, the inheritance of the contradictions of the drone’s ability both to provide impressively detailed imagery from both infrared and image-intensified cameras in the Reaper drone that killed Ahmadi, believed and claimed to having decided to act as an agent of the Islamic State by a car full of explosives, a misjudgment for which no military were ever punished, or ever will be, as the intelligence failure was attributed not to humans, but to a defect akin to software–“a breakdown in process, and execution in procedural events, not the result of negligence”–even if it was in fact unnecessary to protect American troops from a strike from the Islamic State that the drones had detected.

The CENTCOM Commander himself apologized, saying “we thought [we had] a good lead,” the balance between “certainty” and “threat” was not so clearly mapped as the pinpoint targeting of the vehicle, watched for over eight hours. As if in a surplus expenditure of energy at the conclusion to the war, or a final moment of fireworks, the huge discrepancy of wealth and technology between two sides was made manifest in the explosion that took the aid worker Zemari’s life with his nine family members, a final salvo of the Forever Wars. But the striking of the vehicle containing Ahamdi, and which his nieces and nephews surrounded, were perhaps the fault less of a human error–if that was involved–than of a desire for a new method of war conducted in alarmingly disembodied terms, in which “it is exceedingly important to shoot the missile, not at the target, but in such a way that missile and target can come together in space,” as Norbert Weiner wrote in 1948, in a classic work of communication networks in animal and machine, in which human judgement become part of feedback loops, but not ever making anything like what we might classify as ethical calls: the transmission of information in this model is based on the clear transmission of alternatives, and reduction of ethics to so much background noise, based on the probability of how much accurate information was available or at hand.

This conflation of viewing and mapping is a creature of the geodetic grid, now enhanced, as never before, with qualitative footage that is real-time, if incomplete. The widely touted surveillance abilities of the Reaper Drone that is able to transport laser-guided Hellfire missiles, and day or night radar, was the “first purpose built hunter-killer UAV,” a precision instrument run by real-time video feed by operators located thousands of miles away was not only a filmic experience as a video that guaranteed its own sense of accuracy, assured by highly refined abilities of mapping that, as all geodetic maps, offer the security of a grid imposed on experience, as a substitute for experiential knowledge, but extends the global network of American military bases into the city blocks of residential housing able to drill down to the very driveway in which Ahmadi was hit. If the justification of “imminent threat” the reaction time from the growing constellation of drone bases” in a secret network of airstrips across Africa and the Arabian Peninsula to assure global military dominance growing from 2013 in the Global War on Terror, to achieve a targeted killing program of which Ahmadi’s death is only the latest fruit. The network designed to ensure the safety of Americans was justified by the Legal Counsel to Barack Obama’s Justice Dept. in 2011 as allowing lawful killing of any member of Al Quaeda or its affiliates of “imminent threat” to the United States, a formulation first used to justify the killing the American-born Muslim cleric Anwar al-Alaki, and his sixteen year old son. If the white paper does not mention quality of intelligence sources, it gave broad legality to aerial killing, stipulating “imminence must incorporate considerations of the relevant window of opportunity” and possible collateral damage to civilians. The geodetic architecture of spatial precision created a new regime of imminence, locking targets into the sights of removed

The legal term “imminence” is balanced with a distributed network to dilute responsibility in ways oddly commensurate with the technology of death. The removed visual experience conjured by the Reaper is an ideal cartographic knowledge, equipped with all-weather, day or night radar, a sensor ball bearing image-intensified and infrared cameras in the gridded screen of a target, is unique. Its firing is rooted in an ethically unquestionable phenomenology of film that depends on “what the camera can see,” which legal historian Nassar Hussain argued refined a way of seeing that elides its own mechanical construction and claims a total experience despite its often partial picture of the target in question; it is also a bolstering of the smoothness of the decision to strike a threat that proceeds down the “kill chain.” The moment of impact is geographically removed but also problematically removed from any ethical contract among combatants: it is the most extreme threshold yet of the “maximum range killing” that Dave Grossman, an authority on the psychological impact of lethal force in war, defined as “a range at which the killer is unable to perceive his individual victims without using some form of mechanical assistance—binoculars, radar, periscope, remote TV camera, and so on.” For Grossman, the occlusion of visual perception creates a suspension of ethics unique in military psychology: “I have not found a single instance of individuals who have refused to kill the enemy under these circumstances, nor have I found a singe instance of psychiatric trauma associated with this type of killing.” It was this unique psychology of killing, cleansed of all trauma, it appeared, that ballooned in the military theater of war in Afghanistan.

“Imminent threats” were intentionally removed scrutiny of targeted killing from public scrutiny by a legal whitepaper, commissioned by the U.S. Dept. of Justice in 2011, to confirm the lawfulness of a strike against an “imminent threat” of any senior or operational leader of Al Quaeda or affiliates just after the height of drone strikes in Pakistan and as drone strikes in Afghanistan reached astoundingly routinized presence. But the equipment of drone with lethal missiles from 2001, in the heady early days of a Global War on Terror after 9/11, transposed the legal language commonly used as a term of justification, to targeted killings as the 2002 strike against Al-Harethi in Yemen from a secret American base in the Horn of Africa, and the growth of drone strikes in Pakistani territory, whose legality the US government had effectively confirmed as part of the state of war and the landscape of aerial warfare that was increasingly incommensurate in scale of destruction with the terrorist attacks on the ground or IED detonations.

American Drone Strikes, 2004-2014, The Economist

At a time when ISIS had effectively internalized the danger of a sense of western besiegement, and the United States had almost amplified its power to suggest that waves of besiegement were utterly insurmountable and impossible to defend against, the arrival of a final Over-the-Horizon strike of a Hellfire missile seemed a parting strike of particular cruelty, by accident effectively perpetuating the inevitability of a continued narrative of besiegement for the world; as the escalated pummeling of ISIS presence in the hills of Peshwar and Afghan provinces had provided ample evidence of besiegement attempting at exhausting the “enemy,” in record numbers, over a decade of intense bombardment focussed firepower one final time on a residential courtyard in Kabul were someone far away had judged an Al Qaeda affiliate was parking a carload of explosives.

There are problems of balancing an awesome strike ability of a Hellfire missile, a missile conjuring the eternal fire faced by the dammed with a “righteous strike,” and the scale of local damage it can cause: the death sentence that the missile passed as a remotely tracked technology of obliteration was invested with curiously religious terms, the fire of damnation a sentence of divine wrath, sending the fire of hell to the courtyard of a Kabul family residence to shatter the life of the wrong man who had been tracked for eight hours by Over-the-Horizon Strike Cell dedicated to disrupt the Islamic State Khorasan. But this time the Over-the-Horizon strike in Kabul was, if precise, focussed on the wrong white sedan, as the intelligence about the car that was being tracked for over four hours was terrifyingly incorrect. The poor debut of “Over-the-Horizon” strikes was a bad omen of the value of geospatial precision.

Afghan Neighbors Ponder the Courtyard of the Zemari Ahmadi’s Home in Kabul, Afghanistan
Jim Huylebroek for The New York Times

Were the mechanisms for firing the laser-guided missiles encoded in the authority of the mapping tools that sent the laser-guided Hellfire missile to Kabul, as much as in faulty intelligence, and the limited guidance on targeting individuals? In what was almost a bravura use of force, American military drones fired Hellfire missiles as the airlift continued, on the eve of the United States departure, pointing to the appearance of secondary explosions as fireballs to indicate presence of explosives inside vehicles that ISIS operatives might drive into the airport for a second suicide attack. But if the strike was “deliberated” and the information military had collected “all added up,” the rules of engagement of airstrikes, as much as the human intelligence, implied deep ethical problems of trusting in the logic of maps to sift through evidence with greater accountability, especially as we seem to be approaching a threshold of increased engagement without men on the ground in Afghanistan, in developing an “over-the-horizon” strategy for the immediate future, as President Biden pursues his commitment to fight ISIS-K without actually increasing civilian deaths.

An Afghan man who lost family due to US drone strikes weeps.
Ajmal Ahmadi, Mourns Members of His Family Killed byu Hellfire Missile in Kabul, Afghanistan, Monday, Aug. 30, 2021. 
Marcus Yam/Getty Images

The mechanics of the decision-making process that led to fire a drone that later killed Ahmadi and his children, nephews, and cousins is under review, but the verbal and epistemic confusion between what was first described as a “righteous strike” of vengeance, evoking the theory of “just war” that was invoked by President Barack Obama in invoking “just war theory” to rationalize the use of the military force not as a wanton or needless display of power and with the hope of saving lives to prevent the loss of lives, required, in his hope a “near-certainty of no collateral damage.” And while this was of course collateral damage of the most extensive time, the coverage of the extent of mis-targeting of believed terrorists reveal a terrifying cheapness of life, undoubtedly only able to be researched in detail for the jaw-dropping mistake of targeting of innocent civilians by a laser-guided missile due to the density of journalistic coverage of this particular strike, and journalistic presence documented the costs of erroneous strikes and the scope of civilian casualties as horrific as carpet bombing–if far more surgical–as if this were a far more humanitarian form of war whose precision could be labeled just. We were able to see the Taliban checkpoint that let in suicide bombers to Kabul’s airport, causing almost a hundred and fifty deaths, we became convinced of the ability of targeting precision strikes of the perpetrators of similar crimes, and amped up the intelligence networks to scour the city for signs of any activity appearing that it demanded to be targeted, and snuffed out.

Planet Labs Inc., image of Taliban checkpoint blocking access to Kabul’s international airport Saturday, Aug. 28, 2021
(Planet Labs Inc. via AP)

Precise targeting, unlike bombing raids of the past, provided this certainty, or was supposed to offer surety of not being needless. But if such near-certainty depended on a map, it rests not on the accuracy of mapping. The strike that killed Zemerai Ahmadi — and ten of his family members–was mistakenly categorized as a “righteous strike,” killing an innocent aid worker and his family members. While it occurred in the heady atmosphere of retaliatory strikes for attempt to sabotage the withdrawal from Kabul’s airport attempted to be just, the slippage between the logic of targeted bombing and justice became apparent. It was a lurch to affirm global strength, more than justice, in using a technology of geolocation that had evolved to coordinate hand in glove with surveillance from Reaper drones. The ability to pinpoint track the progress of one car tagged as an imminent danger.

U.S. Central Command maps movement across Kabul of white Toyota Corolla on Aug. 29, 2021. CENTCOM/via Military Times

The mistaken of surveilling and targeting a young Afghan civilian in a Toyota Corolla was terrifyingly akin to the senseless bombing campaigns of South Vietnam, North Vietnam, and Laos, or more terrifying. Surveillance of Kabul and its airport were much better than Vietnam, by remote satellite and drone photography, the ability of such targeting–and the rush of such precision killing–seemed to follow the logic of the map, as much as people on the ground.

1. The maps used to conduct action at a great distance in Vietnam were not as transparent or evident, but they were for the time. In the 1960s and 1970s, they offered grounds to pose the eerily analogous question of the extent and expanse of the globalist claims of American power. The trust in the accuracy of maps provided an eery precedent for the confidence in strikes an old theater of empire, a theater once defined by imperial maps. The surety of the strikes that the UTM and LORAN B offered to American pilots existed in two theaters–the arena of the map that determined the strikes and the geographical space to which it corresponded, and old imaginaries of imperial and colonial power. The British empire was driven from Kabul in 1842 and 1843, and the French hold on Indochina had led them to withdraw; as the mapping techniques of post-war Europe led the United States to inherit Southeast Asia, global technologies of mapping opened the possibility of launching strikes that would offer lasting reminders as America withdrew from the Forever Wars in Afghanistan, leaving as the English did from both Kabul and Kandahar, but, in an attempt not to be forgotten, leaving a lasting imprint of the power of long-distance bombing. If combatants of most all wars fight with different maps, often reflecting differences in military intelligence, both these post-colonial wars were defined by the drastic dissonance of radically different maps of geospatial intelligence, one from the air and one on the ground, and the pursuit of a stubborn logic of air maps as if they offered both superior exactitude and geospatial intelligence, modernizing the struggle for control by defining a logic of modern military operations by which to understand and to shape the “sharp edge” of war.

Carpet Bombing in Vietnam by B-52 American USAF Planes

The beginning of the end of American Empire has been recently pegged to 1972, a year that marked and took stock of the the end of a huge expenditure of sustained bombing drives with little apparent enduring accomplishment. The geospatial logic that drove such earlier long-distance aerial bombing campaigns in Vietnam were driven by perhaps misplaced confidence in how maps enabled and facilitated military action at a distance: maps offered a logic, if there was one, for conducting the over six hundred sorties and operations over eight and a half thousand miles away. There is an eery analogy that we have the most complete and exact database for bombing raids of the American military in Vietnam, coordinates that were painstakingly compiled by Americans, so analogous to the geodata of thousands of drone strikes in Northwest Pakistan and Afghanistan, from 2004-2018, that the New American Foundation asserts the vast majority–over 80%–of those killed, were militants, though the Brookings Institution counters that drone strikes killed “10 or so civilians” for every militant who died,; Pakistan’s Interior Minister complained vigorously that a preponderance of the killed with civilians–especially in habitual follow-up strikes, targeting those responding to victims of the first hit, targeting of funeral processions, or mourners, or simply less surgical strikes. In an attempt to respond to these attacks from above, the Taliban’s weapon of choice was improvised explosive devices–literally, IEDs, placed on roads and activated by radio signal, mobile phones, or triggered by victims who step on them.

Paul Scruton, The Guardian

The warscape that developed 2004-9 of explosive shells, made often from diesel or fertilizer, along the major Afghan highway by the border with Pakistan where the Taliban was geographically contained–an increased density of which was tracked by Paul Scruton in the screen shot maps to the right of the map. The first attachment of a Hellfire missile to a drone followed the sighting of Osama bin Laden by one of the Predator Drone of the sort that flew across Afghanistan from September 7-25, 2000, in search of the terrorist who was wanted from 1998 suicide bombings in two U.S. embassies, his first strike at American territory; the unarmed CIA Predator was able to laster-illuminate and geolocate him so that it tracked him fro almost four and a half hours, but he could be hit by a Tomahawk missiles, but the time-lag for firing Tomahawk missiles failed to guarantee a similar sort of accuracy; as the new tool of the CIA and US Air Force were mounted with Hellfire missiles, they sighted and shot at Mullah Omar in 2001, but missed him, destroying only his car.

When Barack Obama assumed office in 2009, he tweaked George Bush’s invasion of Afghanistan by rehabilitating the “just war” theory, of medieval origin, formulated by Christian and protestant thinkers. Obama chose to rely on the accuracy and surgical nature of precision strikes as surgical means of not striking civilians, or focussing on enemy combatants, although the berth of such distinctions lay in the military or CIA: ifAfghanistan became the terrain for “the future of our military,” where Predators defined the mobile “edge” of warfare waged overhead and across borders. Targeted assassinations by CIA and USAF targeted the Waziristan region, mapping the region with pin-point in the notion of a “just-war” theory, rehabilitating an ancient doctrine of right conduct in war–“jus in bello” doctrine of Christian thinkers–by modern tools of geolocation, leading to the escalation of pin-point targeting by drone-fired missiles. In the face of global opposition to the use of missile enhanced drones as tools of targeting objectives in war in the mountainous areas of Pakistan province where the Taliban had fled by 2011,–

Escalating Drone Strikes Targeting Taliban in Remote Mountainous Region of Waziristan

–and, from 2012, the CIA went out of its way to try to design alternate missiles to “shred” vehicles and their inhabitants, but without blasts, to attempt to minimize “collateral damage” or killings.

Secret U.S. Missile Aims to Kill Only Terrorists, Not Nearby Civilians - WSJ
 Hellfire Modified to Limit Damage of Bystanders, Used from 2012

By the time the final American forces were set to ferry the final civilians from Kabul, however, the logic of drone strikes shifted to the home front of Kabul, set motion by the terrifying suicide bomber who struck Kabul’s airport, killing 143 Afghans and 13 American servicemen. In what was either the last gap or new frontier of geolocated killing, drones targeted Hellfire missiles in pinpoint strikes across Afghanistan, in “just” retribution of the fear of further K-ISIS suicide attacks on the ground during the last days of American presence in Afghan territory focussed on flights departing Kabul, revealing an ability of surveilling, targeting and striking far into the country as American forces departed the ground, as if to alert the Taliban of the continued proximity of CENTCOM bases in Qatar.

However celebratory the drone strike seemed, hellfire missled that killed Ahmadi suggested the haunting return of a lack of justice on August 29, as twenty pounds of explosive struck the car of the breadwinner of an extended Afghan family, with seven children who depended on his work. The children who had rushed out to greet him as he pulled his own white Toyota Corolla into the driveway of his personal home were not seen by the man who fired the drone missile, who felt secure no civilians were nearby. As we examined footage to detect the alleged secondary explosion, we found a weird echo of the airstrikes of an earlier war removed from our continent. While much comparison between the messy tactics and poor planning American withdrawals from Vietnam and Kabul spun, the incomplete coverage of the “collateral deaths” of civilians from the strike led to the military’s eventual backpedalling of its story of striking ISIS-K as an act of counterterrorism or “righteous strike.”

It was only due to careful investigation on the ground that the horrendous mistake was discovered. Reporters used footage from security cameras to follow the forty-one year old aid worker before he was driver targeted by the Hellfire missile suggested the poor intelligence which operators of “strike cel commander” who had been operating the drone in Kabul. Even as we await analysis of the decision-making mechanisms, we wonder a the high degree of certainty in public statements, even as questions circulated from the start of accurate video analysis of an after-blast confirming, as was claimed, that the Toyota Corolla was carrying a payload of ISIS-K bombs, and the lack of a mechanism of review before the drone strike. The accuracy of targeting the car was questioned by journalists as Spencer Ackerman all too familiar from the targeting of civilians that had escalated in previous years. Although announced as compensatory for the deadly suicide bombing outside Kabul’s airport, killing Afghans and thirteen U.S. military, as a second drone strike on ISIS-K leaders in Nangarhar Province of an “Islamic State planner” in retaliation for the deadly suicide bombing–and entranced the world with the surgical take-out of the very operatives who allegedly planned the airport attack that killed thirteen American service men and 146 Afghans, as they rode a three-wheeled truck near the Pakistani border from 7,350 miles away in the Nevada desert, injuring an associate but killing the two men immediately. There was a perfect symmetry in the image of men who were riding in a tuk-tuk being obliterated by a strike that left a crater four feet deep.

While removed in time, the bombing campaigns in Vietnam have left precise geodata for bombing raids so comprehensive to be able to map cumulative raids over time. The result privileges strikes over deaths, in the eerily lifeless and quite terrifying record of Bombing Target Maps,–charting sustained campaigns of bombing at a distance waged in maps. This blog considered human costs of aerial perspectives both as a result of the acceleration of bombing campaigns in World War II and how maps jusfitied and normalized the Atomic bomb dropped on Hiroshima. As the longest and least accomplished use of maps to sustained military engagement at a distance, is impossible not to consider the retrospective view it offers and reveals on the logic of the role of drones in Forever Wars. Systematic carpet bombing of Southeast Asia was pursued 1965-1973 as if by a logic of mapping, escalating by 1972 in a failing attempt to illustrate global dominance. The increased exactitude of the map becam a rationale for the power to wage war from afar, both to compensate for a lack of information on the ground, and to compensate for more irreducible problems of distance: mapping tools promised a logic of the ability to operate smoothly across frontiers. The unprecedented global coverage of GPS coordinates was administered and run by the United States for Vietnam through 1975, long after the war concluded. But the role of maps in waging war early emerged. If the United States in 1959 had blocked adoption of new standards of global projection, perhaps linking knowledge to power, the Army Service had recalculated surveys of Southeast Asia–Cambodia, Laos, and Vietnam from the global projection that became a basis to collate new geodata–the Army relied on for staging helicopter raids in Vietnam, and, later, for long-range bombing campaigns.

Tet Offensive, 1968

Not that this was always smooth. Despite troubling distortions inherent in the UTM along South Vietnam’s north-south axis and border with Cambodia, coordinates provided a basis for conducting war at an unprecedented distance, even if they would necessitate revamped geodetic networks to minimize built-in distortions.

Serial Aerial Bombing by United States Air Force in Southeast Asia, 1965-1975
Hatfield Consultants, Ltd; Ordinance Data Prepared by Federal Resources Corporation

Aerial strikes offered a sense of security, notwithstanding, and aerial sorties that continued to exercise claims to global power even in an unfamiliar theater of combat, evident in the dark lines of ordnance dropped along fairly fixed flight paths on what were deemed strategic locations in North Vietnam, and dense napalm dropped in the Thura Thiên region, where the saturation with napalm provided a carpet bombing of unprecedented scale, with limited sense of the effects on the local ecosystems. The planes’ almost indiscriminate blanketing of the strategic Thừa Thiên province and mountainous border with Cambodia where Việt Cộng hid were blanketed with ordnance and herbicides including Agent Origin, creating a massive deforestation there and on the network of roads known as the Hồ Chí Minh Trail.

Serial Aerial Bombing by United States Air Force in Southeast Asia, 1965-1975
Hatfield Consultants, Ltd; Ordinance Data Prepared by Federal Resources Corporation

Despite the bracketing of huge ethical questions and costs, the authority of maps assumed huge costs as they were were able to conceal huge liabilities, changing the nature of the battle line at which we were now, as a nation, waging war, and its ethical costs: for we were bombing locations, not people, and the people were faceless who the bombs were targeting, othered, and in the national imaginary all but erased. It would take a force of consciousness, indeed, to place them on the map–on the ground photography remained relatively rare. And it is the ability to erase people by dots that provided, this post argues, a similar logic for the expansion of drone raids and drone-delivered bombs.

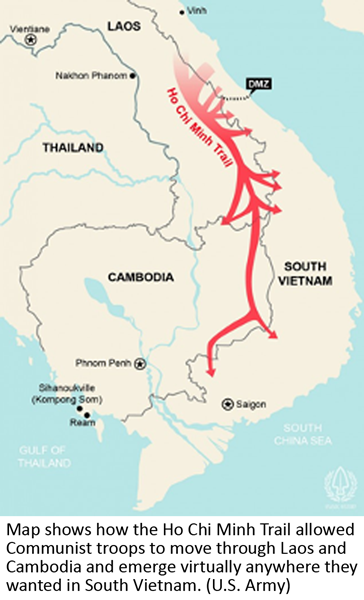
As bombing raids hit the the Seventeenth Parallel, the war was fought on a map: as much as Võ Nguyên Giáp revealed his military tactical genius as military commander of the Việt Minh, who had developed with stunning success the principle of Sun Tzu in successfully applying minimum military force to maximum effect in deploying light infantry in the First Indochina War, and in engineering of the network of roads known as the Hồ Chí Minh Trail, whose targeting continued in the war, even as its north-south course were distorted in UTM projections. The uncertainty is almost registered by Americans turning for solace to sing Toby Hughes’s “Ho Chi Minh Trail,” a wartime blues to the tune of “Billy the Kid,” as a blues of airspace: “When you fly on the Trail through the dark and the haze/It’s a think you’ll remember the rest of your days./A nightmare of vertigo, mountain, and flak,/And the cold wind of Death breathing soft at your back“? “Uncle Sam needs your help again,” is the mock-resolute start of another of the many songs that tried to process distance and space during the war, “He’s got himself in a terrible jam, way down yonder in Viet Nam,” as was no better evident than in targeting the elusive Hồ Chí Minh Trail.

File:Ho Chi Minh Trail network map.jpg
Hồ Chí Minh Trail Netork (1990)
Week of September 27 | Vietnam War Commemoration

Americans administrators plagued by lack of knowledge about Southeast Asia or South Vietnam’s leadership relied on maps crippled by distortions. If the blues developed on the plantation, the wartime blues was a lament popular with American pilots as a new folksong of a technological divide pilots sung for psychic stability seemed to balance the demands they shouldered and fears–“the trucks must be stopped, and it’s all up to you,/ So you fly here each night to this grim rendez-vous”–as each sortie tempted fates in contested military space above the Trail; they watched from above “trucks roll on through darkness not stopping to rest,” consigned to their fate nervously navigating airspace by charts, “our whole world confined to the light of the flare,/And you fight for your life just to stay in the air./For there’s many a man who there met his fate,/On the dark roads of Hell, where the grim reaper waits.”

Carpet bombing was hardly comfortable, but was filled with fear. And one is filled by an eery apprehension at the ease with which geolocated records of bomb strikes in North Vietnam, South Vietnam, and Cambodia translate across time into a Google Maps platform, and the translation of the coordinates to a geospatial grid that we all have come to adopt to navigate space. UTM grid zones in Southeast Asia, as Bill Rankin noted, split in inconvenient ways in Southeast Asia, and although bombers were relying on them in raids that spanned over five years, As the provisional line of demarcation between North and South Vietnam, the so called “DMZ” of the Seventeenth Parallel Mendès France negotiated in 1954 was pounded twenty years later with all the firepower America could muster, trying to secure its border by a crazy huge show of power at a distance.

The result of these compound offensives was to riddle the countries with some 2.7 tonnes of explosives, as we were asked to keep our eyes on a static maps on television screens. This was described poetically as “carpet bombing” or continuous bombardment, first used only in 1944, in response to destructive V-1 and V-2 bombs, to mark a shift from the largely targeted bombing of industrial sites in the war. The sense of a lack of restraints or targets dramatically grew in the Vietnam War, as a no holds barred method, long before Ted Cruz vowed to recommit American to the carpet bombing of the Middle East to “utterly destroy ISIS,” asserting, as if in a perverse science experiment, that while he didn’t “know if sand can glow in the dark,” he would ensure American planes bomb ISIS positions until the sand glowed, in 2015,–intimating a carpet bombing of nuclear proportions. Donald Trump amped up Cruz on the campaign trail in Iowa, by promising not only to “bomb the shit out of ’em,” and “bomb the pipes, bomb the refineries, and blow up every single inch” of refineries to prepare for several months of rebuilding of pipelines by Exxon to “take the oil.” Since the debut of smart bombs in global video during the 1991 Gulf War, the sense of carpet bombing seems to have been consigned into the past, with the trust in the security of drone-fired bombs from 2003 promising to strike targets in a far more humanitarian way.

As the Vietnam War intensified, the long year of March 18, 1969-May 28, 1970 brought daily bombing of Cambodia, all but omitted from the entry of troops into Cambodia we watched on a static map on black and white televisions. Even as the escalation of disproportionate bombing campaigns that only ended on August 15, 1973 grew, they set a standard of sorts for the elegance of airborne strikes from afar.

Tet Offensive Bombing Campaign, 1968

Is it only a coincidence that after serving the nation as Special Assistant to the Undersecretary for Policy in George W. Bush’s Dept. of Defense that the right-wing columnist who has romanticized Gen. Custer devoted time to dispelling the “flawed Tet mythology still shaping perceptions of American military conflicts against unconventional enemies and haunting our troops,” completing This Time We Win: Revisiting the Tet Offensive (2012), winning praise from Henry A. Kissinger, who agreed that “the self-perpetuating myth that the Tet Offensive ended in a defeat for America continues to do us harm,” while endorsing Jerome S. Robbins’ re-examination of the bombing offensive “through the lens of terrorism, war crimes, intelligence failures, troop surges, leadership breakdown, and media bias”–as if to champion the very losing strategy that informed bombing raids in Afghanistan.

2. The limits of local intelligence recalled the opaque maps before which an earlier Commandeer-in-Chief who, convinced of the logic of military strikes, attempted to project assurance at having directed American troops to enter Cambodia in April, 1970, as bombing grew. Just two years before the continued expenditure on aerial bombing campaign seven thousand miles away revealed a failure to reach military objectives announced a start of the decline of the American empire, the drone strike at the old colonial city of Kabul CentCom ordered revealed a continued commitment to the logic of military engagement by drone that animated the logic of war under an inauspicious promise to Maker America Great Again: the conducting of increased bombing strikes eight and a half thousand miles away would grow in intensity from 1970, but the argument Richard Nixon made was not apparent, as it rested on a geospatial map, but used the crude maps of boundaries of states few Americans were familiar–Laos, Cambodia; South Vietnam; North Vietnam–that hardly reflected why such intense bombing would be occurring around the seventeenth parallel, or mapped a clear vision of strategy.

American Troops Enter Cambodia, April 30, 1970

Even as we knew enough to be skeptical of his map of crude cut-outs, remembering Dresden Hiroshima, and My Lai aggression against civilians, but knowing we had heard stories from reporters on the ground about its intensity. And so we watched the maps of new offensives, distrusting escalated air bombing in times of war–if we knew not to trust them, we took to the streets in protests because we remembered, and because the official news maps of selective hits in one offensive was a partial story–and the danger of what was being targeted by a carpet of explosive bombs dropped.

B-52 Carpet Bombing of Vietnam

–hardly mapped the increased intensity of air strikes of carpet bombing, the new illustration of force that blanketed the nation with strikes to cover borders between north and south Vietnam and the coast, as Air Force data reveals, releasing over two and a half million tons of bombs on over 115,000 sites in Cambodia, from 1969-72, of which over 11,738 were indiscriminate–with the blatantly false assurance from the military commander in South Vietnam, who requested the sites be targeted in a neutral country, that Cambodians did not live in them, in the wave of secret bombings ordered in violation of international law, and quickly developed by Nixon’s National Security Advisor Kissinger–

The unprecedented concerted orchestration of carpet bombing campaigns by air sorties attempted to wipe out all VietCong bases in eastern Cambodia, vaunted precision in dropping 7.5 million tons of bombs across Laos, Vietnam , and Cambodia, between 1965-75, from Operation Rolling Thunder (1965-68) and Operation Steel Tiger (1965-68), to the extended campaigns in Laos of Operation Barrel Roll (1964-1973) to Cambodia, before Operation Menu (1969-70), blanketing the nation and creating untold civilian deaths and injury in a show of force.

The latter raids covering the country in toto, but to target Khmer Rouge ranged widely across borders of Cambodia and Laos, which was facing a communist insurgency in its borders, and the nation Vietnam had invaded became central to the Domino Theory that rationalized an expansion of boming across borders, before returning with intensity to the seventeenth parallel from 1971-2, trying to hit precise coordinates, and effectively carpeting the old DMZ with bombs. There was something weird, as from a nation of the crossers of borders, we flew bombs across borders, carpeting regions with devastation, from the shorelines of Southeast Asia, to the interior, to the shore again, this time with even greater intensity and around what was then Saigon.

The intensity of carpet bombing was astounding in Cambodia and Vietnam, literally coloring huge swaths of the country red, in these maps that use red dots for cumulative tallies of bombing strikes.

Taylor Owen, University of British Columbia’s Liu Institute for Global Issues
U.S. Secret Bombing of Cambodia | rabble.ca
Aerial Bombardment by US Air Force of Cambodia, 1965-1973

The danger of those bombing strikes on civilians were rarely described, or even comprehended, at a distance. But visualizing the faces of the civiliians whose towns and life were disrupted so violently became a basis for protesting the war–and a crystallizing factor in antiwar protests as the bombing campaigns grew–as the ends of carpet bombing as a targeting of civilians nonetheless grew all too painfully clear, as the very intensity of such carpet bombing created a new architecture of destruction in an already profoundly unethical war.

Anti-War Protest Button, 1972

3. Precision strikes seemed more humane than carpet bombs. But the precision bombs of the Forever Wars were, perhaps haunted by those images of civilians with targets on their crudely drawn heads, trying to advertise themselves less as a global over-reach of the targeting of precise strikes in another hemisphere, a campaign that in fact began, back in the response to the apparent hubris of 9/11, in the battery of B-52’s brought out from retirement, before the Defense Department hit on the new idea of acquiring drones and investing in drone technologies, a budget that has risen to above $7 billion by 2021, whose use is severely restricted in American airspace, but seems the perfect medium for fighting forever wars, on which the United States has come to rely since at least 2005. Fighting the Forever Wars and for counterterrorism programs, a new logic of military engagement, although the program that was first used in 2003 to strike targets developed in secrecy as a way of blurring the “sharp edge of battle,” described by British military historian John Keegan as incomplete or elided in most military histories. Now the “sharp edge” is both everywhere, blurred, and intentionally difficult to see.

The airspace for operating for the 11,000 drones or “Unmanned Aircraft Systems” in the United States that the U.S. Department of Defense currently owns and operates in American airspace are far from civilian centers in the United States–but the logic of pinpointing strikes 7,000 miles away provided a precision bombing that replaced or antiquated carpet bombing, billed in a new humanitarian guise.

Department of Defense Special Use Airspace, 2006

–but the rest of the world is, as the Kabul airstrike reveals, an open surgical target. And the increasingly intentionally reduced transparency of an increased national commitment to military drones in the Trump administration has created a new logic for the use of military force, via armed drones, and the unprecedented mobility of military theaters, under the cover of the advancement of either military or national security objectives. The bulk of the drone programs run by the CIA are shrouded in entire secrecy, although the commitment to reducing any sense of transparency and accountability–a main operating strategy or modus operandi of the recent Commander-in-Chief–has left a stamp on the U.S. Drone Program that will be difficult to erase, and a new sense of the secret maps by which war is waged.

As military operators of drones gained far greater air-strike-decision ability and independence, both in the military and the CIA’s separate drone strike operations, a new level of security was increasingly embedded in the logic of the map. There was, moreover, not even a requirement for registering enemy or civilian casualties, even if they might embrace deaths, since Trump issued Executive Order 13732, exempting both the US Army or for the CIA for any such responsibility for strikes outside combat zones; strike-enabled drones were granted greater operating grounds with less scrutiny or oversight. At the same time, oversight of sales of U.S. drones waned, and the Department of State gained the ability of direct commercial sales without oversight or special export conditions. Drones, in short, became the new currency of the war, and the means by which anything like a familiar battle line vanished. Removing strikes of pin-point precision from a system of military review so localized the “sharp of edge of battle” that it might migrate, given the ease of mapping, to a civilian garage.

Kabul, Afghanistan, Aug. 30, 2021. Marcus Yam / MCT

The drone strike seems emblematic not of a hasty withdrawal from Kabul, but of the confusion of military and civilian space in the war that readily relocated anywhere on the geospatial grid. In targeting the driver’s side of the white Toyota with incredible precision, we can see something of a history lesson in how mapping tools offer terrifyingly increased precision strikes. Although the Pentagon assured us that the existence of “significant secondary explosions” occurred, indicating a “significant explosive load” in the car with “minimum collateral damage,” and “reasonable certainty” of no nearby civilians, the lack of any grounds for certainty of explosives or an absence of civilians suggest not only the fallibility of human intelligence, but the Hellfire warhead that ruptured the tank while targeting the driver’s seat was a disproportionate show of force of awesome precision led its operators to trusted was trusted with “reasonable certainty” to pose “imminent threat.”

Drone strikes were not particularly effective against Taliban forces, and rarely contained them. But the act of power of pummeling Afghan locations that seemed worrisome with credible degrees of “reasonable certainty” was a release. It led to an escalation unprecedented in airstrikes against the nation as a show of power–until the end of DOD releasing of air strike data during negotiations with the Taliban; if airstrikes stopped, the shipment and stockading of increased armaments funneled to the Afghan army’s American-built bases in an attempt to overpower the nation that created its own dynamic of awesome war all but erasing the sharp edge of battle. The escalation of strikes as Trump assumed office had only recently grown to unprecedented heights.

More seriously, without any public release of the principles and procedures guiding the U.S. drone program, secrecy shrouds the legitimacy of the use of drones or the notion of the responsible use of drone strikes of increasingly powerful capacity, undermining the accountability of the military’s actions. It is perhaps ironic that this is being revealed on the eve of the departure from Afghanistan, and twentieth anniversary of the attacks of 9/11, which were such a shocking violation of territoriality: the expansion of no oversight on drone strikes risks undermining legitimate military goals, and even undermining national security interests, in finally attaining the capacity to act as a rogue state.

4. Although the possibility of retributive payments for these lives have not been publicly raised, although America has discussed “considering ex gratia or reparations,” the demands for some sort of compensation for those who were killed outright by what U.S. Cent Com admits as a “mistake.” If the walking back from early qualifications that rather than being a direct hit in retribution for the airport strike against U.S. military, the strike was “unlikely . . . those who died [jn the drone strike] were associated with ISIS-K,” or a “righteous strike” foiling a strike, the admission of guilt by the “strike cell commander” located in Kabul raises questions of the logic of military engagement in an era of drone war. The increased trust in the mapping systems–rather than on-the-ground intelligence or a need for confirmation–had brought the war on rural Afghanis to the nation’s capitol, leaving looming questions of why the country was not so concerned to use arms left by Americans to repel the Taliban, and how the logic of drone warfare expanded in the Forever Wars as a logic of surgical strikes that had boasted to not involve or affect civilian populations.

This time, the on the ground tracing of the Toyota Corolla’s movement in downtown Kabul led it to be targeted based on faulty information, and faulty flagging of suspicions in Ahmadi’s white Corolla, or the proximity with which it was parked or had stopped near an ISIS-K compound. The tracking of the car as it moved along city blocks and well-known streets led to the capture of surveillance footage of Ahamadi filling his car with water bottles, and dropping off coworkers, while he returned to his family, but it is unclear how a review of policies and procedures of targeting mechanisms will alter the logic of the drone strike as a surgical tool of war; just after the admission of mistakes in mapping and targeting of an Afghan civilian, CENTCOM followed up with announcement of the drone strike of a “senior al-Qaida leader” in Syria, in which “we struck the individual we were aiming for, and there are no indications of civilian casualties as a result of the strike,” as if to demonstrate how the smoothly the logic of drone strike technology could continue to work.

Yet, as journalists were increasingly present in Vietnam to film, witness and provide testimony of the devastation of bombing raids, with increased secrecy around drone strike programs, we have to wonder whether the mapping of civilian casualties will be something that would be in the government interests to continue, or if it is the case that the sharp edge of war has been definitively blurred. There was, by chance, due to the intense on the ground presence of journalists, an attempt to review the way that we set up what was almost a “home front” in Afghanistan; the victims of strikes were captured on closed circuit television, and could be tracked through the city of Kabul. Unlike for most drone strikes, we have faces, making it all the more possible to grieve their deaths and need to figure out how best to mourn their needless deaths, if not to take them as emblematic of the 71,000 civilian deaths from military campaign in Afghanistan we are told will come to an end. Though this time, we know their names–and can say them–the children of Mr. Ahmadi, Zamir, 20; Faisal, 16; Farzad (10); the children of his cousin Naser, Arwin, 7; Benyamin, 6; Hayat, 2, Malika, 2, and Somaya, 3, as well as a former Afghan officer who worked with the US military, Ahmad Naser–and we know how to say their names, that basic, elemental form of mourning that we never had access to in the past–let alone the series of smiling head shots.

More to the point, our actions are effectively setting international standards for drone strike accountability and for the limits of drone use, running counter to global security, and how drone strikes in the future wars that may be, eventually, used against us, as well.

2 Comments

Filed under Afghanistan, Afghanistan War, bombing raids, military maps, military weapons

Facing Extreme Climate Upon Re-Entering the Paris Climate Accords

In an age it is disturbingly familiar for news maps to place us on tenterhooks by grabbing our attention, the existential urgency of the blanket of the continent with icy arctic air was no exception. But if the images of sudden entrance of frigid air shocked most states in the union and lower forty eight, the farther one collapsed the week of freezing cold, the more one could see a clarion call for the re-entrance into the Paris Accords. It was as if NOAA visualizers of meteorological disturbances, newly liberated, were free to show the dangerous consequences of the tippy polar vortex and uncertain weather in an era of extreme climate change. Bright color ramps foregrounded falling temps in rich magenta or icy blue were almost off the charts, from the uppermost end of the spectrum in their duration–below–or in the low temperatures that were advanced–in maps that push the boundaries of expectations with urgency.

As maps of the hours the nation was plunged into subzero trace a purple cold front advanced all the way into the deep south as it spread across the continent from up north, the continent shivered under the icy blues over the mid-February cold spell. As we re-enter global climate accords, and consider what global accords can come to terms with climate change, it seems opportune to consider the alerts that remotely sensed mappings of our changing global climate chart. The chromatic intensity jarred with the familiar spectrum of meteorological maps to shock the viewer: the map challenged any reader to try to place the arrival of cold air and hours below freezing in a frame of reference, to dismiss the incursion of icy air up to the US-Mexico border as an irregular occurrence, more than a harbinger of premonition of the cascading effects of extreme weather, let alone a warning of the limits of our national infrastructure to adjust to it.

If the focus of the NOAA maps of the National Weather Service fulfilled their mandate by focussing on the territoriality of the United States, these images and the news maps made of them communicated a sense of national violation, if not of the injustice of the incursion of such unexpected freezing temperatures and Arctic air, as if it were an unplanned invasion of the lifestyle, expectations, energy policy, and even of the electric grid of the United States, oddly affirming the American exceptionalism of the United States’ territory and climate, as if the meteorological maps that confounded predictions were not a global climactic change.

And in the maps of the fall in national temperatures, as in the header to this post, the news that the nation witnessed a frozen core spread south to the southwest, almost reaching the border, seemed to shift our eyes from a border that was mapped and remapped as permeable to migration, to a map of unpreparedness for climate change, almost echoing the systemic denial of climate change that has been a virtual pillar of the Trump Presidency on the eve when Donald Trump had permanently relocated to Mar a Lago, one of the last areas of the nation that was not hit by the subzero temperature anomalies that spread across north Texas, Oklahoma, Kansas, Missouri, New Mexico and Iowa, plunging the many states we though of as “red” during the past election an icy deep blue interior in mid-February down to the Gulf Coast–as if the colors were a national crisis not of our own making for a nation that had obsequiously voted Republican, withdrawn from the Paris Accords, and allowed the warmer temperatures to be located only in the state where Donald Trump was now residing in Mar a Lago.

–that , as the week of arctic air’s arrival wore on, the newspaper of record glossed by a color ramp of low temperatures few residents southern states expected to be plunged into subzero surroundings. The color ramp they chose to chart how gelid air poured set off a cascade of events and disasters nicely demonstrated cascading effects of climate change on the nation, as the shock of low temperatures sucked the national attention away from the border, and begged one to come to terms with the challenge of climate emergencies in global terms. The frozen core of the nation was a wake-up call, re-re-rendering the familiar Red, White and Blue in faded out terms of the distorted levels of cold the nation currently confronts–the increased escalation of which we are projected to face.

Lowest Temperatures in Country, February 12-16/New York Times, February 18, 2021

The entrance of gelid air from a polar vortex poured across much of the midwest in unrelenting fashion. Plunging subzero temps hit the Texas coast that overloaded electric grids and shocked weather maps that seemed out of whack even for mid-February, as even the sunbelt of the southwest turned gelid cold as subzero temperatures arrived over a week, plunging the arctic neckline down into Texas, and almost across the southwestern border.

Continue reading

Leave a comment

Filed under anthropogenic change, Climate Change, data visualization, global warming, weather maps

Freezing Time, Seaweed, and the Biologic Imaginary

We can all too easily lose sight of the centrality of seaweed plays in coastal habitat–even in Northern California, where seaweed washes up regularly in clumps and beds along the shore. Bull kelp and other marine plants on the sandy beaches of northern California seem otherworldly representatives of a removed marine world, but their proximity is revealed in remote mapping that promises to remap the role of seaweed in coastal ecosystems, and offer a picture of the terrifying prospects of ocean warming and climate change.

The relatively recent contraction of kelp forests across much of the offshore where they long provided such dense habitats may soon start to contract in ways never before experienced. The remapping of kelp forests, and the problems of their contraction of treasured habitat, reveal how much coastal waters demand to be seen not as so separate from the land, but part of a complex ecotone–a region where land and sea interact. Underwater species impact a large ecosystem that provides atmospheric oxygen, integral to coastal biodiversity that imparts a specific character to the California coast, and a sense of where we are–as well as makes it a destination for countless Pacific pelagic, shorebirds, and insects, as well as shellfish and fish. But the decimation of kelp forests, tied to an absence of predators to urchins, but more broadly to the ocean warming of coastal waters, as well as potentially an unprecedented increase in coastal pollution, makes both the mapping of the shrinking of kelp forests and the deciphering of that shrinking pressing problems of mapping, destined to impact a large variety of ocean and land-dwelling species.

The need for such mapping underscores all of our relation to the vital ecosystem of the shores and coastal ocean–even if we too often bracket it from our daily lives. While beached kelp may be present before our eyes, the problems of mapping of kelp forests with any fixity complicates how we process the disappearance of offshore kelp beds in an amazingly rapid timeframe. And the failure of creating an actual image capture registering the extent of kelp forests poses limits our awareness of their diminution off coastal waters. The observations of the shrinking of coastal spread of bull kelp is based on local aerial surveys, over a relatively small span of time, the accelerated roll-back of a once-vital region of biodiversity is both global, and demands to be placed in a long-term historical perspective of the way we have removed the underwater and undersea from our notion of coastal environments and of a biosphere.

Bull kelp forest coverage at four sites on the North Coast of California,from aerial surveys (California Dept. of Fish and Wildlife)

What was first registered in the plummeting of abalone, and the wasting disease of sea stars, afflicting stars from Baja to Alaska in 2013, suggest a condensation of a radical change in near-coastal environments of global proportions, paralleled by the arrival of warm waters that are not conducive to kelp growth, even before El Nino, and before the the arrival of purple urchins whose levels stars controlled, as if the result of cascading effects of a tipping point atmospheric change.

The quite sudden growth on the ocean floor of “sea urchin barrens,” where the near coastal waters are cleared of seaweeds and kelp, is a global problem. As global oceans absorb warmth of increased global warming, near-shore environments are particularly susceptible to species changes that create large disequilibria–from the bloom of phytoplankton to the rise of purple sea urchins and the dearth of shellfish–that stand to change coastal oceans. Yet the same creatures are often ones that fall of outside of our maps, even if the presence and scale of massive kelp beds and submerged forests are hard to map. And even if we see a shrinking of the large undersea submerged beds of kelp off coastal California, it is hard to have clear metrics of their shrinking over time or past extent–or of intervening in their reduction, which we seem forced to watch as inland spectators.

NASA Earth Observatory., image by Mke Taylor (NASA) using USGS data

Indeed, if the presence of coastal seaweed, and the distinctive kelp forest of California’s coastal ocean seems the distinguishing feature of its rich coastal ecology, the holdfasts of kelp forests that are grazed down by sea urchins and other predators are poorly mapped as solely underwater–they are part of the rich set of biological exchanges between the ecotone of where land meets sea, and ocean life is fed by sediment discharge and polluted by coastal communities, as much as they should be mapped as lying offshore, at a remove from the land. Yet the death of beds of kelp that is occurring globally underwater is cause for global alarm.

For from Norway to Japan to but the decline of natural predators of urchins in California has made a rapid rise of urchins on the seafloor along the coast have contributed to a shrinking of once-abundant kelp forests that produce so much of our global atmospheric oxygen. And these hidden underwater changes seem destined to rewrite our globe, as much as climate change, and threaten to change its habitability. Even as large clumps of seaweed are removed by powerful waves, that deposit piles of offshore forests ripped from holdfasts on beaches in northern California, the narrative of large coastal kelp deposits, their relation to climate change and coastal environment demands to be better mapped, as the transition of kelp to barrens afflicts so much of the coastal waters of the Atlantic and Pacific, at so many different latitudes and across such a variety of local cold water ecologies.

While the decline of kelp forests seems as radical as the clear-cutting of redwoods, it is both far more rapid and far more environmentally disruptive, if far less visible to the human eye.For in recent decades, increasingly warming waters and out of whack ecosystems have led to a massive decline of seaweed, decimated by a rise in the sea urchin population to by 10,000 percent off the California coast over only last five years, shrinking kelp forests that stand to catapult us to a future for which we have no map. The long-term decline in sea otters and sea stars, natural predators of the urchins, have removed constraints on urchin growth, which warming waters has encouraged, reducing a historical abundance of kelp in the near coastal waters across California.

This has perhaps been difficult to register due to the problems of mapping seaweed, and indeed registering kelp forests’ decline. The advance of sea urchin populations that have created barrens in coastal waters stands to disrupt and overturn some of the most abundant ecological niches in the global oceans. How has this happened under our eyes, so close tho shore and lying just undersea? We have few real maps of seaweed or kelp, lurking underwater, rather than above land, and leave out kelp from most of our maps, which largely privilege land. But the abundance of kelp that produce most of the global oxygen supply live in underwater ecotones–sensitive places between land and sea, in-between areas of shallow water, abundant sunlight, and blending of land and sea–an intersection, properly understood, between biomes, on which different biological communities depend.

Looking at the offshore seaweed near Santa Cruz, CA, I wondered if the predominantly passive registration of location–onshore registration of sites remotely by satellites, familiar from the harrowing images of the spread of fires, provided a basis to register our states of emergencies that was spectacularly unsuited to the contraction of coastal kelp, despite the huge advances of mapping techniques, and left us without a map to their contraction, or to register the subtle if radical consequences of kelp loss, and the almost as devastatingly rapid progress of their advance as populations of urchins have mowed down underseas kelp beds. For even as we strike alarms for the the decline of global kelp populations and seaweed forests as a result of the warming of offshore temperatures that place the near offshore regions at special risk of atmospheric warming–

Paul Horn, Inside Climate News/Source Wernberg and Staub,
Explaining Ocean Warming (IUCN Report, 2016)

–we lack maps of the place of seaweed and kelp beds in their ecotone, and indeed have no adequate maps of seaweed populations under threat.

Continue reading

Leave a comment

Filed under climate change, global warming, oceans, remote observation, seaweed

Saturated Shores in Southeastern Texas

There is almost no trace of the human, or of the extreme overurbanization of the Texas coast, in most of the maps that were created of the extreme flooding and intense winter rains that hit Galveston and Houston TX with the windfall of Hurricane Harvey.  While maps serve to orient humans to the world–and orient us to human processes and events in a “human world,” as J.B. Harley and David Woodward put it, the confused nature of relations between the human and natural world, is increasingly in danger of being mipmapped.  Data visualizations of extreme weather that erase the modification of coastal environments provide a particularly challenging means of orientation, as news maps are suspended between registering the shock of actual events–and trying to contain the natural emergencies that events of extreme weather create–and the demand for graphics that register natural calamities and the ethics of showing such calamities as “natural”–or even what the category of the natural is in coastal regions that so heavily modified to modify actual weather events.

The ethics of orienting viewers to the rainfall levels that fell in Houston after the landfall Hurricane Harvey Part of the huge difficulties lies in adequately orienting viewers in ways that register a changing natural world–how we are mapping rainfall, for example, or the approach of hurricanes, or are rather mapping the new relation of rain to built surfaces and landcover change that lack permeability for water, facilitating flooding by storms whose potency is changed by the greater atmospheric content of a warming Gulf of Mexico, which the ground cover of Houston, Galveston, and the Texas shore are less able to absorb and return to the Gulf. The area is, itself, something of an epicenter of the increased number of hemispheric tropical cyclones–which demand warm water temperatures above 80 80°F / 27°C and a cooling atmosphere and low wind shear–often led to the Gulf coast.

NASA Earth Observatory/Tropical Cyclones through 2006

–those that come ashore at Galveston hit a seashore that is eminently unprepared to accommodate an influx of water that the paved surface has rendered all but impermeable. If the problem of global cyclones that can become hurricanes is truly global–

NASA Earth Observatory/150 years of Tropical Cyclones

–the intersection between cyclones and areas of paved ground cover is problematic to the southwestern states, and most of all to Texas, Louisiana, and Florida, where water absorption has been anthropogenically reduced in recent decades. At the same time, few other areas of the inhabited world are so widely “tracked” as the destination of tropical cyclone formation..

NWS JetStream Online School)

The problem is partly evident in the choice of new color ramps that transcend the rainbow spectrum of measuring the intensity of rainfall in the recent arrival or ground fall of Hurricane Harvey, which condenses the great difficulty of using old cartographical categories and conventions in order to capture or communicate increasingly extreme weather conditions. in an era of climate change.  But the cartographic problem goes farther:  for it lies in the difficulty of registering the changes in relations f how rain dropped meets the ground, mapping relations between complex processes of warming and atmospheric warmth that lead to greater humidity across the gulf region to ground cover permeability that leaves regions increasingly exposed to flooding.

The relentless logic of data visualizations based on and deriving primarily from remote sensing are striking for rendering less of a human world than the threat of allegedly “natural” processes to that world.  Perhaps because of the recent season of extreme weather we have experienced, weather maps may be among the most widely consulted visualizations in our over-mediated world, if they were already widely viewed as the essential forms of orientation.  But the pointillist logic of weather maps may fail to orient us well to extreme events as the hurricane that dumped a huge amount of water on overbuilt areas to include the human–or the human world–seem a tacit denial of the role of humans in the complex phenemona of global warming that have, with the warming waters of the Gulf of Mexico and ever-increasing ozone over much of the overbuilt southeastern Texas shore, created a perfect storm for their arrival.

This failure to include this role haunts the limited content of the weather map; including the role of humans in maps of extreme weather events indeed remains among the most important challenges of weather maps and data visualization, with the human experience of the disasters we still call natural.  And although the subject is daunting, in the spirit of this blog, we will both look at the communicative dilemmas and difficulties of eye-catching color ramps and their deceptiveness, and poetic difficulties of orienting oneself to shores.  For as the disaster of Harvey is depressing, it compels raising questions of the orientation to the shifting shore, around the national epicenter of Galveston, where the landfall of Hurricane Harvey focussed our attention on August 27, 2017–

90-7
wpc-5day-0Z-8.28.17

–and the meaning of place in an saturated shoreline, where the sea is somehow part of the land, and the land-sea divide blurs with a specificity that seems as if it may well be increasingly true in an approaching era of climate change.  And as we depend on the ready generation of maps based on remote sensing whose relentless logic is based on points, we risk looking sight of the role of place in determining the relations of rainfall to shoreline in maps of coastal flooding that remove remote observations from the built environment that flooding so drastically changes, challenges and affects, in ways that may elide specificities of place.

At a time when we are having and will be destined to have increased problems in orienting ourselves to our shores through digital maps of rainfall, the unclear shorelines of Galveston sent me to the bearings that a poet of an earlier age took her bearings on the mapped shorelines of the place where she had been born, and how she was struck by a bathymetric map to gauge her personal relation to place, and saw place in how the changing shoreline of the northern Atlantic were mapped in the maritimes, in a retrograde form of print mapping in a time of war.  For the way the mapped shore became a means by which Elizabeth Bishop gained bearings on shores through a printed map of coastal bathymetry to access the spatiality of the shore–how “land lies in water” and the blurred relation of land and water that the bathymetric map charts–in an age when the materiality of the map was changing, with the introduction of aerial composite maps from the early 1930s, as the rise of aerial composite maps removed the hand of the mapmaker from the map in an early instance of remote sensing–

5852167

Cartography Associates/David Ramsey: Historical Map Collection: Composite of 164 Aerial Views of San Francisco by Harrison Ryker/Oakland, 1938, 1:2000

–in a medium of aerial photography that focussed on land to the exclusion of water, and that all but erased the relation between water and shore just a few years after Bishop quickly wrote her poem in Christmas 1935 about coastal “edges” of land and sea.  Ryker, who developed techniques of aerial photography used in the mapping of the shores of Puerto Rico for the Fairchild Aerial Camera Company, as well as photographs of the devastating Berkeley Fire of 1923, went into business in 1938–the year of his map–as a map publisher, with a patent for the stereoscope used to interpret aerial imagery,  and must have performed the massively detailed mapping of San Francisco in one hundred and sixty for images taken from airplanes from 1937-38 as a sort of calling card, soon after Bishop wrote her poem, before manufacturing a range of stereoscopes of pocket and desktop versions for military ends that were widely used in World War II by the US Army.

Before war broke out, but in ways that anticipated the coming war, the printed bathymetric map must have resonated as a new reflection on the impersonality of the aerial view; Bishop was suddenly struck when she encountered the materiality of a print map on Christmas 1938 as the art of cartography was already changing, responding to the drawn map under glass of the Atlantic as a way to recuperate the personal impact of place.  Her poem powerfully examined the logic of drawn maps utterly absent from the digitized space of rainfall maps of a flood plain, deriving from data at the cost of human inhabitation of place–and in envisioning data to come to terms with the catastrophic event of flooding distancing or removing the craft of mapmaking from the observer in dangerously deceptive ways.  And so after wrestling with the problems of cartographic representation using remote sensing, while recognizing the value of these readily produced maps of rainfall and the disasters they create,

1.  For weather maps are also among the most misleading points to orient oneself to global warming and climate change, as they privilege the individual moment, removed from a broader context of long-term change or the human alteration of landscape.  They provide endless fascination by synthesizing an encapsulated view of weather conditions, but also  suggest a confounding form of media to orient audiences to long-term change or to the cascading relations of the complex phenomenon of climate change and our relation to the environment, as they privilege a moment in isolation from any broader context, and a sense of nature removed from either landscape modification or human intervention in the environment, in an area were atmospheric warming has shifted sea-surface temperatures.  The effects on the coast is presented in data visualizations that trace the hurricane’s “impact” as if its arrival were quite isolated from external events, and from the effects of human habitations on the coast.  The image of extreme flooding is recorded as a layer atop a map, removing the catastrophic effects of the flooding from the overpaved land of the megacities of southeastern Texas, and the rapid paving over of local landcover of its shores.

90-7

.

Such visualizations preserve a clear line between land and sea, but treat the arrival of the rains on land as isolated from the Consuming such events of global warming in color-spectrum maps.  The data of rainfall translate data into somewhat goofy designs represents a deep alienation from the environment, distancing viewers in dangerous ways from the very complexity of global warming that Gulf coast states encountered.

Such data visualizations seem dangerously removed notion of how we have changed our own environment, by describing a notion of “nature” that is immediately legible, as if it were removed from any human trace or of the impact of modification of the land, and by imaging events in isolation from one another–often showing a background in terrain view as if it has no relation to the events that the map describes.  Although weather maps and AccuWeather forecasts are sources of continual fascination, and indeed orientation, they are are also among the most confounding media to orient viewers to the world’s rapidly changing climate–and perhaps among the most compromised.  For they imply a remove of the viewer from space-and from the man-made nature of the environment or the effects of human activity form the weather systems whose changes we increasingly register.  By reifying weather data as a record of an actuality removed from human presence at one place in time, they present a status quo which it is necessary to try to peel off layers, and excavate a deeper dynamic, and indeed excavate the effects of human presence in the landscape or geography that is shown in the map.  We are drawn to tracking and interpret visualizations of data from satellite feeds in such weather maps–or by what is known as “remote sensing,” placed at an increased remove from the human habitation of a region, and indeed in a dangerously disembodied manner.

Visualizations resulting from remote observation demand taken as a starting point to be related to from the human remaking of a region’s landscape that has often increasingly left many sites increasingly vulnerable to climate change.  But the abstract rendering of their data in isolation from a global picture–or on the ground knowledge of place–may render them quite critically incomplete.  The remove of such maps may even suggest a deep sense of alienation form the environment, so removed is the content of the data visualization form human presence, and perhaps from any sense of the ability to change weather-related events, or perceive the devastating nature of their effects on human inhabitants:   their stories are about weather, removed form human lives, as they create realities that gain their own identity in images, separate from a man-made world, at a time when weather increasingly intersects with and is changed by human presence.  While throwing into relief the areas hit by flooding near to the southeastern Texas shore at multiple scales based on highly accurate geospatial data, much of which is able to be put to useful humanitarian uses–

Harvey flooding_1.jpg

Dartmouth Flood Observatory/University of Colorado at Boulder, August 29. 2017

1504094467hurricane-harvey-flood-map.gif

Maps of the World

–the reduction of floods to data points creates a distorted image of space renders their occurrence distant from the perspective of folks on the ground, and places their content at a considerable remove from the complex causality of a warming Gulf of Mexico, or the problems of flood drainage by which Galveston and Houston were beset.  Indeed, the multiple images of that report rainfall as an overlay in a rainbow spectrum, at a remove from the reasons for Houston’s vulnerability to flooding and the limits the region faces of flood control, in broadcast Accuweather images of total rainfall in inches advance a metric that conceals the cognitive remove from the dangers of flooding, ora human relation to the landscape that the hurricane so catastrophically affected.  Can we peel under the layers of the data visualization, and create better images that appreciate the human level on which the landscape stands to be devastated by hurricane rains, as much as tracking the intensity of the growth of rainfall over time?

90-5.jpeg

AccuWeather, Rainfall levels by Thursday

90

AccuWeather, Friday to Monday

Such layers of green, meant to suggest the intensity of rainfall that fell over land, reveal the concentration of water in areas closes to the Gulf of Mexico.  Even the most precise geographical records of the dangers of flooding in the floodplain of southeastern Texas with little reference to the historical modification of the region by inhabitants–

Harvey flooding_1

Dartmouth Flood Observatory at University of Colorado, Boulder/August 29, 2017

–and conceal the extent to which the landscape’s limited ground cover permeability has left the region far more susceptible to flooding, and elevated the risks of the emergency.  The problem of reading any signs of human presence into these “images” of precipitation provoke problems of disentangling remote sensing data from knowledge of the region’s recent urban growth and the consequent shift in local landcover.

The perspective of our relation to these events is often as fleeting and as existential as they flood us with data, which we viewers have little perspective or tools to process fully.  The onrush of recent remote sensing maps batter us with an array of data, so much as to lead many to throw up their hands at their coherence.  Even as we are  still trying to calculate the intensity of damages in Puerto Rico–where electricity is so slowly returning that even even after four months, almost a third of its 1.5 million electricity customers still lack power–and the cost of fires in southern California.  We look at maps, hoping to piece together evidence of extensive collateral damage of global warming.  Yet we’ve still to come to terms with the intensity of rainstorms that hit southeastern Texas–deluging the coast with rainfall surpassing the standard meteorological chromatic scale that so misleadingly seems to offer a transparent record of the catastrophe, but omits and masks the experiences of people on the ground, digesting swaths of remotely sensed data that take the place of their perception and experience, and offering little critical perspective on the hurricane’s origin.

The rapidity with which rain challenged ground cover permeability provides both a challenge for mapping as a symptom of global warming and landscape modification:   the mapping of “natural” levels of rainfall blurs the pressing problem of how shifting landcover has created an impermeability to heightened rains, and indeed how the new patterns of habitation challenge the ability of the coast of the Gulf of Mexico to absorb the prospect of increased rain in the face of decreasing groundcover permeability, and the extreme modification of the coastline that increasingly impeded run-off to the Gulf.

2.  Across much of southeastern Texas, a region whose growth was fed by the hopes of employment in extractive industries, real estate demand and over-paving have unfortunately intersected with extreme weather in southeastern Texas in ways which dat visualizations have had trouble exposing, but which raise a curtain on the coming crises of a failure of ability to accommodate increased levels of rainfall  If the lack of precedent for the intense rainfall in Galveston Bay generated debate about introducing a new color that went beyond the rainbow scale employed in weather charts, what seemed a problem of the cartographic color-spectrum suggested a problem of governability and indeed government response to extreme weather conditions.  How to register the dangers of rainfall that goes of the scale or standards of measurement?

One must consider how to orient viewers to the intensity of consequent flooding, and to its consequences and better prepare ourselves for the arrival of deluging rains without falling back on the over-freighted metaphor of rains of biblical scope.  How many more hurricanes of increasing intensity can continue to pound the shores, by whipping precipitation from increasingly warming waters and humid air?  The cumulative pounding of tropical cyclones in the Gulf stands to create a significantly larger proportion of lands lying underwater–temporarily submerged lands–with radically reduced possibilities of drainage, as hurricanes carry increased amounts of evaporated water from the humid air of the warming gulf across its increasingly overbuilt shores. in ways that have changed how the many tropical cyclones that have crossed the land-sea threshold since NOAA began tracking their transit (in 1851) poses a new threat to the southeastern coast of Texas, and will force us to map the shifting relation between land and water not only in terms of the arrival of hurricanes, or cyclonic storms–

–but the ability of an increasingly overbuilt landscape to lie underwater as the quantity of the Gulf coast rainfall stands to grow, overwhelming the overbuilt nature of the coast.

Most maps that chart the arrival and impact of hurricanes seem a form of climate denial, as much as they account for climate change, locating the hurricanes as aggressive forces outside the climate, against a said backdrop of blue seas, as if they  are the disconnect.  Months after the hurricane season ended, the damage for hurricanes caused have hardly been assessed in what has been one of the most costly and greatest storm damage since 1980 in the United States,–including the year of Hurricane Katrina–we have only begun to sense the damage of extreme weather stands to bring to the national infrastructure.  The comparison to the costs of storm damage in previous years were not even close.

But distracted by the immediacy of data visualizations, and impressed by the urgency of the immediate, we risk being increasingly unable to synthesize the broader patterns of increased sea surface temperatures and hurricane generations, or the relations between extremely destructive weather events, overwhelmed by the excessive destruction of each, and distracted from raising questions about the extremely poor preparation of most overbuilt regions for their arrival, and indeed the extent to which regional over-building that did not take the possibility of extreme weather into account–paving large areas without adequate drainage structures or any areas of arable land–left inhabitants more vulnerable to intense rains.  For in expanding the image of the city without bounds, elasticity, or margins for sea-level rise, the increasingly brittle cityscapes of Galveston and much of the southeastern Texas shoreline were left incredibly unprepared for the arrival of hurricanes or intense rains.  Despite the buzz of an increased density of hurricanes to have hit the region,

1851_2013_mjrhurr2

the questions of how to absorb hurricanes of the future, and to absorb the increased probability of rainfall from hurricanes in the Gulf of Mexico and its shores, suggests questions of risk, danger, and preparation that we have no ability to map.  What, indeed, occurs, as hurricanes themselves destroy the very means of transmitting on the ground information and sensing weather, and we rely exclusively on remote sensing?

Destroyed satellite dishes after Hurricane Maria hit Humacao, Puerto Rico  REUTERS/Alvin Baez

To characterize or bracket these phenomena as “natural” is, of course, to overlook complex interaction between extreme weather patterns and our increasingly overbuilt environments that have both transformed the nature of the Southeastern Texas coast and have made the region both an area of huge economic growth over time, and have paved over much of the floodplain–as well as elevated the potential risks that are associated with coastal flooding in the Gulf Coast.  To be sure, any discussion of the Gulf of Mexico must begin from the increasingly unclear nature of much of our infrastructure across land and sea, evident in the range of pipelines of gas and oil that snake along a once more clearly defined shore charted by ProPublica in 2012, revealed the scope of the manmade environment that has both changed the relation of the coastal communities to the Gulf of Mexico, and has been such a huge spur to ground cover change.

The expansive armature of lines that snake from the region across the nation–

pipeline_line_map

ProPublica, Pipeline Safety Tracker/Hazardous liquid pipelines are noted in red; gas in blue

-and whose tangle of oil pipelines that extend from the very site of Galveston to the Louisiana coast is almost unable to be defined as “offshore” save as a fiction, so highly constructed is much of the national waters in submerged lands in the Gulf of Mexico–

gulfofmexicopipelines

ProPublica, Pipeline Safety Tracker/Hazardous liquid pipelines are noted in red

They indeed seem something of an extension of the land, and a redefinition of the shore, and reveal a huge investment of the offshore extractive industries that stand to change much of the risk that hurricanes pose to the region, as well as the complex relation of our energy industries to the warming seas.  Yet weather maps, ostensibly made for the public good, rarely reveal the overbuilt nature of these submerged lands or of the Gulf’s waters.

Despite the dangers that such an extensive network of hazardous liquid lines along the Gulf of Mexico, the confusion between mapping a defined line between land and water, and visualizing relations of extreme weather disturbances as hurricanes in the Gulf of Mexico and local infrastructure haunts the extremely thin nature of the sort of data visualizations that are generated about the dangers of hurricanes and their landfall in the region.  For all too often, they presume a stable land/sea divide, removed from the experience of inhabitants of the region and how we have remade the shore.

3.  How can we better integrate both a human perspective on weather changes, and the role of human-caused conditions in maps of extreme weather?  How can we do better by going beneath the data visualizations of record-breaking rainfall, to map the human impact of such storms?  How could we do better to chart the infrastructural stresses and the extent to which we are ill-prepared for such extreme weather systems whose impact multiplies because of the increased impermeability of the land, unable to absorb excessive rainfall, and beds of lakes and reservoirs that cannot accommodate increased accumulation of rainfall that  stand to become the new normal?  The current spate of news maps that provoke panic by visualizing the extremes of individual cases may only inspire a sort of data vis-induced ADD, distracting from infrastructural inadequacies to the effects of global warming–and leaving us at a loss to guarantee the best structures of governability and environmental readiness.

Indeed, the absence of accurately mapping the impact and relation between landcover, storm intensity, rainfall, flooding, and drainage abilities increases the dangers of lack of good governance.  There need not be any need for a reminder of how quickly inadequate mapping of coastal disasters turns into an emblem of bad governance.  There is the danger that, overwhelmed by the existential relation to each storm, we fail to put them together with one another; compelled to follow patterns of extreme weather, we risk being distracted from not only the costs but the human-generated nature of such shifts in seasons between extremes of hot and cold.  For as we focus on each event, we fail to integrate a more persuasive image of how rising temperatures stand to create an ever-shifting relation between water and land.

Provoked by the rhetoric of emergency, we may need to learn to distance ourselves better from the aerial views that synthesize intense precipitation, tally hurricane impacts, or snowfall levels, and view them less as individual “strikes” or events and better orient ourselves to a broader picture which put us in a less existential relation to extreme weather.

2017-four-us-hur-landfalls_3

The Weather Channel

We surely need to establish distance to process syntheses of data in staggering aerial views on cloud swirl, intense precipitation, and snowfall, and work to peel back their striking colors and bright shades of rainbow spectra, to force ourselves to focus not only on their human costs, or their costs of human life, but their relation to a warming planet, and the role of extreme of weather in a rapidly changing global climate, as much as track the “direct strikes” of hurricanes of individual names, as if they were marauders of our shores:  their creation is as much tied to the changing nature of our shores and warming sea-surface temperatures, and in trying to create a striking visualization, we deprive ourselves from detecting broader patterns offering better purchase on weather changes.

direct-strikes

The Weather Channel

If patterns of weather maps epitomized by Accuweather forecast and projections suggest an exhilaratingly Apollonian view on global and regional weather patterns, they also  shift attention form a broader human perspective in quite deeply pernicious ways.  Such maps provided the only format for grasping the impact of what happened as the hurricane made landfall, but provided little sense of the scale of inundations that shifted, blurred and threatened the coast of the Gulf of Mexico.  They provide a format for viewing floods that are disjoined from victims, and seem to naturalize the quite unnatural occurrence of extreme weather systems.  Given the huge interest in grasping the transformation of Hurricane Harvey from a tropical storm to a Category Four hurricane, and the huge impact a spate of Category Four hurricanes have created in the Gulf of Mexico, it’s no surprise that the adequacy of the maps of Hurricane Harvey have been interrogated as hieroglyphs or runes of a huge weather change:  we sift through them for a human story which often left opaque behind bright neon overlays, whose intensity offer only an inkling of a personal perspective of the space or scale of their destruction on the ground:  while data maps provide a snapshot of the intensity of rain-levels or wind strength at specific sites, it is difficult if important to remember that their concentration on sites provide a limited picture of causation or complexity.

All too often, such maps fail to offer an adequately coherent image of disasters and their consequences, and indeed to parse the human contributions to their occurrence.  This post might be defined into multiple subsections.  The first actions suggest the problems of mapping hurricanes in the Gulf of Mexico in relation to flooding in data visualizations of the weather and the overbuilt region; the middle of the post turns to an earlier poetic model for considering the relation between land and sea that visualizations all too easily obscure, and the meaning that the poet Elizabeth Bishop found in viewing relations between land and sea in a printed map of the Atlantic; after returning to the question of the overbuilt shore compounds problems of visualizing the Texas coast, the final section, perhaps its most provocative, returns to Bishop’s reading of a map of the Atlantic coast.

What such new weather maps would look like is a huge concern.  Indeed, as we depend on weather maps to orient us to place ourselves in the inter-relations of climate change, sea-level, surface temperatures, and rain, whether maps cease to orient us to place, but when best constructed help to describe the changing texture of weather patterns in ways that can help familiarize us not only to weather conditions, but needed responses to climate change.  For  three months after the hurricanes of the Gulf of Mexico caused such destruction and panic on the ground, it is striking not only that few funds have arrived to cover costs of rebuilding or insurance claims, but the judgement or understanding of the chances for future flooding have almost left our radar–perhaps pushed rightly aside by the firestorms of northern and southern California, but in ways that troublingly seem to forget to assess or fail to assess the extent of floods and groundwater impermeability  along the Texas and Louisiana coast.  The problems that preparation for future coastal hurricanes off the Gulf of Mexico raise problems of hurricane control and disaster response that seem linked to problems of mapping their arrival–amd framing the response to the increasing rains that are dumped along the entire Gulf Coast.

Indeed, the chromatic foregrounding of place in such rainbow color ramps based on GPS obscure other maps.   Satellite data of rainfall are removed from local conditions, and serve to help erase complex relations between land and water or the experience of flooding on the ground–by suggesting a clear border between land and sea, and indeed mapping the Gulf of Mexico as a surface as if it were unrelated to the increased flooding around Houston, in maps prepared from satellite imagery, despite the uneasy echoes of anthropogenic causes for the arrival of ten hurricanes in ten weeks, in ways that suggest how warming waters contributed to the extreme inundation of the Gulf Coast.  Despite NOAA  predictions of a 45% likelihood of ‘above-normal’ activity for the 2017 Atlantic hurricane season, with, a 70% likelihood of storms that could transform into hurricanes, the images of inundated lands seem both apocalyptic and carefully removed from the anthropogenic changes either to the ocean or land that intensified their occurrence so dramatically on the ground.

Dartmouth Flood Observatory Flooding Harvey

 Dartmouth Flood Observatory

Harvey flooding_0.jpg

Dartmouth Flood Observatory/August 29, 2017

Is it possible to recuperate the loss of individual experience in such data maps, or at least acknowledge their limitations as records of the complexity of a changing climate and the consequences of more frequent storm surges and such inundations of rainfall?  As we seek better to understand the disaster relief efforts through real-time maps of effects of Hurricane Harvey as it moved inland from the Gulf of Mexico, shifting from Category 4 Hurricane from a tropical storm, we tried to grasp levels of rainfall that spun out of 115-mile-an-hour winds across southeastern Texas that damaged crops, flooded fields, ruined houses, and submerged cars, we scan stories in hope of clues to assess our position in relation to increasingly dangerous weather systems whose occurrence they may well forebode.  At a time of increased attention to extreme weather has long developed, the gross negligence of climate change denial is increasingly evident:  it recalls the earlier denial of any relation between hurricanes and climate change, when increased hurricanes were cast as “the cycle of nature,” rather than as consequences whose effects have in fact been broadly intensified by human activity.

Current attempts to map the toll of record-smashing hurricanes focused almost exclusively on point-based data view rainstorms largely as land-based records; even as they intend to monitor the effects of Harvey’s landfall by microwave censors, they risk seeming to isolate real-time rainfall levels from the mechanics warmer air and sea-surface temperatures which result from human-caused global warming, not relating increased storm surges or inundations to achanges in coastal environments or climate change.  To render such changes as natural–or only land-based–is irresponsible in an age of reckless levels of climate denial.  Indeed, faced by the proliferation of data visualizations, part of the journalistic difficulty or quandary is to integrate humanistic or individual perspectives on the arrival of storms, rendered in stark colors in the increasingly curtailed ecosystems of newsrooms which seek simplified visualizations of satellite data on the disaster, which fail to note the human contributions to the travails that are often reserved for photographs, which increasingly afford opportunities of disaster tourism in the news, emphasizing the spectator’s position before disasters, by images that underscore the difficulties in processing or interpreting the proliferation of data from MODIS satellite feeds:  we can show the ability to measure the arrival of torrential rains, but in offering few legends, save the date and scale, but offering few keys o interpret the scale of the disaster.

The looming portent of human-made climate change, however, underlies the poor predictions that NOAA offered of perhaps 2-4 major hurricanes this Spring, and the lack of a new director for NOAA–on which local and state agencies depend to monitor the nations shores and fisheries–suggested the, from June to September, which left states on their own to make decisions and plan for disaster mitigation programs and better flood maps.  (The danger of appointing a newly nominated director, Barry Myers, who is a strong supporter of the privitization of weather maps and an executive at the private Accuweather mapping service, suggests the difficulty of determining the public-private divide in an era of neoliberalism, and a free market of weather maps that were once seen as central to national security and standards of safety.)   There are two hidden scales on which we read these opaque maps of global warming and globalization and local inundation are triply frustrating.   For all the precision and data richness of such point-maps of largely land-based rainfall, local temperature, or flooding, the biases of such instantaneous measurements seem to fit our current governing atmosphere of climate change denial, and dangerous in erasing how such storms are informed by long-term consequences of man-made climate change.  (As the mapping tools of coastal weather seem destined to change, what sort of change in direction for NOAA coastal maps do we want:  the appointment suggests the terrifying possibility of a return to the Bush-era proposal nominee Myers supported that prohibiting the agency from producing any maps already available in the private sector then threatened federal weather lines to go dark–lest they literally compete with ad-supported websites private providers–and shift federal information offline?)

For making moves toward the future readability of weather maps may well be at stake in critically important ways.  The 2005 proposal that Myers backed would have eliminated the National Weather Service, even while exempting those forecasts needed to preserve “life and property,” would in essence have returned the weather services to a pre-internet era, even as the most active hurricane season including a record breaking fifteen hurricanes and twenty-eight storms began in the gulf coast, including the infamous hurricane Katrina.  The proposed bill would have prevented NOAA from posting open data, and not only readily available to researchers and policymakers, in ad-free formats, free of popup screens, but allow them to make their own maps on the fly–ending good practices of posting climate data would work quite dangersously to prevent development of tools of data visualization outside commercial models of rendering storms and hurricanes as if environmentally isolated.

2005-tracks-update.jpg
direct-strikes

A deeper problem of providing such limited weather maps of tropical storms may be the subtexts about the relation of human causes to weather they convey, and the absence of a greater narrative of the transformation of a global ecology or of the ecology of the Gulf Coast.  The curtailed images of “nature” they present by symbolizing rains, winds, floods, or submerged regions in appealing hues as natural–raise questions of the odd simplicity of the absent storylines:  cheery colors erase or bracket complex questions of climate change, the human contribution to extreme weather events, or the human experience of suffering on the ground:  Rita, Cindy, Katrina, Dennis, and Wilma seem not part of the environment, epiphenomenal interlopers moving across a static deep blue sea, in an apparent dumbing down of the mechanics of hurricane or storm formation in a rainbow spectrum removed from a human-made environment.

Continue reading

Leave a comment

Filed under anthropogenic change, climate change, coastlines, ecological disasters, gulf coast

We Think Our Shores Are Stable,–but Need to Know that They Are Not

All maps stake propositions:  as much as embody geographical information, they make arguments about how a landscape is inhabited.  But climate change maps that model future scenarios of warming, increasing dryness, sea-level rise, or glacial melting are propositions in a strict sense, as they construct frames of reference that orient us to, in the very ways Wittgenstein described propositions, “a world as it were put together experimentally.”  Shoreline change can be mapped in deep historical time, or over the past century, in interactive ways that reveal and allow us to zoom in on individual sites of sensitivity–


national_shoreline


–but the processes of mapping such change cannot rely on contour lines drawn on a base map.  For to do so is to abstract a static photograph from a global process that they only compel one to try to better visualize and comprehend.  The processes of change are extremely complex patterns of causation that exceed most map-viewers competencies, despite the wide diffusion of claims and counter-claims about global warming and climate change in public discourse, which has effectively increasingly threatened to dislodge the preeminence of any position of expertise on the issue, demoting the actuality to a theory and removing many public statements on its existence from the map of coastal change, or the relation of the land to submerged territory.  We are in danger of adopting an increasingly terrestrial or land-locked relation to how climate change affects shores, because we map from the boundary of the landform, as if it were fixed rather than a frontier of interchange and exchange, both above an under ground.


coastal-map-usa-usgs-marine


Far more than other maps, maps of climate change demand unique training, skills, and education to unpack in their consequences.  And when the propositions staked in maps of climate change have increasingly come under attack for political implications, as if the scenarios of climate change are formed by a cabal of data scientists and climate scientists to advance independent agendas, or a poorly articulated and politicized climate research, it seems that the special skills used to interpret them and the training to view them have come under attack for not corresponding to the world.

Real fears of the danger of the delegitimization of science run increasingly high.  But attacking the amazingly dense arrays of data that they synthesize seems to suggest an interest in shutting down the very visualizations that allowed us to conceive and come to terms with climate change.  The open suggestion that digitized scenarios of climate maps were only designed to terrify audiences and advance interests not only undermines discussion and debate, but seems a technique to destabilize the emergence of any consensus on climate change.  Although the fears of an immediate loss of climate data may be overstated for the nation, the loss of a role in preserving a continuous record of global climate data is considerable given fears of reducing space-based remote sensing.  Such observation provide one of the only bases to map global climate data, ranging from aridity to water temperature to temperature change over time.  The hard-line stances that Trump holds about climate sciences are expressed in terms of the costs they generate–“very expensive GLOBAL WARMING bullshit,”–but extend to denigration of climate scientists as a “glassy-eyed cult” by science advisor William Happer–who in George W Bush’s Dept. of Energy minimized the effect of man-made emissions on climate change.

Both bode poorly for the continued funding of the research agenda of NASA’s earth sciences division.  And the need to preserve a more coherent maps of man-made climate change grow, choosing the strategies to do so command increased attention.  The dangerous dismissal of climate sciences as yet another instance of “listening to the government lie to them about margarine and climate change” or prioritizing the political impact of their findings to draw attention to global warming and climate change seems to minimize the human impact on climate and recall the censorship of climate science reports from government agencies by governmental agencies and political appointees from a time when de facto gag orders dissuaded use of the term “global warming” over a period of eight years, a period of the harassment and intimidation of climate scientists. The term of “climate change” seemed agnostic of human agency–unlike Al Gore’s conviction that “global warming” was a global emergency.  As well as actively destabilizing ties between human-caused emissions of carbon dioxide and other heat-trapping gases with global warming, Bush asked government agencies investigate “areas of uncertainty” which his successor tried to clarify through explicit research goals.


global warming


Yet the role of maps in making a public case for climate change and its consequences seem to have made the project of climate tracking and earth observation under increased attack, as the project of mapping climate is in danger of being removed once again from scientific conclusions about global temperature rise, subsurface ocean temperature rise, or glacial melting–as the ways that climate change maps embody actual environmental risks is effectively minimized.

Continue reading

1 Comment

Filed under Climate Change, climate modeling, data visualization, environmental monitoring, manmade climate change