
The ballyhooed shift of the economy from the industrial to the technological and financial sectors seems like it conceals the deep shift in the geography of the working male: while the anthropocentric focus of the data is not meant to be gender-biased, it reveals a steady decline of the “working man”–an astounding tripling of men not working since the late 1960s. The expansion of those not working reflects in roughly broad brushstrokes parallels a decline of the industrial workforce, but is also an interesting metric to map the transformation of the nation in ways that concepts of the Recession or failures of job-production cannot describe. The terrain of men between twenty-five and fifty-four without work–a rough measure of adulthood and able-bodiedness, of which even setting traditional parameters, provide a contrast with the categories of a landscape of the past, and suggests the shifting place of the working age man in American society–if not the relation between man and work, and the absence of work’s spatial distribution in the United States.
Recent visualizations of the decline of a national workforce seem more like conversation stoppers from which there is little prospect of relief or escape than invitations for thought. While what we talk about when we view a data visualization is dictated by the parameters of the snapshot it declares, the landscape of the out of work in America is on the front burner of most data visualizers, who have been competing, in the manner of so many actuaries, to present the best picture of American decline. Fear grips the visualization of the drying up of work, which seems extracted or deflated in ways that create a new sense of hills and valleys in the topographic maps of the country: what were once centers of the economy are transformed in the economic landscapes of unemployment that they present, providing new contours that we are asked to assess as if it is time to assess the place where we are at through the effects that the arrival of the “Great Recession” from Sea to Shining Sea–and the centers of work that continue to exist across the Home of the Brave.
Before examining the maps of those out of work in America, the contours of such a map suggests one of the backgrounds for the reception of the internet economy and digital revolution that may reveal the special appeal of the somewhat illusory notion that the web promises the coming generation of a wave of new jobs. While the internet has been blessed as a solace to the out of work, transformed by alchemy of the world wide web into blissed-out surfers putting their time into online betting and social networking sites, net advocates insist on potential economic benefits of the new cultural commons of “prosumers” that lies on the horizons of our backlit lives. The foreseeing of a massive expansion of the DIY economy as part of a “Third Industrial Revolution” that is to be unleashed on the internet will not only provide a basis for reunderstanding the energy grid; for many, new sites of trading and commerce–on Etsy or other virtual marketplaces–has spontaneously generated claims for the benefits of such new platforms for marketing creativity that will work to make folks feel valued and great about both their “work” and themselves. Yet Sue Halpern found these claims quite creepy in their unstated underside, not often mentioned by enthusiasts such as Jeremy Rifkin who prophesies a Third Industrial Revolution of clean energy and renewable resources across the globe: for the link between the internet and a new “energy paradigm” in the new industrial revolution of an “energy internet,” may well augur a day when workers may not only be increasingly replaced by machines, as the internet decouples productivity from human work, but, more insidiously, e-commerce creates the illusion of productive engagement: “a do-it-yourself subculture is thriving, and sharing cars, tools, houses, and other property is becoming more common, [but] it is also true that much of this activity is happening under duress as steady employment disappears.” (While 60 million consumers interact with Etsy, Amanda Hess found that 65% of sellers made more than $100 last year. Compared to the 5,000,000 jobs that Slate‘s Associate Editor Chris Wilson mapped as vanishing from 2008 to 2009 presented a devastating picture of job-loss, barely compensated by talk of the growth of online sellers and small-scale Amazonians.) This new sense of “work” is not only based on the distractions of web-surfing and the rise of private activities completed during working time in offices, sometimes up to average time spent on private activities at work is between 1.5 and three hours a day., and even the conclusion that 70 percent of internet traffic to pornographic sites during what seem working hours, and the majority of online purchases (up to 60%) from a similar 9-5 timeframe. But the illusory jobs and increased appearance of engagement that the internet nourishes seems as important to acknowledge in describing the radical redefinition of work in America. The apparent addiction to such “involuntary slacking” seems to demand attention as an important counterpart to the shifting geography of work in the United States.
What happened in the dire picture of a loss of five million jobs that he presented of national decline that began from roughly when, in what one can’t feel is a coincidental metric, President Obama took office, and we faced our greatest threat of economic downturn in many years?
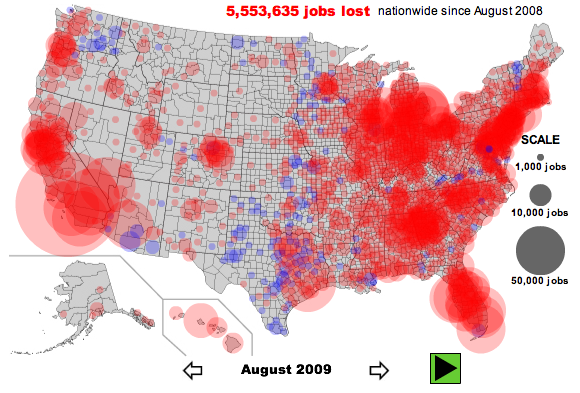
The image of economic implosion, or decline in job growth in 2008, two years after the Recession had officially begun, offers a map of the points of local vulnerability to job losses that contrasts with the earlier maps of job growth, and seems like a job-loss virus, spreading from centers of past urban growth, in ways that augur something like a national decline: the northeast and northern California are deep red, as is the former industrial midwest around Detroit, and the Northwest doesn’t seem to be doing better. Texas, almost alone with Vermont, for some reason, has spots of blue. It is not surprising that the Wired map was quickly taken up by Fox News: the spread of scarlet sink-holes of job-depletion across the continent, radiating out into its surrounding waters, offers a vision of apocalypticism that “others” the continent from a geographic land mass. The medium of the data visualization offers a snapshot of the status quo sending shivers down one’s spine, jointly suggesting a draining of jobs from the national economy and raising questions about its future.
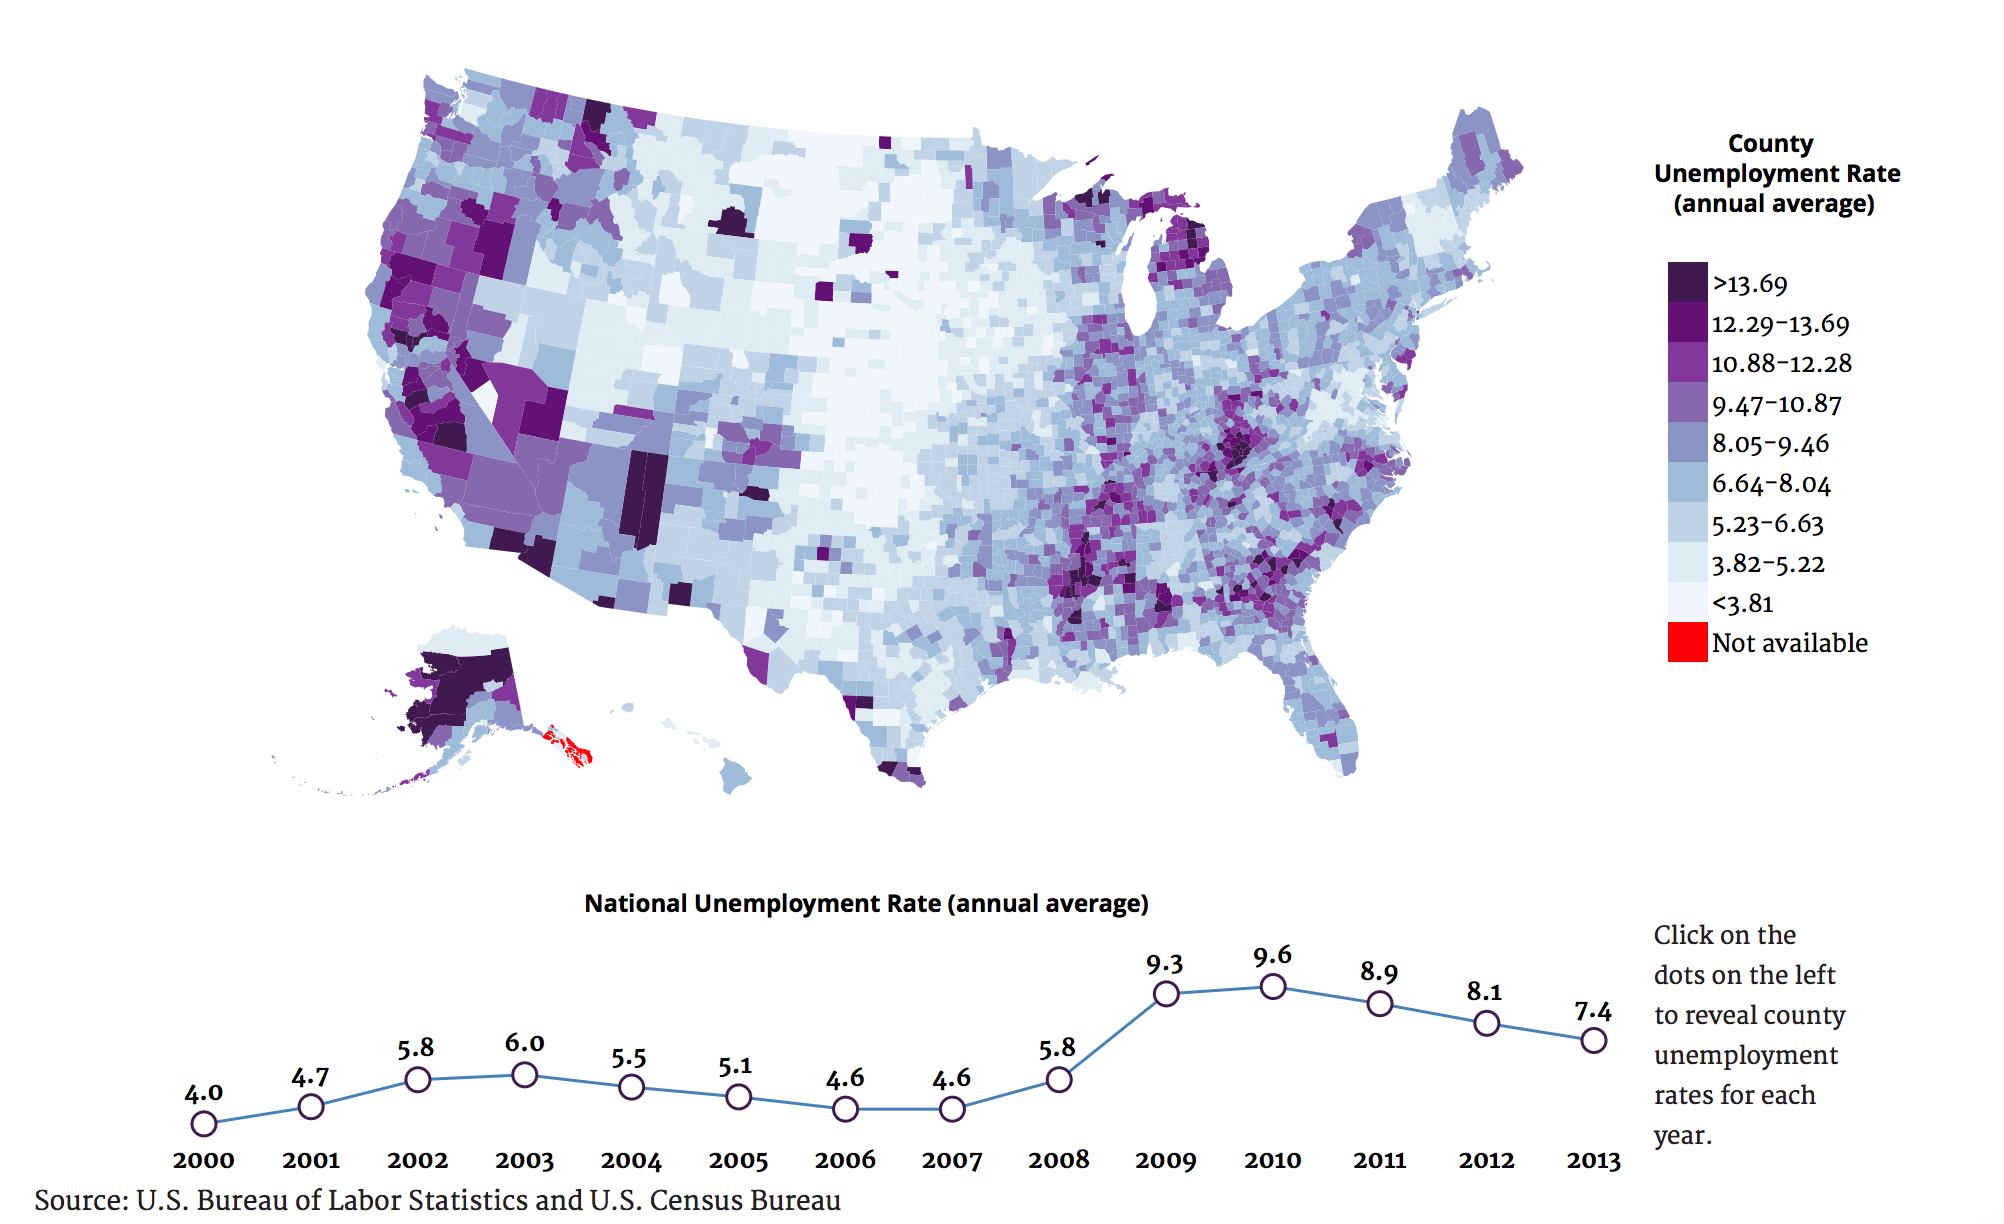
The image is striking, and drowning in large circles of red, denoting job loss, with small spots of bright blue standing like beacons of hope, but a larger scale image of the shifting growth of unemployment rates over the decade from a Public Policy research team, Mathematica, using statistics from the Census and Dept. of Labor, crafts a far more finely grained picture of national losses from 2000 to 2013, less mired in a feeling of depression and more legible both it int texture and county-by-county specifics that might tell us more:
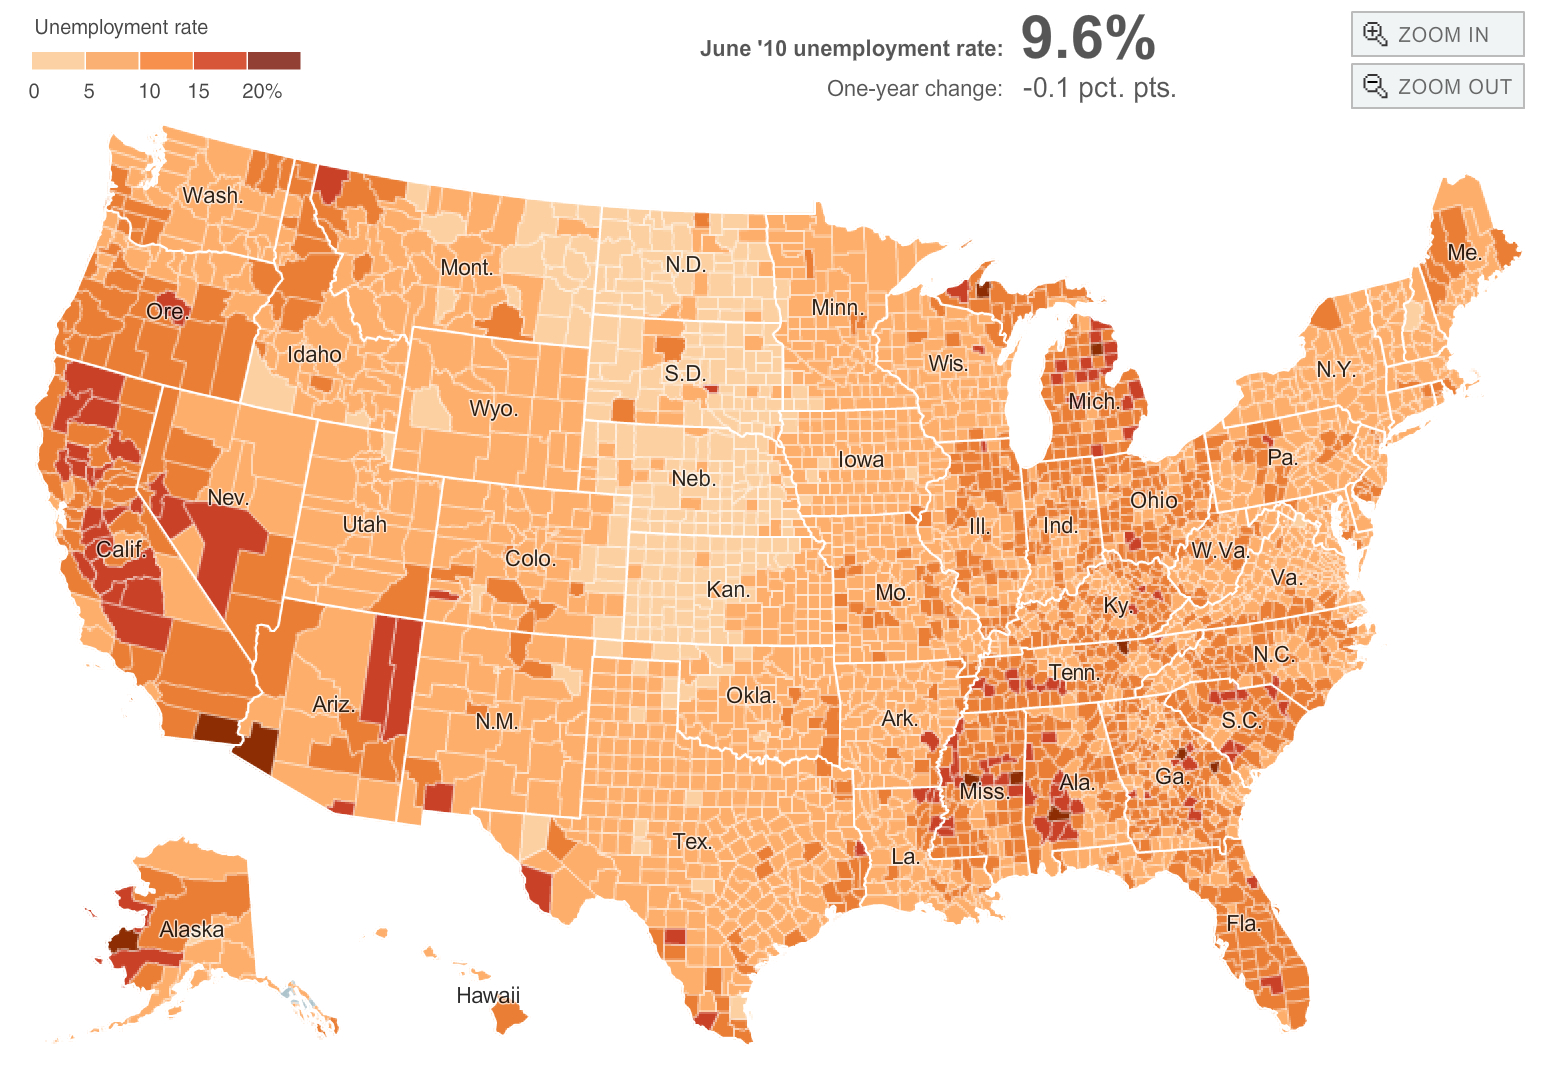
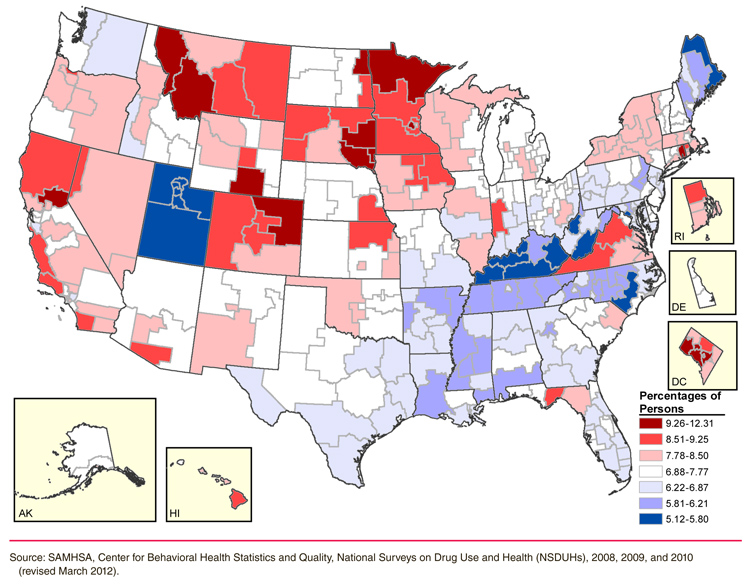
even if the snapshot map taken in a single year, as 2010, when unemployment was high, revealed a dire deal indeed:
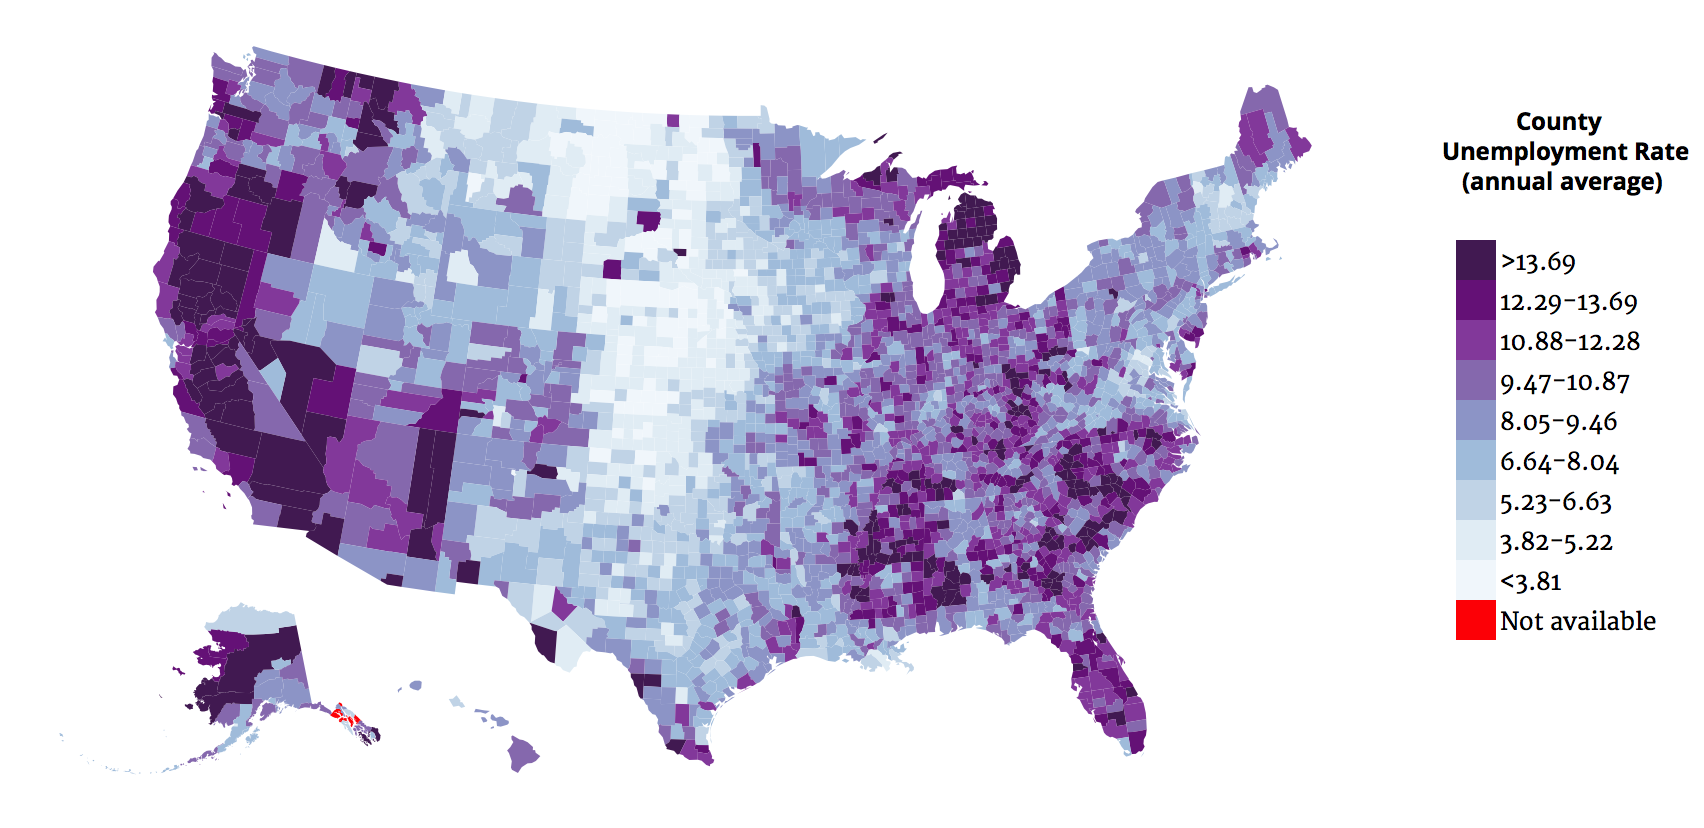
The flat opacity that these data visualizations track, rather than inviting us to contemplate a graphic prospectus of the future, provide a snapshot of relative poverty before which we stand aghast.
The internet has arrived not only as the time-suck from productivity that we’ve all, unconsciously, suspected, but with the promise of a possibility for fashioning new jobs that would lift us from the Great Recession. Despite the deepest claims that internet commerce provides the opportunity to unleash a new level of contact with consumers and wave of independent sales, it may well be, although it is quite hard to confirm, that the amount of time spent online is something somewhat correlated to the new appearance of folks who are taking steps to leave the workforce, and find solace online, removed from the workplace environments that can provide a somewhat comforting cocoon. The hope of Jeremy Rifkin that Halpern wryly characterizes as a “vision that people will occupy themselves with more fulfilling activities like making music and self-publishing novels once they are freed from work” exposes the possibility that the internet offers an odd outlet for dropping out of the marketplace. For while it may be but a coincidence, the shifting geography of being out-of-work, the long-term decline of the American workforce found an interesting outlet for self-promotion and self-fashioning on the internet that Jeremy Rifkin, Lawrence Lessig, and others promise. But including this image of the economy, or even its economic potential, is almost seems inversely proportioned in its difficult to map compared to the trumpet its benefits.
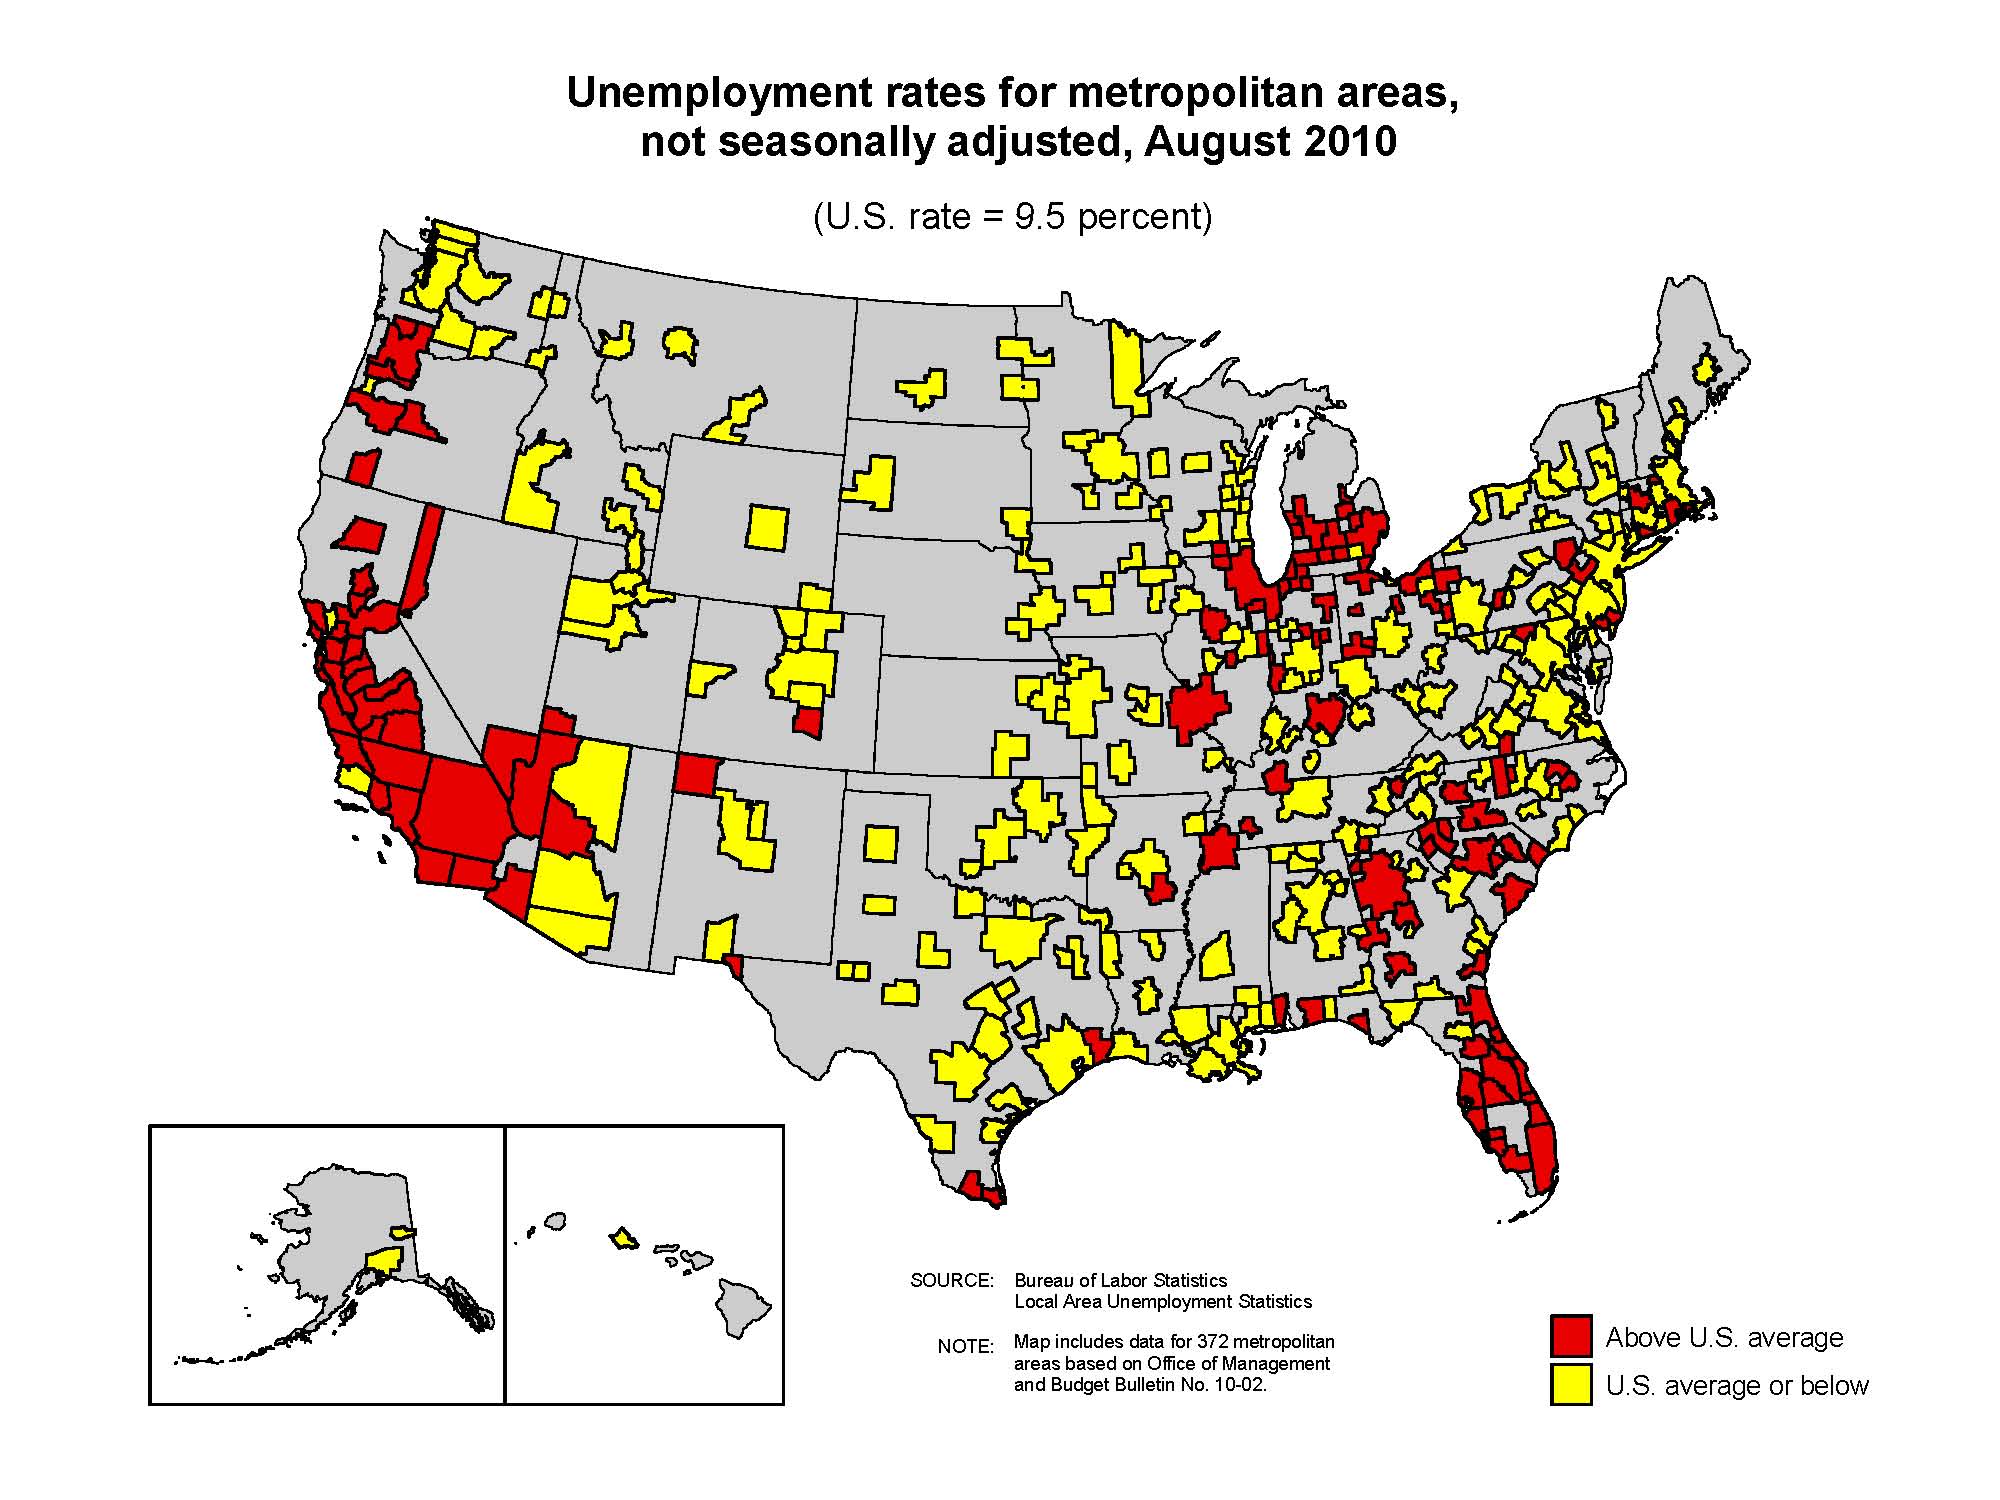
For the expansion of such self-made businesses or “trade venues” on the web parallel a search to innovate by folks who have been marginalized from or forced to leave the labor force in ways that our statistics of unemployment as reported widely do not fully capture–we must begin by taking stock of the fact that a broad measure of unemployment rose . To begin to get a handle on our national quagmire of the out work, we need to compute alternative measures of unemployment, however, noting the depressing picture including a broad measure of unemployment computed by the Labor Department to include marginally attached workers–which rose far more than official unemployment rate defined as those looking for work, as Brendan Saloner noted in 2010–even if that rate has now declined to below 6% once again, rather than not budging from 9.6% as was then the case. The distribution of such a broad measure of underemployment (or unemployment) had striking national variabilities in 2010, focussing on metropolitan areas alone.
Moving a bit forward in time, the New York Times and Economist noted the importance of considering regional disparities in the “Great Recession” by 2011, noting areas where unemployment crested to 20%–
–which boasted marked declines in unemployment across much of the country for the first time, save in those places deeply effected by the housing bubble, including California, Florida and Nevada, and those regions whose ingrown unemployment was brought by declining industry, such as Pennsylvania or Indiana:
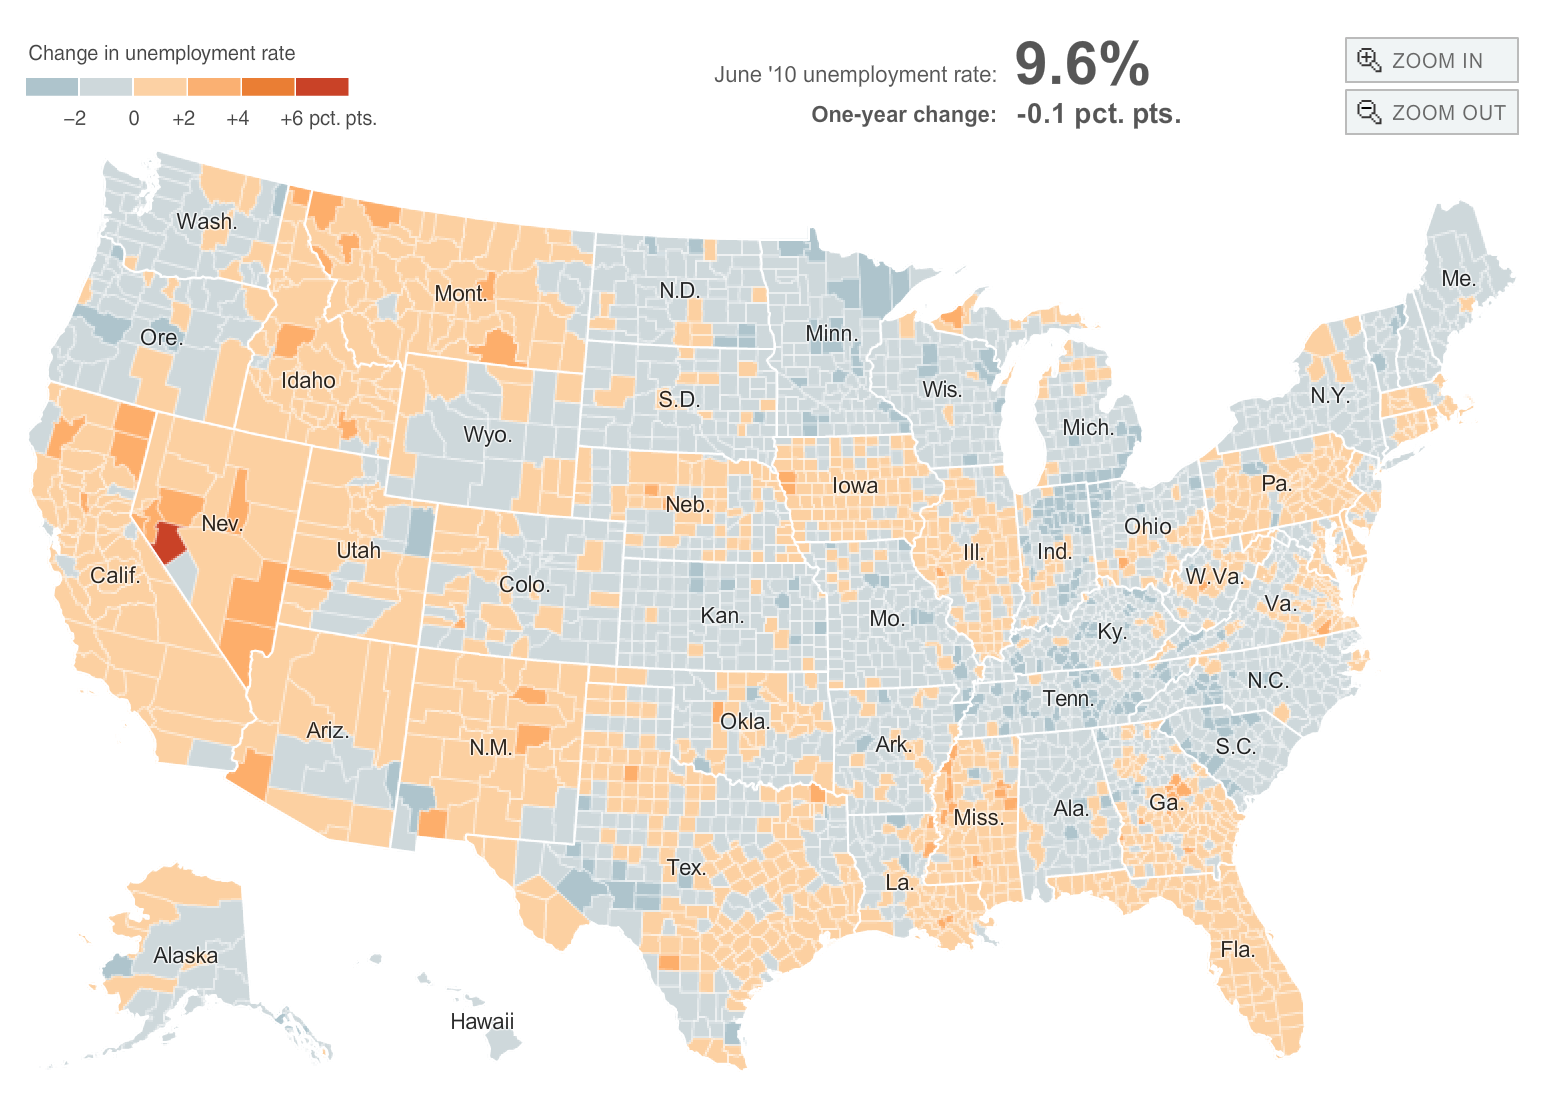
New York Times
The picture of relative discrepancies in the specific areas where national employment rates crested above 20% in some areas, or unemployment stubbornly refused to decrease, presents a picture can be interestingly fit into the long-term decline of the workforce in America, the journalist and historian Yoni Appelbaum has argued. The long-term decline matches a growing share of the male population who need help or are paying taxes, Appelbaum found, which has wrought considerable social changes in our attitudes toward work and workplaces, independently from the “Great Recession.” Indeed, the shifting geography of the out of work between the ages of 25 and 54 across the nation provides a similar distribution of deep valleys. The nation-wide rise in the numbers of out of work men raise interesting questions about what folks are doing with their time, and what sustains attention at a time of disengagement from the economic marketplace. Men are not, here, taken as the metonymy for human, but describe a deep change in the status quo which may well suggest the feeling of remove from those technological sectors where the economy has grown, and goes beyond a decline in job creation in specific areas across the United States, that may reflect a geography of desperation and alienation independent from the creation of further jobs. While the prognosis is not warranted from the map alone, the rise of such out of work men, who either elect to leave the workforce or adopt the classification as disabled, creates a distinct culture in specific cities and regions unlike one of competition for existing jobs, that may pose deep threats for the economy and indeed for public health.
While somewhat like the long-term unemployment rates in its complexure, the distinct nature of the pockets of out of work men are removed from the labor market, and present a topography of what might be called disengagement, if one would not rather use terms without moral judgement. While the two issues are closely tied, the specificity of the map of men out of work map seems striking in its greater demographic specificity.
New York Times/Yoni Applebaum
In ways that seem paralleled by the number of women who are leaving the workforce of the same ages, and to illustrate a deep shift of the culture of work, “working, in America, is in decline,” as Appelbaum put it. Is this major and ongoing shift in how we relate to work, deeply linked to the rise of the disaffection of many from an existing labor market sen too removed from one’s own self-valuation, or perhaps below one’s competence, the expansion of those outside the workforce, male and female–the non-employed, including disabled or with compensation, make up over an eight of the entire adult US population, include students and those retired, but only 25% are classified as unemployed.
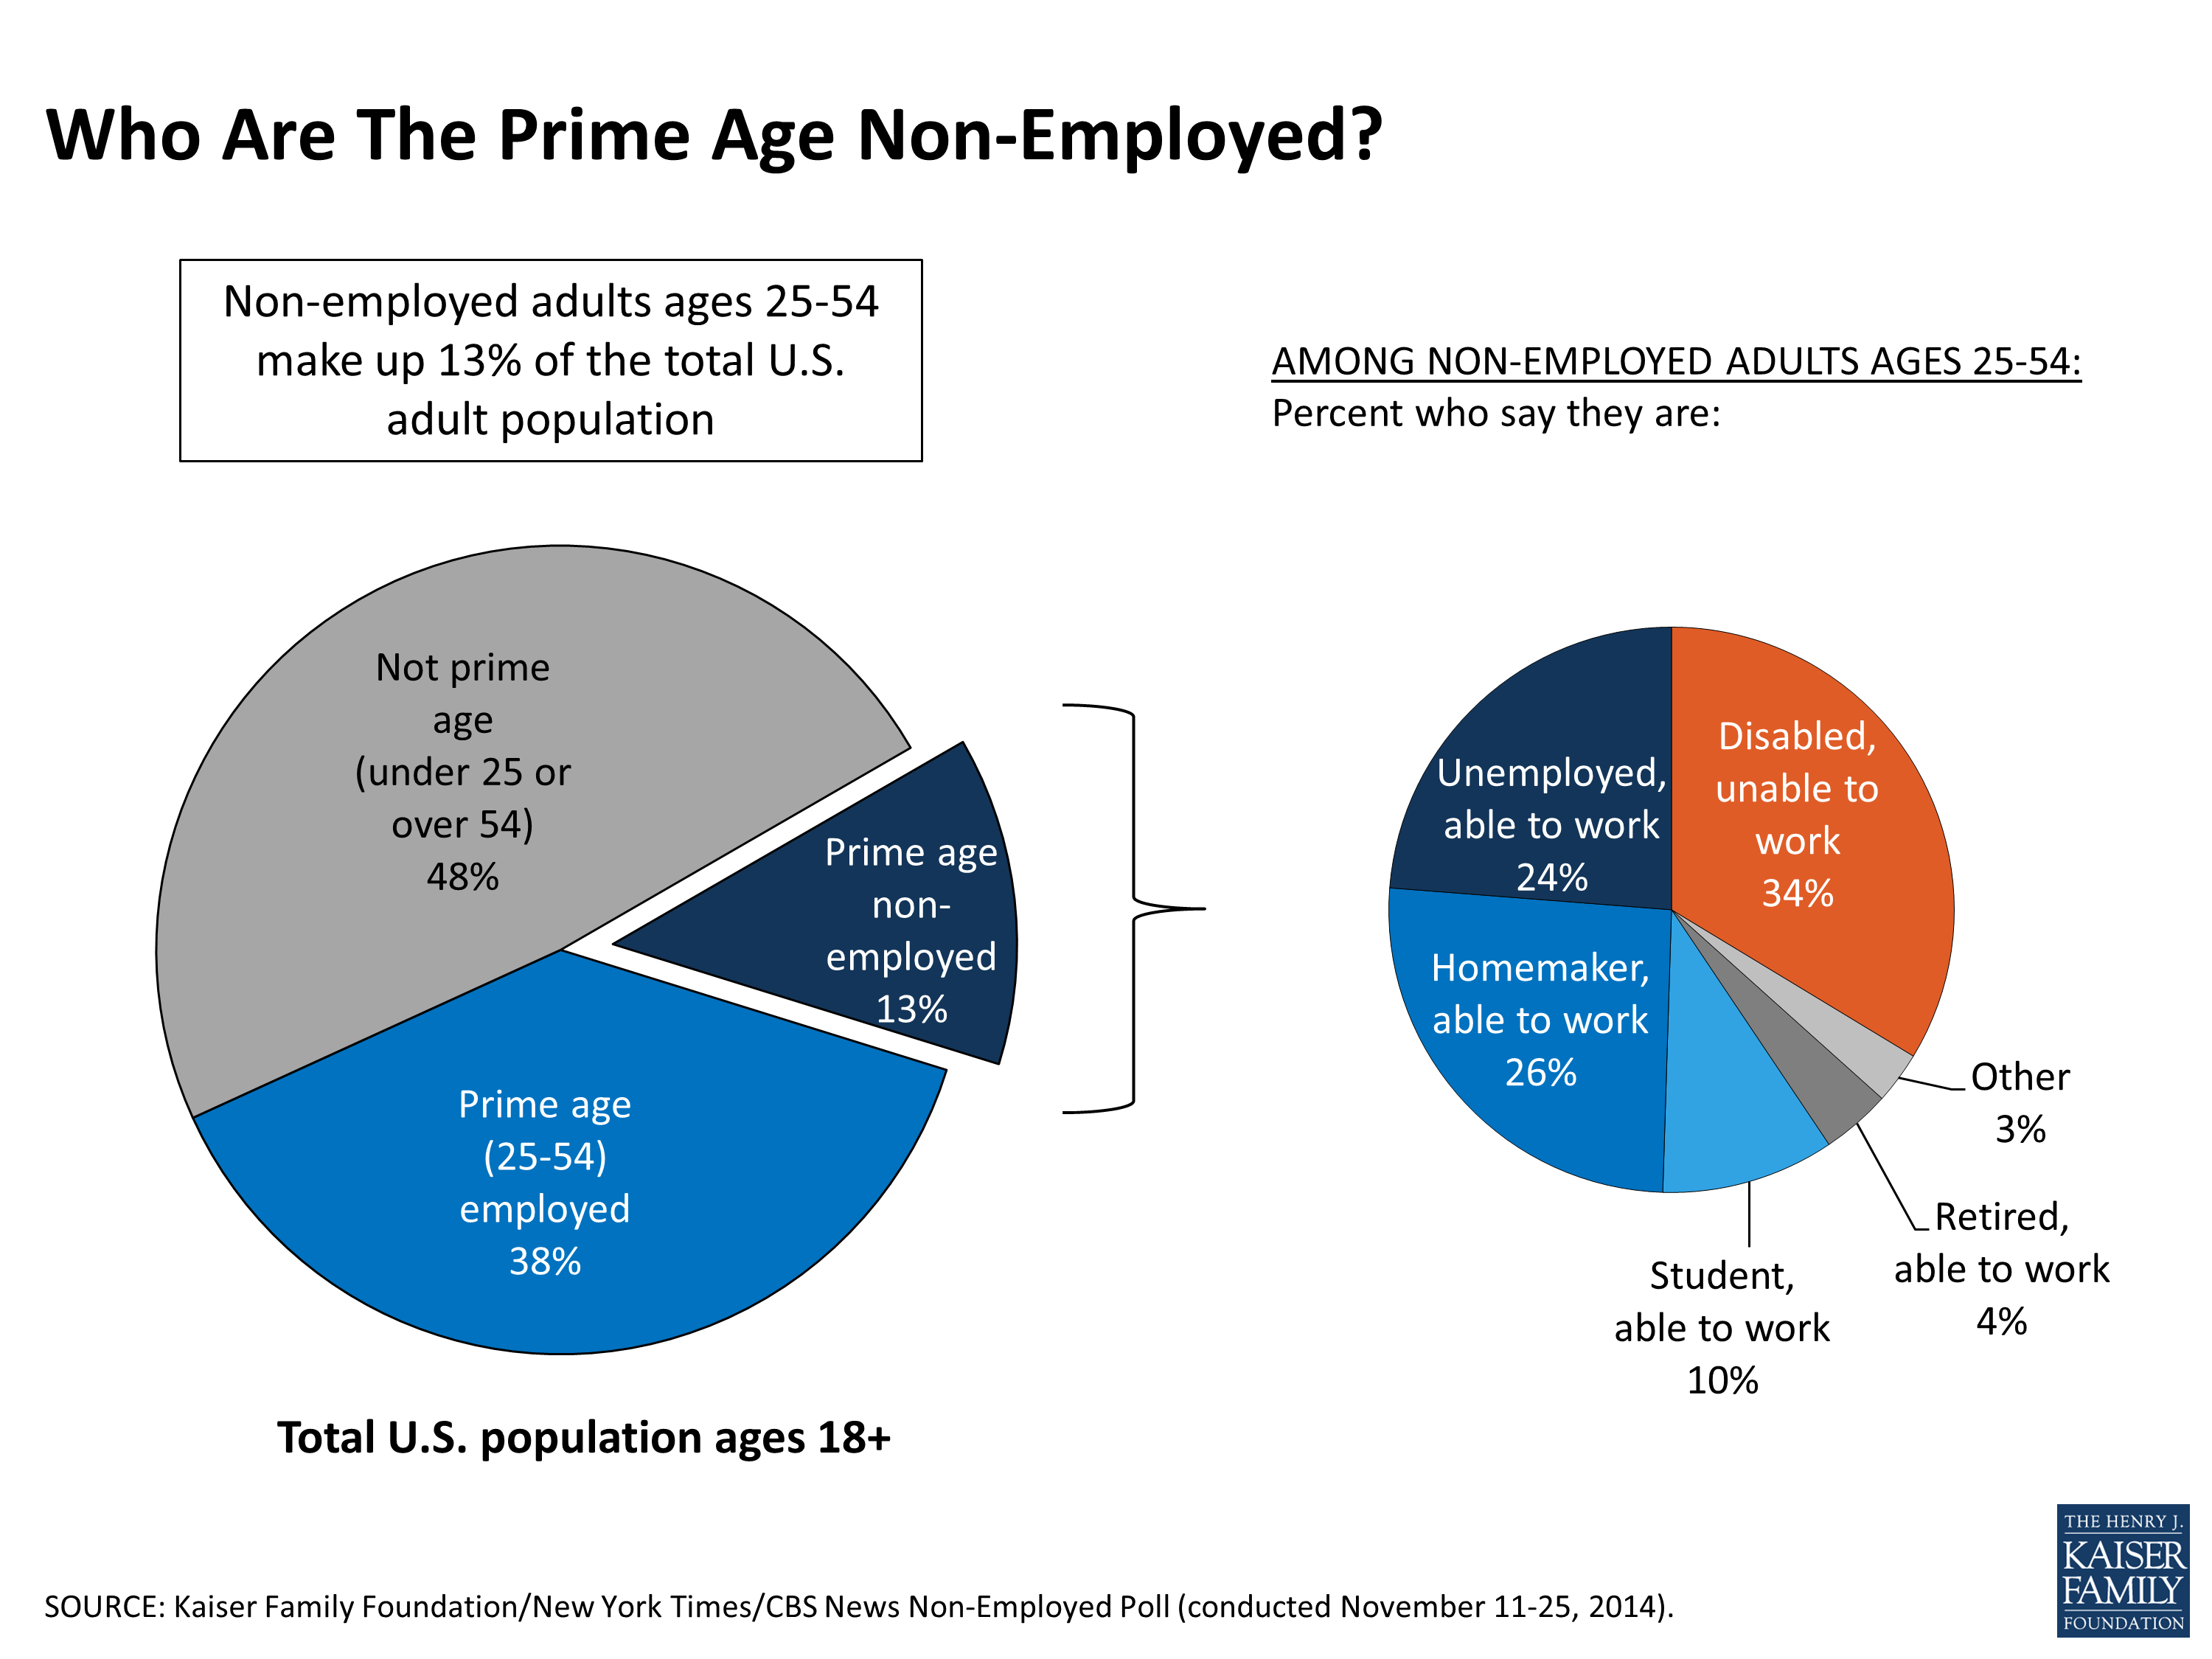
Almost independently from “unemployment” per se, the sector of such non-employed between ages 25 and 54 seems particularly unhealthy for the nation, and difficult to explain–as is their apparent geographic clustering. Only just over half say that their jobs ended with the last recession of December 2007 (61%), but an eighth (13%) claim never to have had a full-time job, suggesting that they are probably on the younger end of the age spectrum.
Why not work, despite the clear adverse psychological and personal effects of such an apparent decision or perceived inability to change one’s condition? Greater risk for substance abuse, alcoholism, depression–widely recognized as both costly and debilitating–and documented difficulties to create stable relationships. The choice that men make not to work–or to join a workforce which is still looking to hire–indeed raises questions about families and psychological health, and about the perceived place of the individual in the social world. But the geography of this decision or lack of apparent incentive to join the workforce that Appelbaum found particularly striking, almost approaches a collective paralysis or depression, if with distinct underlying causes, that in aggregate particularly plagues specific areas of the country–areas associated, to be sure, often with economic decline, but also which seem swamps of unsuccessful stories and narratives, and invites new narratives to be told about maps. But the poverty of information in the data visualization, whose focus on the present status quo offers only a concentration on the short-term, seems something of an evacuation of information from the map, and demands to be supplemented by greater detail to better grasp the distribution it seeks to define. Looking for further dimensionality of the data it presents, one is tempted to seek correlations in the flat colors of comparable datasets to find what narratives might emerge from the flat visual surfaces that are presented in the amnesiac surfaces of the data visualizations.
One might start from comparing, for example, to the short-term snapshots of depression according to a Behavioral Risk Surveillance System. Although the broad geographic parameters of this 2010 map issued by the CDC doesn’t offer comparable fine-grained detail, and both leaves many interesting areas without data (Kentucky) and shows significantly elevated rates of depression across the Old South, it suggests contours of depression across the country, particularly dense in spots of long term out-of-workness from West Virginia–if data lacks for Kentucky–Mississippi, Oklahoma, Alabama, and Tennessee, where it crested above 10%:
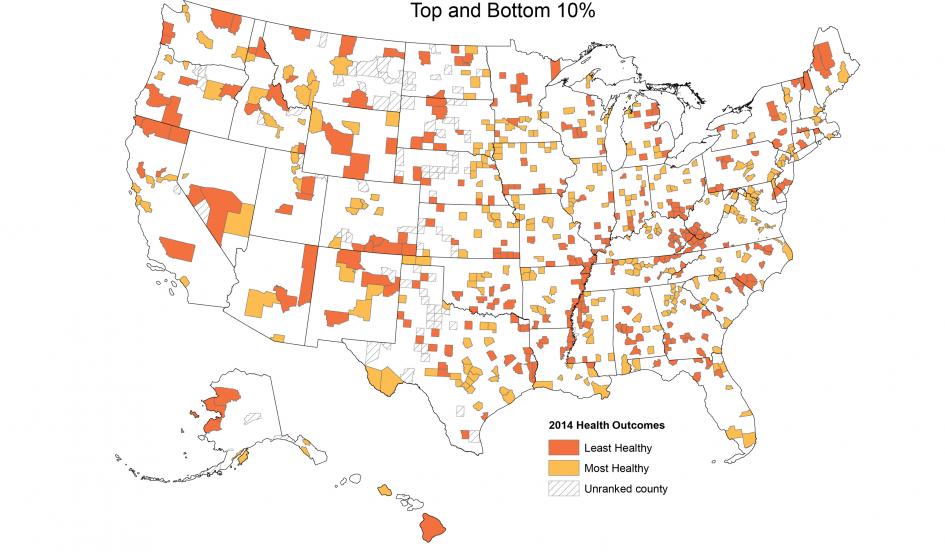
But the map unsurprisingly more closely correlates in select regions with the recent Newsweek “Health Gap” that combines mental health and college attendance with other variables of 2014, which uses data from the University of Wisconsin Population Health Institute–even if that map is not really surprising, and seems to square with a remove from health care, in its clustering on the Mississippi, western Kentucky, and parts of northern Floridam with the Nevada part of the Four Corners and northern New Mexico:
The distribution of the out-of-work male offers a fascinating new subject of mapping, since its distribution seems defined distinctly from the mapping of areas of economic growth, unemployment, or taxation, and suggests a local acceptance of the very demographic category of being out of work.
While we’re at it, of course, we might ask to parse the national distribution of unemployed men along both socioeconomic background and ethnicity, if only to see the results–but these seem to be beyond the point, which is the disquieting nature of the prominence of the category of not seeing oneself as a part of the workforce. For if there are slightly more non-employed who are African American (14 percent versus 10 percent) or Hispanic (20 percent versus 15 percent), a majority (above 54%) have only a high school education or less, and seem as if our society has failed them–only one fifth have graduated from a 4-year college, in contrast to almost 40% percent of full-time workers, and the disconnect between work and education seems a clearer metric than all else, and their health, as self-reported, is predictably bad–suggesting the possibility of looming considerable social and personal costs, and a great crisis in public health, even if among the non-employed, some 74% affirmed that they have health insurance. Yet it is conspicuous that one-fifth of non-employed have completed a college degree–even if, perhaps, only recently.
This relatively large number of college graduates who are not able to find work casts a ray of light at the deep depression that might result of being without work, and a paralyzing uncomprehending sense of inadequacy.
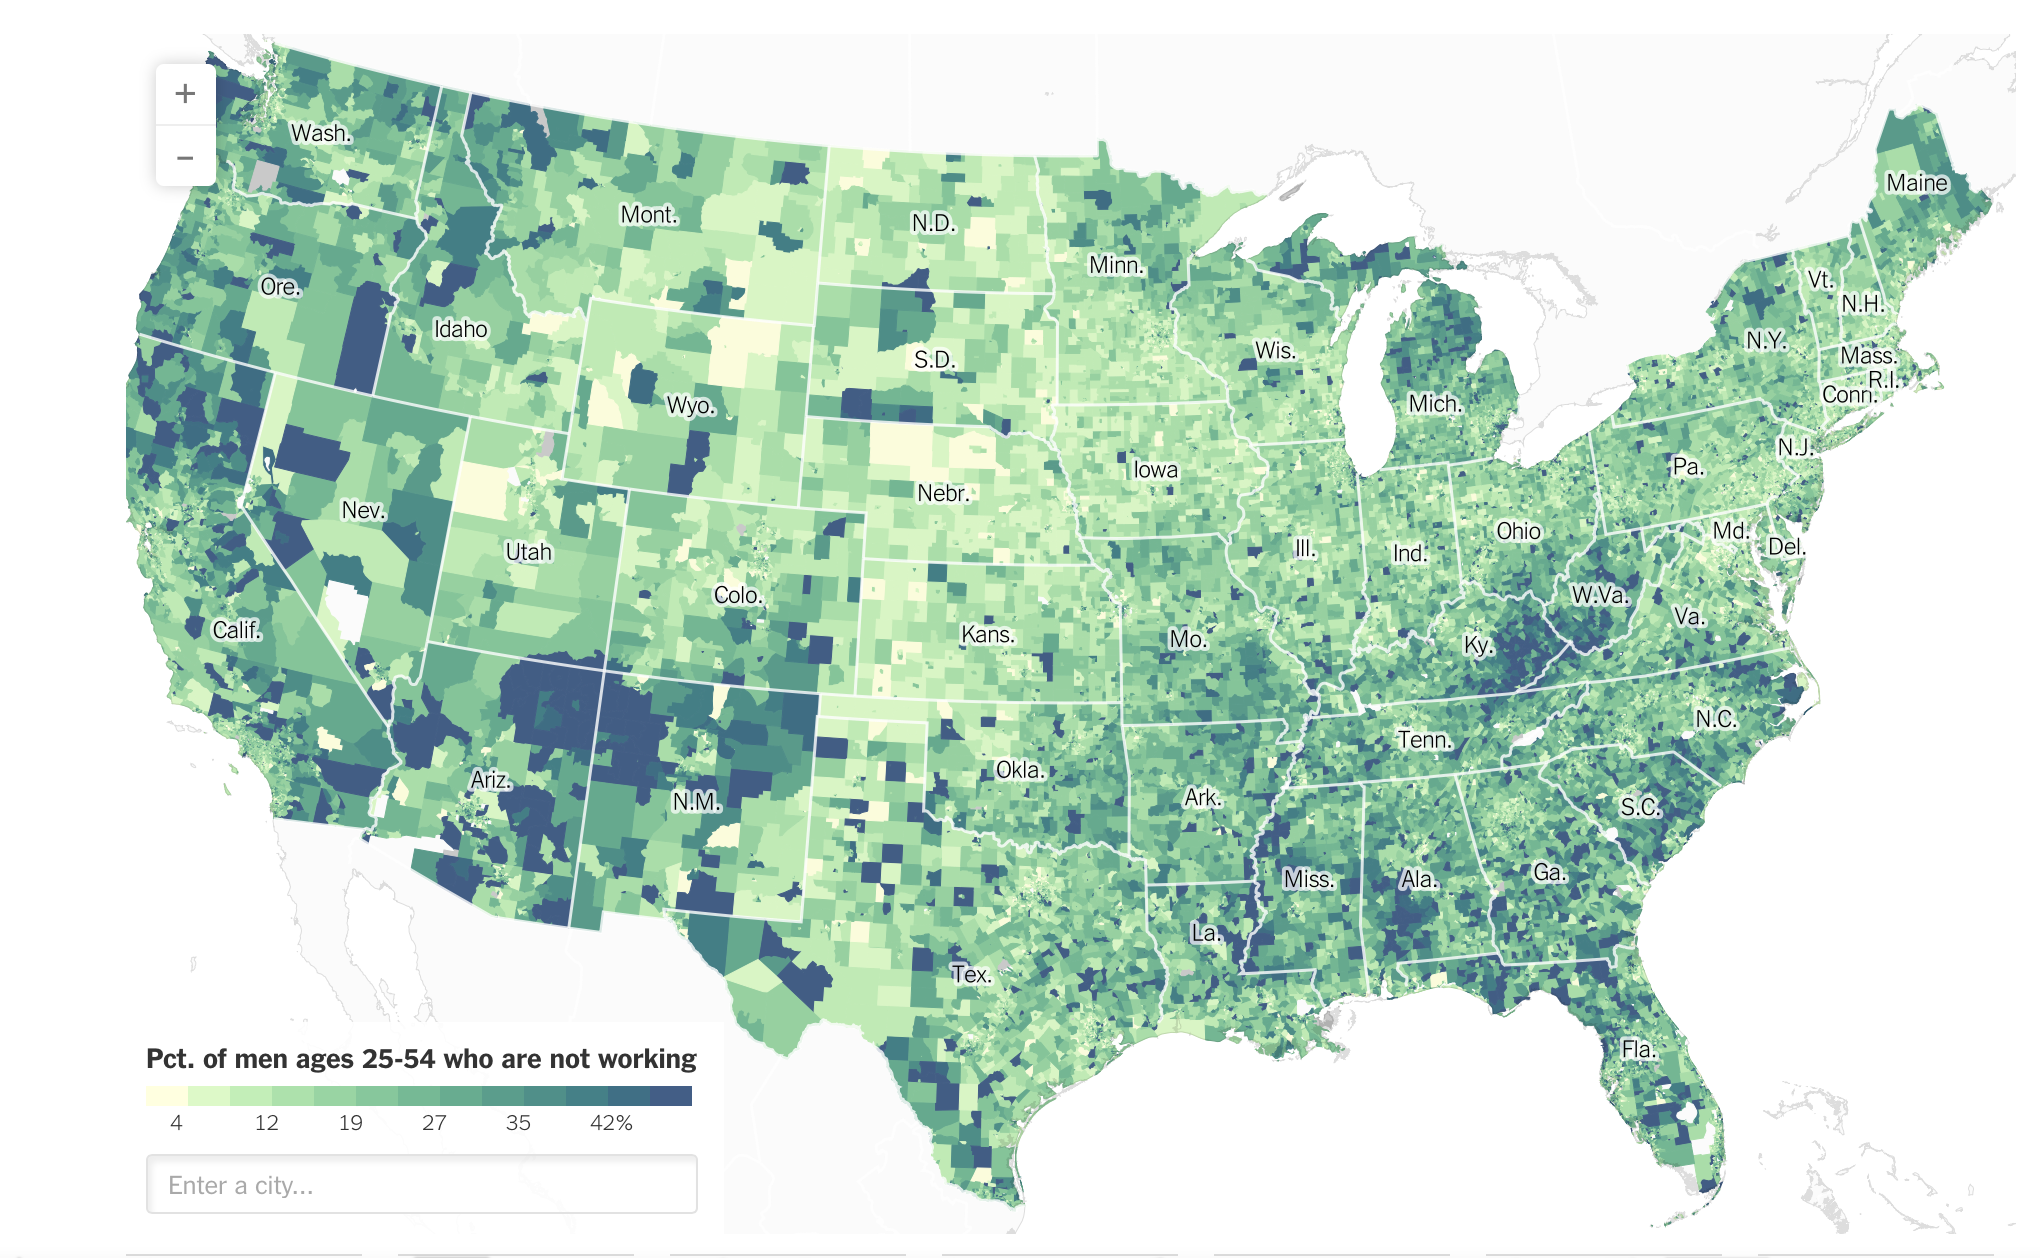
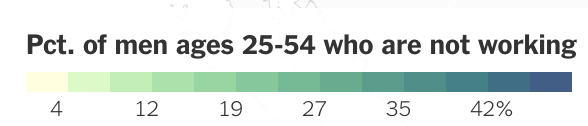
The below map offers a compelling mirror of society, and of the long-term difficulties we face. For the distribution “men not working” is laden with both deep levels of depression, anxiety, and economic despair difficult to process fully, whose apparent uneven distribution and pockets of deep concentration that amazingly surpass 33% suggest the seriously impacted problems of how we define work and occupation today. The concentration of select areas of dark blue seem swamps of something akin to despair–located around the “Four Corners” and border of New Mexico and Arizona; Southern Oregon; western Montana; northern California; Appalachia; and areas of the Deep South; southern Florida–that seem sights that are sinking, if not almost disappearing, as if potholes of personal futures, off the road map of the common good. These darkly colored regions, off the main highways of America, are less traveled areas, but inescapable parts of our nation’s economy. Unlike the map of of unemployment for metropolitan areas, some of the most difficult regions of the persistence of men out of work appear at a remove from cities–although the maps use different indices. they suggest similar pictures of the difficulties in the topography of job creation.
New York Times/Yoni Appelbaum
The local dips in sectors of the nations reveal dark spots in the national economy that can only haunt us. The metrics of not working men is striking, particularly as the dark green blotches in southern Oregon, northern New Mexico, Appalachia, or parts of Idaho convey a grim desperation of economic displacement, and almost communicate a sense of being left behind. Is there an odd acceptance of a dark status quo in these areas, where with something like almost half of adult men not at all working leads to a labor market that can almost never be met, and a paralysis of looking for jobs, or actually imagining alternative signs of success?
The region in Northern California, for example, suggests a desperation at the lack of employment opportunities that leads a hazy air of diminished expectations to hang over the land. The SAMSHA map of sub-state variations of substance abuse using data available online maps a picture disconcertingly parallel in several of its pockets, particularly much of northern California and the Florida Panhandle, but also the Four Corners and Colorado, and LA, although what, exactly, “abuse” is here needs to be examined defined:
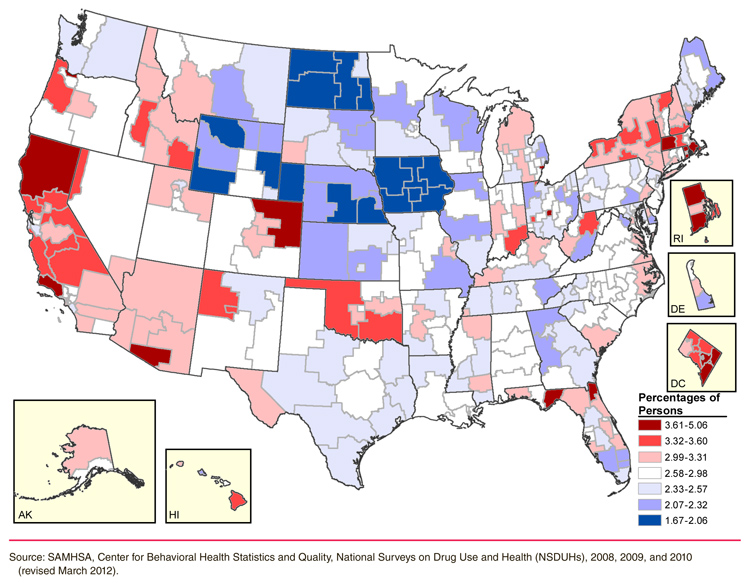
We can see a raging 5.1% dependence on or abuse of alcohol in south-central Kentucky, abuse of drugs in Western Massachusetts, on the level of Washington DC, and similarly high levels by the Mexican border in Arizona. Each of these areas is to some extent echoed in the map of the men who are out of the labor market and not working: only North Dakota and Iowa seem to be showing low levels of abuse in the years before 2010, which can’t make one feel great about the country, even if the bright red spots in Oklahoma and Idaho come at considerable surprise.
Alcohol dependency seems to be more striking in Northern Central California, Idaho and Montana, and northern states like South Dakota and Minnesota, although Utah is very dry.
But the relation to the out-of-work seems particularly keen and in demand of excavating from the staid surface of the data visualization of local variations in the sustained spread of substance abuse.
Applbaum’s county-by-county visualization offers an inviting grounds for exploration, due perhaps to the appeal of the palate he uses to denote the out-of-work by deepening shades of green and dark blue to denote those men who are out of work, and the apparent narratives that the resulting distribution offers one to spin out of it: the often opaque surface of such data visualizations seems sensitive to discrepancies in quality of life and the changing ways to spend time that result from such a lack of work. For example, the rough terrain near to Mendocino, land of spectacularly stupendous ocean views, conceals a growing desperation among numbers of the of sustained employment in several inland areas in California, if not along its coast.
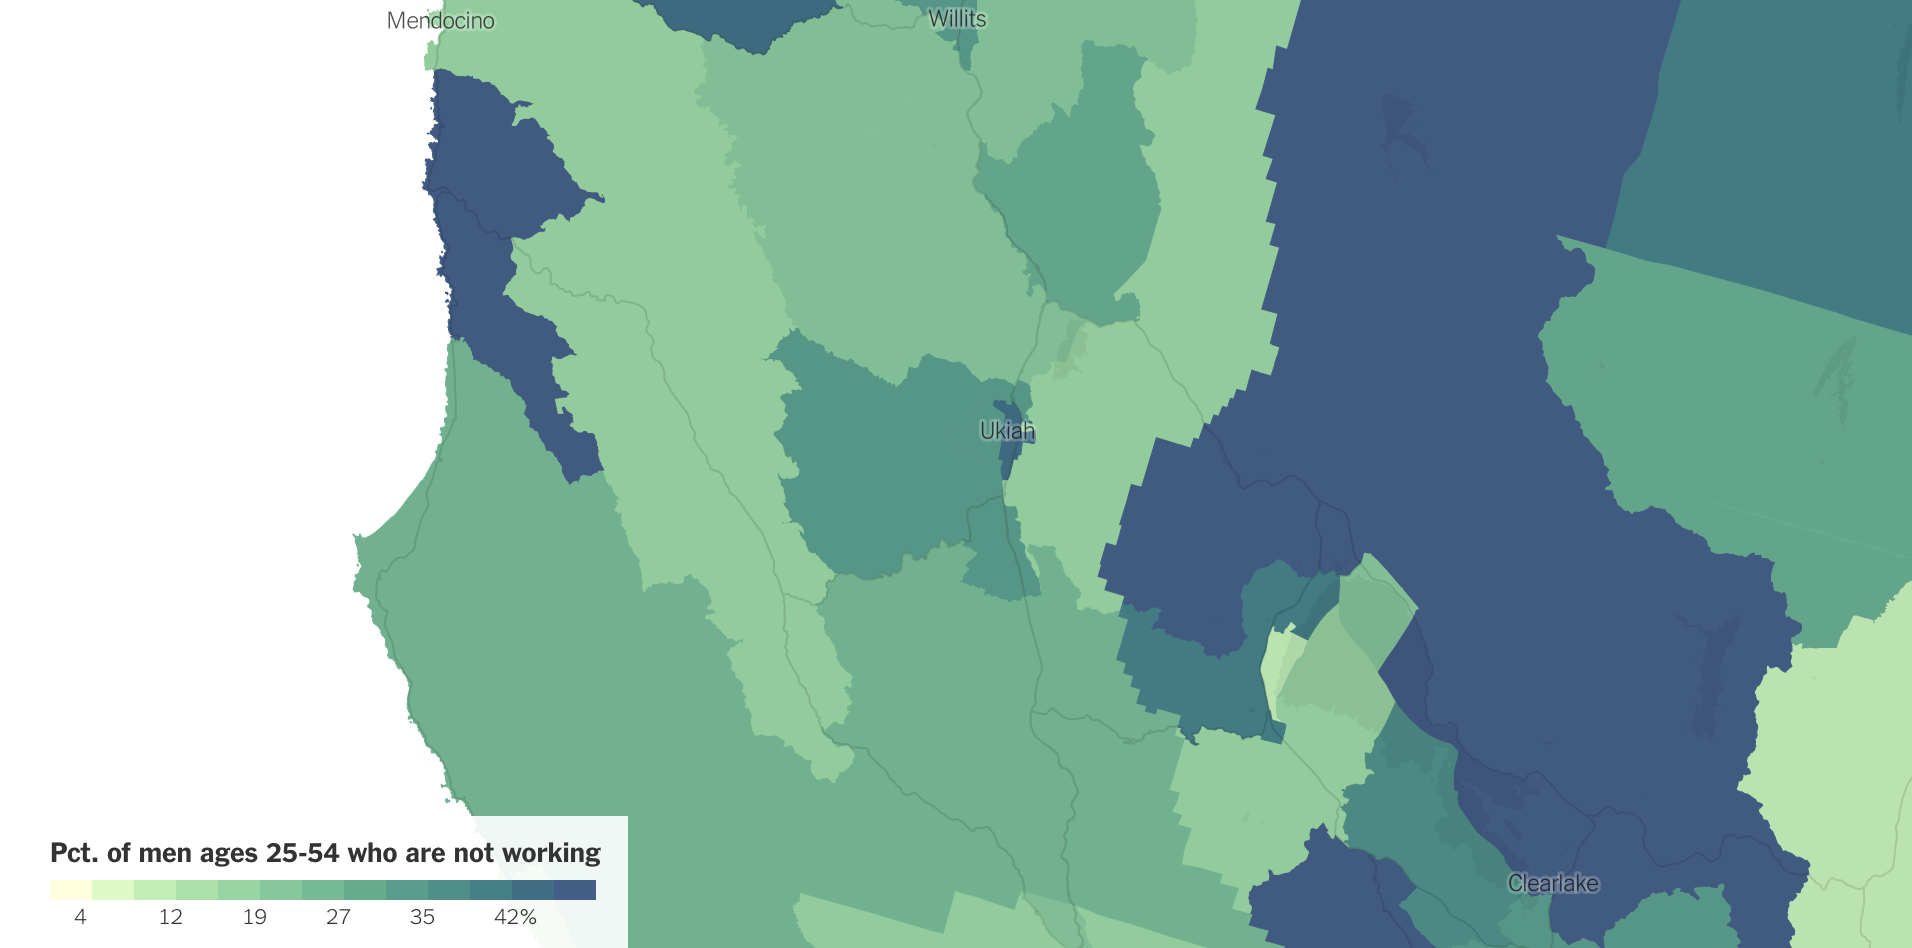
New York Times
Such troughs across the county suggest a dramatically diminished range of expectations that poorly communicate a future life. This might be increasingly true of urban areas, where lack of employment seems often endemic in some neighborhoods of Los Angeles, which pop out of a broader map of the city.
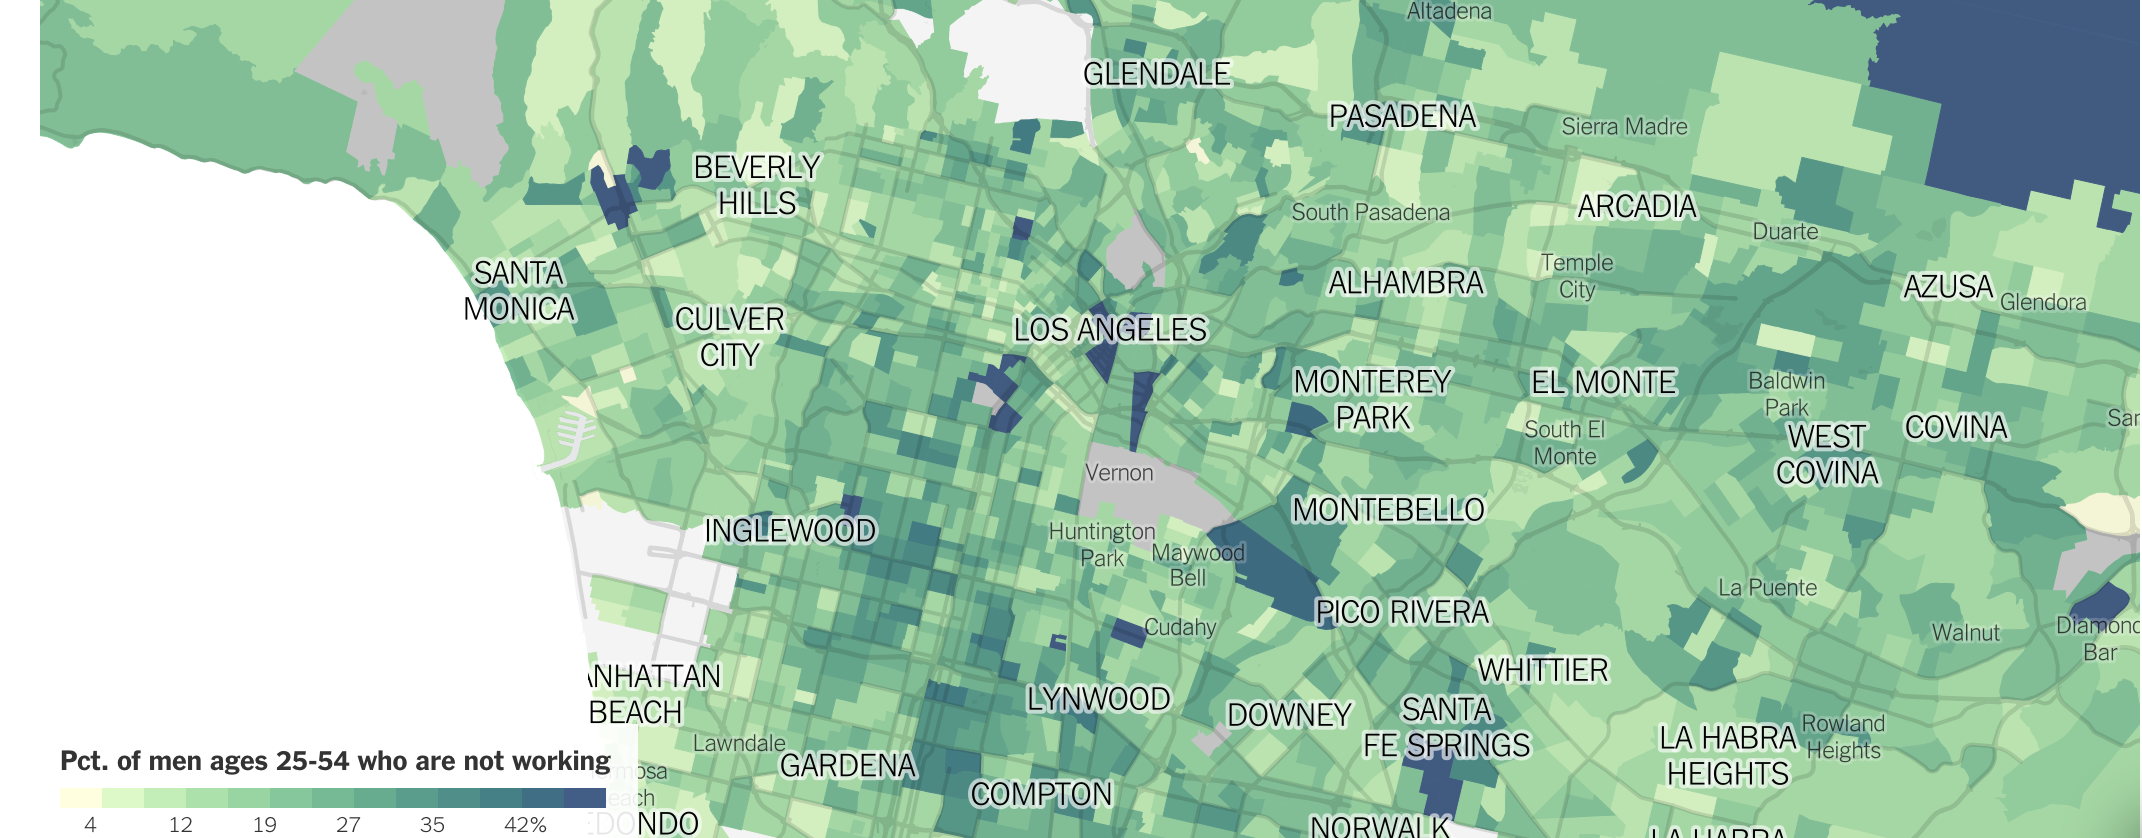 New York Times
Moving to a broader geographic area, however, the region of the Four Corners together with spots from the Central Valley seem similarly pock-marked with diminished hopes and lowered expectations of arriving at a permanent job, creating what seem swamps of underemployment in parts of the Southwest, where low numbers of working men in large stretches of the country create a striking culture of unwork:
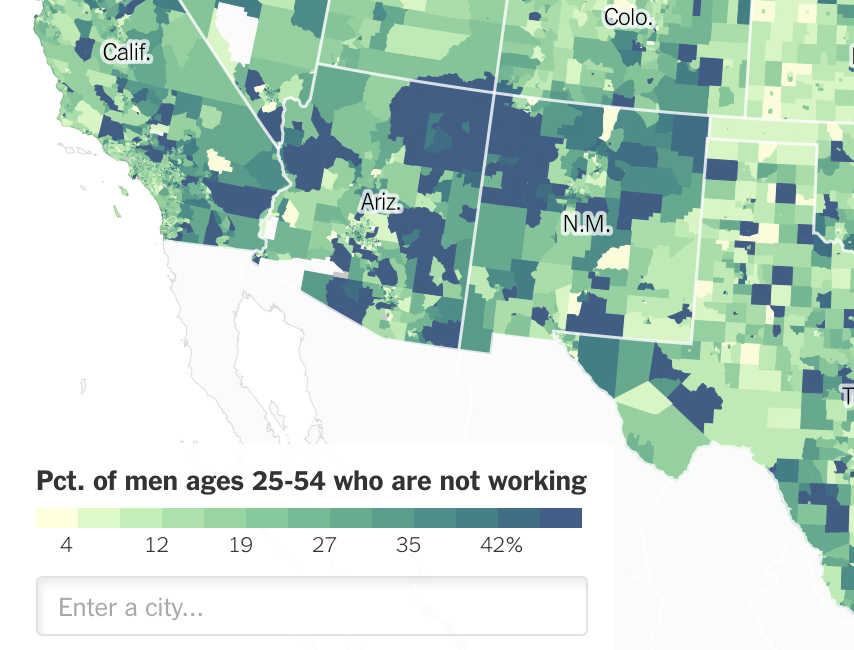 New York Times
the number of men who are not working creates pronounced disequilibria of employment across the economy, and indeed a radically diminished expectation of one’s sense of an active life, let alone retirement.
While rural Appalachia seems one thing, the pockets of men outside the workforce across South Carolina, Georgia, and Alabama, as well as parts of Kentucky, Tennessee and North Carolina, presents a dire image of a lack of available jobs that correlates interestingly with the refusal to accept National Health Care, and extend to the coast of the Florida panhandle. Concentrated communities of men not looking for work along the shoreline of the southern states in the Carolinas raise questions of the geography of the out of work.
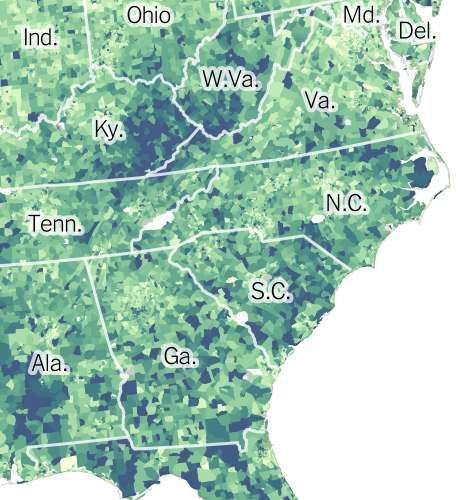
New York Times
While we are only tracking men, such potholes of local employment suggest something like low-income clusters, and support groups of the economically alienated, which have no clear or immediate resolution in sight, but seems somehow, one worries, to perpetuate its own existential condition.
The notion of being left behind by a job market, or not being able to integrate within an existing workplace, with little way out, seems to be a central issue in the landscape of heightened disparities that remains. While it demands far further study and individual local examination, the terrain often seems interminably bleak. There is the prospect that we are in the process of a broad redefining of work, and of the working landscape, but there are plenty other areas lying outside that changing landscape of work that seem to be left out. Our changing landscape of employment may be left at the doorstep of a changing national character, but suggests a deep divergence across the country in seeing oneself as a head of households, and of realistic economic expectations.

