Fracking–it is increasingly feared–invites irreparably contaminating our largest aquifers, and by extension drinking supplies–in Brooklyn, someone formed a group to protect the water of locally sourced beers–as well as devastate prairies and old agricultural lands, where land is cheap, by horizontal drilling. Recent arguments compellingly link the drilling multiple “injection wells” of wastewater that seem to have activated previously non-active faults in regions that rarely experienced tremors in the past, and where the USGS did not find evidence of registered earthquakes.
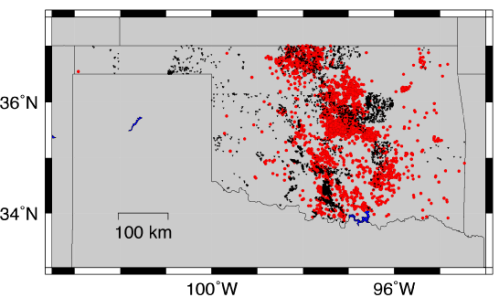
As massive amounts of wastewater generated to access for natural gasses are forcefully re-injected into the earth, as if swept under a carpet, opening fissures in underlying beds of Shale or Sandstone. Horizontal drilling operations have dated to 2008, mining areas by pumping vast amounts of sand into ancient shale formations in prairies and regions of declining agriculture to release methane and natural gasses. Hydraulic fracking has used tons of water to force trapped gasses out of old rock formations. Before 2009, in fact, earthquakes were rarely registered in the USGS surveys of lands where seismic activity has accompanied the injection of water into “injection wells”: in these the shifting weight that the injected water that presses against rocks open old fissures, causing a buckling of underground rock formations, the fear is, as massive amounts of soupy, contaminated wastewater is injected back into the earth. The “earthquake swarms” monitored nearby injection wells in Arkansas, Montana, Texas, Ohio or Oklahoma that barely registered seismic activity from 1972 – 2008, has given new significance to–and created new fear around–a set of fault lines unknown to inhabitants, blamed as if active by an industry that rejects the accusations that they created sources for tremors inhabitants fear. Indeed, the proliferation of earthquakes registered in the state of Oklahoma alone from 2001-15 reveals, according to the data from the Leonard Geophysical Observatory, a persistent increase in the tremor-like disturbances with the rise of underground wastewater dispersal, and a strikingly sharp increase in quakes of magnitude of three or higher in hears after 2010.

The increase seems closely tied to the absorption of wastewater back into rock layers whose weight is so altered by the injection of fluids, causing quakes that have rocked up to a fifth of the state, but have also increased land values for speculative fracking, in ways that may have concealed some interest in exploring the correlation–especially in a state where, due to geomorphological accident, water injected to reach deep-lying shale deposits send increasing amounts of wastewater underground, often to be absorbed by highly porous limestone that expands, but lies deep underground beside highly stressed layers of rock. The result seems to create something like a combustive effect akin to the popping of kernels of corn, and has led many state officials to preemptively adopt prohibitions on local bans on regulating oil or gas wells in their jurisdictions, and insistence that the resurgence of quakes in fault zones is more able to be explained as an “act of nature that is nobody’s fault” not effected by human agency; the rejection of a relation to human activity comes from state legislatures fearful of the employment rises brought by gas and oil corporations from being scared away from the state. But the geological record of apparently induced quakes in Oklahoma and their close proximity to existing injection wells.
The fear of such tremors has a recent prehistory of three or so years. An early tremor whose epicenter lay near Richmond, Virginia, of 5.8 magnitude, just below 6, but that sent shocks to North Carolina and Canada. The event raised questions about the role of fracking in 2011 for Tim McDonnell and Aaron Ross, described in an earlier article in Mother Jones that directed attention to fracking’s consequences. But the persuasive nature of recent USGS time-lapse maps of the same state–
The dangers of fracking echoes Jonathan Franzen’s early if compelling 1992 novel Strong Motion, in which mysteriously recurring earthquakes are pinpointed at the unlikely site of Boston, Massachusetts, a rare location of seismic activity. But whereas Franzen’s protagonist, Renée Seitcheck, believed “that these earthquakes are the byproduct of industrial drilling” by a petrochemical firm whose agents attempt to assassinate a beautiful rebel seismologist, for her mining of top-secret data from computers, the causes of the “swarms” seem to lie less in drilling than in injecting waste-water. Was the novel remarkably prescient in unveiling a concealed impact of post-industrial geocaching? It surely doesn’t seem so paranoid in its view of an industrial conspiracy to conceal geological findings, or to imagine the role of the rogue geographer in the seismically sensitive landscape that the search for underground sources of oil and gas can create.
But now it’s no longer isolated individuals who research the papers of top-secret labs. There are upwards of 40,000 disposal wells actually active in the United States, some tunneling 13,000 feet under the earth, and “injection induced seismicity” is now a field, as the pressure exerted by the displacement of water able to move rock layers has provoked widespread academic interest and industrial concern: “There are faults most everywhere,” noted Cliff Frohlich of the Institute for Geophysics at the University of Texas-Austin, suggesting how fracking can ‘reactivate’ fault lines which were never known; “Most of them are stuck, because rock on rock is pretty sticky. But if you pump a fluid in there to reduce the friction, they can slip.” “Water does not like to be squeezed,” Scott Ausbrooks of the Arkansas Geological Survey put it with some empathy. And while Franzen’s character pored over reams of secret data to understand the relations of seismic activity to big oil’s search for underground pools of oil, such relations are now the focus of conferences and are amply documented in data maps.
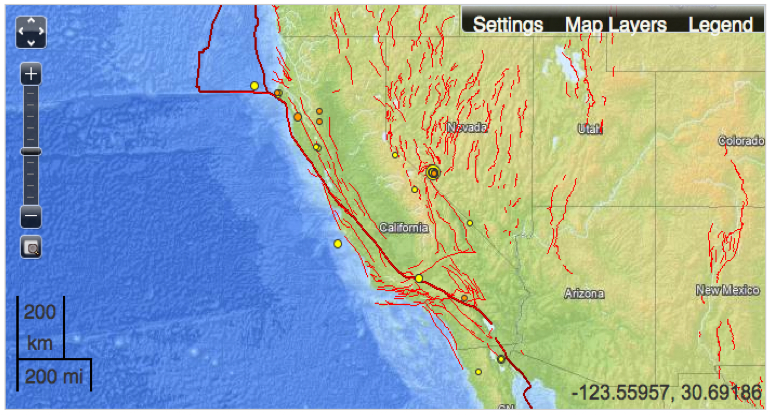
The best known faults the USGS has mapped are well-known. But, as Mark Zoback, a professor of geophysics at Stanford explained in a recent article by Michael Behar in Mother Jones, echoing Frohlich, “there are faults everywhere, and some are too small to be seen.” Faults are widely known if often forgotten by those living in California, where fracking may begin, despite growing opposition. Indeed the range of fault-lines throughout the California-Nevada region are so multiple that the possibility of hydraulic fracking in the region of southern California threatens to imbalance a rather threatening constellation of seismic activity that already exists in much of the region, and is more widely mapped than the most familiar lines of the San Andreas, Calaveras, or Hayward faults. The visibility of these fault-lines is available on an up-to-the-minute-map of regional seismic activity, part of a set of maps that record seismic activity by irregular bright red computer-generated lines, often proximate to cities:

The nervously drawn red lines of seismic activity furrowing the green plains in these maps are ‘underground views’ mapping the range of pressure below the earth’s surface. A more striking map of seismic activity of the past few weeks and days pieces together a narrative of fault-lines and tectonic plates that accentuate the daily deep divisions that course under the earth of our westernmost states:

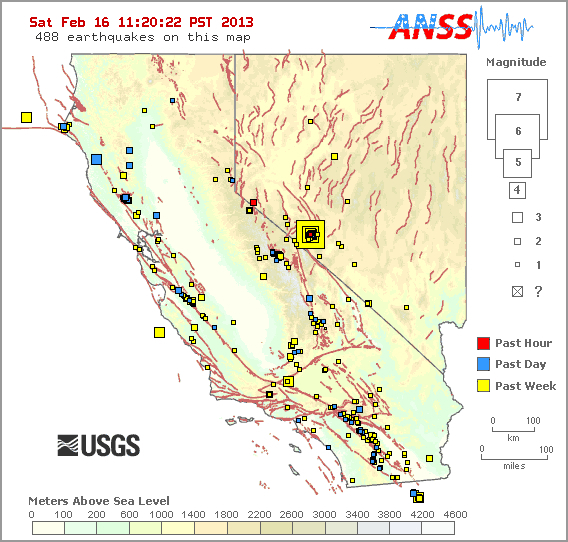
The stark legend suggests the huge growth in a magnitude the scale of “6.” The prominent indexing of fault-lines in another USGS map of seismic activity, with less attention to topographic or climactic variation, shows the volatility of the region’s multiple faults in a similar if starker image of seismic frequency:

More locally, and limited to faults active in the past week of a magnitude above 2.5,

For more focus on recent seismic occurrence, link your browser to: http://earthquake.usgs.gov/earthquakes/map/
Despite the evidence of terrifyingly active fault lines, the active movement ‘Stop Fracking in California‘ has its back against the wall, even if they are growing in local Southern California chapters.
Yet the volatility of the region cannot be ignored–take this map of the Simi Valley and Los Angeles area, posted on Saturday, February 16, where fault-lines course unseen beneath the landscape, moving from inland to the coast at multiple points and through metropolitan Los Angeles:

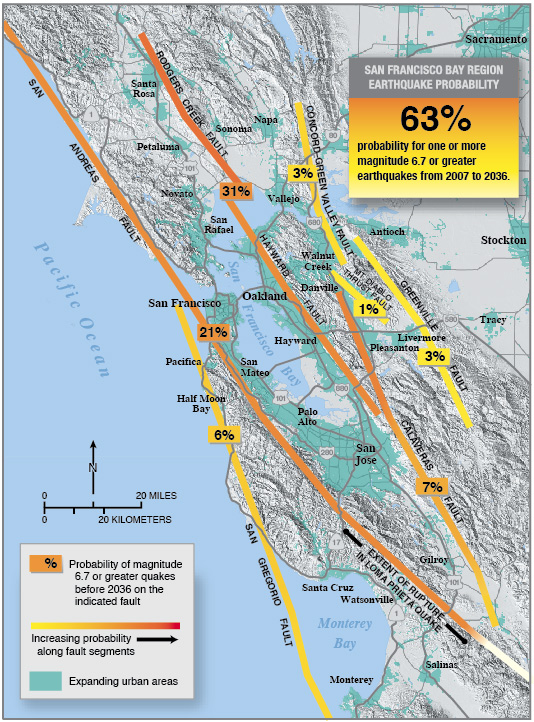
This interest to frack in California–an oddly post-modern verb–is scariest given maps approximating the future likelihood, as calculated by the USGS, that the regional fault-lines in the Bay Area will experience seismic activity at a magnitude greater than 6.7 before 2036.

By how much would active injection wells multiply increase these already quite sizable odds? Given the proximity of these lines to expanding urban areas, often growing between the Hayward and San Andreas fault, can fracking in California be a safe investment for the future?
This is not a map that is in the heads of most native Californians or residents. The readability of these maps offers a base-line for future seismic activity, and grounds for concern about hydraulic fracking in seismically active regions.
It is good news that the USGS has expanded its clickable interactive image of global fault lines, in which the record of seismic activity is updated every minute, and on which viewers can scale in to investigate on their own:

While the occurrence of faults and tremors will always shock, its legibility not only offers a lesson in continental drift. Many of these jerky lines reminiscent of an etch-a-sketch lie underwater, but the points of greatest activity–in California, Indonesia, and Central America–cannot be ignored or lost sight of for underground engineers.