
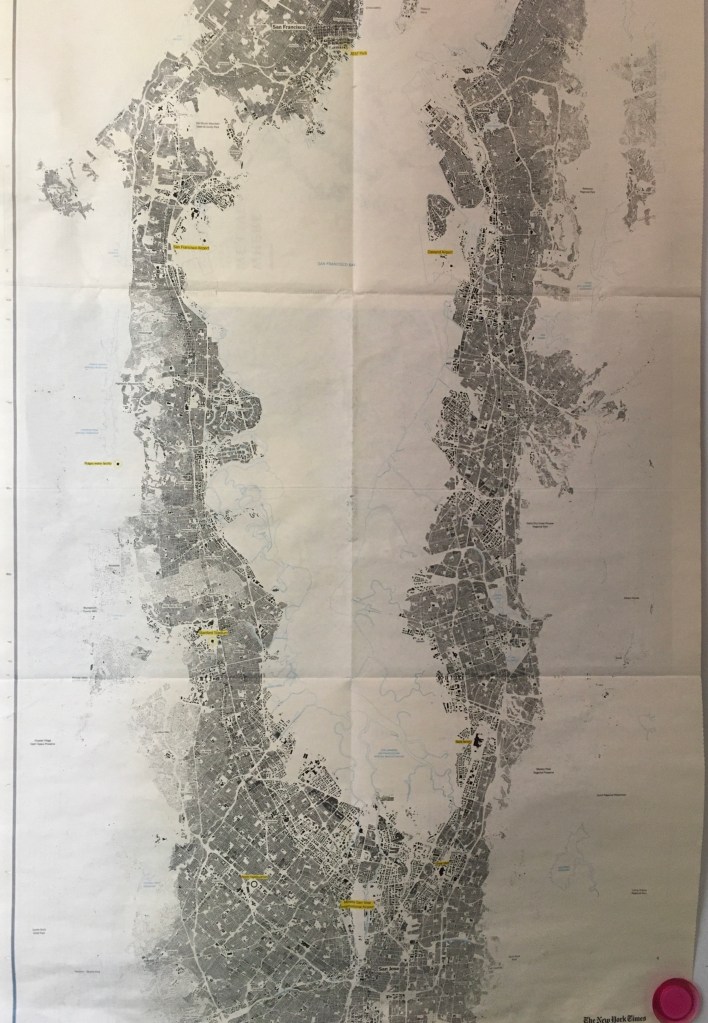
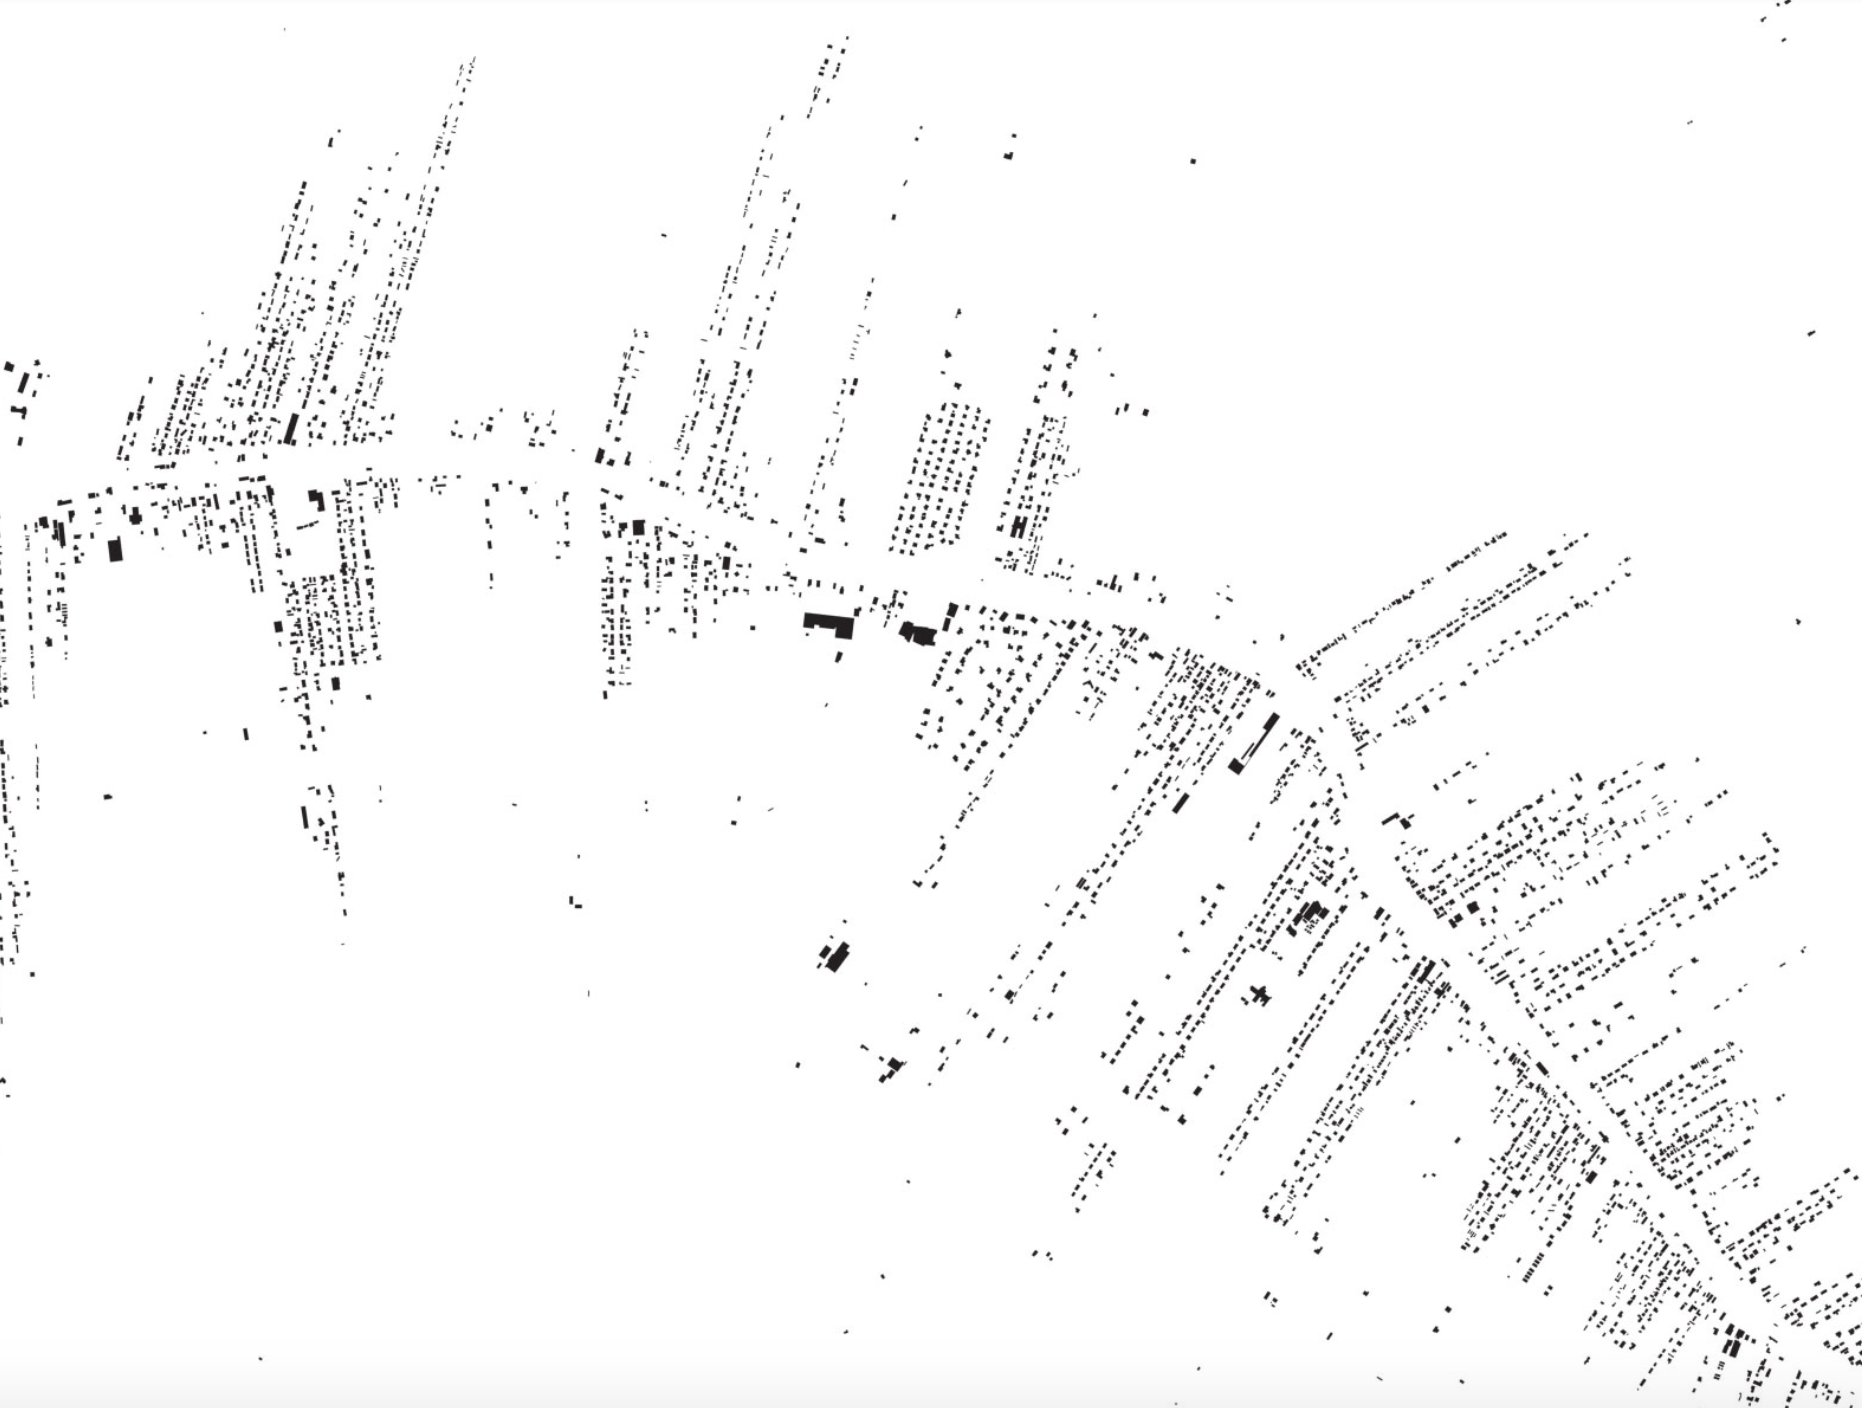
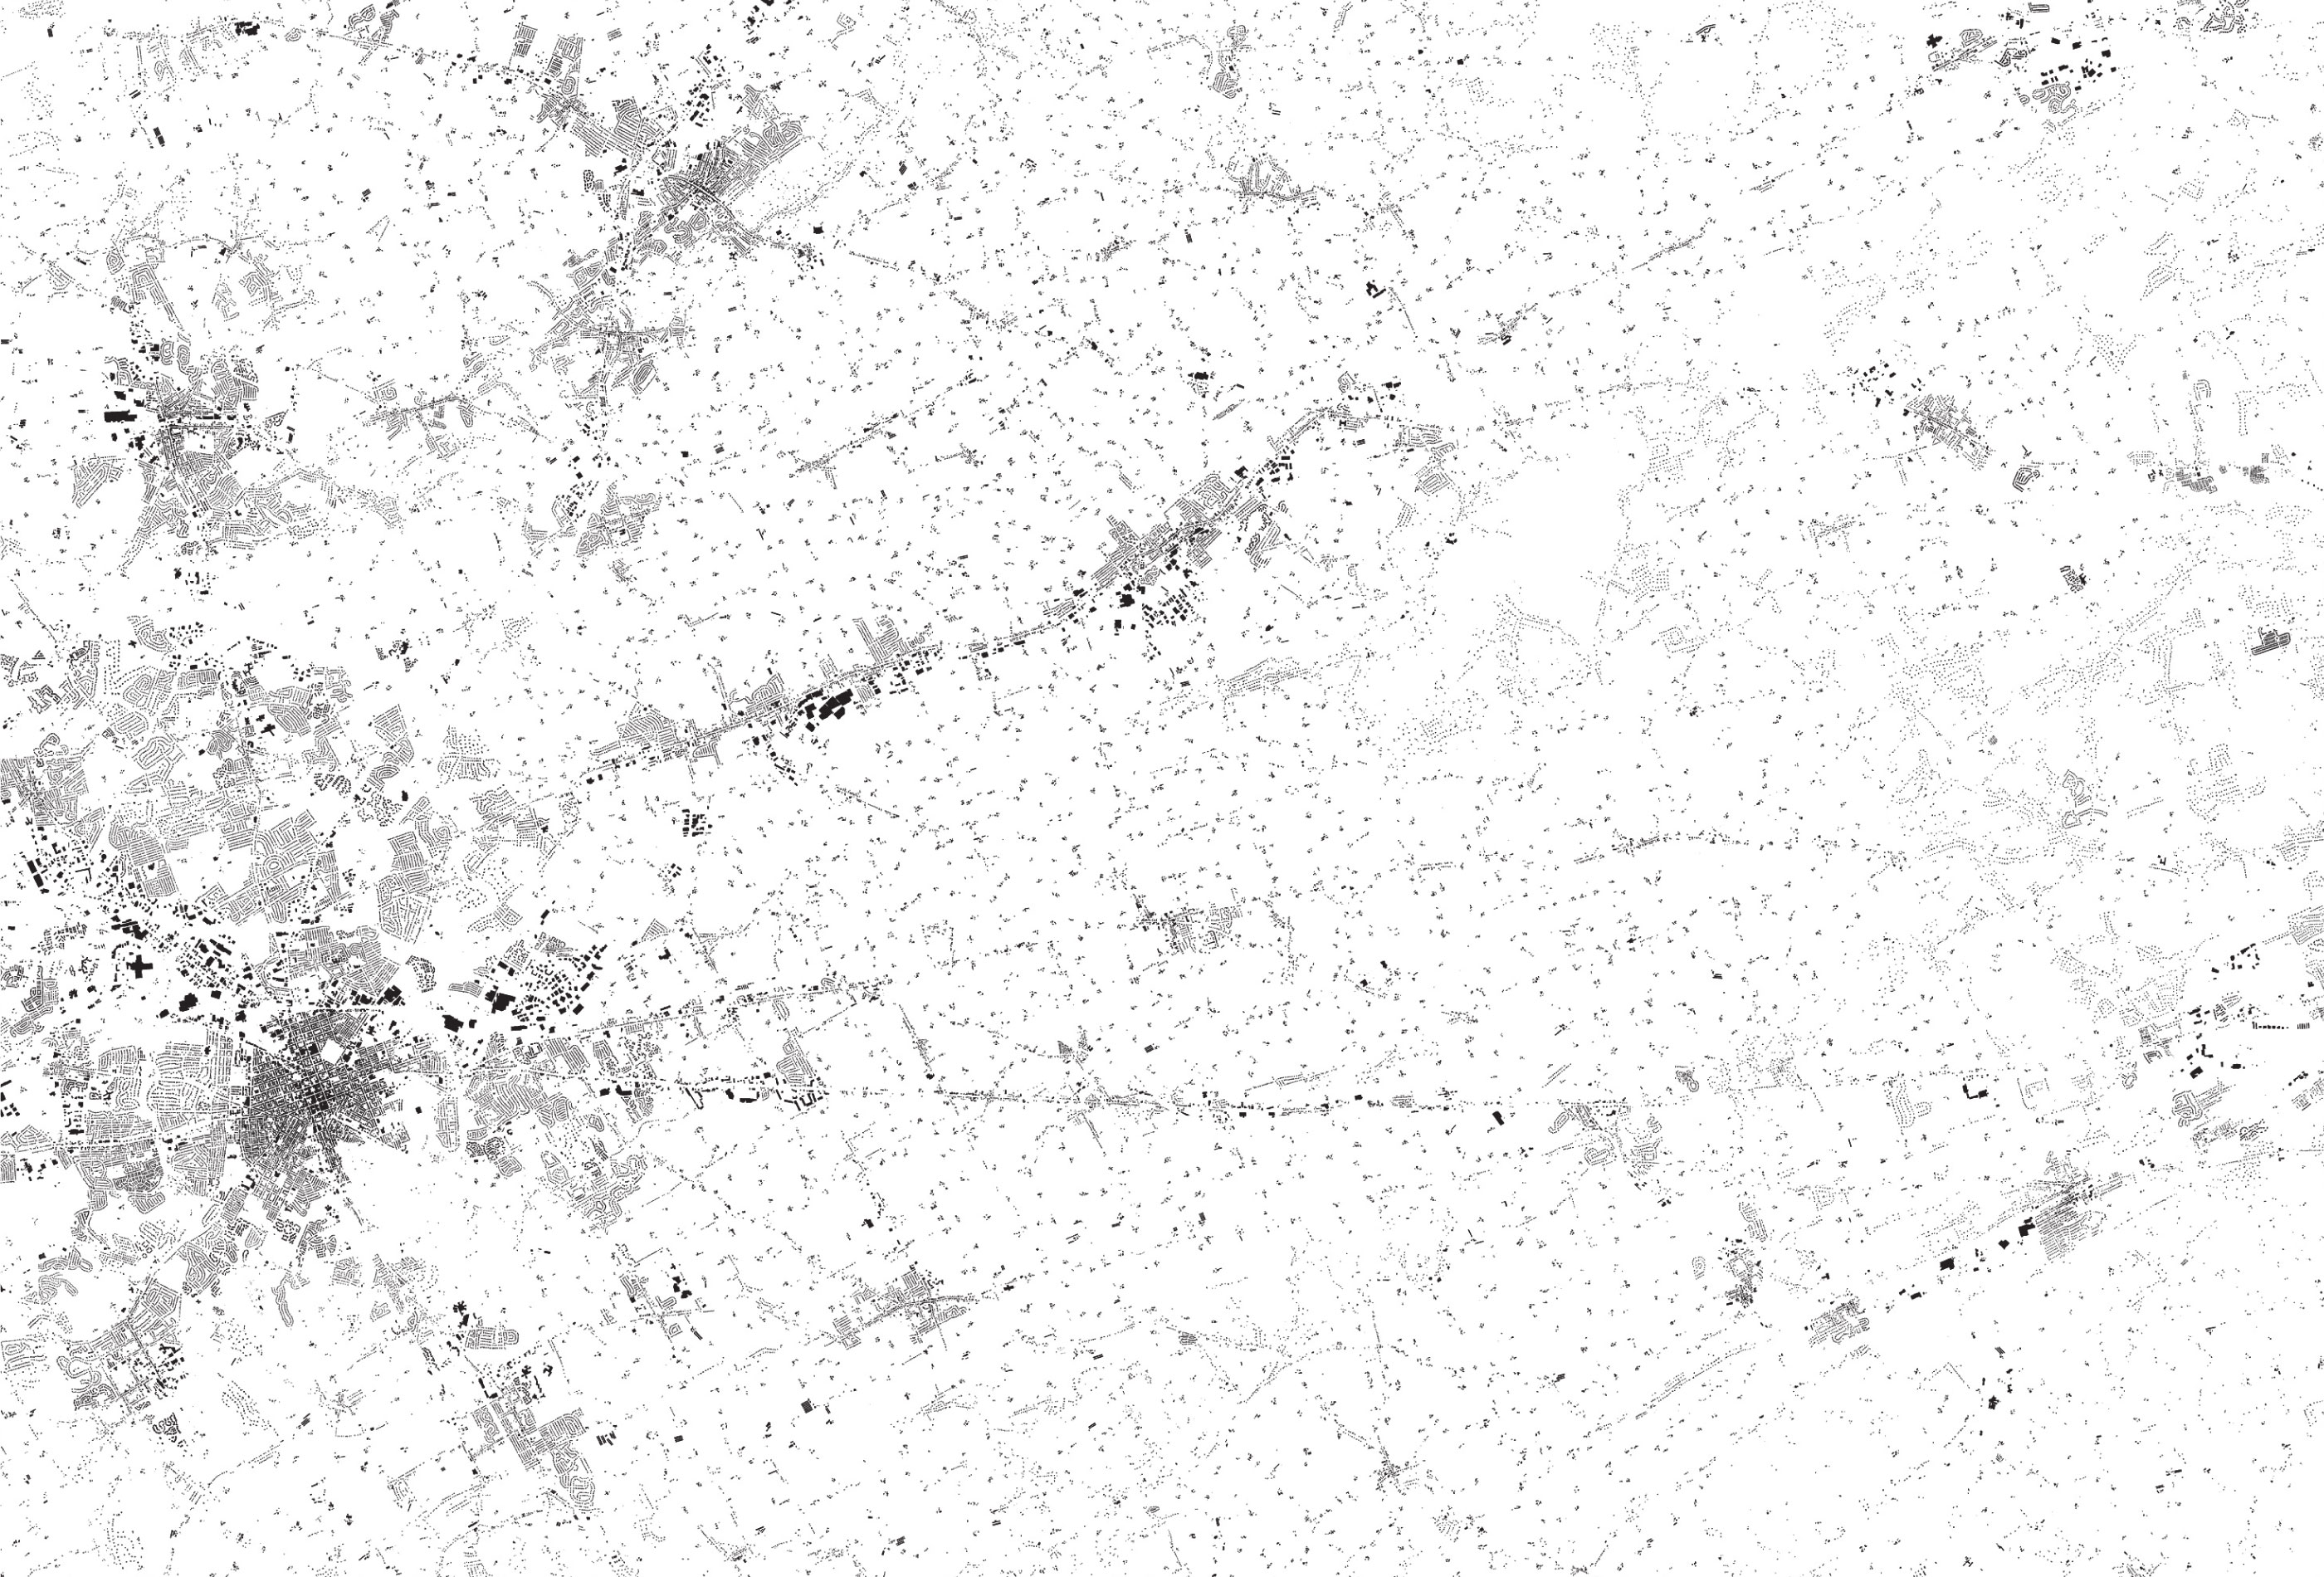
Walking the streets in my now apparently abandoned neighborhood for an errand after a few weeks of sheltering in place in Oakland, I had the eery experience of navigating and inhabiting empty city. While I knew the pavement, I almost felt no longer familiar with the streets that afternoon. There was the sense that no one knew the state of affairs about reopening, and many were just puzzled about how to proceed: as a few young kids skateboarded up Shattuck Avenue, profiting from the lack of cars, some odd improvised bicyclists were on the sidewalk. The absence of interaction was a weird pause indeed, giving an eery sense of the timelessness of space, as if the time/space fabric by which I had long seen the neighborhood was suddenly out of whack. While no visible destruction had happened or occurred, the disembodied nature of the inhabited world was drained, even as it was filled with sunlight and birds, giving me the eery sense I had had when I looked at the machine-read maps of building footprints, “Every Building in the United States,” whose section situating Bay Area buildings hung on our refrigerator wall, like a scary map of the archeological ruins of a future Baedecker Guide to the ruins of San Francsico.
Had the designers of te interactive webmap of machine-readable imagery Microsoft had assembled intended the eery effect of describing the inhabited world as a ghostly ruin of lived life? The relegation to place-names to a very secondary status in the image of the overbuilt landscape seems to lie on the edges of the black blocks of built space that is was the basis for the AI map distilled from aerial photographs, and parsed as black and white data. If its form seems oddly ghostly, the reduction of the monochrome paper map reveals shades of grey that fade into rare open spaces, where one’s visual attention seems at first drawn, before one returns, with hopes for some sense of recognition, to the built spaces that one knows, and the congestion of black that marks urban agglomerations. The black boxes of settlement reveals the crowding of our coasts, the density of much urban housing and indeed of the area of the East Bay where I live, but is also an eerily image of an inhabited landscape selectively organized to omit any sign of living presence–either of “wilderness” or habitat, but anthropocentrically maps the anthropogenic world as if for posterity. For is not the black boxes of building footprints something like a record of the anthropogenic imprint on the world, by now extended across the globe. The building footprint map derived from AI is a rewriting of the ancient notion of the ecumene–the “habitable” more than “inhabited world”–or οἰκουμένη, which sought to encapsulate the inhabited regions as the ones that entered human comprehension: is it a removal of the humanist object of the map, now mediated through machine learning?
If the ancient geographers discussed the οἰκουμένη as the “habitable world” from the frozen north to the scalding sub-equatorial lands that seemed to “balance” the inhabited regions, as if what merited human attention and contemplation was that region that permitted settlement: the turn to a record of imperial administration in the Roman Empire–and of religious unity in a ‘civilized’ world–introduced the governmentality of the control over the inhabited world, that by the Renaissance had become an enticing image of national incorporation and political ties, that became intellectually articulated in the post-Cold War as a global ecumene of imperial cultural dominance and integration incarnated in European inheritance of political institutions, science, technology, and economic forms as a world system: the association of a global integration whose exponent in historical texts was perhaps William McNeill’s Rise of the West (1963) had withered away by the time of the data-driven map of inhabitation, as we have become increasingly aware of mapping the human impact on the world–an image in which the building footprint map might be placed.
It is hard to discuss intentions in a map that was organized by AI, but the ledger size newsprint that covered almost a full side of the refrigerator, hanging on magnets, assembled a flyover of the ruins of a future world, a snapshot of each and every building in the area. The result is a poor excuse for a “wall-map” of the region of Northern California. It seems more of a memento mori of the prosperity Silicon Valley once enjoyed from a future world, registering the intense economic growth that fueled the housing bubble along the San Francisco Bay, in an unintentional snapshot of the explosion of paved space and housing across the coastal margins of what was once one of the more “edgy” areas of the United States: entertaining the imagined future might have created the perverse pleasure of hanging it in my kitchen, long before COVID-19 struck, a celebratory if slightly morose record of the world in which we once lived.
But the sidewalks were empty and sun intense; storefronts often boarded up. The streets were no longer places for salutation or recognition, even if I greeted a familiar mailman on my way home: as if no time for social niceties remained I walked down the sidewalks and into empty streets, rarely negotiating margins of safety, or distancing with a few folks on foot, noticing with a cringe the large number of homeless who stood out against the stark streets, closed storefronts, and empty stores.
They were, as it were, always there. I had been cutting myself off from the surroundings, as I never thought I would. As I had been sheltering, thoughts going global as I was following updates about the pandemic, this was a stone’s through from my home, so many had none. Looking down Adeline Street, at the still tents of homeless encampments that may have multiplied, I felt new distance gaping between us, as the very streets I had walked down regularly seemed to have been forgotten while sheltering indoors, the stores now empty, their windows recently boarded, few driving in the streets where one might walk without danger. The eery absence of population was a scene from The Last Man, momentarily interrupted by an isolated airplane, the first seen in days, flew overhead: I felt like I was on a filmset, more than where I lived, a tracing of life past.
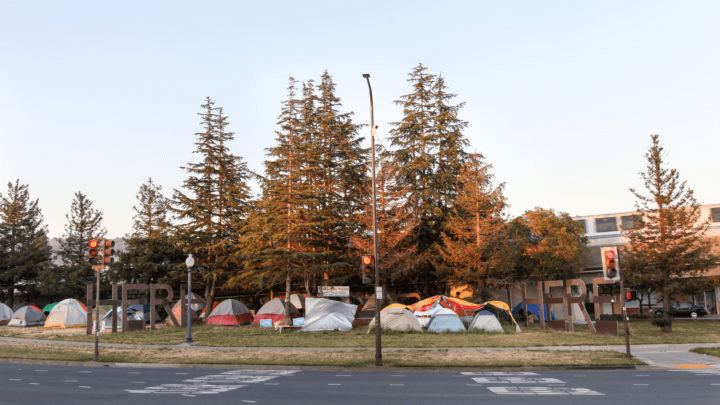
If we were sheltering, what was place, anyways?, I wondered with the footprint map in mind. Empty streets looked like nothing more than an apocalyptic reimagining of the neighborhood, drained of inhabitants, save the apparently increasing cluster of homeless tents, looking far more embattled, and more survivalist than ever. If the building footprint map was restricted to spaces where people lived and work, the ghostly anthropogenic substrate seemed to have an eery counterpart in the homeless encampments near my house. The survivalism was evident in the homeless settlement that had in recent years overflowed, expanding to fill in the island of trees where how Steve Gillman’s 2011 public sculpture marked the interurban divide. The public sculpture elegantly if snidely punned on the allegedly dismissive pity saying ascribed to an icon of modernity about her native home–“There’s no There there“–as an entertainment for motorists, or BART passengers, as much as a public art for pedestrian passersby–by broadcasting a literary reference in greenery.
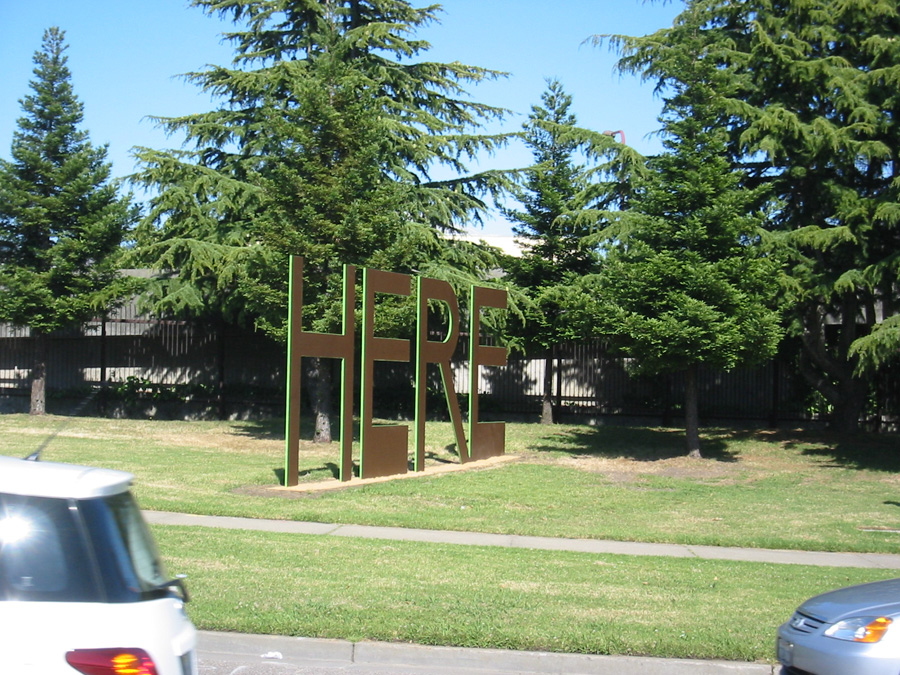

The two words marked the Oakland-Berkeley border by two words, now rusted fifteen years later, as relics of an earlier epoch themselves: the homeless encampment blurred both sides of the dividing line between the cities which had long since melded indistinguishably in the increasingly gentrifying area where I had lived for twenty-odd years.
The erasure of a sense of “here” that was promoted by the public sculpture seemed erased in the AI map, that reduced space to built houses, even as the homeless were the only residents in sight as I walked around the tensely empty neighborhood. I’d long appreciated, if a bit begrudgingly, how the Gateway_Project defined the edge of Berkeley CA took Gertrude Stein’s saying and liberalized it in hight-foot tall powder-coated steel letters, where the BART tracks go underground, intended as “a literary and whimsical welcoming to Berkeley,” where they supposedly read not only Stein’s poetry, but where so many poets had lived–and was a “here” worth commemorating by sculptured letters, a new Fons et origo of the Beat Generation, perhaps, or a dynasty of mid-twentieth century poets–Kenneth Rexroth; Czeslaw Milosz; Allen Ginsberg; Gary Snyder; Frank Whalen; Thom Gunn; Robert Hass–by 2002 recognized as a literary patrimony. Designed primarily for passing motorists, as if few could be imagined to walk nearby, the site built to commemorate a “sense of place” had become a cluster of encampments, as if that was the only place that existed at a time when all remained shuttered indoors–if in 2010, just ten years ago, one letter was covered, by a group of Oakland knitters, to transform it to “HERE/HERE,” peacefully protesting the work as barely concealing an agenda of gentrification.
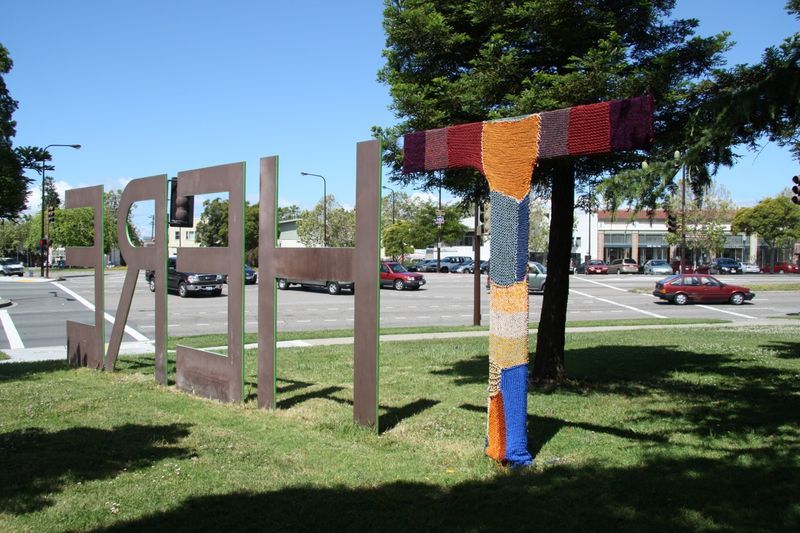
The collective of knitters who had covered the “T” as if to object to the tired trope with which Oakland was long saddled was the result of a. relatively calm tussle, cast as a border war against gentrification. But the global pandemic had subsumed any distinction of “here” and “there” in a new global: the AI map seemed to be indeed a snapshot of the scale of habitation before the pandemic, a ghostly picture of an earlier time.
As I walked through it, at least, the same North Oakland neighborhood was suddenly, if maybe temporary, rendered ghostly: the built landscape that I was inhabiting was the same world, with fewer inhabitants, and less secure attachment to palce–as if the artificial interruption of indoors life shifted my relation to built space, made it harder to navigate, and shifted the security of place, and indeed removed any sense of recognizability from the built landscape, almost to ask what the civilization was that led to the building of all this paved space.
The unmooring from physical presence was like being dropped, I imagined in a flight of fantasy, to that Microsoft map, so akin as a snapshot to the sort of map of archeological ruins future generations might trace as guidelines of orientation to a lost past, when what was the greatest “here” of antiquity–the city of Rome–was etched by nineteenth century archeologists and antiquarians by the physical plant of what once stood on the site of the ancient Roman forum, only perceptible to the eyes of tourists if they had trained themselves on the map to imagine the ghost-like presence of architectural monuments that had once affirmed the place of Rome at the center of the world at a far earlier time.
Where was here, now, on the AI map? Was the tie I was drawing between the map and the uninhabited neighborhood only the depressive meanderings of a middle-aged crisis? Or was it a global one? West Berkeley and North Oakland had been certainly rendered quite a different place, quite suddenly, and not a comfortable one–still inhabited by ghosts. Stripped of my points of reference or familiarity with my neighborhood, a few dispossessed in the sidewalks, of what wasn’t a nice area of town, I was reminded rather urgently of ongoing part of urban life no longer framed by sounds of traffic, public transport, open businesses and pedestrian sounds, that continued while I was indoors. The degree zero of urban life reminded me of the empty landscape of building footprints that, in a detailed satellite overview that recalled nothing more than the outline of an archeological dig of ancient city, as if drained of motion, and filled with apprehension, in a damn eery way. Was this a pause or a new landscape?
I had only recently been navigating the 2018 building footprint map, “Every Building in the United States,” and aout a year ago, hung the section of the houses of the Bay Area onto our refrigerator wall. The creation of Microsoft that was removed as one might imagine from the ancient notion of an “inhabited world,” comprised of building outlines, a distanced description of the world a declination of mapping human settlements, mediated through what seemed the iconography of an archeological map of a removed time, rather than the actual lay of the land–or, better yet, it seemed to exist in two planes more than ever, and both as a historical record of a snapshot of built space across America, and of actuality. The interactive website of the machine-readable result of aerial imagery that invites one to zoom closely not on landscapes, but a black and white rendering of built space, recalled nothing more than a flyover of the ruins of a future world.
The aerial snapshot of each and every building in its current position had a sci-fi aspect of a record of space drained of nature, biodiversity, non-anthropogenic environments, and life–distilling selectively the extent of built spaces across an otherwise quiet and otherwise uninhabited world: as if the perfect document of the anthropocene, this was the built landscape, removed from and detached from a natural world. This was the built landscape of the region, divorced from the lay of the land, as if a perfection of the GPS contents of street view, without any street traffic or greenspace at all. The stark interactive map of 2018 seemed to be newly present to the space I was negotiating in my mind, even more stripped to its bare bones and evacuate of inhabitants.
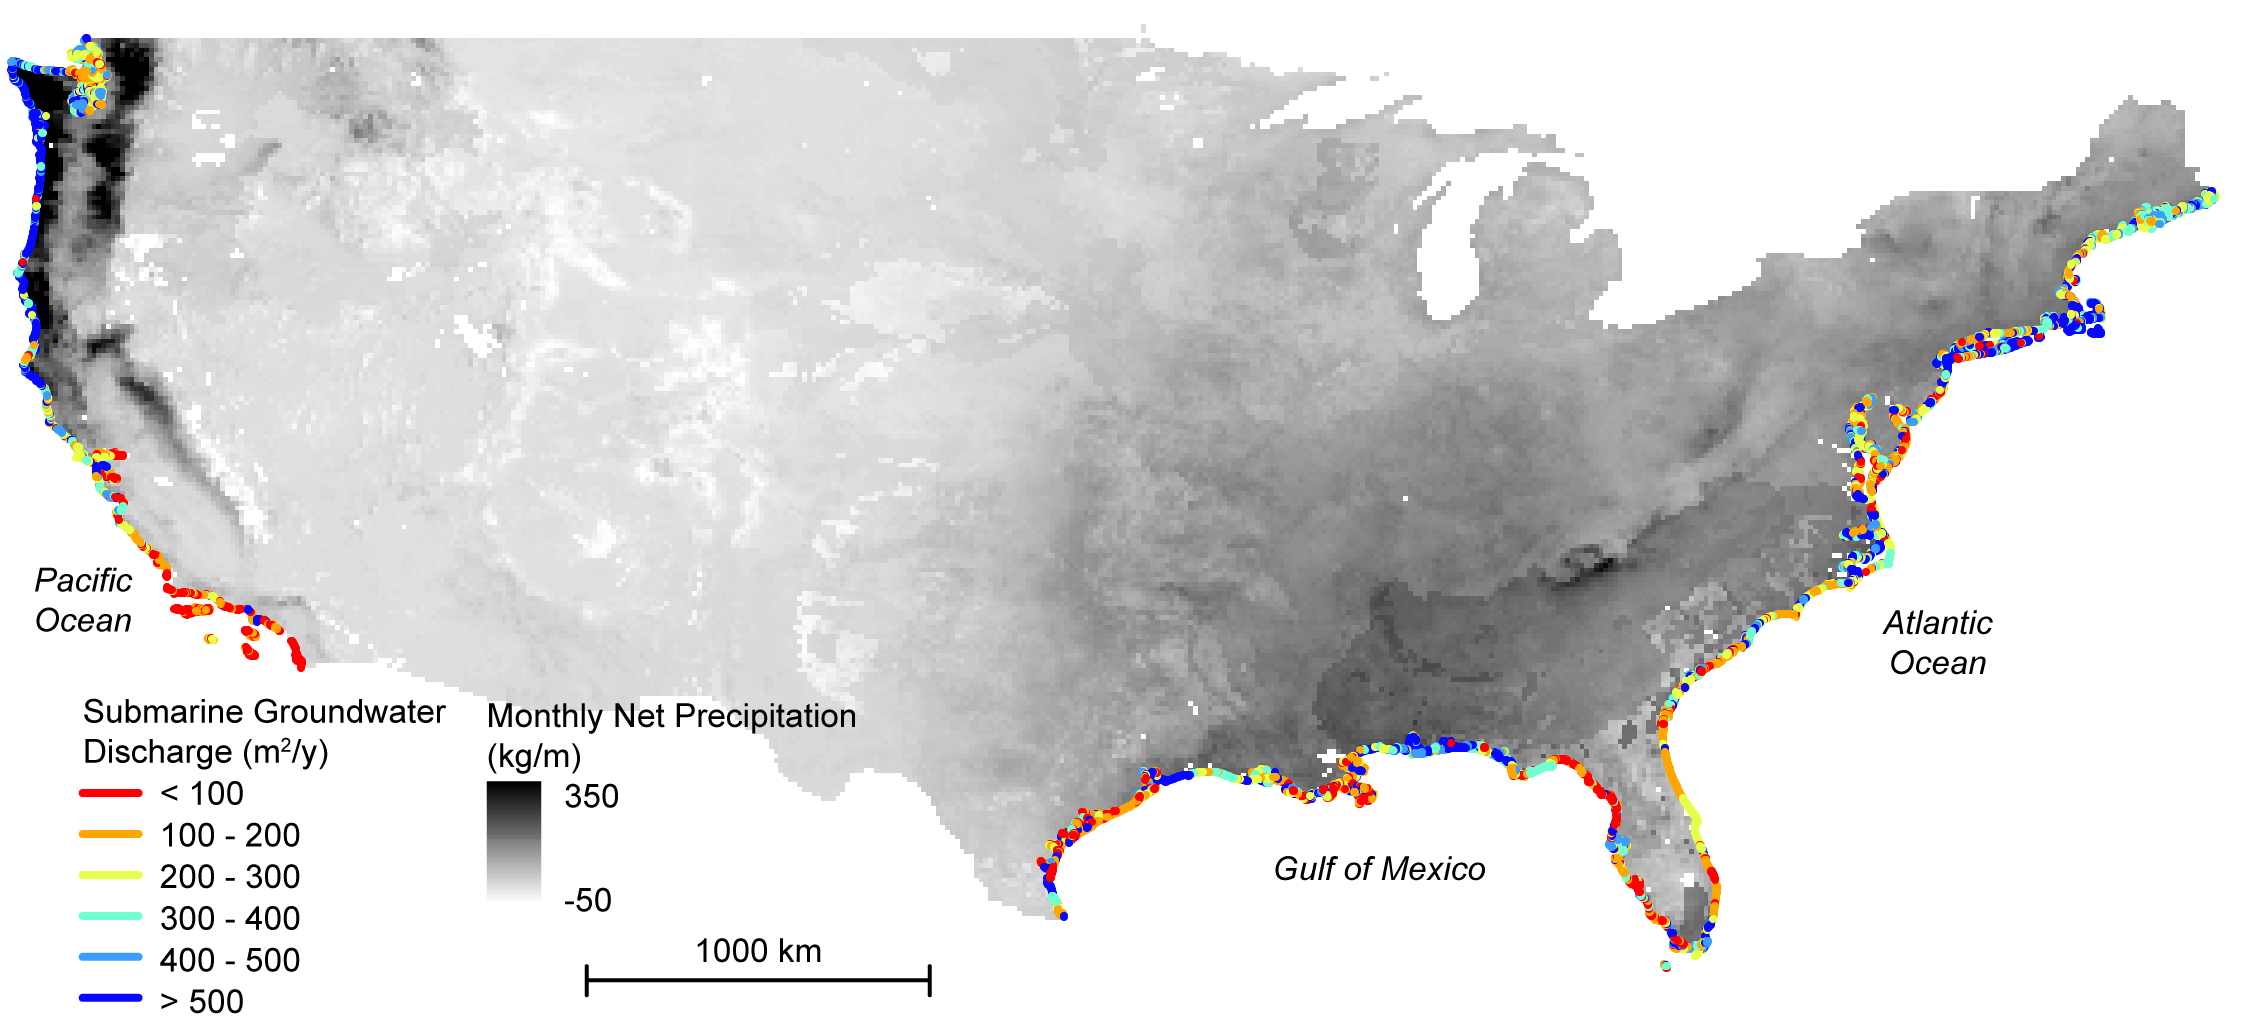
The vertiginously uninhabited interactive map peered at onscreen allowed one to look at the nation and soon to whatever spot on the map, suddenly panning and focussing into crisp detail, but lacking all sign of inhabitants, save the names on each street or place. The sense of exploring a neighborhood I once knew may have been an accelerated arrival in late middle age. But the spatially empty landscape of building footprints encountered I opened in 2018, “Map of Every Building in the United States,”was filled with a sense of dread and of testing my own geographical knowledge, scanning to familiar neighborhoods and structure, and matching abilities to recognize the flattened forms against the material structures with which they correlate. There is no sense of the amount of chemical waste and diesel pollutants in the nation’s largest port, Long Beach, pictured in the header to this post, where pollution has caused ongoing health problem for residents.
Despite the immediacy of this comprehensive map of the nation–comprehensively tracking and signaling each of its buildings, read from a satellite flyover view of amazing detail–seems striking not only for what it shows–although that is the content that grabs the viewer’s attention, and leads its interactive functions to be so striking–and compelling–but what is left out, the things that lie on the edge of the buildings, that are never hardly or clearly able to be separated form the anthropogenic imprint of building footprints, but inseparably go with them–especially on the nation’s shorelines, that are increasingly reminding us that no line is hard or impermeable, and that where things move on a map are perhaps always the most important and most difficult to remember to include.
The aerial perspective reveals a human “footprint” of each building, as read by computers trained in distilling satellite imagery, augmented by local and federal maps. The result, in either printed or interactive form, orients viewers primarily to a flattened world of increased solidity, a flatland of a landscape entirely built, removed from locally varied environments, stripped of weather, soil, or climate vulnerability, patterns of rainfall, hydrology, or geomorphology, but registers the substrate of building patterns across the United States. Although the machine-read footprints, a conflation of the human intelligence inherent in all mapping and the abilities to train machines to recognize built footprints, seems a weirdly disembodied map, it is easily able to be invested with oddly commemorative elements, or an elegiac tone, as if it was recorded from a point in the future where one looked back in time to a human past.
In an era when we usually rely on satellites maps not only to indicate a synthetic record of the spectrum of weather risk of the impact of global warming on the nation over–

but the extension of our usual cartographical indices, as warming maps that confirm the expansion of the lines of the Tropics by a half a degree a decade, as the climate zones have quite decisively expanded by thirty miles each decade, and tropics determined by where the sun lies directly overhead in solstices, or at about 23 degrees north and south, but is measured by the pattern of the circulation of hot air rising at the equator falls back to earth, creating a dry middle region of the earth known as the Hadley Cell has grown since the 1970, shifting in the north and south by 0.2-0.3 degrees of latitude per decade, and bringing drier, as rain decreases in subtropical regions and the Mediterranean, and the Sahara expands,

Tropics Expanding at a Half degree a Decade/Sttaten et al, 2018, graphic by Katie Peek
and the hundredth meridian that divides weather of the arid plains form the wetter eastern zone in the United States has shifted eastward by one hundred and forty miles, shifting the historical western climatic divide with terrifying implications for farming, irrigation, croplands, and national water supply.
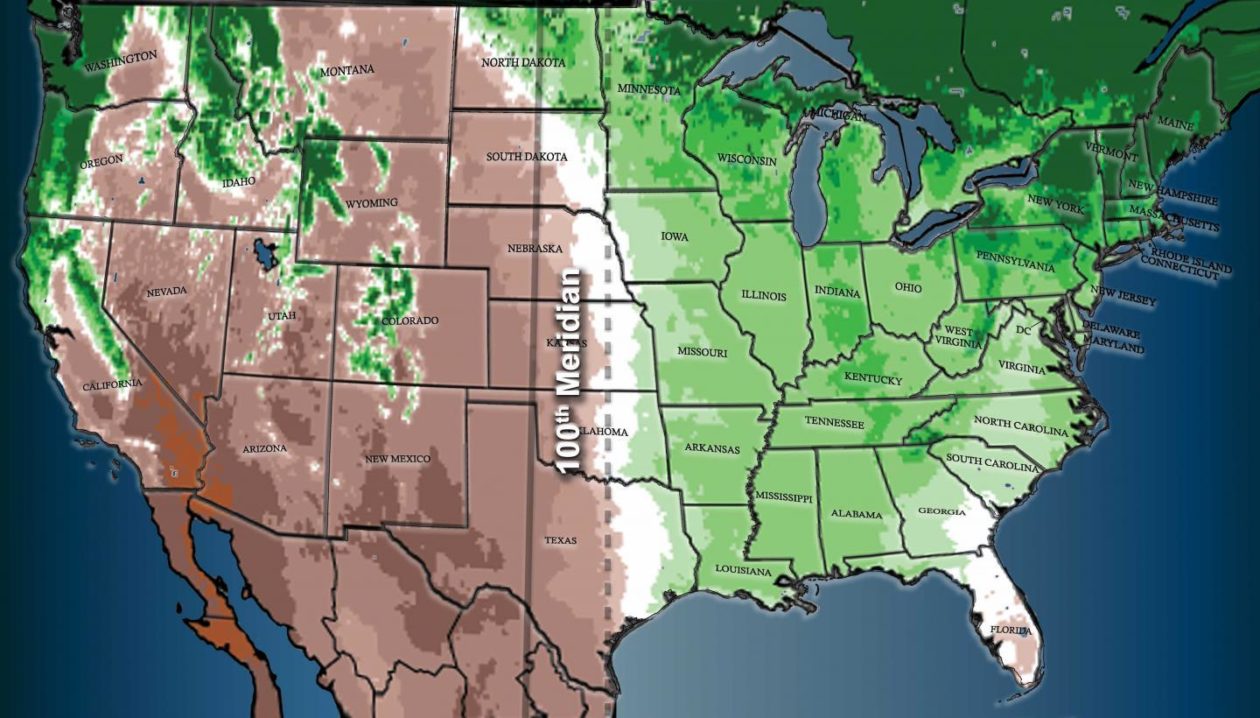
Modification of Climactic Divide by Climate Change/from Seager et al. (2018)
Decreased groundwater from lower levels of precipitation and the risks that this poses for our groundwater has been alarmingly mapped by satellite–
NASA
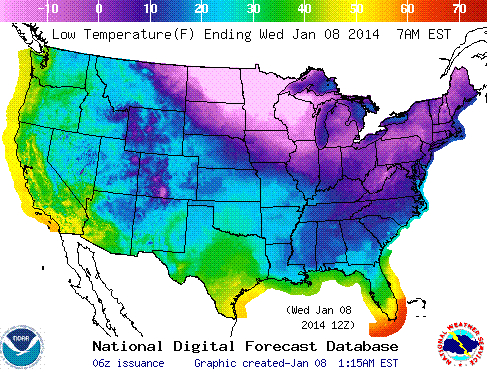
–at the same time, maps propose forecasts of future temperature increases and new extremes of aridity and drought in much of the midwest–
–and the micro-scale of GPS pinpoint increased risks of future seismic activity in overwhelming ways, for which we are hardly prepared–

USGS/2014
1. There is a refreshing palpability and materiality of a web-based map liberated from overlays, by which to access the material presence of human habitation, as if to reaffirm the settlement of the continent in ways that remind us of the density of human population centers and indeed the location of each built house.

The dynamically detail of the interactive map in online and paper versions afford a virtual flyover of each house–each building!–in the nation, in a comprehensive catalogue of how humans were actually transforming the landscape, or the cumulative changing of the built landscape in North America, or the lower forty-eight, that seemed a map of indisputable reality, rendering material presence in all too refreshing ways. But the AI imagery of a “built environment” suggests wrestling the concept of a “footprint” to the ground, removing it from the rest of the environment, and trusting computerized vision to reconstruct patterns of physical resettlement–shifting attention from recent concentration on the impacts of human communities in the age of the anthropocene. While the image does allow us to examine what we mean by the “city” today, in a time of urban sprawl, and to describe urban corridors, coastal strips, and intense congregations of built environments, the absence of inhabitants is oddly ghostly, as if it were an image of archeological ruins or built remains.
Is the sheer reduction of informational content–paring the built world down from environmental influences, air pollution, or land surface impermeability and change, or place-names, a view that shows the amount of area that remains for human settlement in the lower forty eight, without preserving ? I kept returning, most of all, to the fragile ghostliness of the map that lacked people, and which seems to show now human impact because it is both for a future age–if not a reconstruction of a past moment from a future point. The sense of melancholy was not only due to the retro black-and-white starkness of the map, but its pictorial poverty and eery association, which I couldn’t close, with mortality. I toggled between these two points of view. The ghostly settlements seemed to be archeological ruins, images of a world without people, of the post-human, and scanned and measured by machines refusing to register the place of humans in the built environment, and filtering or outright removing them from it.
When I looked at the region of upper Manhattan where I was raised, the map triggered memories of space, and my own abilities of spatial judgement, as if it offered an actual yardstick to be read against my earliest sense of place. The creation of such a static vision of the gridded city blocks of upper Manhattan suggests a rhythm of settlement different from the Jersey shore or inland, encompassing a diversity of settlement patterns, with nothing like a plan, that seems an encomium to the density of its coverage, taking stock in a particularly flat temporal sense of the density and intensity of the clustering of residential areas and sharp differences of built space.

But there is also an eery sense that the monochromatic surface of a virtual flatland invited a sense of spatial deciphering quite unlike other mapping surfaces we are accustomed to interact, or web maps that augment and ask us to match up with our spatial knowledge. If the reliance on mapping services is argued to weaken or alter our sense of orientation, the machine-read imagery from detailed satellite photography served as a prosthetic to orient ourselves to space again, its clean-cut outlines of solid black serving to show streets as we had never seen them, a mosaic that was undoubtedly the result of collective building practices over time, bestowing a sense of coherence on architectural planning, and oddly–if one read it as transparently as it invited–in ways that naturalized the built land.
For me, there was also an inescapable haunting quality in the map of each structure’s physical footprint, which seemed to serve as a memorial for the expanse of human habitation at one time, and a map that could be thrown into three dimensions and historical perspective from an undefined future as a record of the density of habitation of our coasts and cities as a future past–as if the comprehensive visual survey represented a high-water mark in our inhabitation of space, before the apocalyptic moments of global warming or climate change, and before the burning of increased fires rendered many of the houses in the west coast, near where I live, either uninhabitable or disappeared, as the structures that they trace start to look far more like archeological remains, especially as they are mediated by the computer-recognition of built polygons from a remotely sensed high-detail imagery. The new frontier of remote sensing–in which high resolution datapoints can be surveyed, photographed, and compressed, created and rendered as composites that create cloudless images of place, comes to a new head in the training of machines to read the imprint only of buildings, in ways that stand to pose a challenge for the map as a human creation–or as a human urge to map–even if the machines that read such imagery were of course designed by humans, and are not alien to the human race. But the mechanized mediation of “vision,” “tracing” and rendering along geodetic coordinates are far removed from the human forms of mapping that we seem entering the “mind” of a machine.
Because of the machine-drawn nature of the comprehensive maps of buildings–the utmost man-made creation–there is the sense that the survey pushes tools of mapping to a new frontier, as well as offering a new way to observe or surveil our built landscape in a greater detail than ever before, zooming into specific details that give high-res image of high-scale places, and teaching us to look again through different eyes at the inhabited world. That the image so clearly resembles the tracing of ancient ruins of the late nineteenth and early twentieth century is not only uncanny–it is profoundly disturbing and odd.
The assembly of such a comprehensive visual survey, if absent from the mountains, rivers, streets, and open spaces, suggests a counterpart to an actual census of population, if one deeply tied to the clustering of residence and lopsided density of the nation, and accentuates the anthropogenic nature of the sites where most of the population live–weighting the map in ways that suggest a deeply cosmopolitan perspective, and suggesting the emergence of a landscape less tied to land-use, denatured and denuded of trees, forest, foliage, leaves or landscape.
The map derived from training computers to detect built structures in a huge database a huge public database of building footprints read from satellite vies was amplified by the Times through local and state maps of buildings’ footprints to create an interactive exploration for readers that presents an image of the footprints of each structure–particulate matter, marine trash, debris, not to mention the levels of ozone pollution generated near Long Beach, a site of notorious for release of toxic gases, ozone and particulate matter–based on a recent environmental health assessment by CAL EPA, not to mention offshore fracking, or the pockets of poverty around Long Beach–mapped in the header to this post, and is a site of high carcinogenic risk.

.
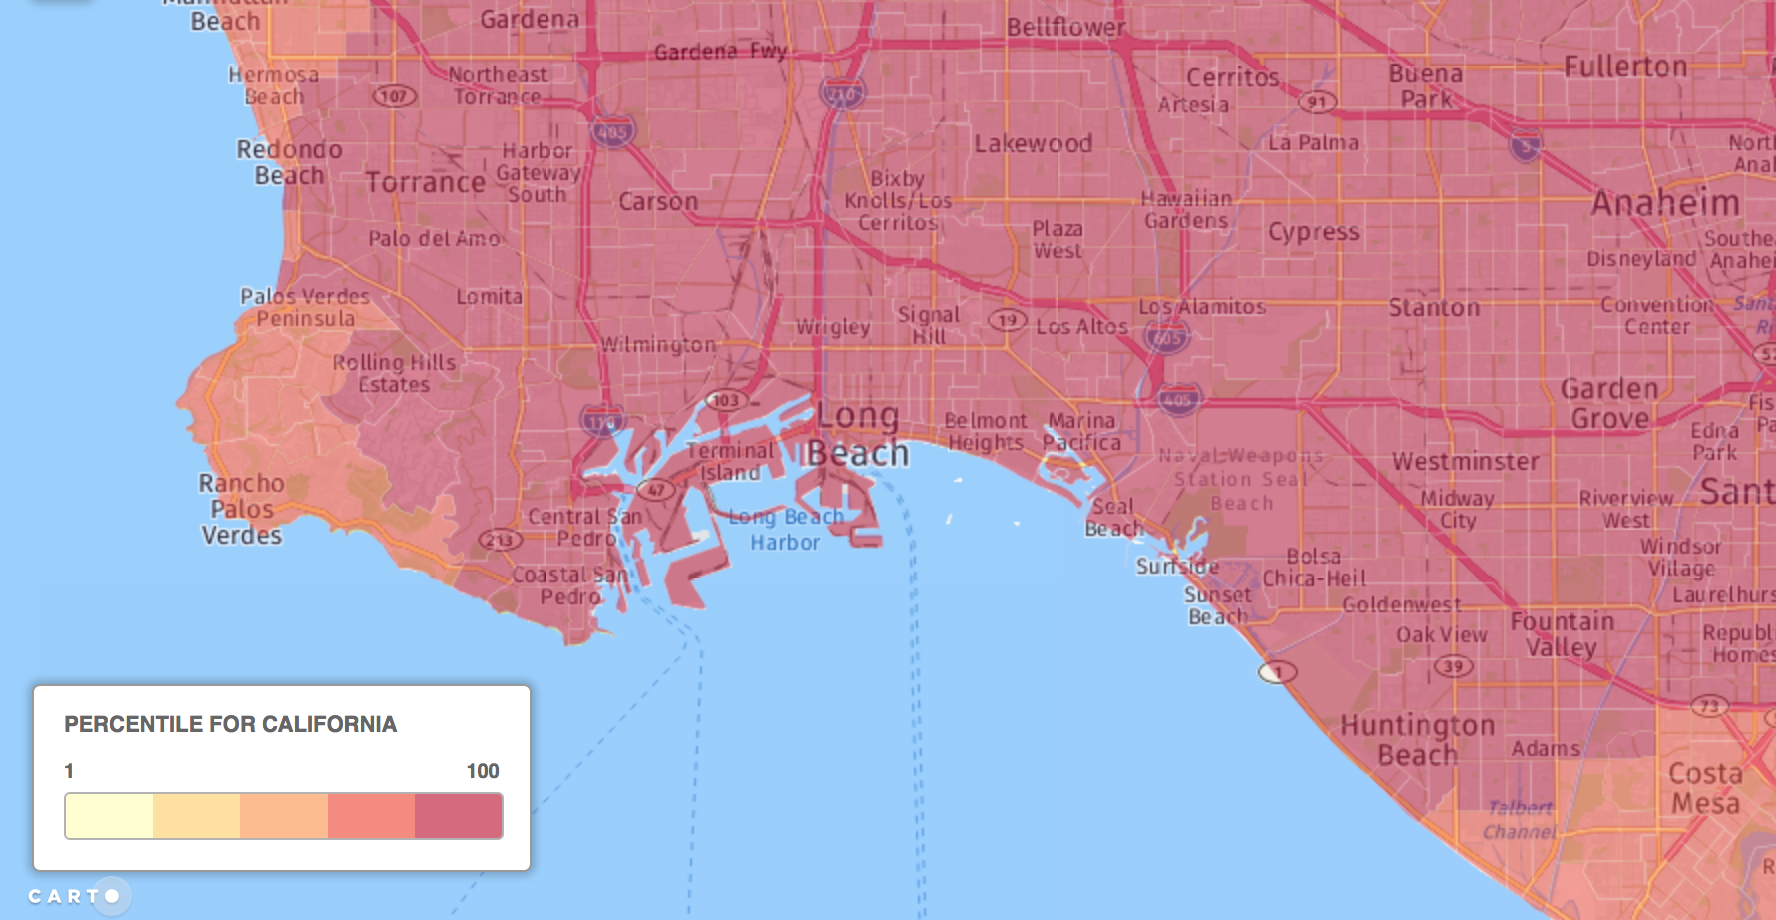
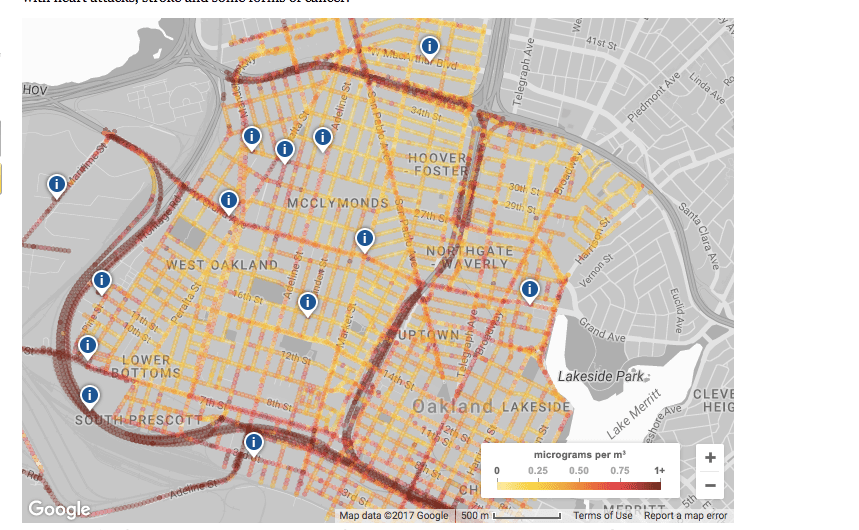
Toxic Releases into Air Near Long Beach/2014 (CARTInstead of constituting a record of anthropogenic change, the map focuses on a snapshot of the imprint of buildings on the soil, more than the impact of humans in or on nature, or of any sense of flux in the continued effects of emissions, release of contaminants, and their possible pollution of ocean waters, or combination with water vapors to create acid rain. The intuitive sense of reassuring tangibility in the comprehensive record of every building in the United States reassuringly mimics the material world, and reifies it as a given structure, standing apart from its environment, or a lived world. While I lived in Oakland, the image of the East Bay was sharply unlike the registration of breathable particulate matter, generated and released by diesel exhaust courisng across the industrial area from the automative arteries of the 580 and 880, created by Google with the Environmental Defense Fund(EDF) and Aclima, a sensor technology provider, to map airborne pollution in West Oakland across highly trafficked corridors and West Oakland’s streets, mapping the density of the diffusion of particulate matter: rather than using only one sensor to monitor air quality–how did the idea of a fixed air monitoring station that was located at West Grand and Poplar emerge?–cars equipped with sensors drove four hundred miles to unpack what West Oakland Enviornmental Project’s Brian Beveridge says needs to be expanded beyond “a tale of two freeways,” and the diesel trucks who use them to arrive and leave Oakland’s port.
The logic of building patterns are of an aesthetic interest for viewers and create a startling map of unprecedented detail that foregrounds machine-learning skills to forge a new relation between cartography and art: the survey of local neighborhoods and structures, even in 2D form, suggest constellations of architectural sedimentation of different times that pop out to the viewer, conveying a material presence–one can see one’s own house!–patterns of habitation seems to stand at a skew with our systems of political representation.
At a time when we increasingly consult maps that lie on backlit screens to trace disembodied routes in virtual worlds, and rely on map servers for itineraries of green arrows toward buildings on screens, in ways that might atrophy senses of way-finding, rendering footprints in a manner that we can navigate invite us to gauge spatial logics of place. The fish-eye maps of satellite data, set atop a Mapbox scaffold, helps defamiliarize ourselves with place and position ourselves in relation to its configuration and partially representational terms: the politics of reifying the built environment as neutral is highly questionable, especially at a time of climate change, but offers a sheer pleasure of navigation through an encomia to the scope of built structures across the land. Rather than finding one building, we are invited to scan them all, jump into the midst of space as into the midst of logic of a website, to follow what commands interest, and find our ways through the virtual mosaic.
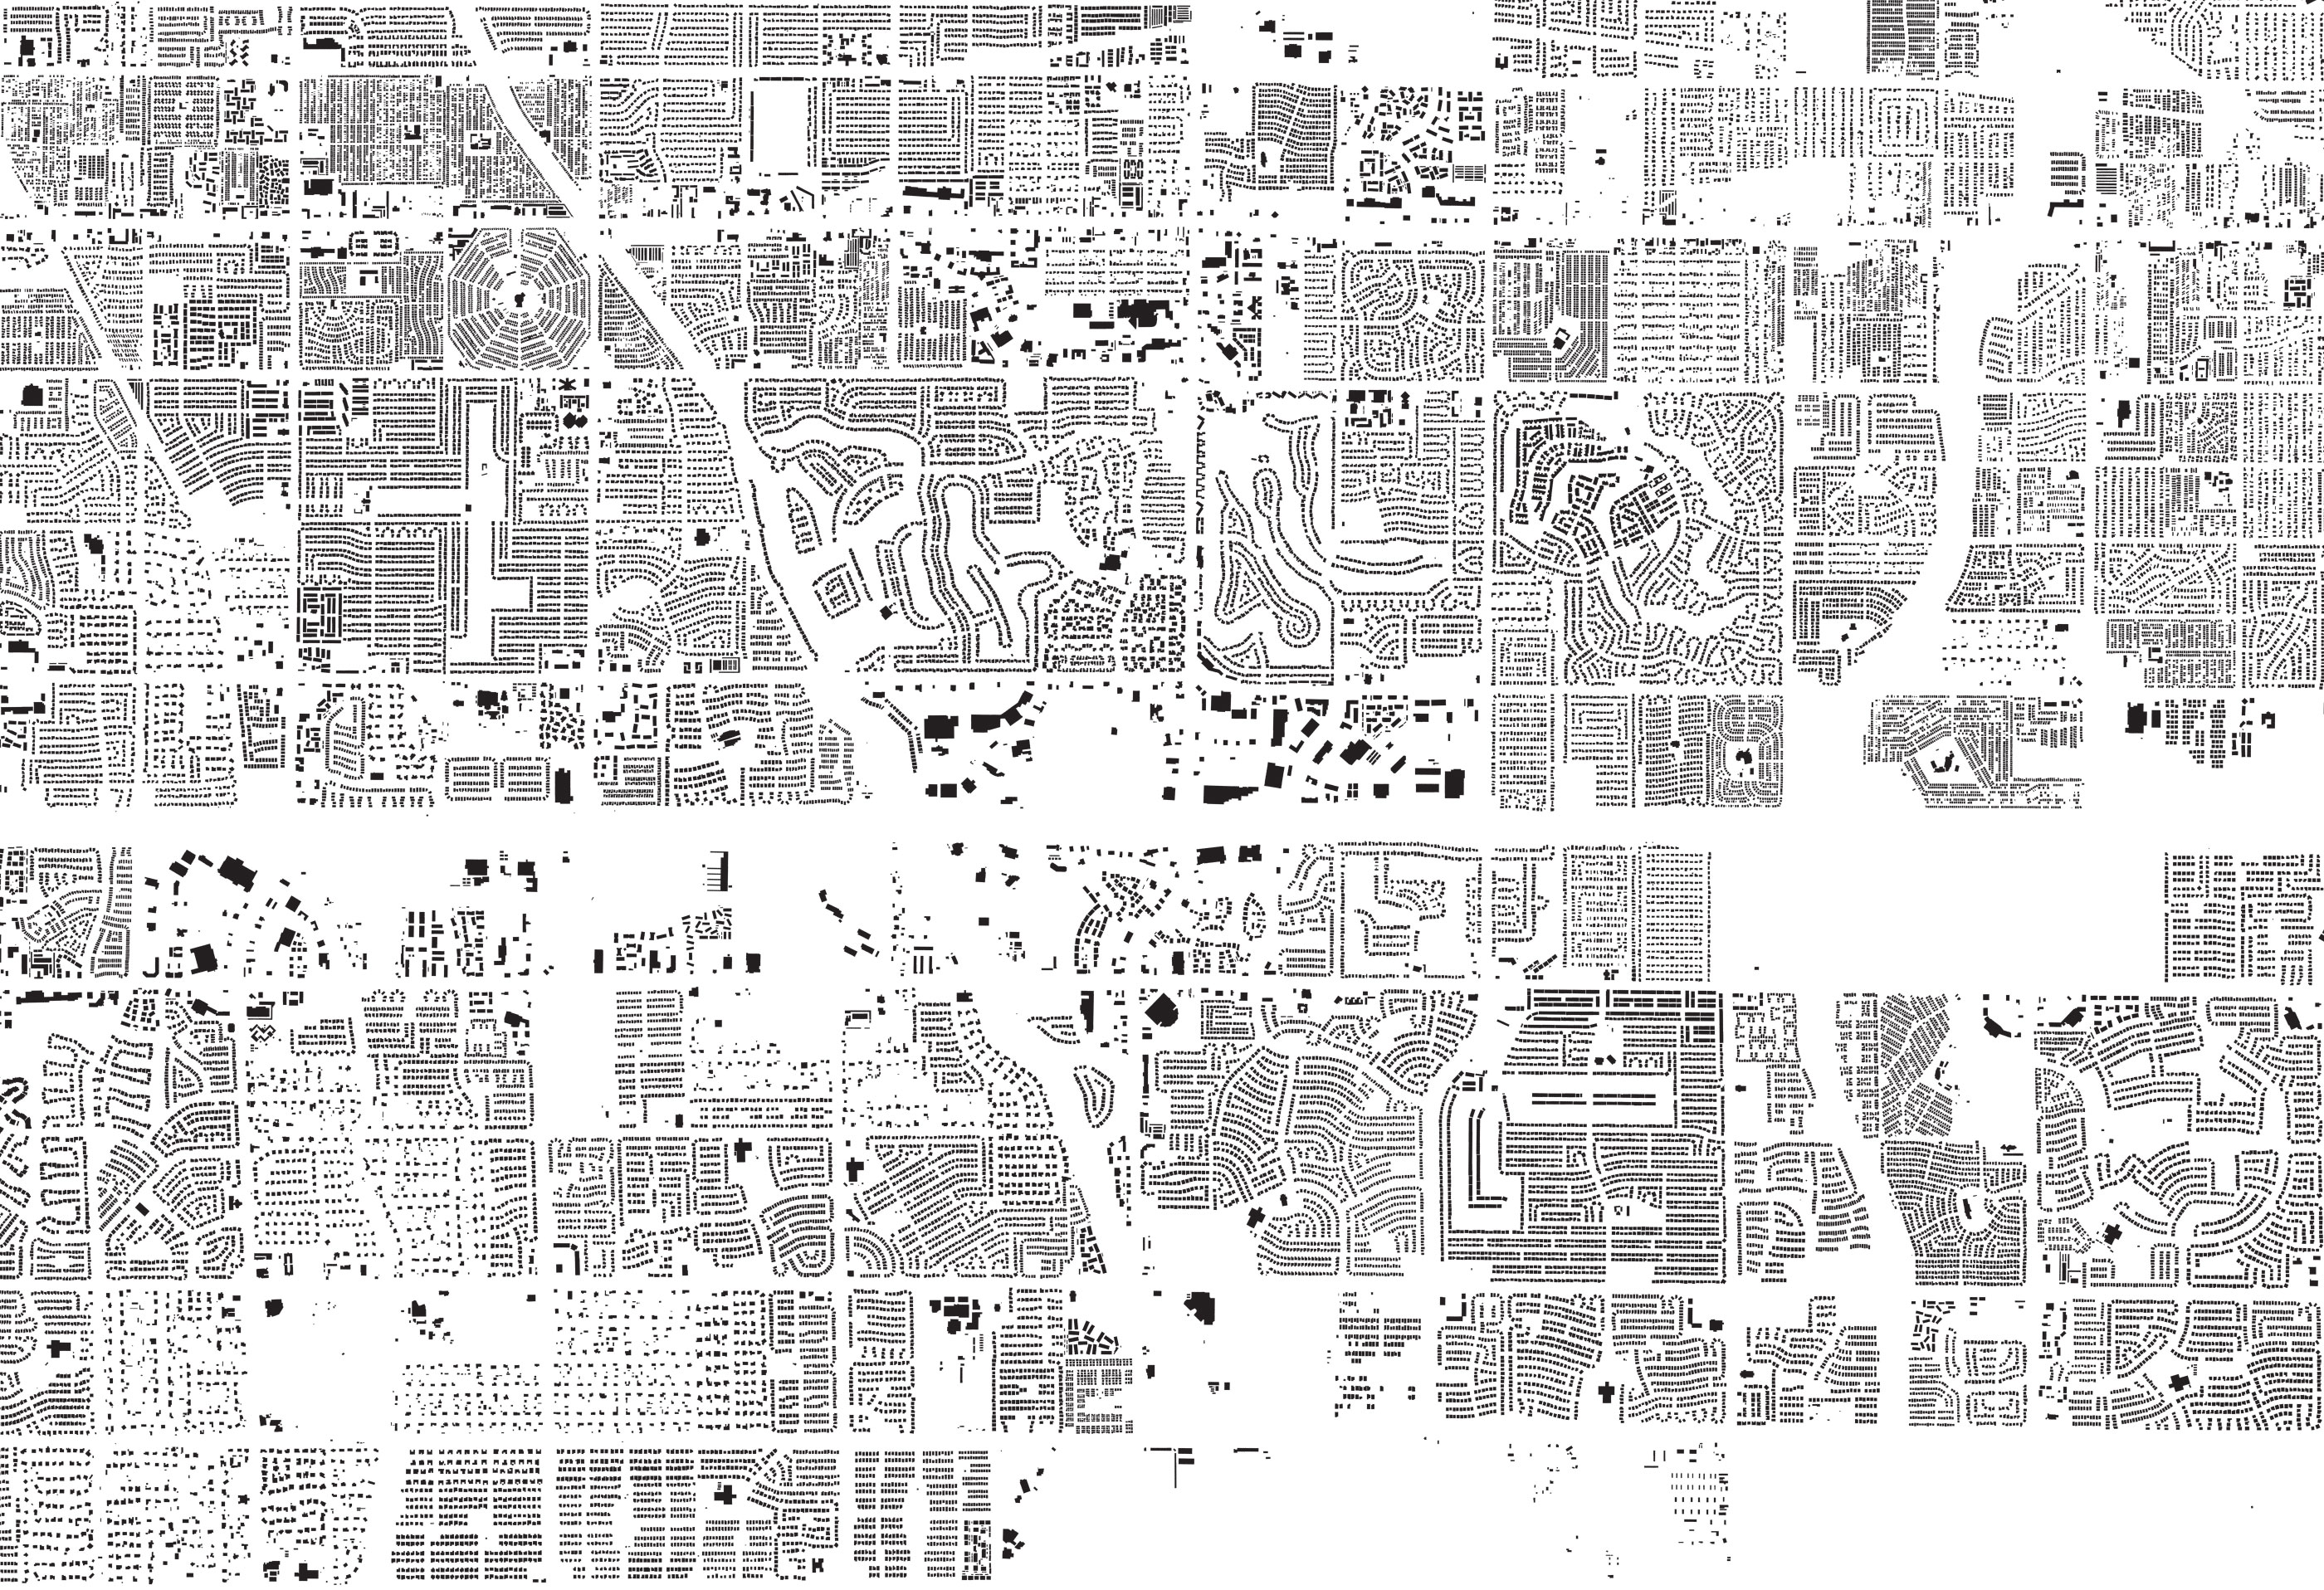
The constellation of houses reveals what Andy Woodruff calls “the sometimes aesthetically pleasing patterns of the built environment” more than revealing devastating effects of overbuilding in any place, removed from all threats to their permanence. While suggesting the fragility of the lattice-like structure of built space, the definitive black boxes, rectangles, and forms suggest a lived mosaic where humans are oddly absent. The patterns in the built buildings are not primarily utilitarian, or dynamic, but seem an odd proxy for the imprint of humanity. They suggest more than they reveal an actual pattern language, in the sense of good design practices, so much as a snapshot-like record of what is at hand. There is less of a coherent pattern language in the forms of the machine-read images than one might imagine. When Christopher Alexander coined the term “pattern language” to distinguish good practices of architecture as a way to solve large, interconnected questions of design, in intentional ways, serving the users of space–and indeed creating common spaces within houses and cities that make life bearable, he saw it as a place-holder for a range of results of problem-solving of needs for privacy, intimacy, and contact, as if modular components might have a grammar or syntax that meet local and quite personal needs, which designers could work in iterative processes to meet, arriving at solutions able to balance competing forces. The absence of any syntax or structure in the web map is more often apparent in the stripping houses from context, given the absence of streets, highways, or forest in the building patterns that result, which appear stripped of local logic as abstracted footprints in patterns that recall property developments, with minor variations, but minimal evident intent–without clearly revealing how they meet needs, but suggesting the formulaic patterns of housing, rather than privileging what Alexander called and treasured as the logic of common space.

Mesa, AZ
There are few inheritances evident in the map, despite clear patterns of building from the Mississippi river, south of New Orleans, where the intent of builders is apparent, but seems removed from users needs or competing interests, and not addressed toward their fundamental needs of contact and civic squares, the sorts of public spaces for wandering or collecting with neighbors, but space follows property lines that stretch from the river, in an odd echo of earlier plantations.
South of New Orleans, on Mississsipi River
The building appear in each case oddly stripped of a larger, comprehensive sense of design or intentionality, or of a design process that empowers the builders, but exists, almost inertly, on the screen, if they may seem to indicate their own rationale, but only use it as a start to question or understand how it benefits those who live there or of a place that works for its residents, in Alexander’s terms, so much as an integrated circuit or maze, far less directed toward the needs of inhabitants than Alexander would like, and which made urban planing seem a set of predetermined frameworks with little bearing on local needs.
2. What to make of the map, which offers a sense of weight, but oddly reifies structures at a remove from a human hand, or from the human activity that built them? If this is a record of humanity, it is an odd record, to be sure, removed from evidence of agency, but the ghost-like outlines of the traces of buildings measured by a footprint alone. Despite being confined to only two dimensions, the interactive map invites users to alternate between multiple scales, traveling at a commanding if terrifying pace from a nation-wide view, or zooming down to regional panels, or even hovering over large-scale images streets and neighborhoods, in a flat surface abstracted from the environment, illustrating the configuration of real estate across the nation. While one can expand to a city’s urban plan, in ways that challenge attention, panning out to the broader patterns of the inhabited land, the absence of any imprint beyond the individual building seems to deny ostrich-style the presence of increased risk of extreme weather events, or to adjust our habits of building to that risk–although they come immediately to mind when one sees how many built structures crowd our shores.
Borders, jurisdictional lines, and counties are absent, as are electoral districts, in a map of habitation that lacks any reference to topography or the footprint of humans on the environment, save the footprints of the buildings that they built and the human curiosity or compulsion to design and refine maps, in ways that seem to seek to transcend the perceptual limits of one visual position. The dispensing of most human artifacts of measurement are striking, as there aren’t even scale-bars, and, in an ompholocentric illusion, the nation is the universe. Many things don’t appear on its surface, in ways that make the view liberating and somewhat exultant, although it is quite removed from a celebratory tradition of national mapping of sovereign territory. It’s even pretty striking that the US-Mexico border-line that has haunted our national political discussion is among the most uninhabited regions, the density of our coastal constructions–from California to the Gulf of Mexico to the East Coast to the somewhat neglected if highlighted populated coast of the Great Lakes–the real “border zones” where two-thirds of the nation in fact dwell–
“Every Building in the United States”/New York Times/Mapbox
–is represented in crisp clarity by machine read detail to prompt glosses by its illustion of complete and comprehensive knowledge. If the “map is the territory,” the territory seems oddly shrunken, if it exists where houses exist.
There’s considerable pleasure that exists in the sense of material embodiment and spatial recognition in the crisp greys and half-tones render a collective mosaic of human habitation, mapping every building in the United States from an astoundingly comprehensive database. The result dynamically mimics an ability to move through a known space–entirely removed from navigational ends, in the manner of Google Maps or other mapping platforms, but as a way to mimic the ability to observe every house, in a vritual flyover map, to gauge the footprint of mankind as it is frozen at a single given moment, but in ways that may give a portrait of where money is converted and ploughed into real estate as much as of population density, or the uneven terrain of the United States, in ways that cannot be read without some bearing on the current electoral map, and the deep tensions between our conception of our nation.
While the map is somewhat pleasantly removed from the haunting divides of red and blue that dominated interpretation of national politics from the autopsy of the body politic in the 2016 Presidential “election” or midterm elections, cleansed as it is of electoral districts, county lines, or states–

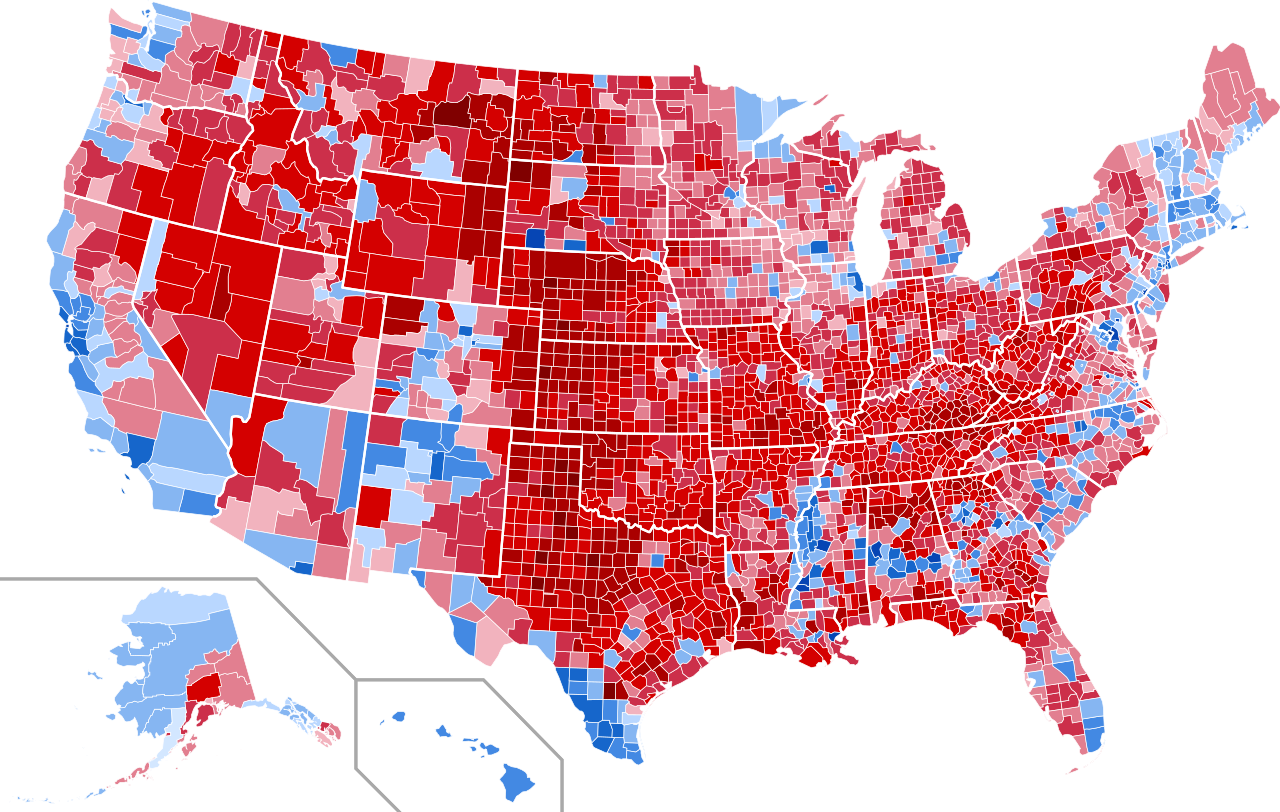
2016 Presidential Race
–its removal from a range of expertise in reading maps also seems set to unleash a broad free-for-all of cartographic analysis, and DIY interpretations, amplifying the validity of the cartographic record as a source for exploration, of almost scriptural nature, to unlock the secrets, impact, distortions, and divisions of our settlement of the nation, and even in black and white mosaics the are man-made preserving a disembodied reading of the nation, with limited text or apparatus, reminding us of the bizarre consequences of settling a drastically uneven relation to the land.

3. The resulting interactive virtual map exults in possibilities of examining built space at multiple scales, without guidelines to read, by inscribing the viewer in a perpetual bird’s-eye view that is the longstanding dream of a cartographic imaginary, but which machines have now provided, in what seems a Cyborg manifesto of its own, created by engineers who trained computers to read satellite imagery, and whose programming–with Mapbox engines–serves as a visual prosthetic. The interactive nature of the map allows one to swoop to any city, zip, or site at intriguingly and quite astoundingly large-scale, moving among ridiculously tremendous variations in scale with the power of a DIY version of Charles and Ray Eames’ “Powers of Ten” (1977) on your own personal computer screen,–expanding the field of vision by powers of tens, and reducing it by tens to the level of angstroms, and back again, unsettling the position of the viewer by its purified mathematical tools even without its didactic awe-filled voiceover that seems to replace the divine.
The expansive panning over the United States’ lower forty-eight starts as a collection of micro graphical specks, unable for anyone to draw or transcribe, not corresponding to population density, building heights, or in which one is invited to magnify scale to arrive at the neighborhoods and places that one might recognize, as if to measure its accuracy against one’s own spatial awareness, and to be astounded by the accurate abilities of transcription of the scope of mechanical recognition of building forms from satellite surveillance.


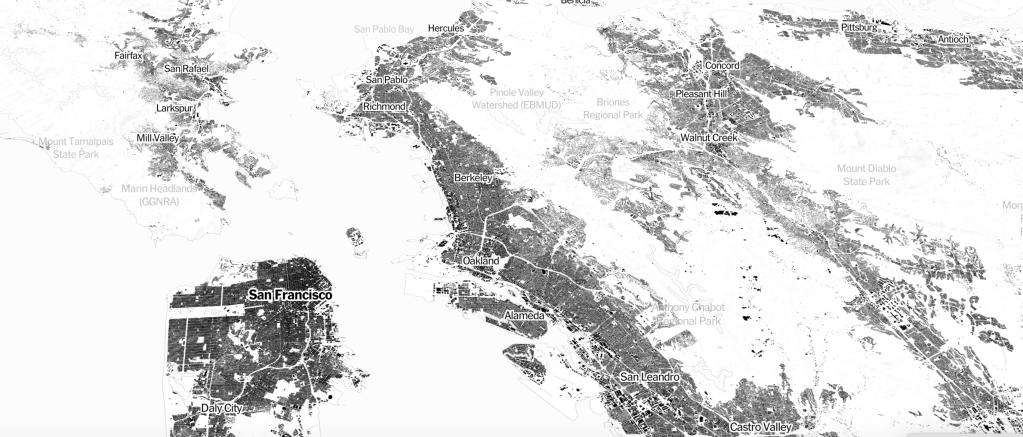
Berkeley CA/North Oakland CA
The rich detail of the map has a counterpart in the thin scratchings of the mosaic of large scale views, however, as the delicate traceries of the small-scale image gain a mute stolidity in the black blocks of individual buildings. The sense of emptiness that the map viewer or reader gains increasingly comes to accompany the sense of vertiginousness, however, in ways much akin to the viewing of Eames’ video of scalar multiplications and diminutions,–even though they seek to provoke a sense of the expansiveness and fluidity of our constructions of space. The elegant becomes an eery denaturing of space, even more than a reduction to two dimensions.
The interactive map is not to space, or really even to a political territory, but to the literal footprint of all structures in the nation–a literal symbolization of settlement patterns on a virtual result. The result is a teaser of the possibilities for re-rendering satellite views, that so powerfully mimics cognitive perceptions we can match our own memories with its virtual surface. By embodying a high-resolution outlines of human habitation, we can drop in at any zip code or place-name into the crowded record of every house in the lower forty-eight to investigate patterns of housing, abstracted from any setting, in eye-opening ways. It is able to capture interest in the macro-level patterns of settlement and built structures in an absolutely flattened space registering the density of all built structures in the lower forty-eight–
“Every Building in the United States”/New York Times/Mapbox
–to individual regions, s we interactively pan, scan, and move around rendering of buildings computers were trained to detect from satellite imagery, examining the crowding of habitation and alarming density of how we cluster in space, in strikingly uneven national markets of housing or real estate, in ways that force us to reflect on how we inhabit space, more than navigate it, rendered in ways that accenturate the earth’s curvature to heighten the sense of spatial perception with a crispness of detail one could never process save from machine-read satellite imagery.

San Francisco and the Bay Area/New York Times/Mapbox
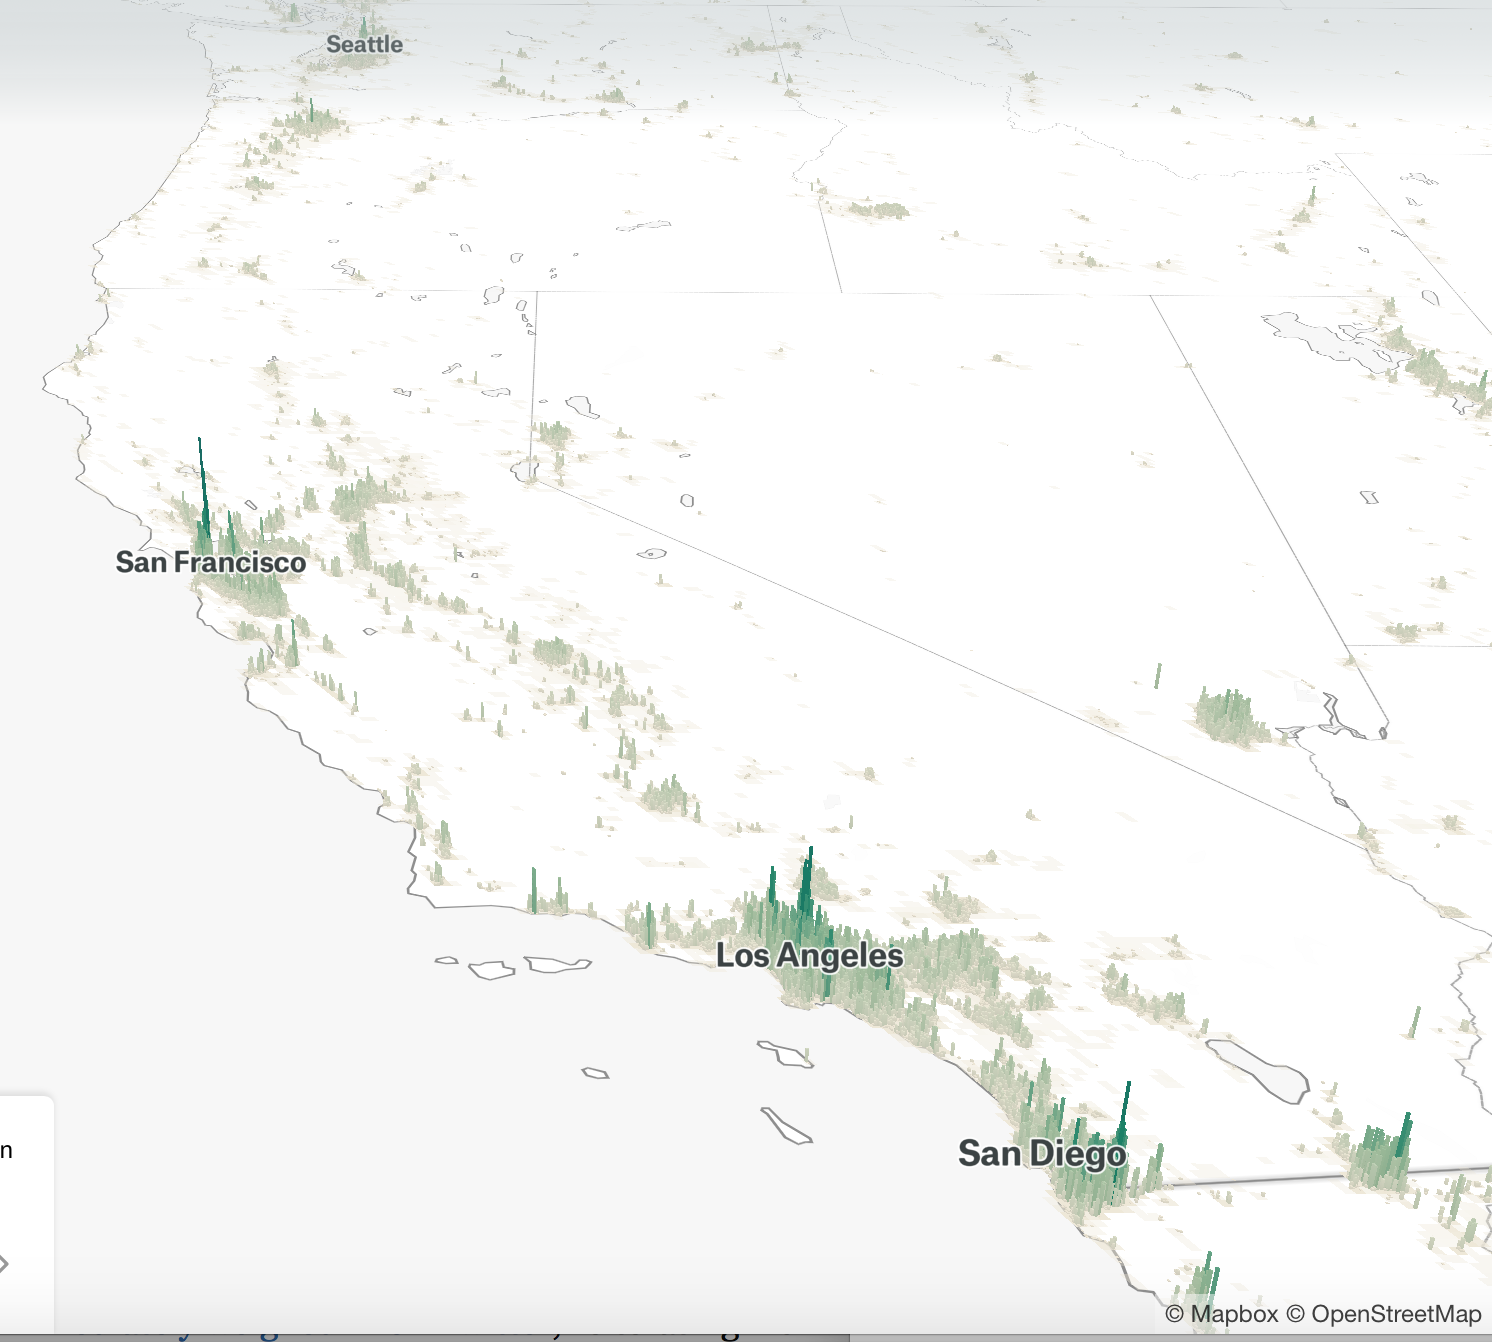
Of course, this looks a bit different when one is mapping population, but the advances in machine learning of recognizing built structures provides a new form of mapping–sort of at the start of a new technology of mapping–that goes beyond the limits of current data visualization, to parse out a popped out vision of the built environment from the landscape, and gain a sense of the human built footprint rendered alone, if one tilts the Bay Area a bit,.

or tries to place it in a broader nationwide context of population peaks.
4. The powerful recognition of inhabiting space offered both in the printed version or the interactive maps was so compelling that the Times included local print versions in its national edition, suggesting a cool bridge between interactive and print graphics in the dynamic uses of D3 mapping tools Mike Bostock had first pioneered at the newspaper. For the interactive abilities translated into print in a local way, as if to encourage readers to pore over the interactive version with the attention demanded by the detail of paper maps , in ways that recuperated the excitement of examining a static map’s local detail, and recuperating with new intensity the discovery of navigating through a powerful striped-down symbolization of inhabited space and housing density.
Darkness is an odd proxy for habitation, but concretizes a huge database, sifted through from satellites and amplified by local and federal maps, in a scary reminder of the major sites of investment in real estate–and the uneven valuation of the land–and of the fine grain of our powers of remote surveillance. The result is both truly awe-inspiring as well as deeply mournful–omitting the places and focussing on real estate–by tracing footprints of houses, without signs of life. The result is a sort of encomiastic image to the skills of transcription from satellite imagery, the landscape, as an abandoned one, without frame of reference, as it were, filled with traces of buildings, but without other signs of habitation by the human and limited register of a natural world.
While one usually thinks of the arrival of web-mapping as displacing print, “Every Building in the United States“ invites you to use your cursor to navigate through its surface, like the virtual space of a video game, zooming into details, to bring one’s best abilities to grasp the current total literal footprint of all built space. In what presents itself as a melding of machine reading with a mind’s eye, a hybrid form of mapping and cognition that combines the mechanical detection of buildings with an invitation to expanded perception. Offering a sort of prosthetic extension of vision, emphasizing the virtual extension of the United States, the map abandons any imposition of indices of legibility, replacing them with an invitation and injunction to look. The “map” that was assembled with Mapbox software is an ecstasy of the visual, although the places are so oddly hollowed out, not only reduced to monochrome shadows, but oddly and eerily removed from the human hand, or textual legends and critical approaches to guide the reader; the analogy to a video game’s virtual space seems apt because the map invites viewers to project meaning onto their formal shapes, in a sort of urban planning and environmental studies done on the fly, and without much expertise or specific skill set, its abundance of information allowing one to make bold generalizations from what seems intentionally limited data.
If “Every Building“ presents itself as rather seamlessly melding trained detection of satellite records with human cognition and visual perception, melding mind and machine in a hybrid form of inscription and cognition that extends visual perception, it makes sense to ask interrogate how the interactive and print modes articulate a new visual relation to space, or rehabilitate and perpetuate some rather old fantasies of a disembodied relation to space. The “view from nowhere” echoes a helicopter or aeronautic path, to be sure, relative to the selected degree of scale, but echoes the transcendent view of space that ancients and early moderns long imagined when considering Ptolemaic maps. The dizzying counterpoint readers encounter between the spanning the continent as a unit and the buildings of any local site suggest less a synthesis, than the creation of an imagined perspective from which readers can zoom across a virtual surface, disembodied from terrain or topography or “nature,” through what is an anthropogenic record of the buildings that constitute our national version of the ecumene. The result seems to present an image of our increasingly atomized national space, in place of an interconnected network, fit for our times. It raises questions about the coherence resulting from a machine-read image as a map, and the place of machine-readable satellite imagery in what seems a scary prototype of the future of maps.
For despite the interest and levels of spatial recognition that readers are provoked to explore in the interactive map and its more local, but more legible print counterparts, which expand the detail of the national map, the lack of any points of orientation are oddly devoid of tips or clues for reading space, or the arrangement of a built space, or of how one navigates within it. If the engineers who trained computers to read satellite imagery for evidence of individual houses invites viewers to examine the patterns of housing at multiple levels–a site to look at the architectural ordering of space machine-read from satellite observations, rather than mimicking travel through space, the patterns offer an eery recognition of place and space, unlike we’ve ever seen it before in a map, stripped of natural markers or much textual apparatus, strangely static in its rendering of built space, oddly ethereal in its absence of color or natural forms, or even what we might call experiential grounding over this flattened footprint of every building, disorientingly stripped of their actual height.
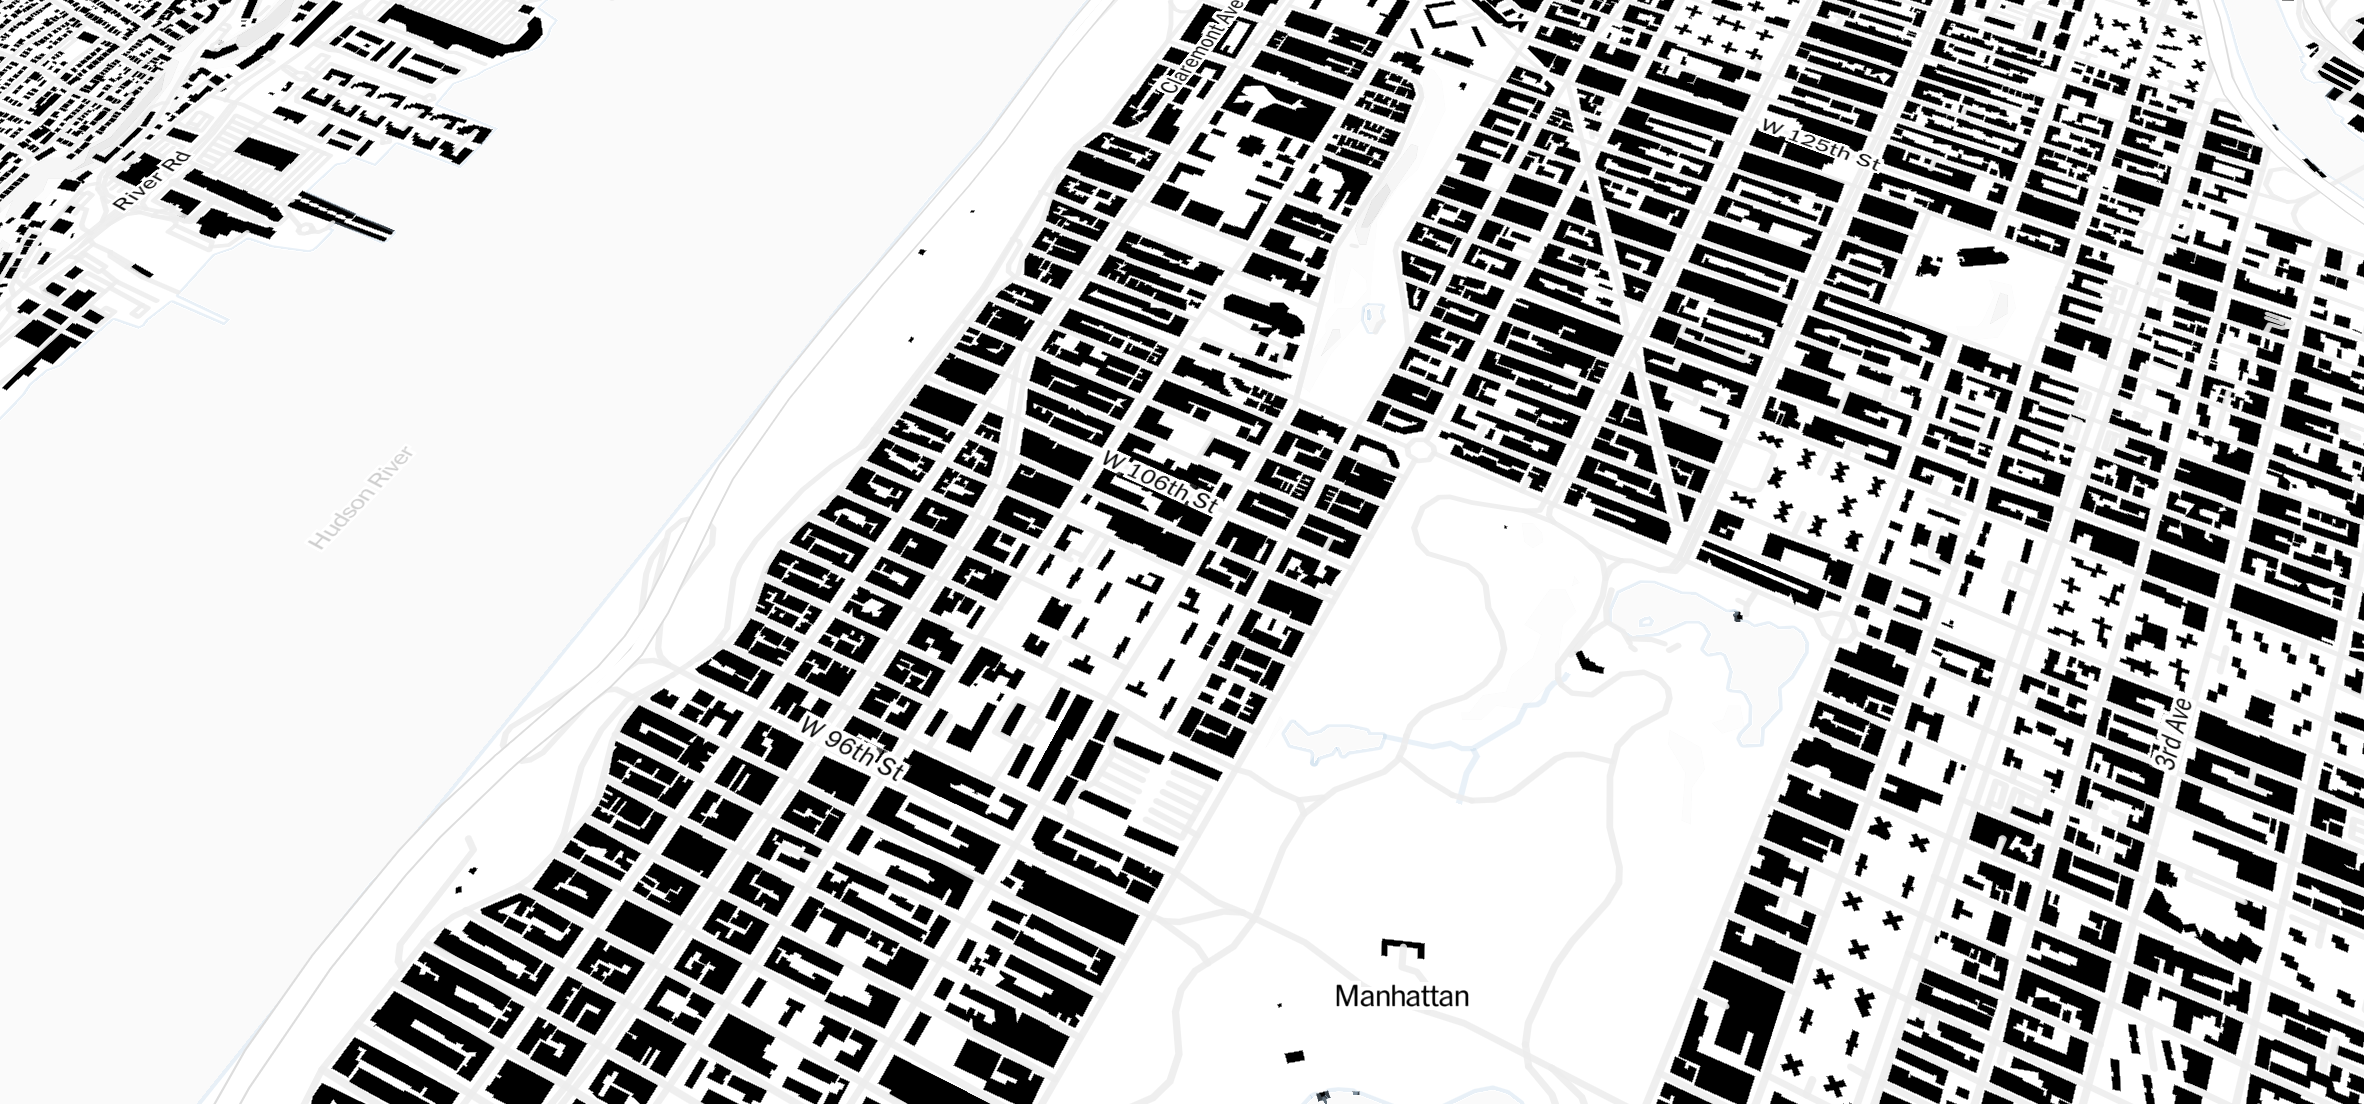
Upper Manhattan
–where blocks of black space trace the ground print of buildings, independent from building-heights, as if they prepare the basis for a more complete mapping of urban space, or are only concerned to measure.

One balances orientation and disorientation, in fact, in a way that provides an uncanny model for reading space: the space that one knows is abstracted, and one is challenged to match lived space to the screen space, and read the flattened forms that were detected by aerial surveillance of satellites. In ways that challenge any viewer to try to orient themselves to its level of local detail, the exclusive focus on built anthropogenic space invites a curiously tactile mode of interacting with zoomable of increasing scale maps at once embodied and abstracted from a spatial setting. But the local maps were particularly reassuring, notwithstanding their pared down, radically abstracted quality. Interactive and print versions alike invite, in their full display of trimmed-down detail, which invite renewed ability to pore over the infinite richness their content, and an ability to recognize the spatial disposition and distribution of houses even if they have been suddenly removed from their surroundings and topography: serving as a way to define and discover one’s own relation to place with an apparent materiality, the interactive map made of machine-read detail provide an uncanny tool to navigate through space, and uncanny relation to place.
For the map of the tracings of each building, whose machine read linear crispness seems to recuperate the drawn basis of a local map, seems to recuperate the hand-drawn map, but over an expanse no human could ever render by hand, or that could ever be read in its totality. As if an inverted Google Maps, rather than foregrounding way-finding tools or individual roads, each section of the map is less dedicated to routes of travel or sites of arrival. Instead, the maps invites interactively reading its contents of a map, by zooming to local details across the United States at scales so large a scale they range from continent to local neighborhoods. The comprehensive coverage of the continuous forty-eight might recall the one-to-one scale of the classic tale of the fanfare and fate of a one-to-one map made by imperial cartographers in “On Rigor in Science,” often translated as “On Exactitude in Science,” written in the start of the Cold War in 1946 by Jorge Luis Borges.
At about the same time as demand grew for an abstractly gridded space in global theaters of combat that would become the Universal Traverse Mercator global grid, Borges asked about the fictional nature of the relation of any map to a territory. Borges imagines the demand for unprecedented rigor in the push toward greater and greater exactitude, when “the Art of Cartography had attained such Perfection that the map of a single Province occupied the entire City,” and invited viewers to process far more local detail than any would ever be able to read. The map “Every Building holds back on much more information than a monochrome mosaic of quite stripped-down form, approaching a similar level of detail, impossible to assemble . Whereas “the following Generations not so fond of the Study of Cartography as their Forebears saw that that vast Map was Useless,” in Borges’ fable, inviting its material decay to tatters, once “. . . delivered it up to the Inclemencies of Sun and Winters,” allowing it to become reduced to tatters of its original celebrated form, the infinite contents of the interactive map creates a haunting permanence, which its interactive form allows one to navigate selectively, awed by the comprehensive large scale map that the huge dataset contains.
As greater scale approaches an increasingly disjoined view, the mosaic of buildings, some recognizable, all lacking identification, seems to capture an atomized view of society, in its rendering of individual buildings without a formal frame, coherence, or unity, as if affording an atomized view of space fit for our time.
5. The interactive vertigo seems destined to stand, in virtual form, as a melancholy snapshot preserving a moment of a built environment. It may be an unprecedented alienation from the natural world. Unlike the image of time-tagged buildings in the Netherlands, color-coded by century through a rich archival database by Dutch cartographer Bert Spaan, which allows ways to view how cities built outlying areas, the static database of drawn buildings is frozen in time. But its comprhensive nature, and far larger scale, provides a rich set to parse, filter, and cross-reference for endless fun, creating ways to query, clip, and sift buildings across an extensive space, or to zoom into cities from Washington, DC to New Orleans, whose flattened surfaces all but erases their distinct architectural styles, as has been noted, suggesting the database’s limitations as a guide, rather than a heruistic illustration of machine-reading, existing in glorious and definitive black-and-white that seem to distance its formalism from the fact that all these buildings were man-made, by all but eliminating the trace of the human hand from its form.
But one can pan, with a striking detail, over the coastal structures in California’s Long Beach, and sail across the counterpoint built-up nature of its shoreline’s empty spaces, shore-line plants and facilities, and low-density housing.


LA Times’ Pollution Map–Toxic Releases/CARTO
Unlike the data sold to Google Maps, Bing, Apple or other mobile mapping services, the sharpness with which the data is read by machines offer viewers an almost tangible sense of place. The machine-read tracings of each building’s footprint in the nation is highly mediated, and disembodied and abstract, as well as augmented by local maps from states and cities. But the eerily familiar sense of panning over inhabited space that results offers viewers an eloquent form of orientation able to restore now-lost materiality to a map, orienting us in ways that embodies space in ways that are uncanny if almost eerily welcome in the level of familiarity gained as one zooms to known spaces, greeted by layouts abstracted from any spatial particularity. And in California, or the Bay Area, where I live, I can’t help wonder if its pronounced alienation from any sense of climate risk, or the increasing sense of the contingency in the far of climate change, is oddly absent from the map, and disconcertingly disorienting in the false sense of comfort in permanence that it brings.
Constituting a negative Google Maps or Street View, satellite imagery the nation offer improbably crisp coverage into whose totalistic coverage of the lower forty eight we can scan or zoom without atmospheric obstruction to explore traces of human habitation; if streets, lakes, parks, rivers, and what might be called public or civic space are absent from the map, the collation of tracings of each buildings render a god-like view of building density in detail, that pops up as a national network and switch to an almost fish-eye view of zip-codes, materializing a massive database in copious detail within a national backdrop that seems a negative image of geographic terrain. Houses string along major roadways, reminding us of the sharp discontinuities in the spread of inhabitants in disquieting ways, and the imbalances in our investment in real estate.
Housing seems to mirror the folds of the topography, lying along rallies and in dense clots by the oceans or waterways, revealing the intensive crowding we all experience of the shorelines, and reminding us of the increase of manmade ground cover and the anthropogenic impermeability of much of our coasts.
If some inland areas of the nation are stretched thin along roads, that, as in Lancaster, PA, stretch in lines of housing from city buildings into far more open spottily settled lands retain a more “organic” sense of their historical settlement–
Lancaster, PA
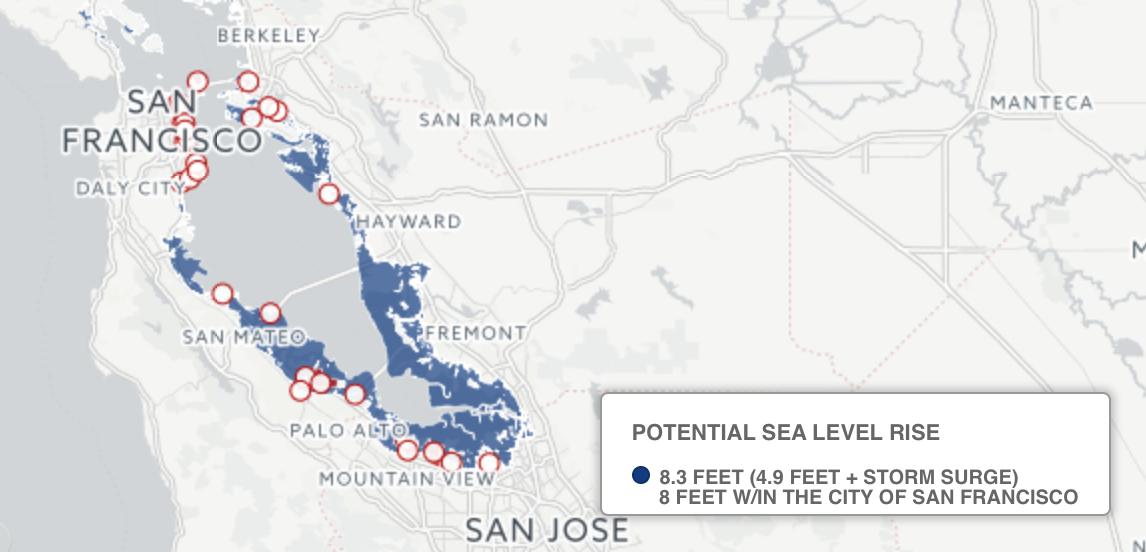
–the ring of cities that hem in the Bay Area where I live, far more “challenged for space,” immediately suggests the scarcity of land and small supply of housing in the fold-out paper newsprint insert, both by the density with which urban over-building rings the Bay Area, and the low South Bay shoreline where coastal housing stands to be threatened by sea-level rise.

The special pull-out section of my local Times offered the print counterpart tot the national map. It oriented readers to their locations, in the manner that the larger interactive web-map promised, but invited even more detailed reading under the viewer’s eyes, at a far greater surface, when fully unfolded, than the print newspapers have had for years.
The dual-publication evokes clear comparisons between map and text, and the readability of the map, often argued point-based cartography has eclipsed or disrupted, though the new senses of territoriality they create: but if the grid may challenge the analogy between the reading of maps and reading of a text: the printed version of the map indeed forced the question of reading place and reading patterns of settlement in locations that communities of readers knew all too well to invite them to re-examine their sense of space, and relation to it, in invitingly provocative ways, asking readers to re-read their relation to place free from devices, and merging the legibility of the canvas of the single sheet of newsprint with the degree of detail we are habituated to find on the computer screen, or handheld device, that occupy so much of our visual attention and interpretive skills. The effect of being able to navigate the print version is jarring, but refreshing.
6. In the Bay Area, the image however cut oddly against the increased sense of vulnerability to climate change, from sea-level rise to swings between drought and flood that the permanence of the machine-read tracings of each building–from the disk of the Apple Headquarters to the Great Mall in San Jose to the buildings of the Tesla factory–as if the reading of the detail of the map presented a reconstruction of the ruins of Silicon Valley for future generations to pore over and study, as if to find the extent of the economic explosion of the region in a removed past, whose footprint has been reconstructed over time, and can speak across an otherwise unbridgeable temporal gap with the crispness of summarizing the results of an archeological excavation of antiquity.
The insert and interactive map alike illuminate the insights of reading maps has to offer, and the concision of the arguments and insights that they are able to offer readers who often struggle to make sense of their own environments. Offering a negative image of the network of roadways in Open Street Map derive from satellite imagery, ready by computers trained to read large-scale data in microscopic detail, the rendering suggests a nation of suburbs, and offers much less legibility for urbanized areas or density, which it renders in ways that resembles something more analogous to a computer chip, at times, than a human space, or at least not one of civic participation. It is almost a map for our times, a data overload presented in locally legible terms, where our data has been “read” and rendered legible, abstracted from any civic or social sphere in what appear intentionally disturbing ways.
The oddness of decoupling spatial data from any other expertise in a stripped down data flow makes one wish for further levels of information to be added to the map despite the attraction of its crisp level of highly specific details. The map is disembodied, offering far more than any on the ground observer could navigate. As much as heralding the acceptance of a new Age of Cartography, it realizes the historical claims of cartography as a God’s-eye view, afforded by satellite may reflect a quite atomized nation-state, defined by contrasting communities that reflect defined partisan lines as much as by its coherence or unity, removed from questions of coherence–or from reflecting an image of geographic mobility, compromised continuity of acknowledgement of civil rights and citizenship, and even even of crisp borders, even lines, and an inherent uniformity in a logic of the distribution of geographic residence.

The emptiness of spaces in these sub-urban spaces suggest a sense of emptiness of communities in areas stretching across a grid of roads. If Thomas Jefferson, who helped design the grid, mapped rural regions out of the firm belief that “Cultivators of the earth are the most valuable citizens,” as constituting “the most vigorous, the most independent, the most virtuous, . . . tied to their country and wedded to its liberty and interests by the most lasting bands,” the space of citizenship in the dot-based map of buildings removes their residents from any context–or interests–the footprints are removed from and space of civic activity or virtue.
The density of information that derives from a proximity of high-resolution surveillance satellites of heighented black and white resolution is even greater than the satellite views that “map” crop circles in chromatic detail. Its even greater detail in local coverage, at a scale able to process local buildings as proxies of settlement and habitation and density–rather than crop health and irrigation that served as proxies of agricultural productivity and crop vitality.
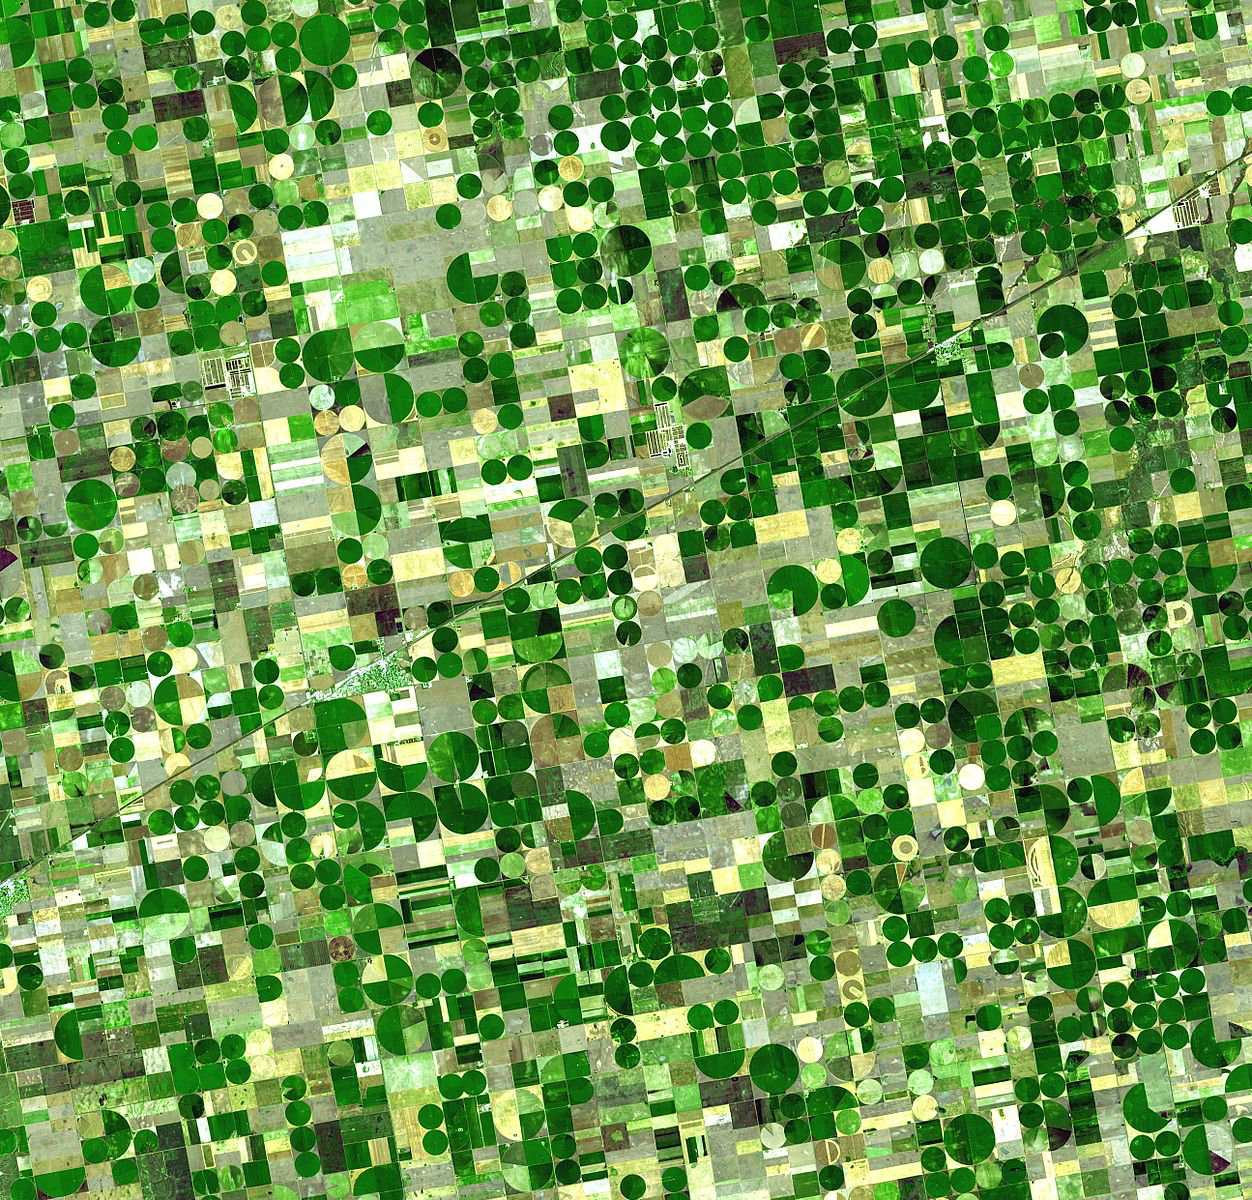
NASA, Earth Observatory/Satellite imagery of corn, sorghum, and wheat in Kansas, United States of America in circular fields fed by pivot irrigation (2006)
There is, perhaps, an exultant sense of dislocation and alienation from place in the machine-read panchromatic imagery of building footprints. With a remove evoking an aeronautic panning over space and place, but with a crispness of detail that the human eye can’t ever hope to gain, the machine-read input captured from the sky offers a disembodied perspective, to be sure, but one with an eery sense of familiarity the is most pleasurable for the recognition. The map was made by Microsoft engineers who trained computers to read satellite mapping from a huge public database released by Microsoft amplified by the New York Times through local and state maps of buildings’ footprints to create an interactive rendering of the entire continent. Perhaps in an era when we are almost at home with increased levels of surveillance in all of our daily activities and cell phone use, there’s even an eery warmth in accepting the detail of the zip by zip analysis.
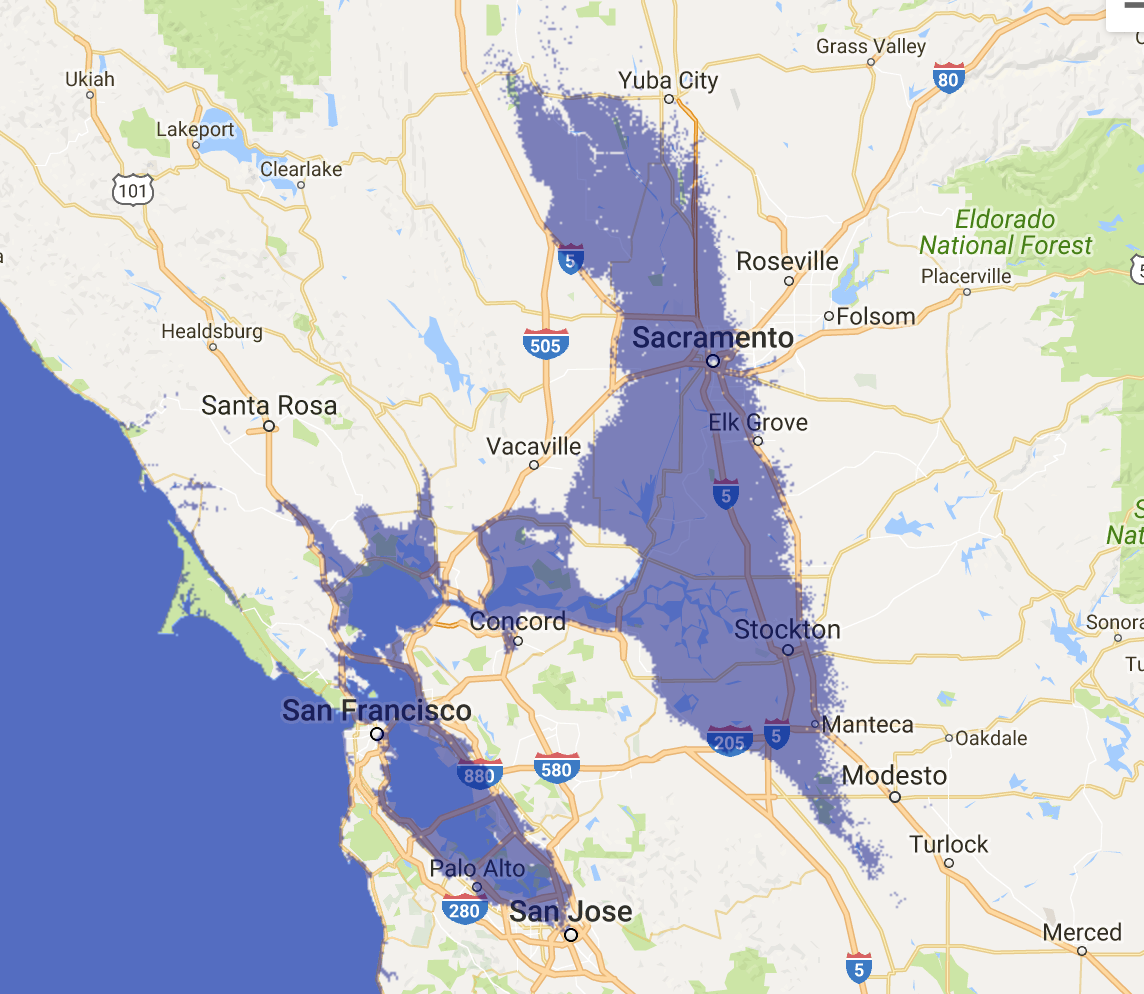
The images suggest not only beautiful patterns that emerge in how land is settled, as the settled areas are stripped out from the surrounding landscape, in an eery reduction of houses to so many dots–which almost seem to be at first a measure of building heights, until one recognizes that they designate the cruder representation of settlement of density alone, but also an imaginary ability to navigate streets of increased population, as if to wander along the coasts of rivers whose level doesn’t flood, and even along intact coastal waters, which seems somehow deeply reassuring at the same time as we read daily of destroyed homes along the Gulf and Florida Coasts–and consider the same regions that are increasingly vulnerable to sea-level rise. The absence of environmental sensitivity–if not utter alienation–masks environmental risks and invites false security by removing real dangers or risks in its abstraction of highly-detailed record of homes and buildings in regions we’re increasingly aware will soon be unlikely to remain.

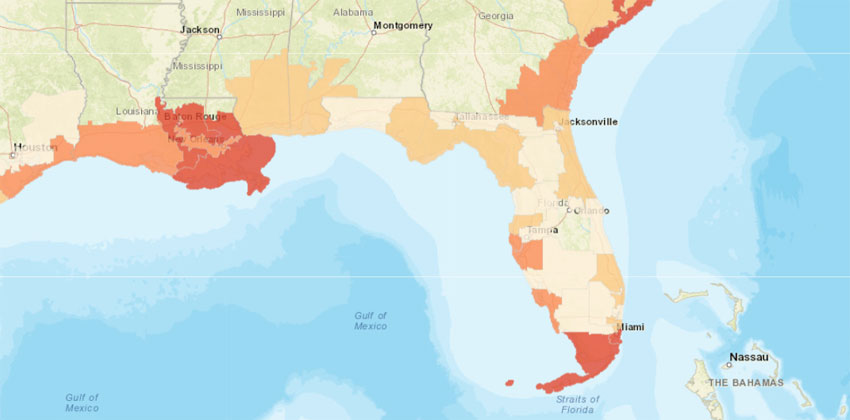
Union of Concerned Scientists, Interactive map of coastal risks from sea-level rise (2018)
Dystopianist William Gibson has recently cautioned the ways “all imagined futures lacking recognition of anthropogenic climate-change will increasingly seem absurdly shortsighted,” and “virtually the entire genre will be seen to have missed the single most important thing we were doing with technology.” A map that reinstates the current configuration of coasts without a nod to anthropogenic change may seem absurdly shortsighted indeed, as if the entire map may be destined to be consigned to something of melancholy reminder of the past, removed from a present to which it bears decreasing resemblance. The point of the map is to capture the now. But where I live, in northern California, faced with increasing vulnerability of drought and fire, as well as flooding, in what seems a case study for climate change, the steep sense of risk and extreme weather stands at odds with the permanence with which houses are mapped. In the Bay Area, where climate risks have become increasingly clear, there is an eery dissonance in reading maps that suggest the permanence of housing, from the North Bay recently struck by massive fires to the seismic vulnerability of the land, all of which make us appreciate the increasing in the inherent risks of climate change with which increasing parts of the continent seem to live in the Texas coast, Florida coast, and Gulf of Mexico.
7. There is something disturbing at the reassurance of the tactile heft that the darkening of sites of habitation imparts. Although it’s machine reading of remote observation is a single snapshot of human settlement, the interactive map has almost representational–and definitely recognizable–heft. The buildings are not records of height–but darker areas mask that they are filled with low houses, and the palpable presence serves as a proxy for mapping habitation in the Bay Area that erases risk, lending a sense of permanence to its shores–as well as to the safety of its houses from earthquakes or fires–and indeed preserves the integrity of the homes, buildings, and skyscrapers, even in the face of the vulnerability of the region to extreme change. After the proliferation of new forecasts, even if containing considerable uncertainty among them, the persistence of each and every building seems stubbornly to have elided or ignored any sense of vulnerability in disconcerting ways.
The absence of the monochrome density of building, in the view of san Francisco alone, presents a view of overbuilding and congestion, to be sure, that omits the image of green spaces,–

–or the abundant habitat that cultivated green cover within the city contains in its exclusive focus on built space.
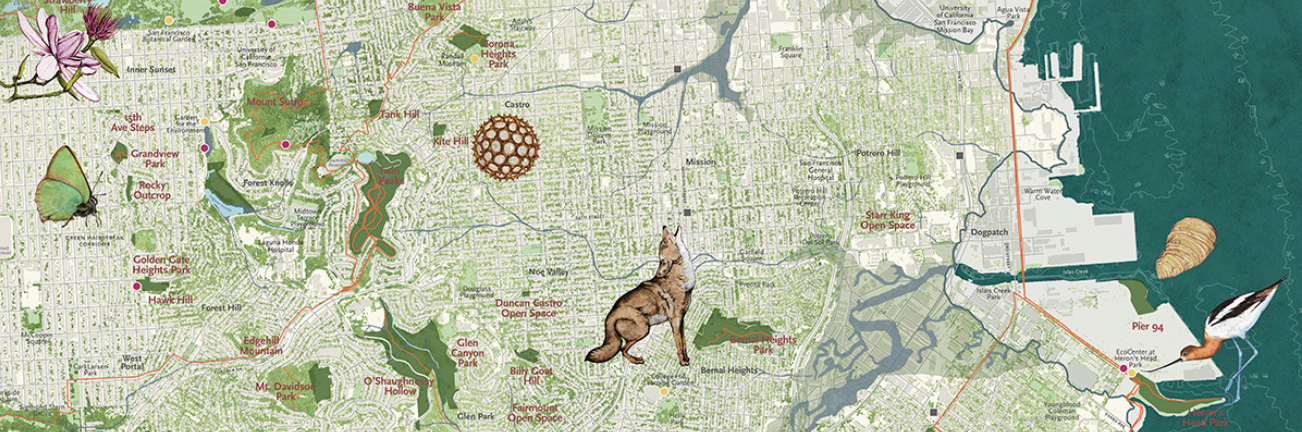
Habitat in the Greener Areas of San Francisco/Nature in the City (2018)
The map of the five boroughs of New York City assumes an iconic form as a record of monumental permanent, punctuated by the white rectangle of Central Park, or whitespace of Flushing Meadows, holes in crowded housing that extends out beyond Newark to the open salt marsh of Oyster Bay or the single-dwellings of Wayne, Yonkers, Mount Vernon, and Freeport or Rockville Center, in a triumphant paean to construction that would have made Robert Moses proud in the density of the housing market throughout Manhattan, but also Queens, Brooklyn, and the New Jersey shore out to Garden City, as if the city has been transformed to an ode and elegy to the power of real estate.

8. Which return me to the oddly melancholic status of this view at a distance from interpretive skills, and from human experience, which the multi-scalar map incommensurately joins to a huge database, allowing viewers to wallow in the attempt to process as much of it as they can take or manage.
Although the database has shed all local detail, and appear removed from any interpretive expertise. Increasing darkness appears a surrogate for the density of housing, revealing intriguing patterns of houses that seem a tease that almost invite the viewer to fill in more information to read and interpret the massive database on where all houses lie. The particular delicateness of the scattering of houses into the parks, open space, or what passes for countryside around the Bay Area, where we preserve a sense of the closeness to the country and its ecosystems to the city. The sense of a tacit proximity to place is partly confirmed by how we see the surrounding regions fade to light grey, as the density of built structures dies down, and congestion recedes. Many bees are cultivated in the area, and the hive-like nature of settlement across the land of houses nestled together seems oddly comforting, and natural, if misleadingly so, in the density of their clustering, and raises questions of their relations to parks, open space, and habitat that were explored in an earlier post.
But the fading of the region to wilderness is far more upsetting than reassuring or comforting, as the weighted regions of Richmond, the East Bay, and Marin City fade into the nationally protected lands as if they were pristine–neglecting the considerably complex historical reasons with which the National Parks System came to administer the Point Reyes National Seashore, quite distinct from the administration of public lands and national parks, in a specific economic climate that led the Mexican-era ranches and farming grounds as a bulwark against the fear of urban sprawl, and prevent it from the process of subdivision and a threatened real-estate frenzy, by grandfathering in farms as a basis for land conservation to treat the region as “potential wilderness” and indeed for the National Park Service to work to preserve the region as a rural environment, to the extent of eradicating and removing half of the built structures from the Pt Reyes Seashore, and wait for the ruminating farms and dairies to dwindle and diminish, and even enacted policies that might encourage the process based on what they thought the park “ought to be”–and ought to look like–according to Laura Alice Watt.

Regional zip code maps show the decisive mark of settlement on the landscape, in a refreshing and somehow actually reassuring way, but also oddly affirm the permanence of that settlement, and treat what is in fact an area of congestion, dense traffic, urban pollution, and over paved regions as a lacy area of disperse settlement, extending as a veil over the land. But if when bees are killed, or their hives disturbed, they give off a recognized scent able to cause or trigger an immediate alarm to the residents of the hive, notifying fellow-residents of an alarm, the dense clustering of houses is the opposite; oddly absent of human scent of dwelling, actually almost antiseptic in its delineation of dwellings, there is no trace to the human or lived save in the scattering of place-names–

–if the larger image of the Bay Area raises pressing questions about housing supplies in the coastal community that seems increasingly crowded by housing and over-paved.

And it continues as we zoom in, as all map readers now feel themselves entitled to do, into the neighborhoods we know, we can find the empty spaces amongst houses, and pause over the interruptions among buildings, and the courtyard like clusters of back yards we are privileged to possess in places like Berkeley, balancing a sense of the density of housing by the familiarity of the white spaces where our eyes can still rest.

Surely this is far away from the dynamics of space that a “map” seeks to offer as an actual guide to human habitation, or illustration of how man makes space.
9. At this level of scale, the lacy habitation of the Bay Area acquire both a surprising solidity distance, gaining a greater aura of permanence, as an archeological map, whose distance seems symbolically to capture the distance of time. As if a set of stones or ancient ruins, the flat footprints of buildings recall, in the questions that they raise for the viewer of their interpretation, the reconstruction of a classical layout of a ruined ancient city, but suggesting a timelessness of an archeological map, which employed a similar density of the footprints of excavated buildings, as if a recovery of memory, and a lost common memory of a Republican past, treasured by antiquaries and visitors to Rome throughout the nineteenth century as icons of a collective mourning for a removed ancient past which survives in the reconstructions of ruins, and which echoed that lost monument of ancient cartography, the Forma Urbis Romae, which early archeologists saw themselves as reconstructing as a legacy of civilization for a large audience during the late nineteenth century, in efforts that curiously parallel the expansion of urban cities, urban working conditions, and urban class conflict, as if the ancient city could emerge as a new citadel of civility.

Such engraved maps of the orientation of ancient ruins and monuments were produced not only for archeologists, but as legible texts of vanished monuments that were destined for educated audiences to reenact the cultured Grand Tours from their libraries. The maps were reproduced widely in printed maps of guides that derive from archeological handbooks, and constituted a collective act of veneration for the lost buildings of what was cast as a common cultural forbear, even as Europeans wrestled with new levels of urbanization, and a reminder of the monumental civilization of the ancient world that provided a powerful affirmation of a common humanity, even as it rehabilitated the slave cultures of the past as a paragon of civility and civilization as European cities grew and expanded to accept rural populations.
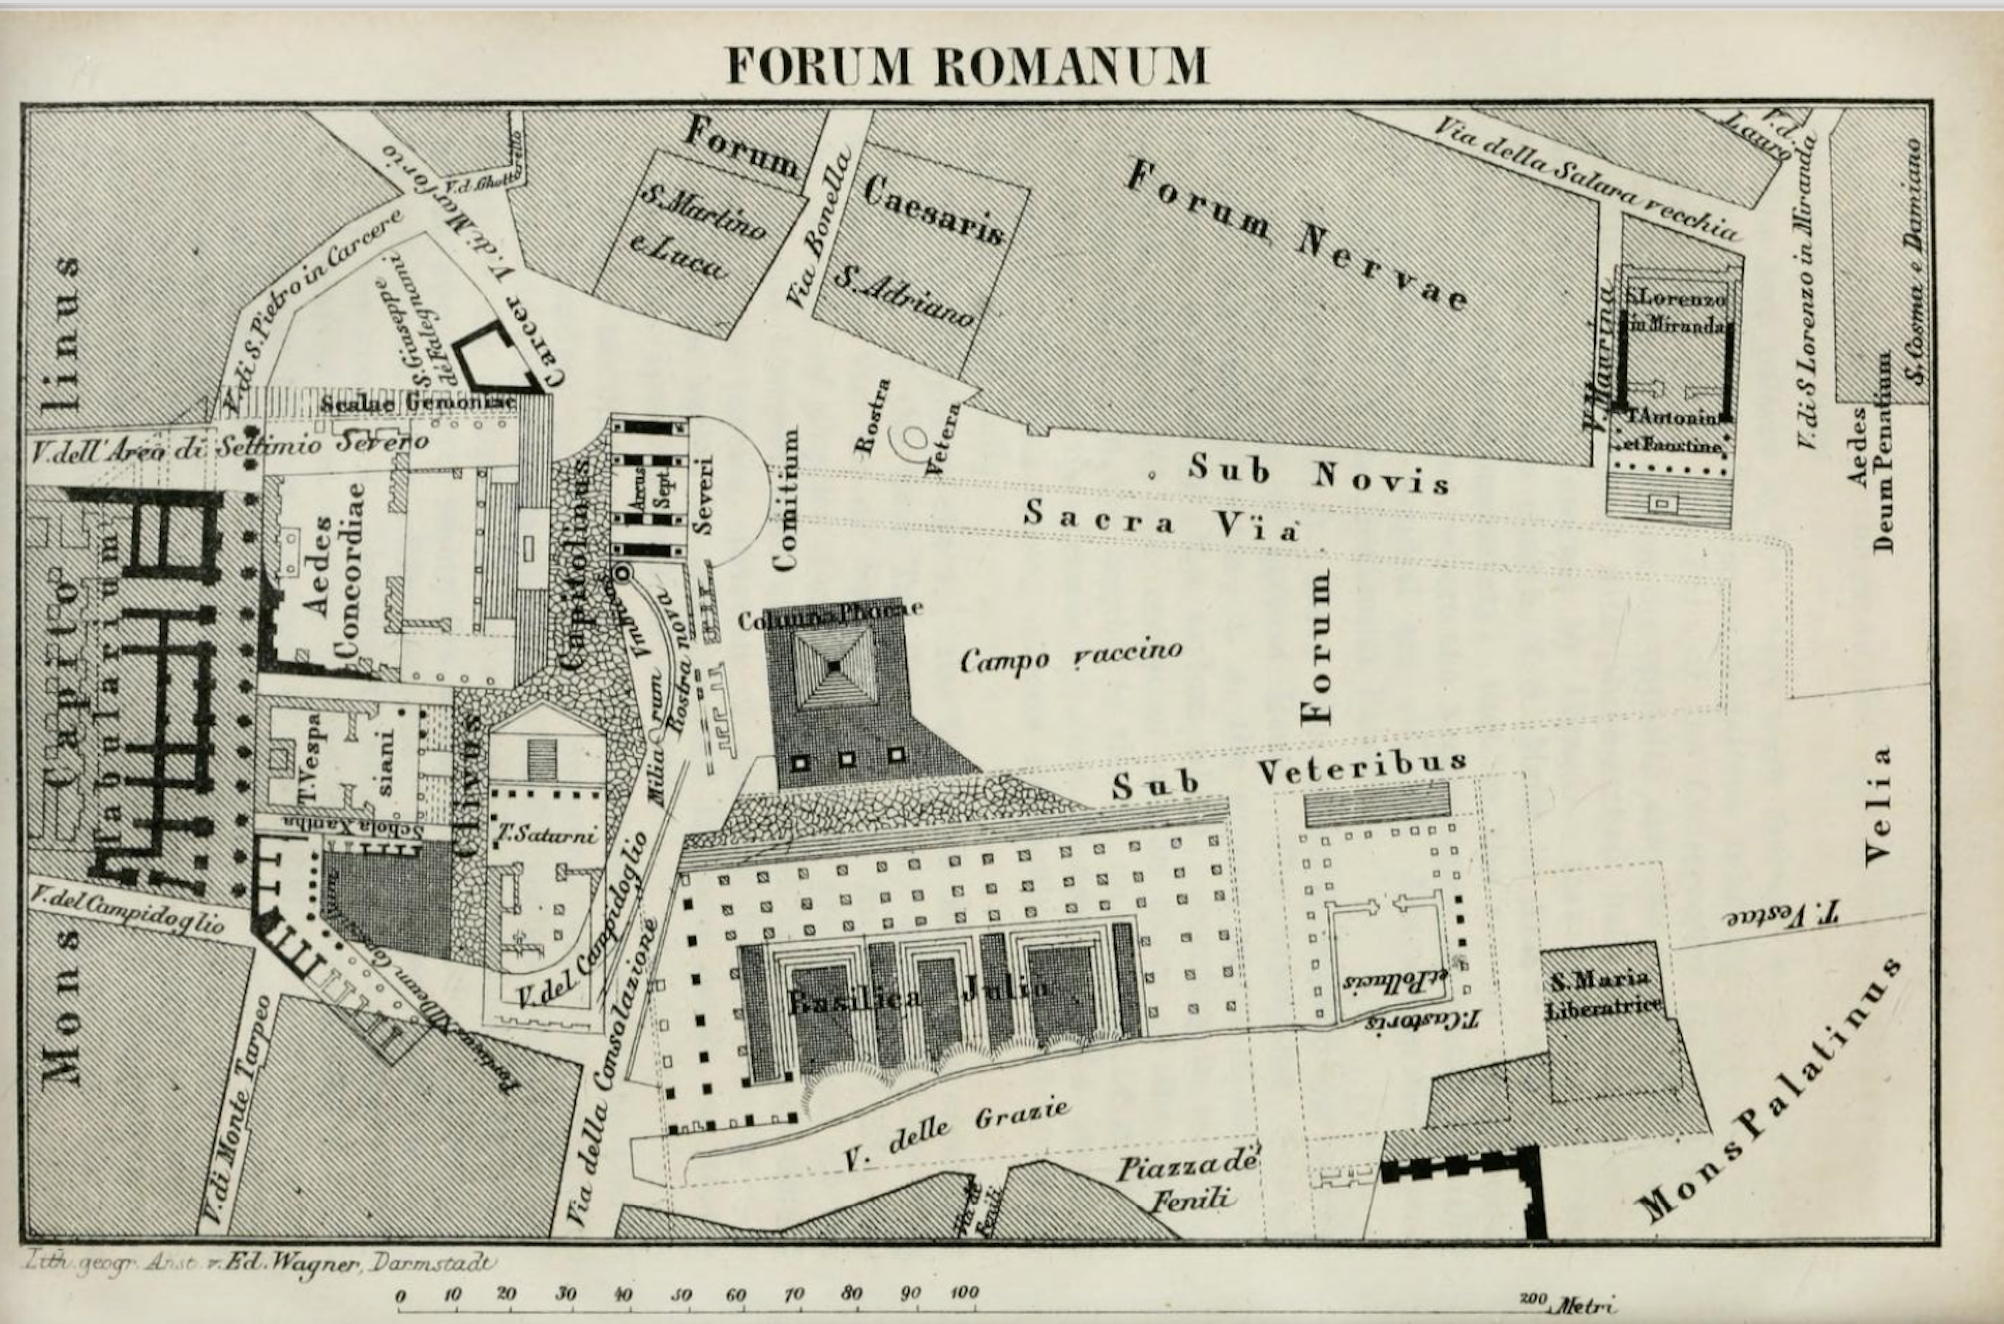

Such plans fashioned a false proximity in powerful ways because they became part of the ideal of urban building,included in the libraries of the cultured–including, somewhat famously, Sigmund Freud–who saw their design as a basis for acculturation and reconstruction across time that served to reaffirm, as if in a Proustian reconstruction of the past, the structures of ancient buildings as superimposed atop the actual urban plan of contemporary Rome, and coexisting with it. The black rectangles, grids, squares or forums, and rectilinear walls of a domus, stadium, temple, arc, or porticos were sites of obligatory reference, as the imagined sites of the collective memory of the past, to which a connective tissue still existed and could be actually preserved.
The rectilinear forms, in comparison, seem unwillingly to convey a false sense of proximity to a temporally removed record, definitively distanced from the present, even as they capture the present. The footprint silhouettes, removed from signs of habitation, oddly evoke permanence and majesty of a lost past of deep melancholy, approaching the commemorative and valedictory as much as the machine-read. The imagery seems mournful in suppressing a state of transience and far more than a state of continence, surpasses anything of the extreme impermanence of the contours of global warming, the extreme insecurity of home-ownership in the California fires, and indeed the heightened insecurity about the future, by investing the footprints of buildings and property with a new sense of permanence, and of finality, presenting the physical ground-plan or plant of the of the buildings etched into the landscape, the buildings now permanent blocks of buildings. The buildings appear as lost sites of habitation, as much as an encomiastic image of settlement.
The maps of course provoke a new, distanced reading of the present, that jars our sense of the constant actuality of most satellite images–of fires, weather, or hurricanes–and suggests the benefits of the distant reading of maps, for all the boasts of immediacy and proximity that we associate with visual media. The machine-read surface of blocks of polygons and rectilinear structures exist as indelibly drawn into a stone, like the mythic stone map of ancient Rome, as a virtual Tabularium–fesitshized by nineteenth century ancient historians as an architecturally majestic site for record-keeping, whose volcanic rock arches were covere by travertine was an inspirational massive public works project perched atop the Capitoline, over the Forum, or, even more likely, the fragments of the Severan map that traced the buildings of Rome in a massively expansive view over one hundred and fifty marble slabs, mounted on the side of the Ara Pacis, at 1:260 scale that recalls the resolution of streets and buildings in “Every Building in the United States,” which was a monument of Severan Rome, showing each place, building, temple, bath, stadium, apartment and street int eh Eternal City as if t attest and confirm their own sempiternity.

The melancholy we find in the Mapbox projection based on satellite data is perhaps not only melancholy in our imagination. We watch a similarly removed view of landscape in “Every Building in the United States,”moving blithely across the screen at multiple scales. We interpret the expanse of landscape beside the curving interstates that cut through the nation, in images that may be showing us the lists of he settlement of the United States on the cusp of the drama of climate change, when our current settlement of place may seem far more transient and impermanent than we have considered it for some time.
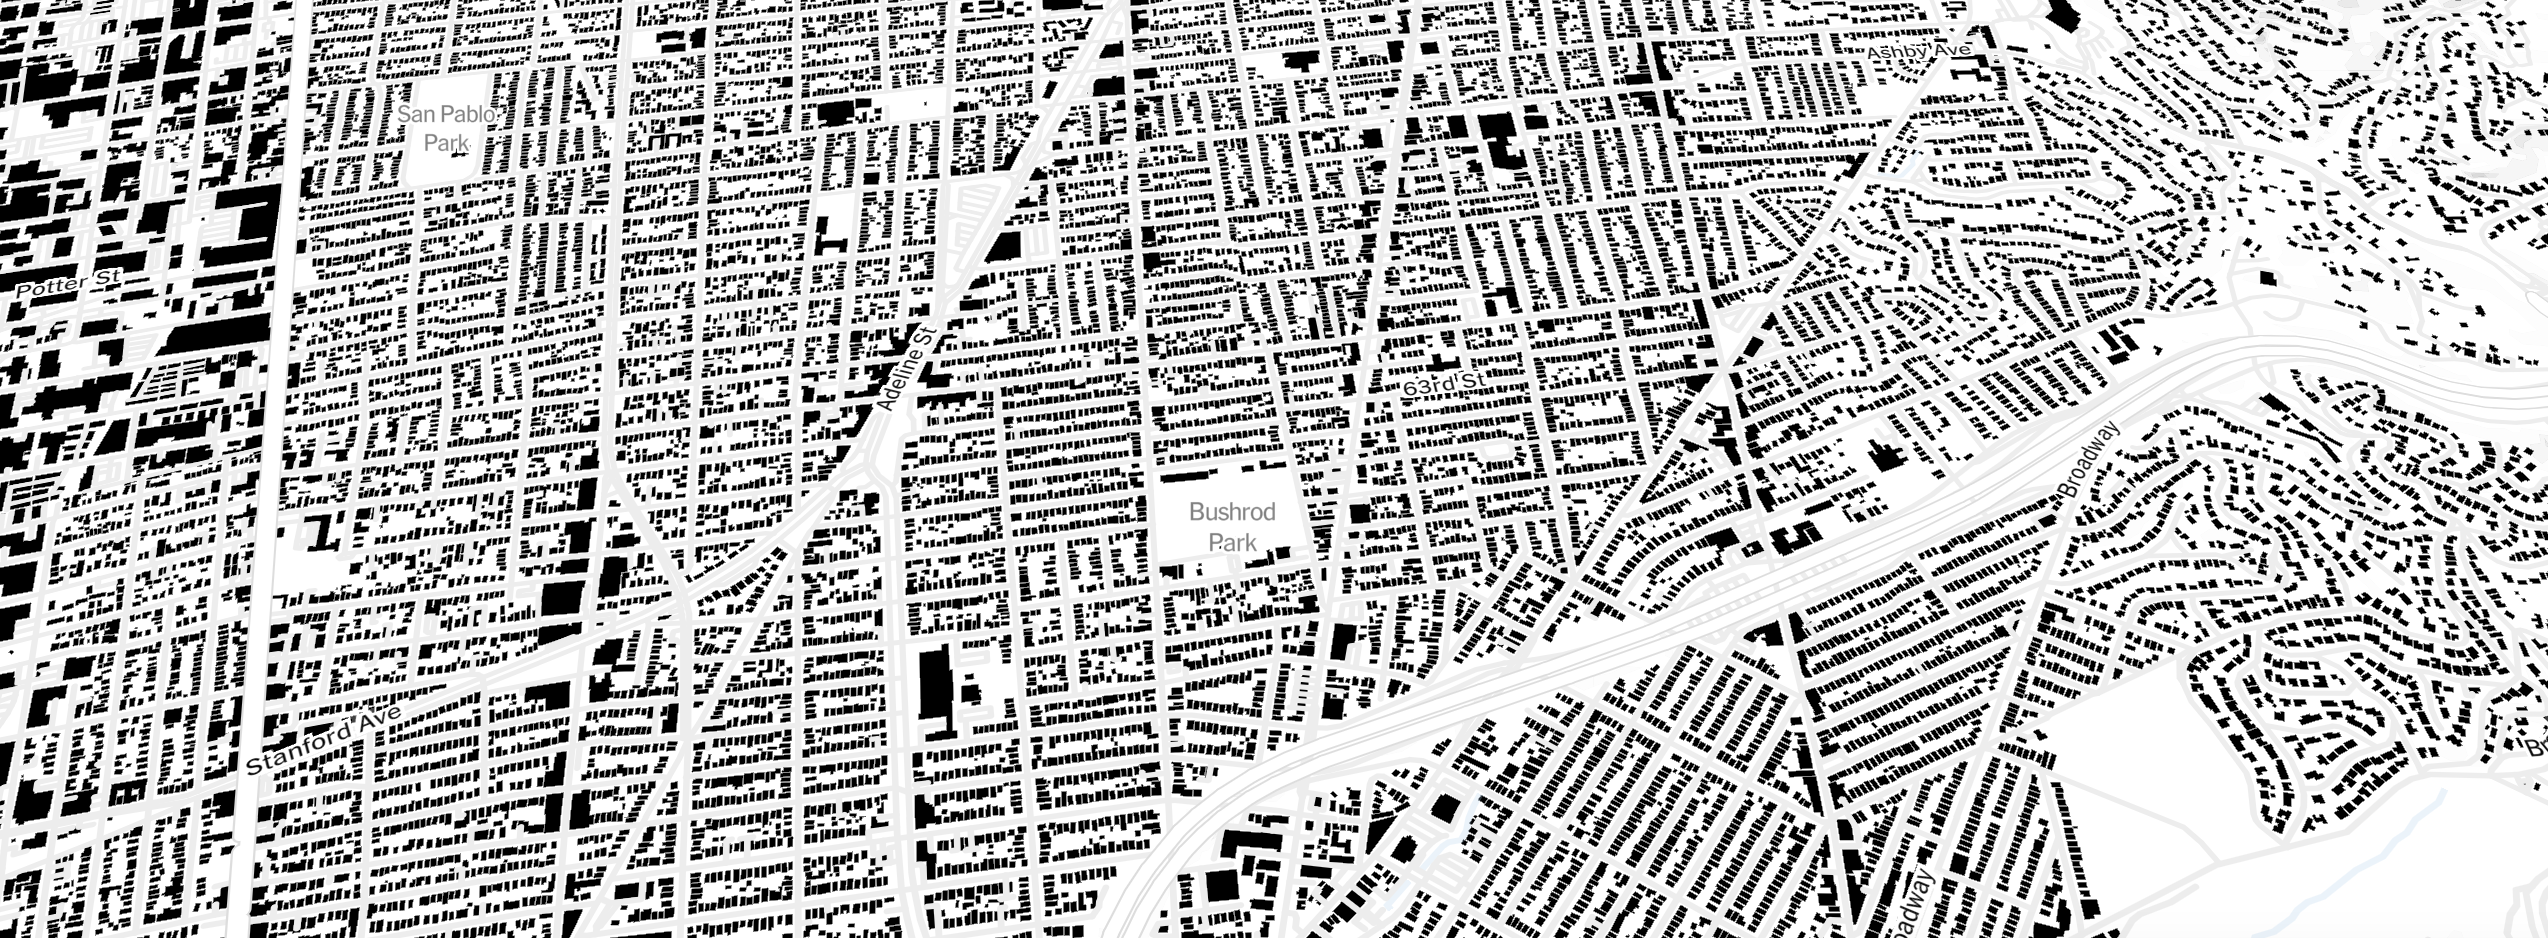
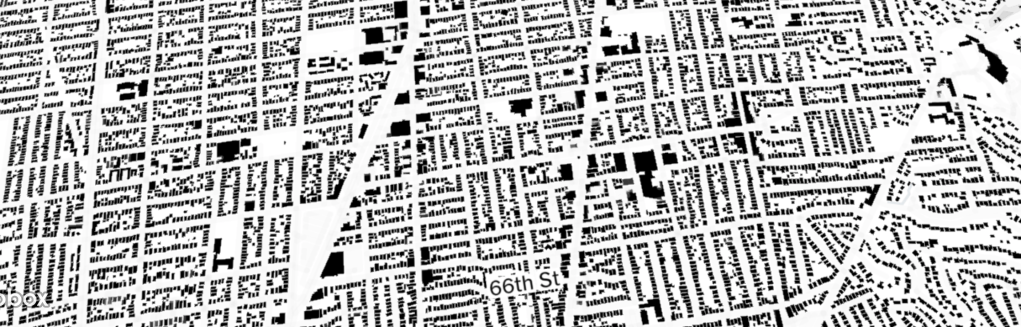
North Oakland, CA
As we move into the more built-up area of downtown Oakland, moving past the open spaces of residential areas, into solid city blocked of skyscrapers and larger footprints, the map is given a sense of material permanence, all too absent from the superabundance of information in most of our hand-helds, the substrate and record of a lived-in set of monuments, removed from a social space or social dynamics, but a human form of a built space that we know all too well. In the face of changing temperature, global climate disasters, and urban gentrification, the timelessness of the machine-read outlines of buildings carry a comforting sense of lack of change.

Oakland, CA
The expanse of Oakland, Berkeley, San Francisco and Richmond that stretch across the Bay all appear as so many static monuments to settlement, bleached of color, locality, or place, but abstracted in so many machine-read outlines, as if in a literally endless map that we can scroll over without the confines of any individual sheet, an odd mash-up of the material and the virtual, mediated through the tools of aerial photography and a crisp machine-reading of the underlying terrain, in which we only slowly realize that we are reading what the machine is reading, but something far more deeply affirming of property values than images of earthquakes, flooding, hurricanes, and fires; the flat marshes of the South Bay seem removed from actually pressing questions of sea-level rise, and leave us wondering where the “Tattered Ruins of that Map” that was the last “Relic of the Disciplines of Geography” will, in the future, lie, or where the print and interactive formats of the map will lie.

Oakland, CA
These are not only buildings, however, but also, it somehow seems, perhaps sites that are akin to resting places, sites of former habitation, or even, in a dark moment of map reading, graves. The evocative nature of these black footprints, as if tracing a progress of habitation over time, serves also as a way of memorializing a site, and a trigger to one’s recall of a place. Panning across the Bay Area suggests a snapshot of a version of lived memory at one moment. It is, to be sure, technologically mediated in its entirety, and machine read, in ways that make it even more ghost-like as if a record of the former sites of inhabitation, and a memorialization of its previous habitation as they will be seen from an unknown future.
This effect is perhaps accentuated as it is so drained of life, save the toponyms that fade from view at quite different times: the striking absence in the map of any civic space, any space of living together, mirrors the absence of any sense of the instabilities of climate change, thought from the 1970s to be among the steepest dangers that the world faced, they are absent from the map.

National Oceanic and Atmospheric Administration/Graphic: Jan Diehm/The Guardian


Silicon Vally/FEMA 100-Year Flood Hazard Zone
Open Street Map contributors/CARTO/created by Amanda Hickman (2015)
Could the future of an underwater buildings of Silicon Valley be the landscape of ruins produced by the results of an increasing absence of contingency plans for earthquake, flooding, or fires? As an age of climate change brings increased uncertainty in climate projections in a climate world, the familiarity with place seems destined to fade. Does the focus on built structures turn our attention, ostrich-like, from the impending phenomena of climate change, and make us feel all too reassured in our admiration of the buildings we’ve constructed along the landscape?
9. One might ask what becomes of place, or indeed constitutes place, as we unpack this massive mapping of a data download. The abundance of spatial information in the interactive maps gisters no sense of human habitation save by the 2-D outlines of built forms. Ursula K. Le Guin, longtime resident of Cannon Beach, Oregon, long championed the specificity of how we construct and define places, from the fictional worlds she created–Earthsea among them, or Kirien and Antares–or the community ‘Klatsand,” also on a strip of land on the Oregon coast, in the Pacific Northwest, to her advocacy of how sanctuary cities could resist the continued anti-immigrant policies which she found so shameful. She saw fiction as a point of resistance by which to define the meaning, value, and nature of the community in an all-important sign of making meaning, creating real commitment, resolve, and determined hope in the face of adversity, as she wrote as recently as 2017, but had also long insisted that the making of worlds and places were themselves critical forms of political action as they articulated and constituted basic forms of hope. “Klatsand” did not exist on a map, Le Guin writes in Searoad (1986), but was first coined and created, when the site lay in the Washington Territories. It gains its deepest meanings from the generations live, die, endure loss and recover, in a town that exists almost as a place of retreat and for the formation of new selves.
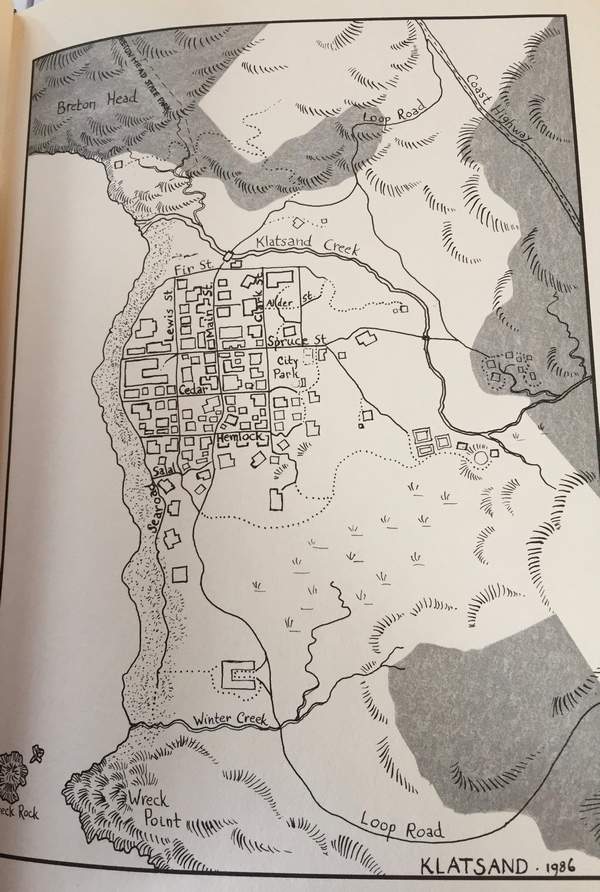
The distinctive locality of place Le Guin evokes, and what might be called its texture, is what seems oddly absent from the abstract buildings one scans in the interactive map released by the Times. The characters in L Guin’s novel confront problems of how to recover from loss, and find solutions in the retreat offered by the town–an imaginary place, whose name was made up by one of its first pioneers, but which stands as a rich refuge in her stories. For its outsider status presents, or preserves, a possibility for continued comfort for the pioneers and outcasts who inhabit it–from suffragettes to escaped asylum inmates to poets, where its land seems to offer a sort of resource for imagining other futures. And the continuity across time of this marginal place became, for its residents, a continued point of resiliency and comfort in apparent adversity. So much is made clear in her richly diachronic–or polychronic–reading of the lives that were made in the place lying on the open shore, decisively off the beaten path, in ways that a simple rendering of built structures flattens, but which is posed as a fragile place between the elements, and an outpost of human survival, more than one of permanence, in which narrative helps one gain a sense of the fleeting nature of the present, preserved by a sense of the fragile nature of this special place–a place with clear echoes of the Cannon Beach area where Le Guin lived.

The fictional Klatsand placed across generations, rich with memories and resources, impossible to map in Euclidean terms. The power of place as a unique relation to the world is affirmed in the quickness with which a bereaved woman in Klatsand is overpowered by an image of the ancient, prehistoric settlement of a coast in England whose powerful memory of walls of weathered stone of small stone huts in Cornwall has lodged in her soul: it suddenly overwhelms to the surviving partner of a couple who lived in the coastal community, in Le Guin’s narration across the generations of women who lived in the northwest coast. All of a sudden, the movement of wind through the houses, the emptiness of abandoned structures that were moved through by dirt, dust, and wind, seems echoed in the wobbly fencing filled with sandy dirt. The image of the abandoned granite home, newly present in her soul, and image of the stones in Cornwall, which lodged in Shirley’s soul as she heard Barbara’s final breaths, captured the sense of an empty dwelling place on a cliff, and a sense of the deep temporal passage through place that is something of a topos for generations of characters–many of whom are women–who move through the town across time in Searoad: Chronicles of Klatsand, and for whom it defines a needed space of self-definition in each of its episodic stories.
The fictional town near Portland, and only somewhat notionally in the United States, seems a site of independent traditions. And when the recently bereaved partner faces the children of her companion standing in her coastal garden on a cliff, the memory of entering the quoits of uncut granite returns as she faces her soon bereaved house. Faced with the crowded flowers of lobelia, roses, tiger lilies, and impatiens that her partner had planted beside the wooden house, she is overwhelmed by the memories of the stone megalithic walls of quoits they once saw. The stone structures that seem to double as homes and graves, similarly inhabited by ancestral souls, haunted the woman as she watched her partner decline, and arise from her soul as a hidden counterpart to the houses perched over the Pacific on a strip of land between marsh and sea; the stone homes echo the scattered houses along the largely uninhabited northwestern coast near Portland, removed from inland cities and with few year-round inhabitants, and the memories that they carry or retain.
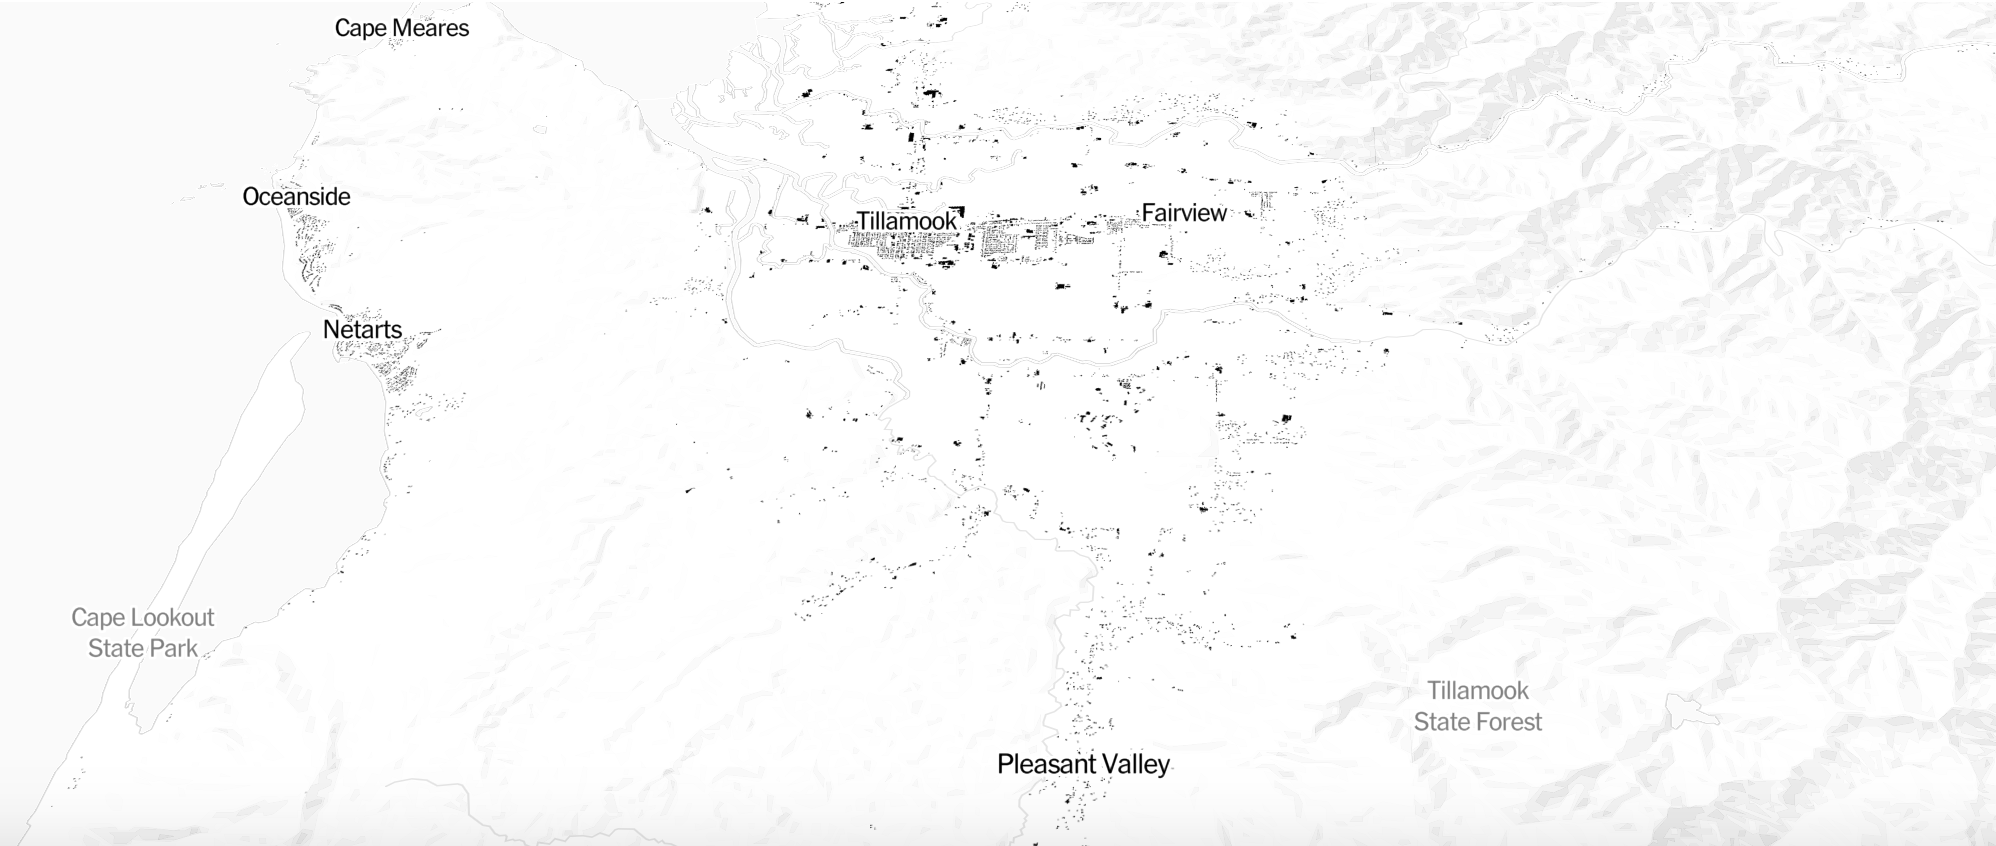
The sparse coastal settlement in Searoad: Chronicles of Klatsand describes an in-between place, where lives are mapped with haunting resonance across generations, haunted by the past, punctuated by deaths, across which female independence resonate. The image of the mysterious prehistoric quoits in Cornwall, slabs of weathered stone leaning inwards and covered by a stone into which the wind enters, resonate as isolated funereal dwellings through which the wind blows, emblems of loss of her partner and the independence of generations of women who return to dwell in the rugged landscape in the houses and homes of Klatsand–a settlement perched above the sea, somewhat eerily echoed in scattered residences found on northwest Oregon’s actual Sandlake Road, stretched thin above the ocean.
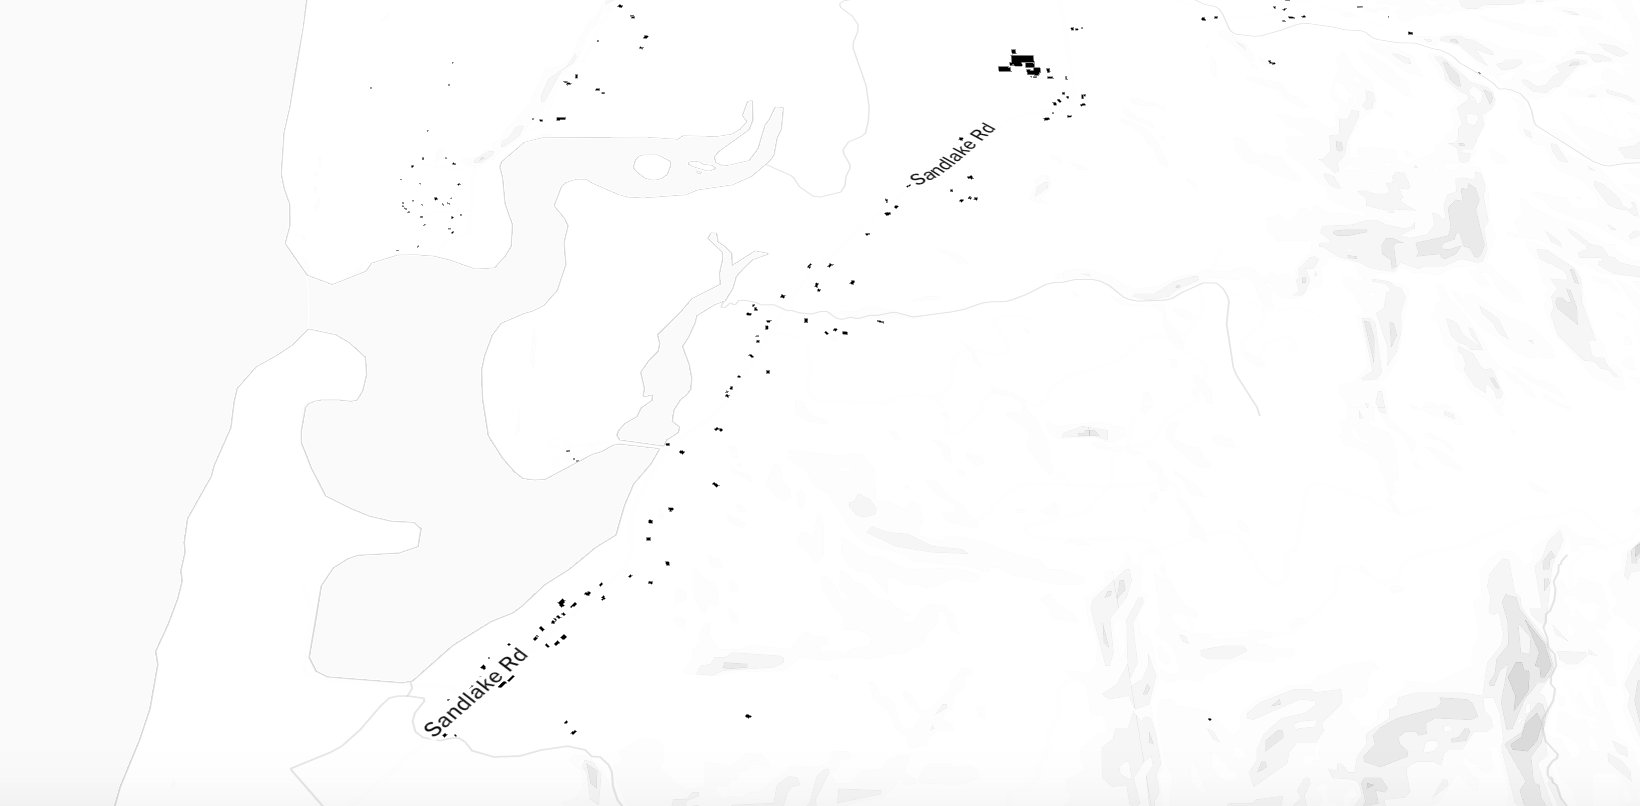
The houses become the sites of transmission of independence and resilience transmitted in the house, its books, sea spray, open ocean view, site, and even in its furniture, not to mention the tracery of foam that waves leave on the coast, and the images they provoke. So resonant are the ancient cliff dwellings in the sequence of stories to suggest a palimpsest of its settlement, and its own sense of enduring memory of houses that are also graves. The granite walls of these mysterious houses, made of slabs of rock with three or two walls, topped by a massive horizontal capstone thousands of years ago seem an emblem of the generations of women who lived in the houses on a strip of land between marsh and sea in Oregon, as akin to the megalithic burial sites, whose houses seem to similarly do double duty as walls of graves–or quoits–in Oregon, as at Cornwall, located “on the worn slopes of hills over the sea,” well-etched and preserved for a heroine by the haunting structures of gaping empty doors mark the spaces by which “the dead had gone in and the living had come out,”–as if such primordial sites were evidence of how “like Romeo and Juliet, and Tybalt lying there keeping them company under his sheets and cerements, and older bones of a older Capulets, companionable,” at man-made openings remaining from a time when “death used to be not a hole but a house.”

A house or a site, or a site of public memory?
The construction of these enigmatic monuments, modes of mapping place as much as residing in it, would hardly register in the machine read maps. They echo the mythic England, separate from if oddly the same time as Rome, which also delineate something like a sacred space.
The sites of the quoits that haunt Klatsand seem to pose questions of independence but also of deep continuities of dwelling places. If houses once were graves, the darkened plots of buildings in the machine-sensed maps seem openings in the inhabited world, akin to something than graves, or memories of ancient buildings, whose presence spans the known world, and lies not only at the edge of the built world, and seems something like an invitation to think of new futures by being placed at a remove from the presence of an increasingly overbuilt world, and lying on its margins, rather than at its center, and offers as such a sense an opening to the spaces of the future even in an increasingly hemmed-in world.


D Is the link working on this? John
Sorry–it will tonight, I think, or sooner