Recent news of the quite devastating dwindling of the High Plains aquifers sent me back to how William Rankin charted the uneven distribution of monocrops in the United States. For the authority with which maps render a depletion of High Plains aquifers as an “underground pool drying up”–as if it were a record of nature, intensified by global warming, echoed in the discussion of a dwindling or disappearance by the time the aquifer that runs from the sands of Wyoming reaches Kansas and the Texas panhandle, leaving farms without the groundwater on which their livelihood depends. Although long characteristic of the nation’s landscape, the underground water that feeds the high plains long taken for granted to dry up–in ways that challenge mapping tools or a reliance on cartographical practices as tools explication. How much this has been intensified by increasing temperatures of summer months, maps reveal the extent to which the depletion of landwater has been exacerbated by agribusiness and the dramatic unsustainability of irrigating subsidized crops from an aquifer that is, due to evaporation, rarely recharged.
Most maps of aquifers’ depletion effectively minimize the impact of patterns of human inhabitation on the plains–if only because they don’t register how nature no longer exists as an autonomous category, or how all maps represent the human shaping of a “natural” record. The authority of the map erases the effects of inhabitation, or the very agricultural practices that much of the same article describes of an intensification of irrigation across the region, uniformly distributed without regard to the level of the water-table. They naturalize the presence of water in the ground, as, most simply, by coloring the aquifer’s expanse by a uniform blue, as if to render a plentiful underwater sea readily accessed by drill.
The shifting water-levels of the irrigation have however shifted the availability of this hidden underground reserve challenge us to use map to expressing the dynamics of its depletion. Use of the Northern Great Plains aquifer system for irrigation has long consumed over half of underground aquifers: irrigation of lands in Wyoming and Montana regularly feeds the aquifer system itself, as excess irrigation feeds the aquifer itself in those states. Yet water-level monitoring in the High Plains aquifer led to increasing declines in its level from the start of its intensive irrigation from 1950, and has most recently led to the failed search for new wells in its southernmost reaches.
The long-term decline of water levels have been concentrated further south in its almost 112 million acres for at least five years. The mapping of water-levels revealed a decline of almost 100 feet by 1980, when the irrigated acreage used for agriculture most dramatically grew from just over 2 million acres to 13.7 million. In the high plains, unlike the great plains, the aquifer itself was rarely restored with water withdrawn from pumping and wells, and an expansion of the demand for water from agrarian land-use led to a single-headed search for extraction even if little water was to be had. The gradual draining of the southernmost aquifer was in a sense long known:
The recent chronicling of the transformation of fertile plains into dust by the New York Times stands at the end of a depletion already mapped by 2009: if the compelling article painted a somewhat passive picture of the depletion of the aquifer that has so shaped the American landscape, the problem of mapping water and crops lay in the implicit tone of a naturalization of water-loss–whose effects nicely intersect with fears for the effects of global-warming–whose ‘news’ may exist in its delayed economic impact on farming, rather than on the absence of warning signs. When Ashley Yost told the reporter Michael Wines “I’ve raised 294 bushels of corn an acre there before, with water and the Lord’s help,” he grouped water with the divine assistance, as if it didn’t come out of the ground.
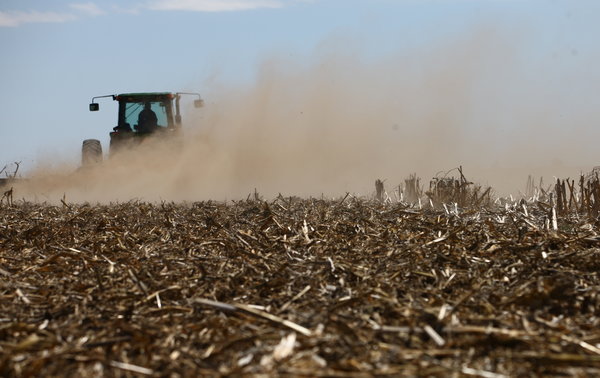
The combination of landscape images of the effects of a parching of agricultural fields with a set of regional maps threaten to naturalize the changing hight plains landscape and minimize the ways in which all maps pose arguments–as much as Matthew Staver’s striking image of arid corn fields–because they fail to register the dwindling as the effect of their practices of inhabitation and a changed dynamic of water-use.
 Matthew Staver
The recent drop of the aquifer of some four and a quarter feet in Kansas from 2010-11 is a call for alarm not only as a “lack of water”; the drying up of landwater during the summer months has led to a dramatic decline in the amount of corn cultivated in that state that reflects a failure of agrarian planning and a concentrating of water-resources in monocrops–as much as the depletion of an existing water reserve in a uniform fashion over time, accompanied by an expansion of water-hungry crops such as corn, beside others like wheat, in the region–not to mention the raising of livestock on water pumped from aquifers. The destructive intensity of the drainage of water that never returns to the aquifers lying deep below rest on processes of extraction and irrigation to a degree that can never be replenished never lay in the individual farmer.
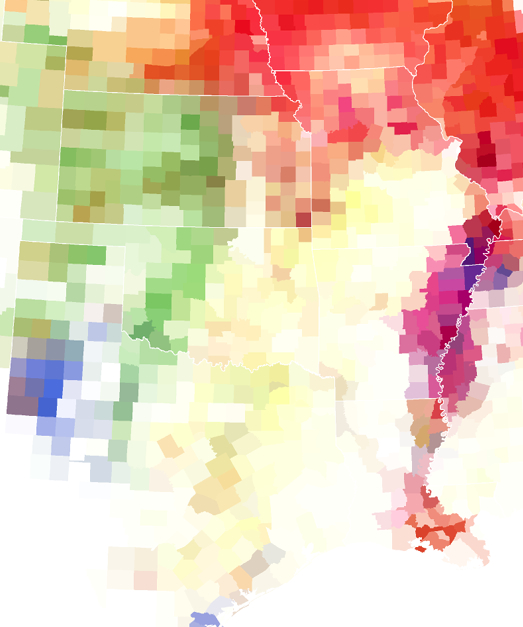
I’ve discussed Rankin’s maps that speculate on the consequences of the uneven distribution of crops and land-use in an earlier post. The correspondence of that aquifer to large corn monocrops they’ve been used to supply is striking when one maps the expansion of corn as a subsidized crop across the nation. What amounts to a submerged sea and had long seemed an unending resource of underground feeding supply has finally begun to exhaust itself–with disastrous consequences for farming communities who depended on its supply as if were a cash cow to irrigate less than fertile lands in the former dust bowl. Corn monoculture was facilitated and undergirded by the unsustainable illusion of irrational abundance of an unending supply of underground springs.

Although the patchwork of intense corn-farming may not be dominant in relation to wheat (shades of green) or silage (yellow), the intense patchwork of corn-cultivation in an area not particularly rich in water-sources suggests the ill-effects of agricultural subsidies on the distribution of natural resources.
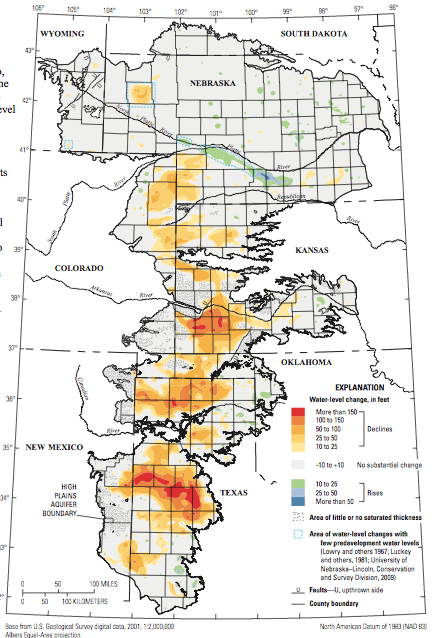
The tan patchwork reveals a depletion of landwater in the very region a region that the New York Times singled out as revealing the adverse effects a dwindling aquifer had on farmers’ productivity. The ill-effects of sustained drilling in vain attempts to force underground water to rise in pumps range from the depletion of the region’s water-level to the survival of crops. But its maps conceal a story of the depletion of resources across the plains with the increased reliance on pumps. The difficulty to pump water grew further south extract demand grew to feed central-pivot irrigators to drench crop lands so as to enable them to remain emerald green and fertile in spring and arid summer months, at the very time that the intense sun dries them, the terrain maps present the present consequences of irrigation practices as the new nature of the plains.
The map that shows a “drying up” of hotspots on the paths of underground aquifers is a map of the future of US agriculture. But the dramatic dark-spots in the area of north Texas and Kansas, the edges of the underground aquifer and the areas of new corn farming, demand to be further unpacked.
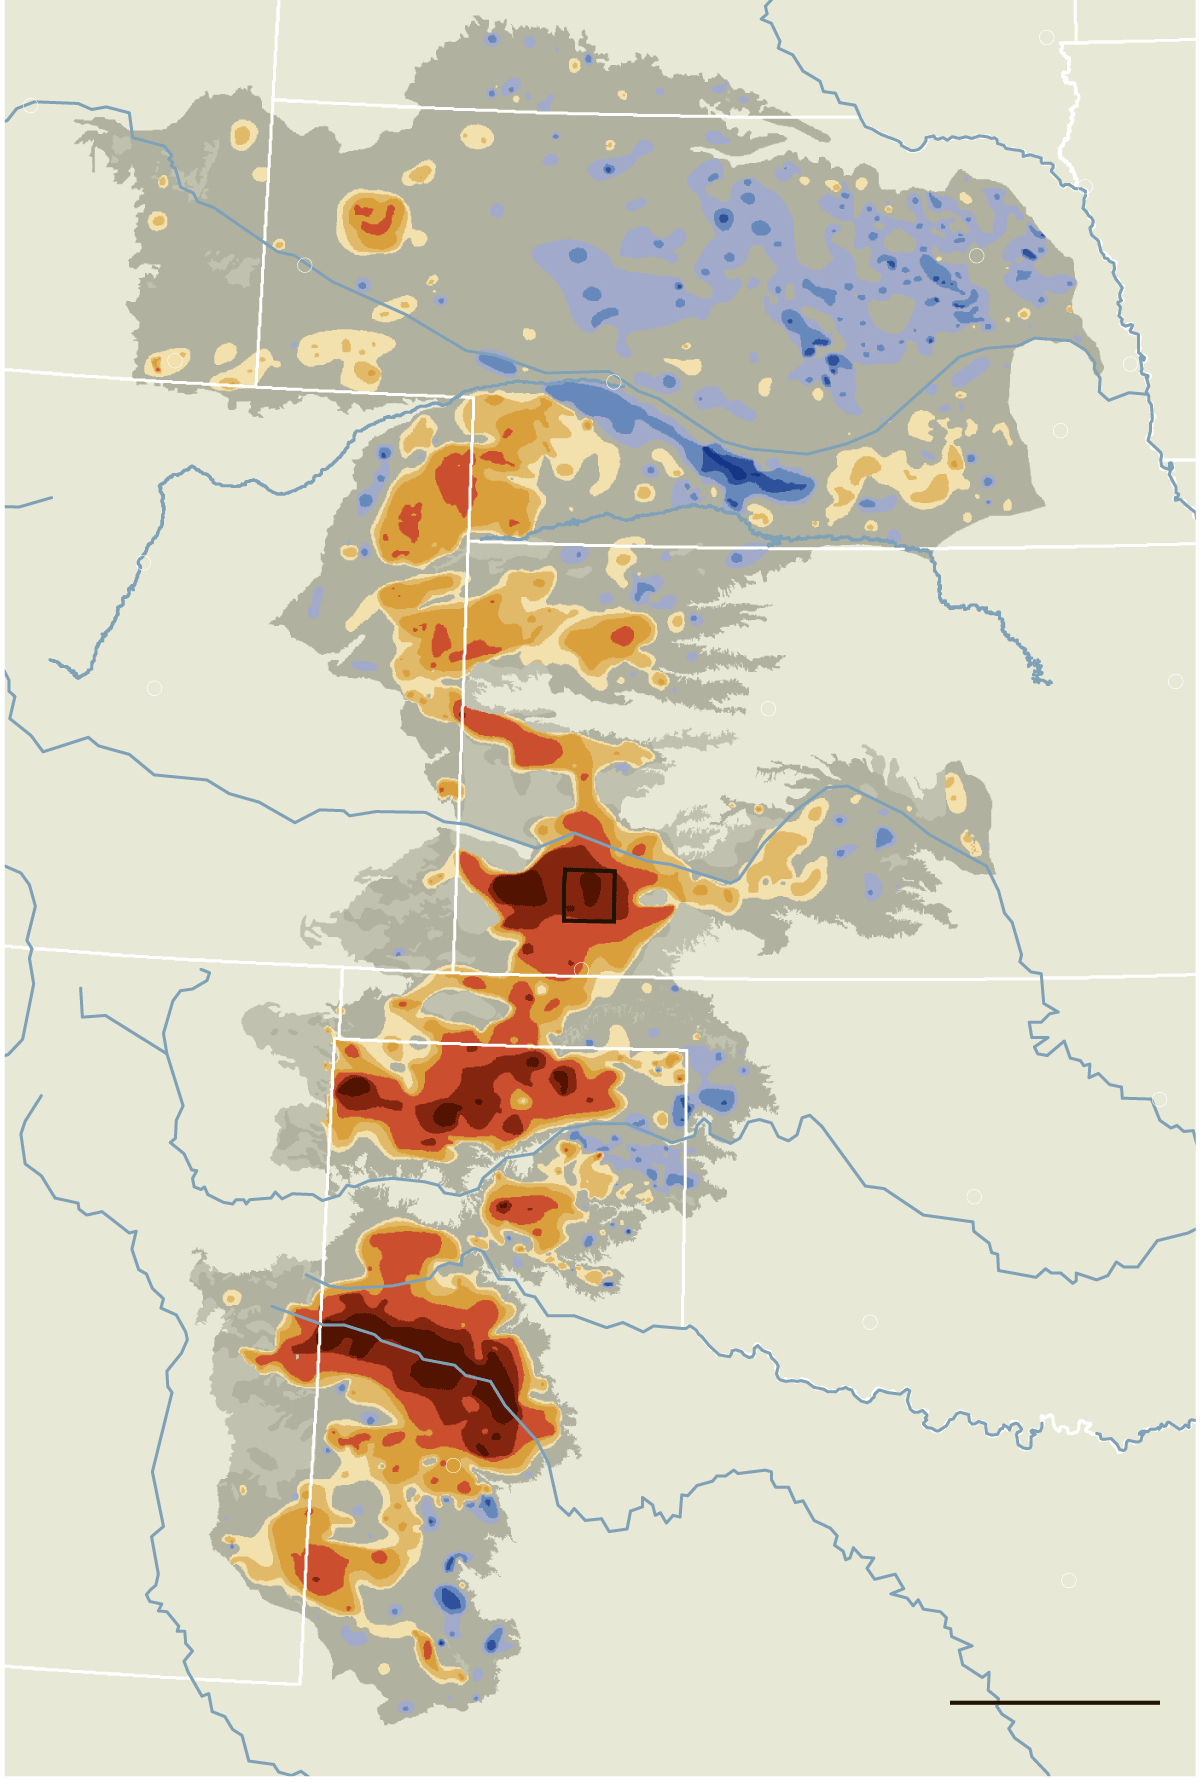
Indeed, the extent to which the cultivation of corn as a dominant monocrop maps onto the depletion of the once-plentiful national aquifers in Midwestern states recently in the news, as the regions whose agrarian geography was defined by big center-pivot irrigators–temples to the belief of infinite water-extraction and the plenty of crops–have been able only to water circles of diminished radii as the aquifer has declined. Yet if “up to a fifth of the irrigated farmland along a 100-mile swath of the aquifer has already gone dry” at the same time as summer temperatures have risen, we need to accept how much of it was forcibly extracted by men hungry for cash.

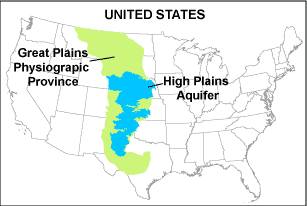
The maps of this water-depletion reveal the need for revising the expectancy that regions of Nebraska, Kansas, Oklahoma, and Texas that occupy the High Plains Aquifer of North America. What amounts to an submerged sea and had long seemed an unending resource of underground feeding supply has finally begun to exhaust itself with disastrous consequences for farming communities who depended on its supply as if were a sort of cash cow that could be used to irrigate already fertile lands. The question is in part how such agricultural practices can change.
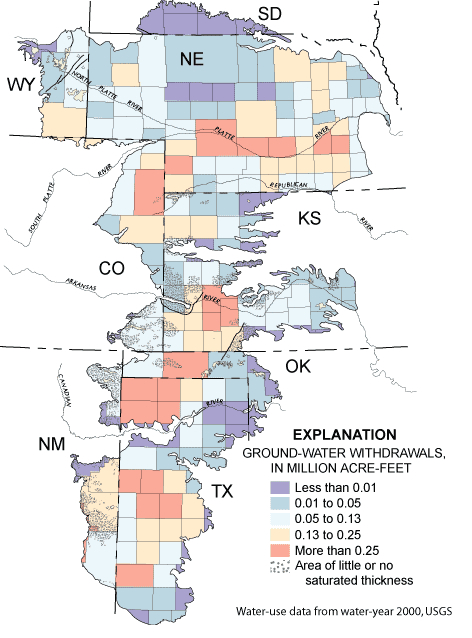
The correspondence between corn and landwater gets scarier when one notes the intensity with which aquifers had begun to be drained by ground-water withdrawals as early as 2000 to nourish the spread of thirsty crops such as corn that have led to increasing reliance on unwarranted extracting of groundwater.
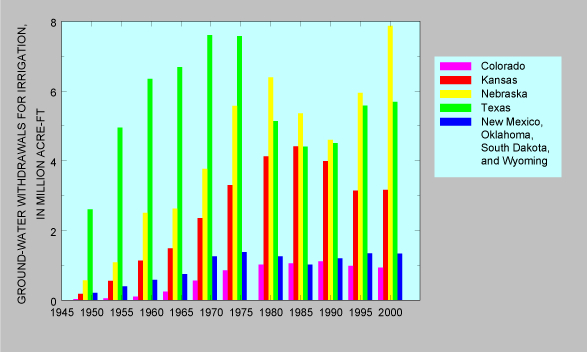
The dramatic rise of irrigated acreage in this region maps onto the epicenter of a devastating dwindling of the plenty of aquifers in Texas, Nebraska and Kansas–and onto the period corn was subsidized:
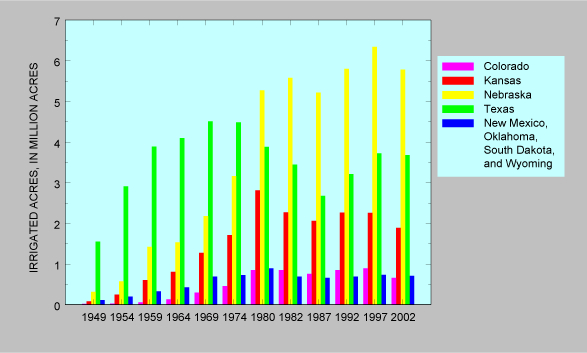
The steady rise of ground-water withdrawals for irrigation was particularly dramatic in the 1990s for Texas and Nebraska, and the decline in regions like Kansas may have already been precipitated by a draining, as much as a drying up of, aquifers: