Tag Archives: human geography

Our Increasingly Overlit Night Skies

In the year 2025, a seven year old girl looks up at stars against the “deep, black” night-time sky, remembering that her stepmother as a child could once not see their “cool, pale, glinting light.  Octavia Butler sets the scene for her cautionary tale, Parable of the Sower, with the child’s stepmother uttering two words–“‘city lights‘”–unable to conjure the historical changes of nocturnal luminescence during her life when stars have become unable to be seen in the night sky.  “‘Lights, progress, growth, all those things we’re too hot and too poor to bother with anymore,’” is all she was able to haltingly explain.

The notion of a “star-gazing station” that pops up along the highway may seem an improbability today.  But driving an hour and a half north from Toronto, just north of Napanee, one passes a Dark Sky Viewing Area, that offers the chance for volunteer-led star-gazing, where knowledge about viewing night skies are eagerly passed down, as if out of Fahrenheit 451, offering opportunities for amateur astronomical observation of geminoid meteor showers at the “most southerly dark sky site in Ontario,” where increased stellar visibility confirms that one has moved sufficiently away from the hyper-luminescent United States to “natural brightness” to view the Milky Way in all its glory.  The designation of “natural brightness”–or darkness–suggests a growing need to reckon with the geographical limits of night-time illumination.  North Frontenac, the Royal Astronomical Society of Canada   assures, offers surroundings suitably dark in fifteen km in all directions to be designated a “Dark Sky Preserve Status” for viewing night-time skies as they once looked.  The Star Gazing Pad invites all with telescopes in what seems a throwback to the popular astronomical observations of Victorian England, but responds to fears of the unprecedented skyglow and the augmented illumination of night time skies.


Dark Sky Viewing Area.png


Driving north from the border today, one arrives on the 401 in “dark sky country,” as if a definitive passing of the border, north of Kingston and Lake Ontario, removed from the nocturnal glow of city lights, which promises to provide the “night sky experience very similar to what was available more than 100 years ago,” promising visitors the chance to “witness–perhaps for the first time [in their lives]–how the night sky is meant to be seen.”

N Frontenac

North Frontenac Dark Sky Preserve


Dark Sky.pngLennox & Addington County Dark Sky Viewing Area


Again, the question of the geographical boundaries of “natural brightness” and “natural light” are called into question by sites of such “Dark Sky Viewing Stations,” which have grown rapidly in Canada as preserves to “save the stars from light pollution.”  The United States was the foremost model for Butler’s cautionary tale of a post-apocalyptic future, when stellar visibility had only just returned, but only did after the decline of a world in which increasing artificial luminosity had long removed the stars from increasing portions of mankind.   The vignette helped situate readers in a time just after a global collapse, where villages and cities are walled from roving gangs of drug-crazed marauders, and any semblance of security or infrastructure is gone from memory, and has faded into a past that few save the old can recall.  Lauren protests to her stepmother “there are city lights now” which don’t “hide the stars,” but the older woman is only able to shake her head in response, trying to summon earlier skyscape, and describe the changes that set the scene for the dystopia they now inhabit:  “There aren’t anywhere near as many as there were.  Kids have no idea what a blaze of lights cities used to be–and not long ago.” Lauren tries to recuperate an even earlier sill of reading the stars by an astronomy book that once belonged to her grandmother that allows her to decipher constellations she is now able to trace, and are newly visible in the night-time sky, using its maps as the sole means to be able to glimpse the stellar order seen in the night-time skies of bygone eras.

In ways that give a new sense to “dark data,” techniques for mapping of the absence of light from an increasing share of the world suggest a new understanding of “place” that commands attention in multiple ways.  The Bay Area where I live can already be seen from the sky from the International Space Station, as photographed by astronaut Randy Bresnick photographed it in one of his final trips about the planet, that bear shocking witness to the expanse of populated lands that illuminate the growth of streetlights in the Bay Area, where intense luminosity stretches from San Jose to the Carquinez Bridge:


DQ45lruUMAAQUQW.jpg-largeRandy Bresnick/@AstroKomrade


The experience of the extreme intensity of urban blazing is echoed in the quite timely appearance of an atlas of night-time space.  The use of satellite maps to chart the extent to which artificial light has come to compromise the night-time sky over the past fifteen years.  For it reveals the global scale at which the growing impact of light pollution on the diminished darkness of the night-time sky not only around once sacred areas, like Stonehenge, but stands to change our sensitivity to the perception of starlight, and experience of a non-illuminated world.   At one time, the definition of astrological constellations provided a basis to organize time, space, and prognostication, they offered natural guideposts for maritime navigation–as the girl in Parable of the Sower seems to suspect, even as she struggles with the absence of many clear keys for their interpretation.  If Butler suggested the dark future of no stars in an alternate world of the future sometime shortly before 2024, by which time the dark sky has returned, we see little point of turning back in the maps of the over-illuminated world presented in the first-ever global atlas of light pollution atlas.

The atlas suggests we won’t so easily return to an unlit world–or at least won’t return save after a similar apocalyptic massive destruction of the over-industrialized world.  The recession of stellar visibility is only beginning to be fully mapped in full, but the ever-narrowing window of night-time perception of stellar visibility seems quite timely.  The global spread of man-made light pollution is the direct consequence of living in what historian Mathew Beaumont first described as “post-circadian capitalism” back in 2005– a condition where work-time is no longer governed by a clock, or biological rhythms of sleep, but both flexible employment and 24-7 economies have effectively expanded the working day to a continuous job, often enabled by continuous illumination. If Beaumont, following Jonathan Crary, has seen the sleep-deprived working worlds of the globalized world that denies the value of rest–or allows one to deny it–the attempt to process the global absence of darkness demands to be grasped as evocatively as Butler began. And one is pusehd to do so by a recent collection of the diminished global levels of starlight and stellar visibility, which invites us to try to survey what a sky without stars would be.


Continue reading

2 Comments

June 18, 2016 · 12:26 pm

Disappearing Open Spaces across the American West

In the visualization of land conversion map in the header to this post, cities like Denver, San Francisco, and Salt Lake City haunt the transformation of landcover across the western United States, as the place-names haunt the five-color map that denote the scope of an absence of open space.  From each city, expanses of red leach into the landscape, spreading outwards along patterns of settlement in ways that seem to infect the adjoining counties to register how development cascades to surrounding regions.  The image shows the reduction of once-open spaces with the dramatic pace of extra-urban expansion in most western states, whose absence seems to haunt the region that we once knew as the American West, and are departed from it.

The dynamic maps suggest a poetics of loss, both qualitatively objective and evocative of the disappearance of a landscape that no longer exists.  Increasingly elegant interactive data visualizations help orient viewers to a changed relation to the landscape of the west over the past twenty years, and the disappearance of what was once a notion of wilderness that have so dramatically retreated over increasingly active real estate markets and dynamics of expansion that allowed such pronounced extra-urban growth over a short period of time.  The subject of the maps is not only difficult to process, but complex to navigate over time:  if the use of a slider bar helps orient oneself, it also raises question of the historical implications of such a broad retreat of open spaces across western states.  If the Old West seems a fixed chronotype to some, it may be that mapping the retreat of open spaces can provide a lens to chose our Romantics, or map the nature of our Romantic tie to the retreating spaces of the past and its landscapes.

But how best to read the landscape that lies beneath them, and the changed experience of the landscape they seek to describe?  The stark colors of the data visualization cannot but suggest a romantic relation to place, marked by the disappearance of formerly open lands, and suggestive of a deep change over few years.  The multiple levels of time that the maps of The Disappearing West, a web-based map offering ultiple datasets of different sorts of human activity presented by Conservation Science Partners and the Center for American Progress.   The elegantly interactive website of land use, showing incursions of open spaces in alarmist red, provide a way to take stock of existing changes and the dizzying pace of the disappearance of opens spaces that may even be cognitively helpful, as the scale of such changes are so difficult to process.  The opportunity to examine change on different scales and over time, by use of a slider bar, provide a basis for coming to terms with the increasingly irrevocable rapidity of such changes, and indeed with the inevitable melancholy of the departure of the known world of the past, but provide a deep and irrevocable sense of how our own ability to observe the western landscape is in the process of irrevocable change.


1.  Such a sense of irrevocable change was quite violently tried to be stopped when the self-designated cowboy when the out-of-state vigilante Ammon Bundy summoned like-minded ranchers who inhabit another region of the same landscape in Nevada.  He summoned the ranchers who viewed themselves as rightful residents of a faded land so that they could seize public lands in Oregon’s Malheur Wildlife Refuge, without justification, but to assert their imagined rights to open lands.  In garrisoning one outpost of the wildlife sanctuary, without much regards to its use, they sought to stake claims to their rights to a rapidly departing map.  Their reaction–but one of many to the disappearing west–suggest a point of beginning to see how we might better come to terms with the acceleration of the loss of open spaces over time, and the problems of mapping them onto the region’s powerful spatial imaginary.

For in misguidedly hoping to occupy the refuge’s offices until the United States government “release” any claims to the public lands it has long administered, they seemed to act in hopes to reclaim a landscape increasingly fragmented by overdevelopment and forever altered.  As open spaces of the Old West disappear, the staying power of the  mental imaginary of open lands have created a tension palpable enough for Bundy and his followers to view federal protection of pubic lands as unjust, and armed with a sense of reclaiming a lost landscape for hunting, they aggressively reclaimed a myth of a sacred relation to the land that they might experience to use firearms freely without impunity in open spaces, and eager to recast protections of public lands as if they were primarily individual restrains.

As if to stage claims to a disappearing west, Bundy sought to reclaim them for ranching and hunting from a very local point of view, resisting a disappearance of the fabled “open lands” that once defined the imaginary of the West for Ammon Bundy, the son of a Nevada rancher.  Bundy and his fellows railed against the government, invoking hopes to restore the conditions of the west, as if removing governmental presence would let a wilderness reserve to revert to wilderness by liberating it from alleged government control:  his anti-government animus was evident in his earlier defense of the right of his father, Nevada rancher Cliven, to refuse to pay grazing fees of federal lands.  Ammon encouraged a 41-day armed occupation of Oregon’s Malheur National Wildlife Refuge in January, 2016 to defend local claims on a national stage–although his anti-government stance was more apparent than his appreciation for the historical loss of open lands across the extent of the western states.

The outpouring of sympathy of resistance of a range of militia to Bundy’s elaborately staged reclaiming the West was a response to a shifting mental geography of the west.  But the bizarrely misplaced response of such extreme violence among the Bundy and their followers in the name of reclaiming western lands seemed to act as if it was possible to restore it to a lost landscape of hunting, trapping, cattle ranching seems a geographic dream.  If the maps were in their heads, it was so remote from realization to be self-indulgent.  Might the interactive format of a web-based map provide a more clear-eyed way of taking account of the rapid decline of open lands across the western United States?  Can interactive data mapping of California’s rapid loss of open lands in an interactive format provide a more clear-eyed ability to track their disappearance?

A recent set of two-decade old change in The Disappearing West offer an opportunity to assemble and investigate data on the drastic reduction of public lands and extent of extra-urban growth across the west that seems particularly timely as a way to chart the rapid pace of landcover change in the West in relation to the Bundy brothers’ ill-conceived attempt to the back a mythic relation to the land.  The graphic tools it offers call attention to the loss of open lands in our national interior.  Indeed, the increased current dangers of dismantling the public custody of remaining open lands may make the website a valuable tool of visualizing and taking stock of the extent of their reduction in recent years–and raise questions about the best ways for preventing their disappearance.

For the dangers to the western lands lie in fact less with the invasiveness of public governments or the extent of government land-holding in western states than the true value of their custodial role in preserving needed habitat and open spaces–the commons of the wilderness, if you will–that are increasingly endangered or lost.  The imagined spatial geography that the Bundy clan sought to defend has long vanished, but Ammon and his brother Ryan held a spatial imaginary nourished in a landscape where federal policy, rather than local development, threatens the landscape of the west. Much as their father, Cliven, had evoked the former freedom of a once open lands of the western states once known as the “public domain,” the retaking of a federal wildlife reserve seemed a theatrical reenactment of federal lands as if a wildlife refuge constituted a last stand for defending his family’s rights.

The vigilante group illegally occupied offices of a preserve for birds for month, after intending to remain for a year.  They did so in their desire to affirm a departed west, but acted somewhere between a costume party and organized terrorism in a poorly conceived defense of the Second Amendment, dressed in cowboy hats and attracting the support of anti-government militias at whose rallies Ammon Bundy and his brother Ryan announced plans to occupy the refuge’s unoccupied offices on the first days of 2016, inviting armed men to sieze them to defend the idea of access to an idea of wilderness long vanished for most.   The range of objects sent to them–many including sex toys that made fun of staging claims to masculinity in an isolated cabin–underscored the futility of hoping for a restoration of a rancher’s sense of the wild, by hopes to “open’ 1.4 million acres of the National Forest for logging, conjuring specters of governmental presence in untarnished lands to protest the government’s role in the US West.  Their bid to renew the old rules of the western lands by exposing an undeveloped forest to forestry, challenging how the National Parks have preserved remaining isolated areas of a once-forested expanse of wilderness, suggest the need to gain purchase on the scale of the expansion of paved landcover and property development across the western United States.


Screen Shot 2016-10-28 at 11.27.22 AM.png
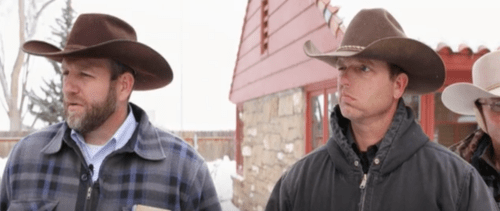
Ammon and Ryan Bundy/Oregon Public Broadcasting


While their protests were misguided, the Bundy brothers seized state facilities as if they were their natural rights,  bulldozing new roads in the refuge, and attracting the attention and support of local libertarian militia until they were arrested as if protesting the death of an earlier rural America and of the once-open west through the issue of federal land-ownership.  But the problems of public management of lands have little to do with the disappearance of open spaces across the western United States, if the Bundys sought to defend their ability to graze animals, hunt, camp and live in open lands increasingly curtailed in most of the United States, and even in the western states where few opens spaces remain, but where residents were long attracted to the freedom of their open space and ready to defend what they saw as the impending encroachment on common lands, and lacked much objective relation to the deep exclusion that they felt.


image-1.jpegRick Bowmer/AP


2.  The loss of open spaces from Arizona to Oregon are far less the result of government policies than the rapid overdevelopment of western lands, and although the spatial imaginary of the Bundy and his followers directed much of their animus to the United States government, they responded to the rapid contraction of the notion of “public lands” that have changed the very image of open space across the western states, which Bundy seems only to understand–quite misguidedly–in terms of the federal policies of land management.  If the notion of “the commons” has long departed from the American West, the image of those commons and rolling plains has been far more compromised and challenged by the rapidity of land conversion due to public development and the rapidity of extra-urban growth, which Bundy from the perspective of his father’s ranch may not see–and may even only be able to be entertained from a site such as the Wildlife Refuge where he and his followers holed up and presented the demand that the “federal government will relinquish such control” of the national forest it maintains in a role of stewardship, and allow “ranchers . . .  kicked out of the area [to] come back and reclaim their land.”

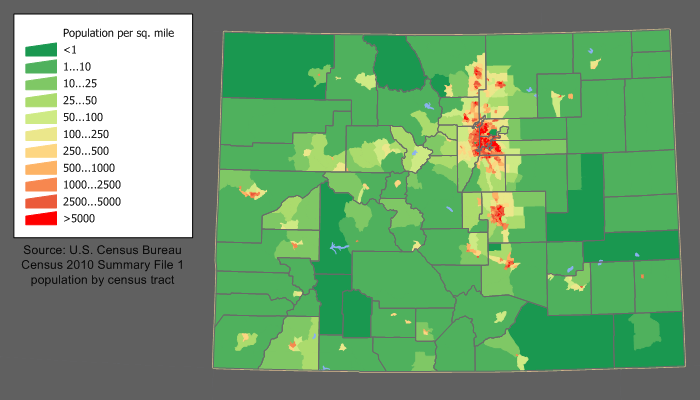
The imagined intergenerational transmission of property rights in regions never open for ranching could be alleged to be “in accordance with the [U.S.] Constitution, which is the supreme law of the land,” but the desperate vigilante action was a power-play for national attention with little sustainable logic–especially given the scale at which open lands were lost to private development across the west.  Whether the image of the “Oregon Territory” inspired Bundy and his crew, privately held lands (light blue) dominate Oregon far more than the small bits of National Wildlife Refuge (brown) lying in Eastern Oregon–yet Bundy alleged his case lies outside of government jurisdiction, summoning a misguided notion of natural rights to defend his personal right to the land.


Oregon.pngLand Ownership in Oregon/Mark Green


3.  The accelerated diminishing of green space across much of the Western United States has rapidly rewritten a landscape of once-open lands.  Such rapid curtailing of open spaces, as much as revealing a change in land cover, has deeply altered the local experience of the very landscape and fragmented wildlife habitat in ways challenging to map-so radically have deep changes altered our experience of its landscape on the once-virgin west through the rapid change of once-rural lands.  With over a hundred million acres lost to modification by humans, a decade of satellite imagery of land cover over eleven western states, the interactive maps The Disappearing West offer a starting point to explore, survey and take stock of the scale of massive environmental changes created by an ongoing collective redefinition of how we have come to inhabit the new landscape of the American west.  Indeed the interactive timeline tracking urban expansion and landcover change offers a different ethic relation to how land ownership has led to the dramatic curtailment of formerly open space.

The progressive development of the landscape over a decade is difficult to comprehend.  But the streaming of this data into multiple layers, superimposed on each state, counties, and urban areas allows foregrounded layers of the map to jump out at viewers in particularly effective ways.  They help parse  the eleven western states that fills 165,000 square miles of landscape–a change in land cover equal to the construction of parking lots for six million superstores, and at an annual rate of an area almost as great as the footprint of the entire metropolitan area of Los Angeles–and far greater than the footprint of New York City, according to US Census records of the loss of natural lands used by Conservation Science Partners–to create a virtual profile of land conversion in an area that is increasingly fragmented by road, as once roadless areas are exposed to development.  The rapid nature of such anthropogenic change has been to some overshadowed by intensity of drought and of global warming, but distances the land in a terrifyingly definitive way as the region’s open spaces are increasingly segmented by roads and transportation routes.  But it has brought a fragmentation of open landscapes, driven by the expansion of roadways, overdevelopment and competition for limited resources, that have parcellized whatever protected open lands indeed remain.


land conversion


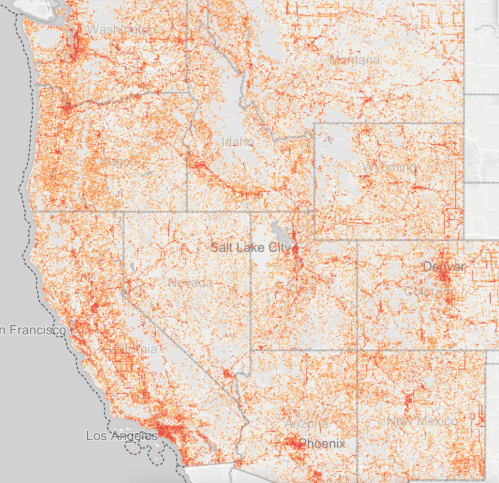
The web maps focus on a uniquely revealing index of the human footprint, rather than cities, or jurisdictional lines, to suggest the extent of how we are re-writing a relation to the land.  They aim to comprehend the loss of land over time a region that is reduced by a football field of uninhabited lands every 2.5 minutes.  The map is an attempt to depict the scale of this vanishing landscape, by a detailed record of the scale of the contraction of open lands that one can zoom to local levels, against which cities and regional names float in ghostly way, as if it describes the changes that underly a simple road map of place-names and individual states.

How can we read this record of disappearing space, save as the emergence of a new set of attitudes to the land?  Its flexibility helps take stock of accelerated changes in ways that we have only begun to take stock collectively; the maps force us to come to terms with the scale of recent “development” of open lands in ways that have been rarely so effectively or dramatically synthesized in one site, and our increased power to comprehend and try to come to terms with the disappearance of an older landscape that was the focus of such romantic attachment,–and the rate of the recession of that imagined past.

The visualization that can be examined over time and in such striking local detail affords a basis for imagining the terrifying scale of anthropogenic change across the west, with all its attendant problems of wildlife conservation.
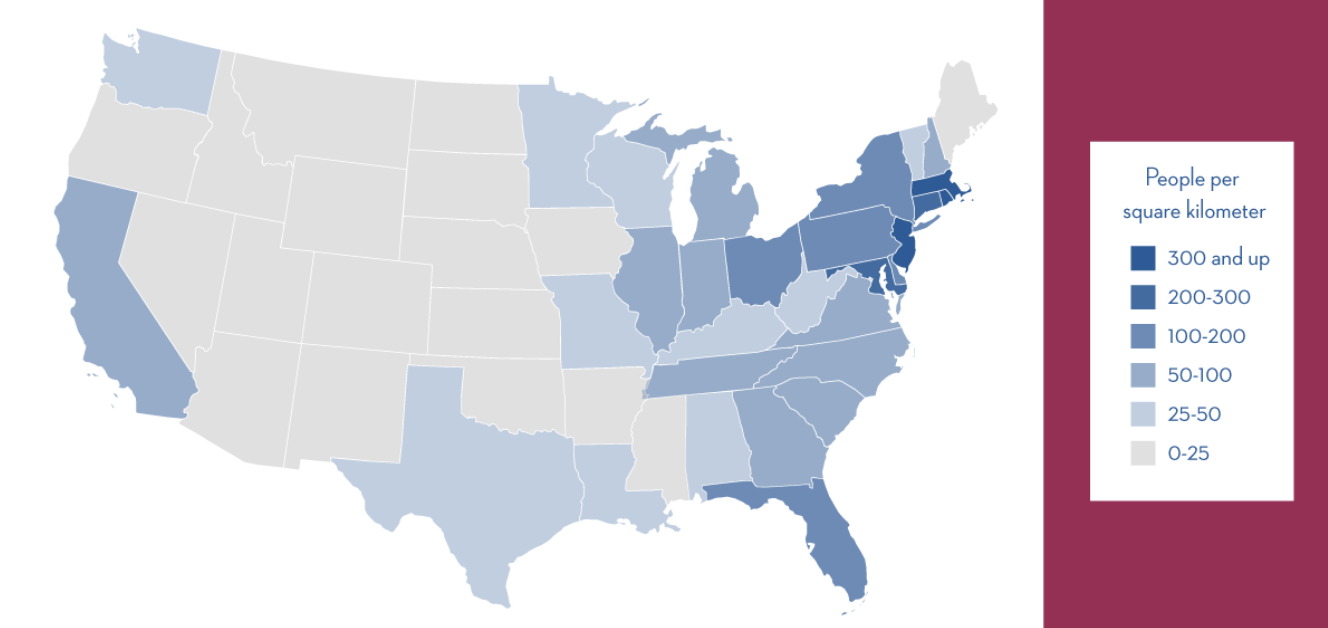
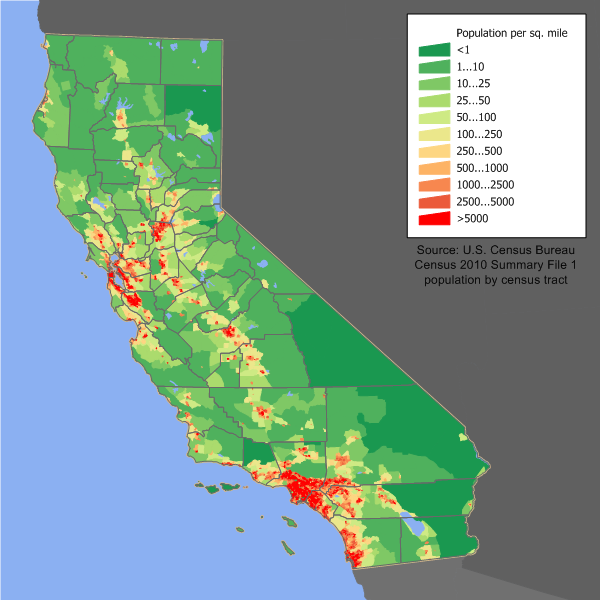
 

Continue reading

2 Comments

Filed under American West, environmental mapping, open lands, open space, wilderness

The Density and Habitability of Urban Space

How to map the compelling question of urban livability?

The journalist, blogger and economist Paul Krugman sought to qualify exactly which pressures drive the costs of urban housing recently in “Conscience of  a Liberal.”   Krugman qualified how population density effects urban housing prices, by noting the importance of mapping density in new ways.  Scarcity of space or land constraints might seem to shape prices from a point of view of supply and demand, but Krugman argued that we can attend to a new urban geography by looking at aggregate rather than standard population density alone:  in response to Noah Smith’s argument population density was less relevant than proximity to economic centers, he argued that the rise in the prices of extra-urban areas across America, and “hiving off” of exurban areas in such cities as Phoenix or Houston, where the relative scarcity of land does not determine prices and population density in cities’ centers can change independently from the prices on its peripheries.  Following  Richard Florida, the mapping of “population-weighted density” of census tracts that can capture the way that Americans tend to be moving toward less densely weighted areas of habitation, even if the population, nation-wide, is rising.  (While population rose 10% in the US 2000-2010, it also spread out across urban areas, which became less densely weighted over time.)

This new picture of the United States that has cultivated a “lifestyle” of a less dense mode of living seems to be based on the increased valorization of “inhabitability” as a metric for home ownership in ways that are for more widespread than the movement to the suburbs in the 1970s:  we are all moving toward less weighted centers of population.  The hiving off of new suburban regions on the map that Krugman describes have not only pumped-up real estate is a reaction, in part, of voting with one’s feet against the over-density of urban space.  To be sure, although New York City property values are high, if we all lived in at the amazing density of New York City, the entire 7 billion inhabitants of the globe could fit into a geographic space similar to Colorado–a state which currently has a low density in much of its expanse, but whose pockets of population density are interestingly clustered close to adjoining regions of medium density.

Colorado_population_map

One thinks of the much-circulated infographic, repopulating the world within the United States at the density of global metropoles, that suggests the exceeding density that urban cities have come to acquire, and the continued density that a city such as New York or Paris holds, in comparison to San Fransisco or Houston:

the-worlds-population-concentrated-small

The variation of cities suggests some reasons for, say, the greater “livability” of certain places, as well as the distinct nature of the urban experience in a broad selection of cities across the world.

So what does this “hiving off”–distinct from suburbanization, as it suggests an exurban experience even outside of cities with relatively low population density, entail?  The 1970s phenomenon of widespread suburbanization, allowed by the creation of major highways and arterials that fed by commutes to urban centers like New York or Los Angeles, which served as an endangering withdrawal from many public schools in cities and urban centers, reacted to the intense pace of urban growth and in-migration.  Rather than based on suburban homes, the hiving off of communities echoed a similar demand for “habitability,” but was now about creating new spaces where exurban communities could be created, and how we could use the concept of aggregate density to measure them.

Krugman offered a more specific updating of James Kunstler’s compelling critique of urban sprawl.  when it was launched in the 1993, Kunstler decried the unwarranted expansion of suburban housing and malls in a manifesto that responded to America of the late 1980s, The Geography of Nowhere, as “the greatest misallocation of resources the world has ever known”–what he called “dead spaces” that he saw as produced by the new attitudes to space that the automobile allowed, stripping vitality from urban centers, and creating the rise of quasi-spaces of strip malls as suburban heterotopia, displaced amusement parks of purchasing, lined with unproductive spaces of parking lots.  This partly architectural perversion of lived space, for Kunstler, led to an evacuation of vitality.  Krugman focusses rather on the place that “habitability” has gained among the economic forces that shape the prices of urban homes:  his argument begs to be mapped, or graphically modeled as well as understood by statistical indices.

Economic thought might be playing catch up with cartographical modeling here:  the critical mapping of density, after all, began right after the 1870 census, when Francis Amasa Walker, superintendent of the census, offered a new model for mapping the population density of the nation not according to county, or electoral districts, but according to the actual contours by which the citizenry inhabited space:  dividing each square mile into its relative density of inhabitants, Walker distinguished those zones with less than 5 inhabitants/sq. mile from those with 5-15, 15-40, 40-75, 75-125, and over 125 inhabitants/sq. mile in 1872, and from that year undertook a number of projects with congressional funding that mapped that distribution against wealth  per capita, to create the first map to record the distribution of wealth in the nation’s geographic space, revealing the dynamics of income distribution along spatial axes–in what Susan Schulten aptly described as the nation’s first example of an infographic.  (Never one to not consider the uses of mapping populations, he created similar maps for the US Congress that mapped population density against disease, illiteracy, public debt, ethnic groups, and the birthrate.)

Desnity of Population [of US]

Such a clear figuration of density does not correspond to actual urban areas, given the former density of rural populations–or have fine enough grain to distinguish property value in them.  But it roughly reflects property values in the nation.  But its generalization of density across each county provides a useful metric to understand variations in the generation of income, tax revenues, and birth rates.  While a model of density-independent population growth may be applicable to animals–plants, insects, mammals, and other seasonally reproducing species, population growth is rarely independent from density in human populations:  and with the increasing segregation of age cohorts in contemporary America–and the graying of some cities, and lower age-level of others, the metrics of growth are especially not uniform.

A more contemporary, but less statistically exacting, version of the infographic–stated in the bluntness of th modern infographic, might provide the following portrait of the relative density of individual states in the union:

sq kilometer

At a finer grain, we find a density map as the following, which provides far more refined detail:

specialreports_2edb.population density usa

And we can zoom in for density of regions, in ways that provide a clearer picture of the Southwestern states in terms of how they broke down by counties, over time, around metropoles:

popanim

To be fair, such a general level of density is not that relevant to the points that Krugman addresses in this specific issue, where he advocates the need for moving away from such generalizations of state-wide population densities, which are less meaningful for microeconomic questions, to examine the organization of the city as a unit in ways that will allow us to distinguish the changing character and economics of urban areas.  Krugman considers how changes in urban geography across the US reflect a new paradigm or model of population density, he asks us to consider new tools to map where ‘average’ Americans live by the “weighted” density of population distributions similar to the sort of maps Walker first innovated, and focus attention on the relative density of different zones not of the nation but individual urban areas.

He argued that overall ‘density’ means less today than ‘aggregate density‘ or the relative density of neighborhoods or sectors of new urban growth, and used this as a dynamic structure to  map population density according to weighted density to better  understand how the “average” American lives.   He does so to offer a critique or assessment of how his fellow-economist Bill McBride suggested attending to population density as they were correlated with housing costs his competing finance blog, Calculated Risk.  Does overall ‘density’ mean less as a measure of housing cost, Krugman wonders, than ‘aggregate density’ (or relative density) within selective regions of cities?

Like Paul Krugman, I would question the meaning of density as an index of value, but I would suggest we need to develop tools to understand the dynamics of density that involve a more fuzzy or less quantifiable variable of habitability, which I would argue if less easily quantifiable becomes more evident in maps.   And in the remainder of this post, I’d like to show how maps offer a measure of the fuzzy value of ‘habitability’ as well as its inverse, a perceptions of ‘uninhabitability,’ might be loosely understood as a way to map the increase or the radical diminishing of property values rather than density alone–or understandings of how density drives demand.

We might  use these maps to include other variables that shape density, and use maps  to do so.  The question of how we can try to map habitability, both in terms of access to open spaces, access to markets, and attractive environments, might create an even better index of value.  In San Francisco, for example, where property rates have risen dramatically in the past several years, and whose neighborhoods are confined to a small area of land:  Oakland is itself much less dense, if also confined by similar topographic limitations, notably the mountains:  but four of the ten most expensive housing markets in the country, including Santa Clara, San Mateo, San Francisco, and Marin, are in the Bay area, according to the recent March 2013 Report of the National Low Income Housing Coalition–and in the state that requires the greatest hourly wage to rent a two-bedroom apartment.

out of reach hourly wage per two bedroom

To be sure, the variations of real estate and population in a state like California are closely tied, given the huge variations of density across the state.

California_population_map

Yet the profound variations in the Bay Area, to take one example that is clotted with a red of high density, indicates profoundly striking differences in desirability:

sanmap1

And such dramatically differing variations across the region seem to be distorted by the demand for living near a not-densely populated area such as Silicon Valley, where real estate prices are suggested in this Kwelia map of 2012 which illustrates the relative geographic distribution according to median incomes–and suggests the very real distortions in real estate that can occur independently of actual or weighted density.

screen shot 2014-01-17 at 9-2.14.13 am.pngKwelia


Whereas the debate between the economists turned around the measure of density, it’s unclear why in an age of complex data visualization Krugman omits variables beyond density or to map determinants of urban spaces.  As an economist is wont, Krugman tends to confine himself to contrasting the relative value of alternative models of housing markets in urban space.  If we accept the model of scarcity as the motor of rapidly escalating real estate prices, it’s hard to explain the rise of attraction to less densely populated urban areas in urban areas, however, or the re-use of less inhabited areas as new areas of density.  If we might assume rising population means rising housing costs, as Smith has since noted in an update to his post, transit policy and presumably other public policy issues related to urban infrastructure can influence or shape housing costs–issues that introduce habitability as much as density as an influence on housing costs.

If we weigh models of density and populated-weighted density as models of urban environments, population-weighted density might help explain the social geography of urban spaces at a time when average American increasingly live in somewhat less dense neighborhood:  during the first decade of the century, population has broadly “spread out within metropolitan areas” and brought a “hiving off” from cities and led many cities to abandon the model of a vital urban core is often associated with  “quality of life.”   But the generic term does not reflect how urban space becomes mapped as habitable to different populations and demographics:  for just as cities are mapped in new ways by public projects of urban infrastructure, people map areas of settlement around the contours of urban space by preferring zones,  in turn attracting further interest in them.  An interesting liberal strain of response to Krugman’s post bemoans the end of Jane Jacob’s model of the city as constituted by local communities and the positive sense she gave density as causes of the community and vibrancy of individual neighborhoods, which she valued as the basis for urban life.  (Many also critiqued his argument as not acknowledging the economic models of different cities, from how the absence of economic vitality thins cities like Detroit to how hi-tech creates a new geography of work.)  But in mapping population-weighted density only in numeric terms, Krugman may ignore the appeal that the neighborhood–as much as geographic location–has on real estate, and the increasing flexibility with which a neighborhood–even of different but overlapping socioeconomic backgrounds among their residents–is redefined in particularly flexible ways.

Less attention is paid in both models  to the constraints by which people map their own living spaces, even when constrained by a city’s complex and often unfair geography.  Parts of urban environments are recast as more habitable based on different criteria, often in response to the made or ‘created’ geography of the city–or fail to be recast in habitable terms.  The growth of desirable land in Los Angeles responds to the constraints with which freeways have sculpted urban space, and indeed in ways bound by the 405 in a sort of deterministic way, and the creation of the former Cypress Freeway shaped–and in cases destroyed communities in Oakland, California.  Vice versa, patterns of urban settlement and housing prices helped the investment in an urban infrastructure as transportation in Boston or New York, because they led populations to map their lives in urban space.

Does density alone shape market prices?  In a sense, yes:  but density is a reflection of deeper indices that one might better term ‘habitability’ given their manifold causes and considerable variations.  Changes in workplace practices and locations encourage a shifting relation to the urban space, as more people work on-line, of course, and live and work in isolated archipelagos around cities:  the vitality of neighborhoods that Jacobs celebrated has become far less important as a unit of economic meaning with increased geographic mobility and more dispersive work environments, including telecommuting. As a result, the framing of a debate between population-weighted density or the availability of “space” as determining land value omits the notions of habitability shape urban space: rising land prices in LA, for example, reflect the shifting attitudes to space created by a system of freeways that shaped land values–rather than scarcity–and defined a map of urban settlement outside corridors of transport that, more than mountains, shape Los Angeles neighborhoods.

This reflects the desire for a way to maps how areas become understood as habitable:  and in Oakland, where property values have risen not only in response to the rising rents in SF, but as the city has been defining new notions of habitability by restaurants, urban gardens, and public spaces like farmers’ markets.  By trying to identify a model for urban settlement, geography of population density becomes a stick of measurement rather than the remaking of urban spaces:  multiple complex constraints on the habitability of urban environments limit the development of urban land values.  In  the recent recouping of housing prices in the Bay Area, for example, areas of recent price increases were mapped based on data from Zillow.com–and metadata from Google Maps–to find a considerable recuperation of costs in San Francisco and Fremont alike, despite their quite different density, and a mild recuperation in many of the low-density areas of Berkeley and Oakland, as is rendered evident in the regions of light rose coloration below.


Bay Area Property Map

Conversely, if much of Richmond, Brentwood, Antioch, Union City and Hayward remain selling at a far lower price than in the prior boom, many Oakland properties sell at a brisk price, and hi-tech areas like Mountain View–and some areas near Walnut Creek–are positively booming.  To some extent this has to do with access to economic centers:  the less populated but also less desired and more removed Daly City is nowhere near recovering its boom prices, while Mountain View has surpassed boom prices.  But the widespread recovery speaks to issues of habitability, as much as density.

As a counterfactual, let’s look at some actual urban environments where the question of habitability responded to a striking lack of investment in creating a habitable urban space with adequate infrastructure or access to green space–one crucial measure of habitability.  Consider, for example, the considerable distances at which less valuable property lie from green spaces or urban parks in Los Angeles, creating an endemic that led the “LA Streets” Blog Santa to bring the city more green spaces last Christmas.  (African American neighborhoods enjoy .8 acres per thousand people, in contrast to the recommended 10 acres per thousand inhabitants, or the median 6.8 in high density American cities.)  Pink regions here map a distance from park exceeding the LA average, most of which are concentrated away from the shoreline or surrounding national forest:

Access to Parks in Los Angeles


The value of land responds to how we map urban spaces as habitable often shapes property values, as much as the questions of the availability of space. Something like the new Stamen map that focusses on the readability of mapped space by watercolor tiles, pioneered by Zach Watson, provides a new resource to look at urban space to analyze questions of habitability without being distracted by data overload, in what was intended as a visually simpler and pleasurable alternative to the tedium of Google Maps, provides a manner to differentiate neighborhoods in San Francisco–albeit a region whose high real estate prices don’t need much explaining:


SF Greenspace Stamen


Krugman provoked an interesting comment that advances in GIS could provide new tools to include aggregate densities in urban spaces.  Indeed, working with the above Stamen map, or with a time-lapse model of aggregation might provide tools to show the shifts in how space became ‘habitable’ or worthy of inhabitation.  These tools offer the ability to map a new geography of work:  one could model of the shifts in economic redistribution of wealth in urban space, or relative distance of residents to workspace, that might map the relation of neighborhoods to space beyond their relative income or real estate costs.

Flexible GIS models might also help reveal the different maps people create within a city as an environment in powerful ways.  In juxtaposing the alternatives between two models of urban life–the metric of population growth, which  creates competition for limited resources of land in a somewhat Malthusian fashion, or population density, or urban settlement informed by how agglomerations understood in terms of population-weighted density shape demand in extra-urban spaces or urban peripheries for land that changes land prices–the mutable map of the urban fabric is either dramatically oversimplified or ignored.   When land is constrained, the first train of thought goes, rising populations increase the price of land faster than inflation; the questions of how people map land as habitable–and desirable–more informs the second proposition, pointing to the rise of “edge-cities” on extra-urban space that become desired centers of population.

That choice between population and weighted density seems a bit artificial,  because both are abstracted from how people make concepts of neighborhoods out of open space–by mapping it as their own, or by not being able to do so.  Today, New York has of course become the model of a high “population-weighted density” city, based on the average land density of its inhabitants, or the relative density of its populated areas.   But whereas in the 1970s suburbia gained value in the 1970s around greater New York, leading them to abandon a city that became defined as less “habitable,” and to define preserves away from commercial activity, we now value habitability as a relation to a neighborhood, or something like one.

The remapping of the urban core as economically vital paralleled a shift in the understanding of its “inhabitability”– mapping not only its density, but what makes it conducive to habitation or less appealing as a living space.  Could we map the shifts in aggregate population density to investigate patterns of land value, to examine the rise of prices in New York and in regions of uneven density of population spread out within large cities?  One point here would be to chart the spaces made and created in individual cities over time that informed property prices by creating new models of the habitability of the same spaces and of urban life.   To do so, I’ll use maps to illuminate shifting attitudes to space.

Before considering urban geographies, it’s interesting to map a distribution of the predominance of bars to grocery stores in a cute map that I can’t resist–with surprising concentration, the number of bars exceeded grocery stores in urban areas clustered in the Midwest and parts of New England, and areas of the plain states and spots of the Southwest.  It would be interesting to pursue this map into urban areas–does the prevalence of bars over grocery stores suggest a greater role in serving neighborhoods, or a preference for the social function that bars serve in specific urban or rural regions?

Grocery Stores v. Bars

The map may tell us about a culture of sociability–in the colder midwestern north, and New England, bars are important sites of aggregation.  The map speaks about how folks create habitability in urban space in response to different constraints.  We can use this model, more importantly, and this will be the end of the post, to expand the criteria by which we look at urban spaces beyond density that can help raise new questions about the relationships between property value and urban milieu.

Others might reveal the increased livability of different spaces within the city, as this map of the green spaces in New York City, perhaps the city that possesses the densest urban core, in ways that map urban resettlement outside the region of its greatest densities by the foundation of community gardens and urban agriculture, discussed in an earlier post, which notes those places that accept volunteers by blue dots:


Community Gardens NYC region


The map reveals not only an expanding urban green-space, but the re-envisioning of densely occupied areas as of more livable urban spaces, in ways that mapping population density or aggregate density alone don’t suggest.

Still other maps of urban environments reveal the constraints on the very maps we make of urban space that are so central to housing prices–a process perhaps missing from Krugman’s discussion of two attitudes to the analysis of land-value.    Maps are a central tools of real estate to attract attention to  property and shape urban space into neighborhoods, and fit notions of habitability into existing spaces.  Many structures define these spaces of habitability, not necessarily understood in terms of weighted density alone.  Los Angeles is not, as Krugman’s piece suggests,  “hemmed in” by mountains that constrain city’s sprawl; its low density seems to run out to the Valleys, as freeways define the urban space and create  anew map of property values and more habitable and valuable land.  It almost seems land properties rise in their remove from the freeway, where the relation of land to freeway is more easily mapped, much as much of the value of land in Santa Monica seems to recede in value from the Pacific. Freeways or overpasses divide urban space and help structure maps of habitability; freeways of easy commute may, conversely, increase the value of hived off aggregations of “edge” cities, by improving connectedness to other environments.

We can map moreover habitability in different ways.  Cities like Oakland CA offer a sort of counter-example of a space where habitability set off a rapid rise of real estate values and the price of land:  there is no clear confine to urban space, but the spread of restaurants, green spaces, farmers’ markets, urban farms, and open public spaces fashioned a new notion of the inhabitability of distinct areas of its urban space in successive districts, earlier shunned, even when considerable crime continues to plague nearby parts of the city and the city hears the screaming sirens of police racing to the victim or scene of a homicide.  (If some would say real estate prices derive from the flight from the property values of San Francisco, that only seems to be the icing on the cake.)

The value of land is not a simple calculus of limited supply, but of the mapping of urban space–first taken up by real estate agents who sculpted Oakland’s neighborhoods, but informed first by a shifting sense of the habitability of the land, whether in the middle of an old port-city or the more trendy area of the Temescal.  Demographics prefer different models of habitability; the age of the population of Oakland seems exceptionally low, for example, as they might first define the city as more habitable.  The shift of populations toward less densely settled urban areas reflects this shift in how we have come to map habitability, one might say, even if aggregates of population density reflect land value; without numerical data to show for it, I  offer that the value of land reflects the relative scarcity of habitable areas in urban space, but also shifts as notions of habitability emerge.  In New York, the premium on habitability drives the growth of new neighborhoods, from the allure of Soho or the East Village to Brooklyn Heights as more habitable than more crowded urban environments.  Imaginative ways to map public spaces create habitability in urban regions; the lack of parks in Los Angeles fuels a somewhat undifferentiated urban expansion and settlement.

But there are huge obstacles to mapping the habitability of space in the very regions and cities that habitability might be encouraged, as we find habitability to become, in much of California, the preserve of the wealthier few, and urban spaces constrained by barriers to their physical improvement.  Take a simple map of the distribution of parks in the state, and reveals radical differences between the parks/inhabitants: the polemic map ties park-poor areas to income, contrasting darker greens to show greater availability of acreage/thousand inhabitants in the San Francisco than Los Angeles areas:


map-save-state-parks-for-all-Park-Income-Poor3-790x1023


Income variations allow the possibility of a flexible and inventive relation to maps of habitable space–as the clumping together in aggregates or scarcity of desired urban lands reveals.   As we become more movable in our work, and develop a more flexible notion to workspace, this shifts the relations of local routines of personal and work space, and there is considerable choice about the spaces where we live:  workspace is less dense in different cities, to be sure, as silicon valley or other IT belts like the Research Triangle around Durham NC, but the premium on the flexibility of defining one’s own model of habitability seems to determine the new urban geography Krugman describes.  Further anecdotal evidence, beyond the United States but in North America, might point to the shifting geography in urban Ottawa, where the residential Glebe was distinguished by rising residential real estate.   Within the shifting infrastructural map of the city, one maps one’s own personal space.  Indeed, the bizarre settling of San Francisco’s sky-rocketing real estate prices is partly driven by the arrival of highly paid executives working in Silicon Valley, shuttled to their work in select buses whose routes allow them to select an alternative to public transit, as discussed in an earlier post.  The paths of flights into San Diego, to use another example, skirt more select residential areas like Mission Bay, create a zone marred by the rumble and whine of overhead airplanes.  And the organization of urban space no longer reflects how we map and understand urban geographies as habitable–or come to dismiss them as simply uninhabitable and worth less.

Only by balancing what maps tell us about how an urban region gains value for its habitability can we effectively broaden the discussion and use maps to measure inhabitability against degrees of uninhabitability and will we be able to extend the critical evaluation of value beyond questions of supply and demand.

Leave a comment

Filed under human geography, infographic, mapping density, Mapping Park Poor Neighborhoods, Oakland CA, relative density, urban geography, urban growth, Urban Livability