
6. We now map and recognize, it is true, the huge historical loss of wetlands around the Bay in a quite different way, as a loss of wetlands, and dying of lad, erasing the many tidal marshlands, intertidal flats, lakes and delicate riverine network that once defined the region and delta:

In contrast, the 1959 project proposed pushing the East Bay freeways almost toward Treasure Island, filling the Marina and remaining wetlands from Point Isabel to Emeryville, dramatically reducing tidal marshes and ponds in the Bay, some 40% of whose surface area had been diked off or filled in since 1851.
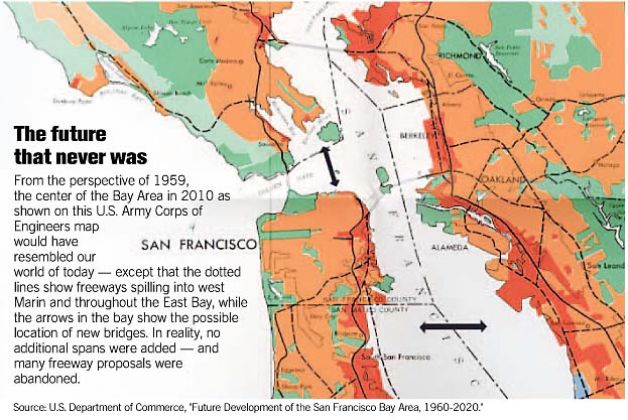
The basic idea later championed by the engineer John Reber was to push the East Bay out three miles past I-80, so that save for a small Marina between University and Cedar Avenues, further land would be available for housing and industry in what was billed as a “City Manager’s Dream.” From the Berkeley hills, Sylvia McLaughlin, Catherine (Kay) Kerr–Clark’s wife–and Esther Gulick, all UC faculty wives, understood the situation as a desecration of their views, and of the beauty of the sunsets and the topography of the place they had come to love, but reframed the debate. For if the Bay is hardly separable from the Bay Area today, the Bay was a defining part of the region, and far more than a backdrop for setting suns.
The strong commitment each of these women showed in a protracted fight for the bay was encapsulated in a sense in the map that they adopted to advance their cause, and was adopted from the newspaper as a cri de coeur to advance not only the preservation of the bay, but support the region that they loved in a truly topophilic fashion. The map of the construction of Reber’s project provided a sense of a fork in the road for the region’s future, but a crossroads for its future. The architectural plan served as an alternative for the preservation of the waters’ status quo. And once reprinted as a rallying point, the map of the bay offered a basis to attract supporters to solicit donations to oppose the projected landfill: thee image captured enough attention that by 1962 they attracted over 2,500 to preserve what has remained a glorious estuary of open waters, and which would be otherwise be consigned to the dustbin of history.
Appropriated to advance an early environmental cause, the now-iconic map designed to demonstrate the future expansion of the Bay became the emblem of its preservation: although the expansion of the shorelines of San Francisco and other regions of the East Bay had been an emblem of progress, the legislature was lobbied from 1962 to resist landfill projects through this future image of progress, led by U.C. Berkeley city and regional planner Mel Scott’s expert report about the adverse local effects of landfill on the estuary–by distributing this very image to their constituency, co-signers were overwhelmingly ttracted to preserve the San Francisco Bay, as its drastic contraction would have smoothed its edges so drastically to become an extension of an already over-engineered Sacramento.
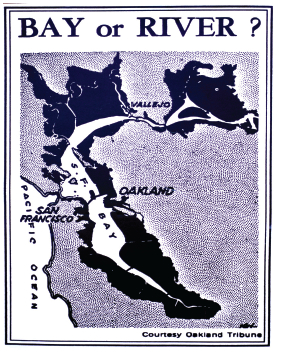
Posing the simple question “Bay or River?” so effectively posed an alternative future that it was an effective symbolic tool for organizing tool for mobilizing public opinion. The interrogative added to the map, it became an emblem of resistance to the epidemic of landfill that had expanded in the east coast; the result was to end a century of adding fill to the bay during whose open water and wetlands had been so strongly compromised to diminish from over 780 square miles to less than 575 square miles in the region from the Golden Gate to the Sacramento-San Joaquin River Delta. (The area of the Bay has increased by over ten square miles since then, suggesting how much easier it indeed was to shrink the open waters of the Bay than to expand them.). Although the region is built densely to its shoreline–witness a recent map of building footprints–

–the radical rethinking of the San Francisco Bay’s open water has provided a brake on the projects of bay fill projected in 1959 to be completed by 2020.
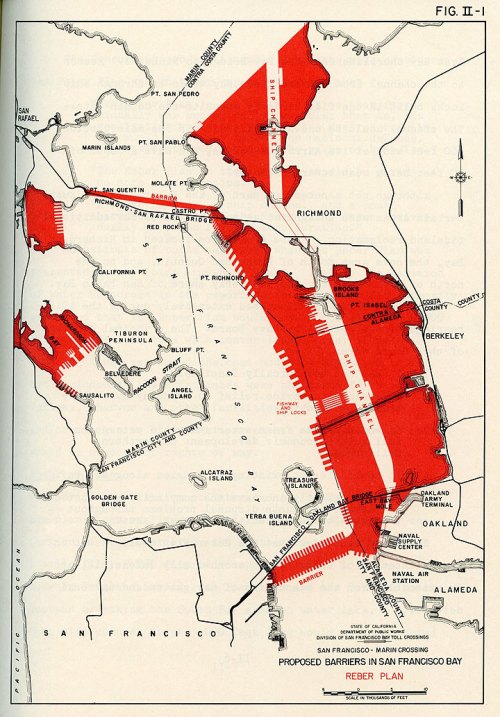
7. The original map to increase the amount of landfill in the Bay and estuary had been designed by the US Army Corps. The re-use of made of Reber’s map is perhaps a classic glass-half-empty vs. glass-half-full affair: yet rarely has such a simple map been so wildly successful once appropriated and adopted by an opposition in order to express an alternate future or to resist a project of engineering.
The two-fold career of this map (or image) might be compared to a famously over-theorized example of image-reading, Gombrich’s duck-rabbit, which he used to illustrate the education of the senses on which artists are able to convince their audiences of their skills of illusion, and on which he suggested all abilities of successful pictorial illusion rest. The visual schema an artist develops to create this illusion allowed them to suggest a reality to viewers, he argued, which he continued to modify and refine in his or her work. The duck-rabbit revealed compellingly how viewers gave fixed meaning to images as records of things we created from what they suggested to our mind:

Earlier, Wittgenstein had used the same image to identify how we read but an aspect of any image to consider how we are “likely to see a visual appearance as something” as we form our knowledge of images, which we recognize as a type or order of representation.
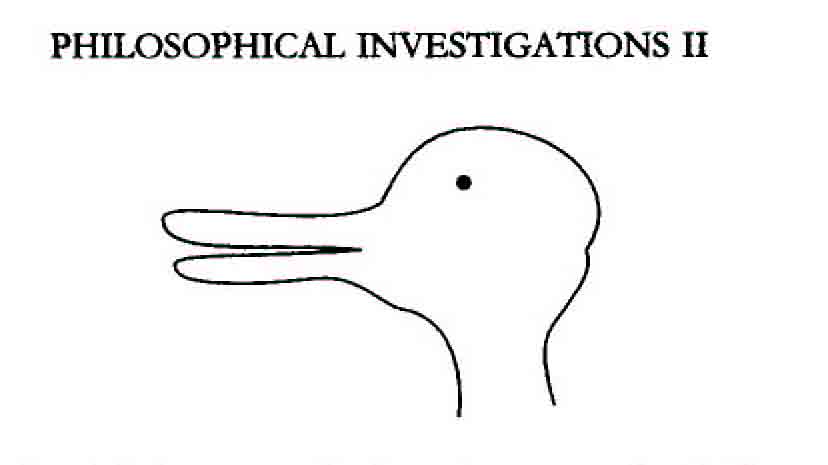
Gombrich does not examine the notion of “seeing as,” as Wittgenstein, but framed the question of “seeing as” to questions of aesthetic judgment, arguing that we apply schema to appreciate images. (The original source of the cartoon is however a subject of debate: it was first employed by the American psychologist Stephen Jastrow in 1899 in order to make a point about the nature of mental perception, but the image he used from an 1892 issue of Harpers’ Review, where it gained a second life–

–but which itself derived from an engraved cartoon printed earlier that year in Munich, which both Wittgenstein and Gombrich could probably have seen:

The odd family resemblance of Duck-Rabbits has its own interesting geneology in American perceptual psychology. Jastrow, the first American awarded a PhD in psychology, employed this image from the funnies in his studies of “subliminal” perception, and the same later provided Gombrich to lead readers to consider the role of ambiguity and illusion in aesthetic judgment. The Duck-Rabbit illustrated impossibility of holding both schemas of recognition before an image at the same time, for Gombrich, and about the role of likeness in art. Gombrich sustained that we used schema and corrected them at the same time in relation to reality, redrawing them to systematically create better illusions in images. To explain the huge appeal of the map of the army engineers, we might do better to lean on Wittgenstein’s sense of the category of representation, and begin by asking about the power that image enjoyed as a map–a map of what the San Francisco Bay would become once it became but a glorified estuary traversed at its widest point by the Bay Bridge. The map, as a map, provided a model of what it would be like to move around the Bay Area, and what the experience of one’s itineraries and sense of space would potentially be.
8. The power of the map “Bay or River?” lay in the fact that it was not an illusion, however, but presented a stark alternative of remapping a well-known land: viewers were asked what future they would prefer, and if the engineers should, this time, be allowed to redraw the area of the bay’s already shrinking coastline, or if they should be resisted and a line in the sand be drawn.
The question of whether the Bay might be reduced to the straight lines of landfill that erased any variations in a stunning shoreline, and became immediately recognized as an evil that must be resisted and prevented from occurring, providing something like a logic of collective action before San Francisco was seen as a site of popular resistance or alternative culture; it provided, moreover, something of a start of an ecological movement, just before and at roughly the same time Rachel Carson, a former Fish & Wildlife employee, published Silent Spring (1962), although the book stemmed from a four-year study on the effects of the pesticide on birds by chemicals intended to eradicate mosquitoes or fire ants. The parallels of Carson’s investigations to the refusal of McLaughlin and friends to accept the modernization of the Bay is striking. Perhaps McLaughlin invested the image special meaning as she selected it for the campaign: she seems to adopted it as an icon particularly useful to present a set of alternatives to residents of the region, viewing it as an alternative that must not be. And much as Silent Spring accused the chemical industry of deeply nefarious disinformation in spreading a story of purported progress to the nation–and leading the entomologist J. Gordon Edwards to try to refute her charges of the dangers of he chemical compound DDT by eating it on camera–the reworking of the natural environment of the San Francisco Bay became a lightning point of resistance.
The map staged a winning and compelling argument, as the force of the future prognostication of the Army corps of Engineers became a spectre of the disaster for the environment or shorebirds, and on quality of life. This aspect of the map in particular–the sinister encroaching black of the coast that threatens to become a mere riverbank–underscored the change of an entire environment, if not an ecosystem, that would redefine not only the view from the Berkeley Hills, but the perception of the Delta, of sailing through the bay, or even of traveling on a bridge to San Francisco. The dramatic reduction of open waters left a reduced bay whose natural topography was now reduced to a straight coast. It is not surprising that it became an early emblem for environmental activism, and a powerful trigger of mobilization because the notion of building an industrial area or housing area over the Marina was such a radical challenge to one’s orientation to space. The duck-rabbit image is most easily read if it is identified by a text, and the barbed challenge of the sharply worded interrogative, “Bay or River?“, transforms the engineering project into a question to which the viewer reflexively responds.
The power of this map prevented a change that would have made the Bay unrecognizable, with plans existing to use earth from the bulldozed San Bruno mountain to fill bay shoreline from San Francisco International Airport to San Jose, expand airport runways into the Bay, as well as to fill the marshy Emeryville Crescent. Although some 900 acres of tidal marsh were filled in, preserving wildlife habitats is neat to link to the power of this simple newspaper map and the convictions that it both invited and so powerfully helped mobilize about a region whose wetlands were so central to the geography of migrating shorebirds, micro-organisms, and fish.
The stark absence of local details of the shoreline in the newspaper map suggested both the pressing nature of the question as a matter of recent news, and invited associations of a coastline and waterway that local residents deeply appreciated and knew around the Bay, including the Carquinez Strait, Solano coastline, Delta, as well as numerous rocky islands including Angel Island itself. Mapping the possible encroaching enclosure of open waters was powerful as a reclassification of the area marked as the “Bay” as but a river, shifted the mental landscape of the map in ways that spread resolve within the Save-the-Bay movement that helped to generate the Ecology Movement, and helped to identify San Francisco at its head.
 Britton and Rey, “Map of San Francisco, Compiled from the Latest Surveys . . . ” (1852) Courtesy the David Rumsey Map Collection


The first accurate cartographic depiction of San Francisco Bay was the chart executed by Frederick W. Beechey, who surveyed it’s waters in 1827 and ’28. It was published by the British Admiralty office in March,1833. All other charts and maps of this body of water were very distorted affairs prior to the Beechey map.