
How to map the compelling question of urban livability?
The journalist, blogger and economist Paul Krugman sought to qualify exactly which pressures drive the costs of urban housing recently in “Conscience of a Liberal.” Krugman qualified how population density effects urban housing prices, by noting the importance of mapping density in new ways. Scarcity of space or land constraints might seem to shape prices from a point of view of supply and demand, but Krugman argued that we can attend to a new urban geography by looking at aggregate rather than standard population density alone: in response to Noah Smith’s argument population density was less relevant than proximity to economic centers, he argued that the rise in the prices of extra-urban areas across America, and “hiving off” of exurban areas in such cities as Phoenix or Houston, where the relative scarcity of land does not determine prices and population density in cities’ centers can change independently from the prices on its peripheries. Following Richard Florida, the mapping of “population-weighted density” of census tracts that can capture the way that Americans tend to be moving toward less densely weighted areas of habitation, even if the population, nation-wide, is rising. (While population rose 10% in the US 2000-2010, it also spread out across urban areas, which became less densely weighted over time.)
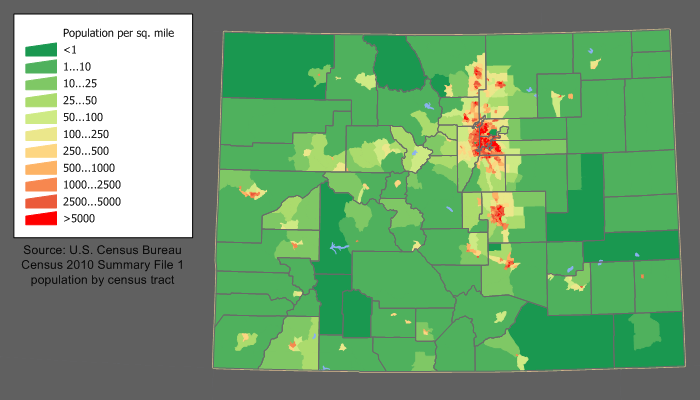
This new picture of the United States that has cultivated a “lifestyle” of a less dense mode of living seems to be based on the increased valorization of “inhabitability” as a metric for home ownership in ways that are for more widespread than the movement to the suburbs in the 1970s: we are all moving toward less weighted centers of population. The hiving off of new suburban regions on the map that Krugman describes have not only pumped-up real estate is a reaction, in part, of voting with one’s feet against the over-density of urban space. To be sure, although New York City property values are high, if we all lived in at the amazing density of New York City, the entire 7 billion inhabitants of the globe could fit into a geographic space similar to Colorado–a state which currently has a low density in much of its expanse, but whose pockets of population density are interestingly clustered close to adjoining regions of medium density.
One thinks of the much-circulated infographic, repopulating the world within the United States at the density of global metropoles, that suggests the exceeding density that urban cities have come to acquire, and the continued density that a city such as New York or Paris holds, in comparison to San Fransisco or Houston:
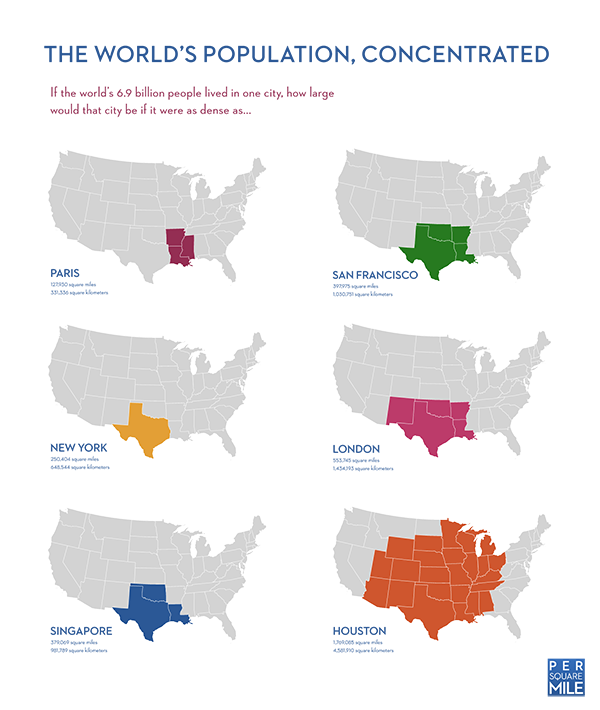
The variation of cities suggests some reasons for, say, the greater “livability” of certain places, as well as the distinct nature of the urban experience in a broad selection of cities across the world.
So what does this “hiving off”–distinct from suburbanization, as it suggests an exurban experience even outside of cities with relatively low population density, entail? The 1970s phenomenon of widespread suburbanization, allowed by the creation of major highways and arterials that fed by commutes to urban centers like New York or Los Angeles, which served as an endangering withdrawal from many public schools in cities and urban centers, reacted to the intense pace of urban growth and in-migration. Rather than based on suburban homes, the hiving off of communities echoed a similar demand for “habitability,” but was now about creating new spaces where exurban communities could be created, and how we could use the concept of aggregate density to measure them.
Krugman offered a more specific updating of James Kunstler’s compelling critique of urban sprawl. when it was launched in the 1993, Kunstler decried the unwarranted expansion of suburban housing and malls in a manifesto that responded to America of the late 1980s, The Geography of Nowhere, as “the greatest misallocation of resources the world has ever known”–what he called “dead spaces” that he saw as produced by the new attitudes to space that the automobile allowed, stripping vitality from urban centers, and creating the rise of quasi-spaces of strip malls as suburban heterotopia, displaced amusement parks of purchasing, lined with unproductive spaces of parking lots. This partly architectural perversion of lived space, for Kunstler, led to an evacuation of vitality. Krugman focusses rather on the place that “habitability” has gained among the economic forces that shape the prices of urban homes: his argument begs to be mapped, or graphically modeled as well as understood by statistical indices.
Economic thought might be playing catch up with cartographical modeling here: the critical mapping of density, after all, began right after the 1870 census, when Francis Amasa Walker, superintendent of the census, offered a new model for mapping the population density of the nation not according to county, or electoral districts, but according to the actual contours by which the citizenry inhabited space: dividing each square mile into its relative density of inhabitants, Walker distinguished those zones with less than 5 inhabitants/sq. mile from those with 5-15, 15-40, 40-75, 75-125, and over 125 inhabitants/sq. mile in 1872, and from that year undertook a number of projects with congressional funding that mapped that distribution against wealth per capita, to create the first map to record the distribution of wealth in the nation’s geographic space, revealing the dynamics of income distribution along spatial axes–in what Susan Schulten aptly described as the nation’s first example of an infographic. (Never one to not consider the uses of mapping populations, he created similar maps for the US Congress that mapped population density against disease, illiteracy, public debt, ethnic groups, and the birthrate.)
![Desnity of Population [of US]](https://dabrownstein.com/wp-content/uploads/2013/04/desnity-of-population-of-us.jpg)
Such a clear figuration of density does not correspond to actual urban areas, given the former density of rural populations–or have fine enough grain to distinguish property value in them. But it roughly reflects property values in the nation. But its generalization of density across each county provides a useful metric to understand variations in the generation of income, tax revenues, and birth rates. While a model of density-independent population growth may be applicable to animals–plants, insects, mammals, and other seasonally reproducing species, population growth is rarely independent from density in human populations: and with the increasing segregation of age cohorts in contemporary America–and the graying of some cities, and lower age-level of others, the metrics of growth are especially not uniform.
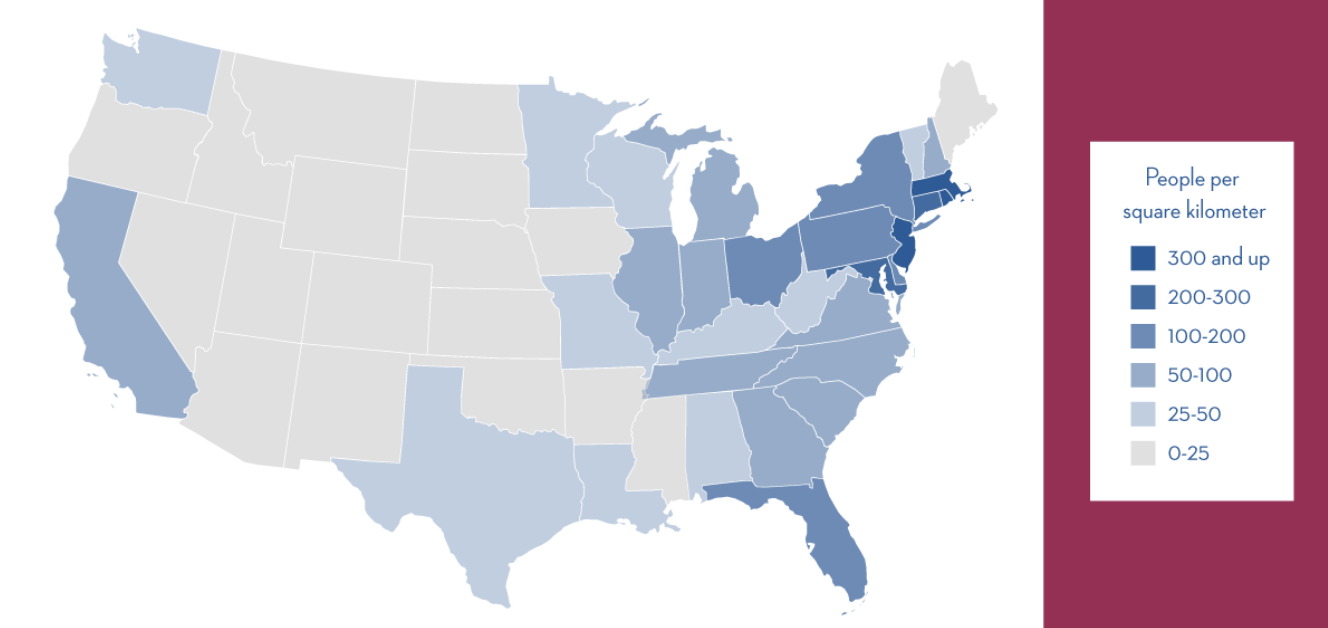
A more contemporary, but less statistically exacting, version of the infographic–stated in the bluntness of th modern infographic, might provide the following portrait of the relative density of individual states in the union:
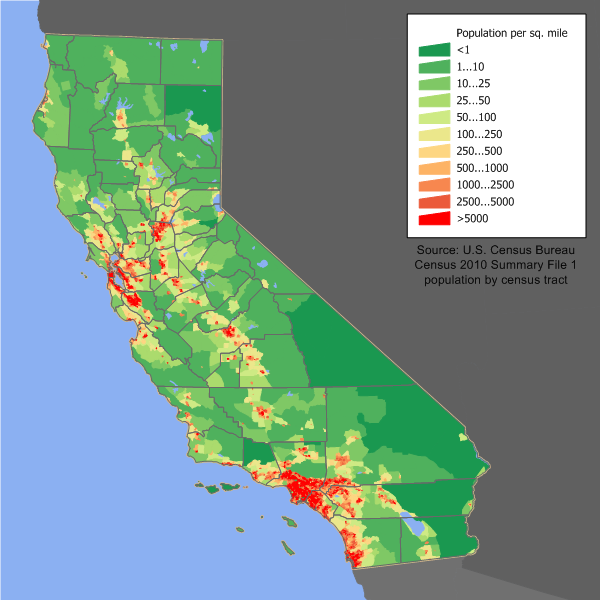
At a finer grain, we find a density map as the following, which provides far more refined detail:
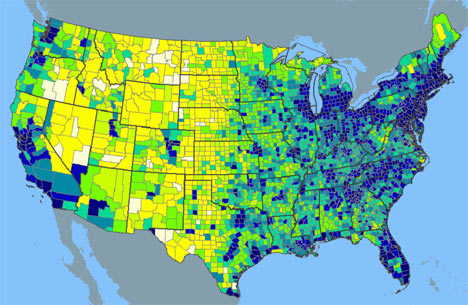
And we can zoom in for density of regions, in ways that provide a clearer picture of the Southwestern states in terms of how they broke down by counties, over time, around metropoles:
To be fair, such a general level of density is not that relevant to the points that Krugman addresses in this specific issue, where he advocates the need for moving away from such generalizations of state-wide population densities, which are less meaningful for microeconomic questions, to examine the organization of the city as a unit in ways that will allow us to distinguish the changing character and economics of urban areas. Krugman considers how changes in urban geography across the US reflect a new paradigm or model of population density, he asks us to consider new tools to map where ‘average’ Americans live by the “weighted” density of population distributions similar to the sort of maps Walker first innovated, and focus attention on the relative density of different zones not of the nation but individual urban areas.
He argued that overall ‘density’ means less today than ‘aggregate density‘ or the relative density of neighborhoods or sectors of new urban growth, and used this as a dynamic structure to map population density according to weighted density to better understand how the “average” American lives. He does so to offer a critique or assessment of how his fellow-economist Bill McBride suggested attending to population density as they were correlated with housing costs his competing finance blog, Calculated Risk. Does overall ‘density’ mean less as a measure of housing cost, Krugman wonders, than ‘aggregate density’ (or relative density) within selective regions of cities?
Like Paul Krugman, I would question the meaning of density as an index of value, but I would suggest we need to develop tools to understand the dynamics of density that involve a more fuzzy or less quantifiable variable of habitability, which I would argue if less easily quantifiable becomes more evident in maps. And in the remainder of this post, I’d like to show how maps offer a measure of the fuzzy value of ‘habitability’ as well as its inverse, a perceptions of ‘uninhabitability,’ might be loosely understood as a way to map the increase or the radical diminishing of property values rather than density alone–or understandings of how density drives demand.
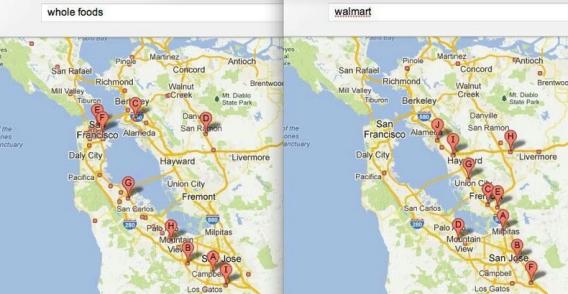
We might use these maps to include other variables that shape density, and use maps to do so. The question of how we can try to map habitability, both in terms of access to open spaces, access to markets, and attractive environments, might create an even better index of value. In San Francisco, for example, where property rates have risen dramatically in the past several years, and whose neighborhoods are confined to a small area of land: Oakland is itself much less dense, if also confined by similar topographic limitations, notably the mountains: but four of the ten most expensive housing markets in the country, including Santa Clara, San Mateo, San Francisco, and Marin, are in the Bay area, according to the recent March 2013 Report of the National Low Income Housing Coalition–and in the state that requires the greatest hourly wage to rent a two-bedroom apartment.
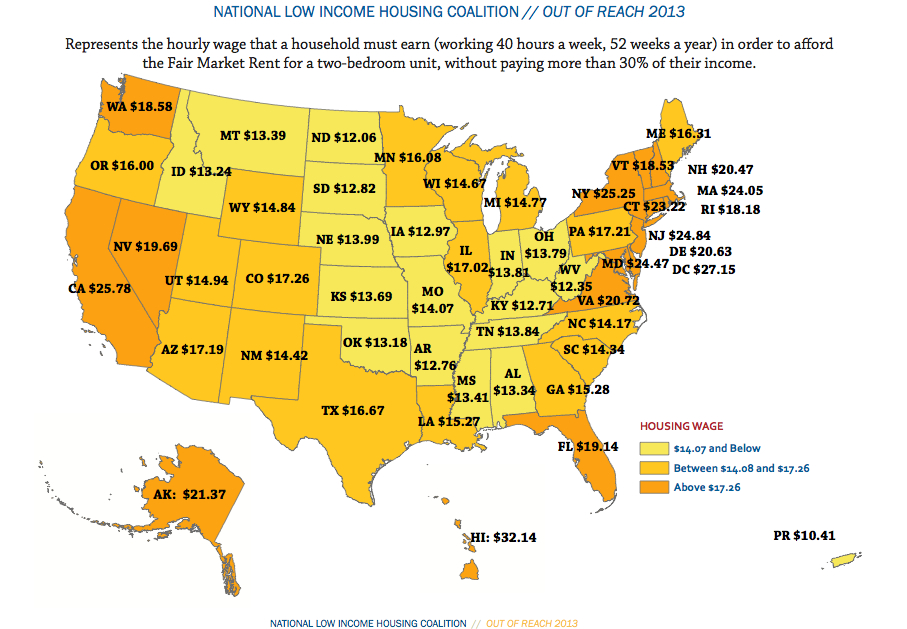
To be sure, the variations of real estate and population in a state like California are closely tied, given the huge variations of density across the state.
Yet the profound variations in the Bay Area, to take one example that is clotted with a red of high density, indicates profoundly striking differences in desirability:
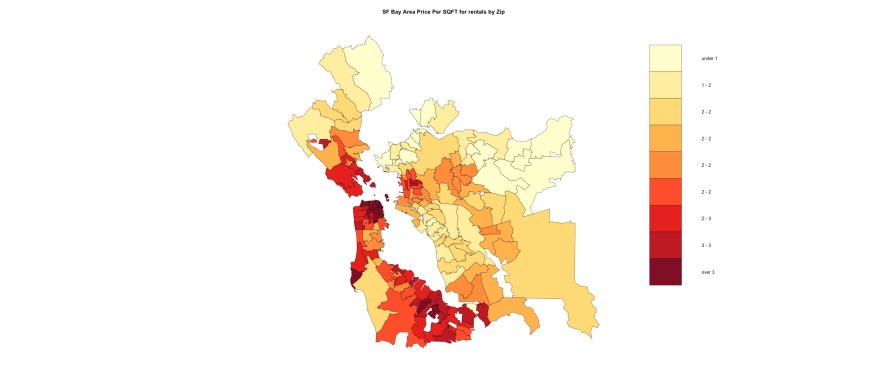
And such dramatically differing variations across the region seem to be distorted by the demand for living near a not-densely populated area such as Silicon Valley, where real estate prices are suggested in this Kwelia map of 2012 which illustrates the relative geographic distribution according to median incomes–and suggests the very real distortions in real estate that can occur independently of actual or weighted density.
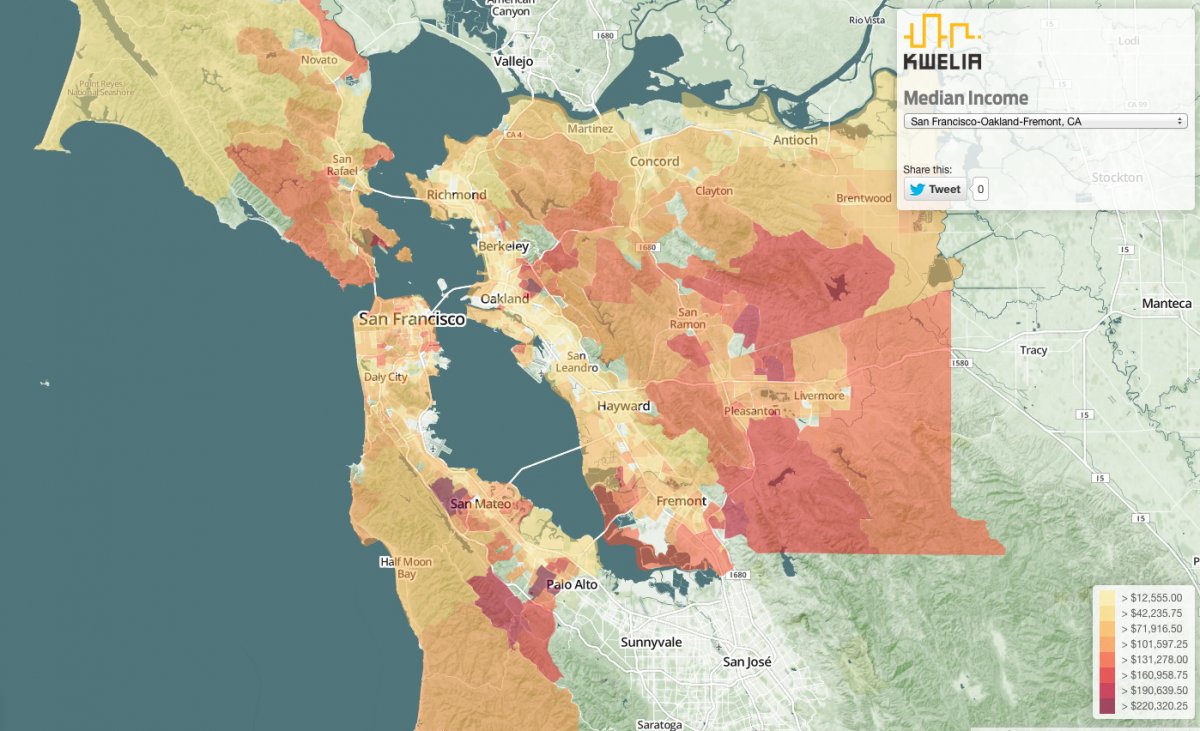 Kwelia
Whereas the debate between the economists turned around the measure of density, it’s unclear why in an age of complex data visualization Krugman omits variables beyond density or to map determinants of urban spaces. As an economist is wont, Krugman tends to confine himself to contrasting the relative value of alternative models of housing markets in urban space. If we accept the model of scarcity as the motor of rapidly escalating real estate prices, it’s hard to explain the rise of attraction to less densely populated urban areas in urban areas, however, or the re-use of less inhabited areas as new areas of density. If we might assume rising population means rising housing costs, as Smith has since noted in an update to his post, transit policy and presumably other public policy issues related to urban infrastructure can influence or shape housing costs–issues that introduce habitability as much as density as an influence on housing costs.
If we weigh models of density and populated-weighted density as models of urban environments, population-weighted density might help explain the social geography of urban spaces at a time when average American increasingly live in somewhat less dense neighborhood: during the first decade of the century, population has broadly “spread out within metropolitan areas” and brought a “hiving off” from cities and led many cities to abandon the model of a vital urban core is often associated with “quality of life.” But the generic term does not reflect how urban space becomes mapped as habitable to different populations and demographics: for just as cities are mapped in new ways by public projects of urban infrastructure, people map areas of settlement around the contours of urban space by preferring zones, in turn attracting further interest in them. An interesting liberal strain of response to Krugman’s post bemoans the end of Jane Jacob’s model of the city as constituted by local communities and the positive sense she gave density as causes of the community and vibrancy of individual neighborhoods, which she valued as the basis for urban life. (Many also critiqued his argument as not acknowledging the economic models of different cities, from how the absence of economic vitality thins cities like Detroit to how hi-tech creates a new geography of work.) But in mapping population-weighted density only in numeric terms, Krugman may ignore the appeal that the neighborhood–as much as geographic location–has on real estate, and the increasing flexibility with which a neighborhood–even of different but overlapping socioeconomic backgrounds among their residents–is redefined in particularly flexible ways.
Less attention is paid in both models to the constraints by which people map their own living spaces, even when constrained by a city’s complex and often unfair geography. Parts of urban environments are recast as more habitable based on different criteria, often in response to the made or ‘created’ geography of the city–or fail to be recast in habitable terms. The growth of desirable land in Los Angeles responds to the constraints with which freeways have sculpted urban space, and indeed in ways bound by the 405 in a sort of deterministic way, and the creation of the former Cypress Freeway shaped–and in cases destroyed communities in Oakland, California. Vice versa, patterns of urban settlement and housing prices helped the investment in an urban infrastructure as transportation in Boston or New York, because they led populations to map their lives in urban space.
Does density alone shape market prices? In a sense, yes: but density is a reflection of deeper indices that one might better term ‘habitability’ given their manifold causes and considerable variations. Changes in workplace practices and locations encourage a shifting relation to the urban space, as more people work on-line, of course, and live and work in isolated archipelagos around cities: the vitality of neighborhoods that Jacobs celebrated has become far less important as a unit of economic meaning with increased geographic mobility and more dispersive work environments, including telecommuting. As a result, the framing of a debate between population-weighted density or the availability of “space” as determining land value omits the notions of habitability shape urban space: rising land prices in LA, for example, reflect the shifting attitudes to space created by a system of freeways that shaped land values–rather than scarcity–and defined a map of urban settlement outside corridors of transport that, more than mountains, shape Los Angeles neighborhoods.
This reflects the desire for a way to maps how areas become understood as habitable: and in Oakland, where property values have risen not only in response to the rising rents in SF, but as the city has been defining new notions of habitability by restaurants, urban gardens, and public spaces like farmers’ markets. By trying to identify a model for urban settlement, geography of population density becomes a stick of measurement rather than the remaking of urban spaces: multiple complex constraints on the habitability of urban environments limit the development of urban land values. In the recent recouping of housing prices in the Bay Area, for example, areas of recent price increases were mapped based on data from Zillow.com–and metadata from Google Maps–to find a considerable recuperation of costs in San Francisco and Fremont alike, despite their quite different density, and a mild recuperation in many of the low-density areas of Berkeley and Oakland, as is rendered evident in the regions of light rose coloration below.
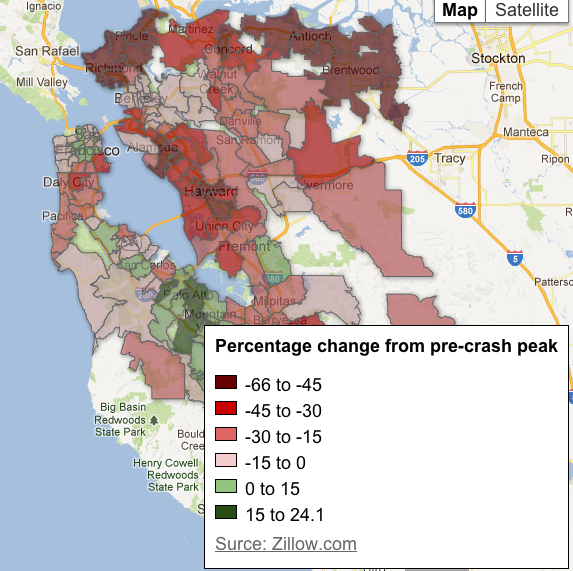
Conversely, if much of Richmond, Brentwood, Antioch, Union City and Hayward remain selling at a far lower price than in the prior boom, many Oakland properties sell at a brisk price, and hi-tech areas like Mountain View–and some areas near Walnut Creek–are positively booming. To some extent this has to do with access to economic centers: the less populated but also less desired and more removed Daly City is nowhere near recovering its boom prices, while Mountain View has surpassed boom prices. But the widespread recovery speaks to issues of habitability, as much as density.
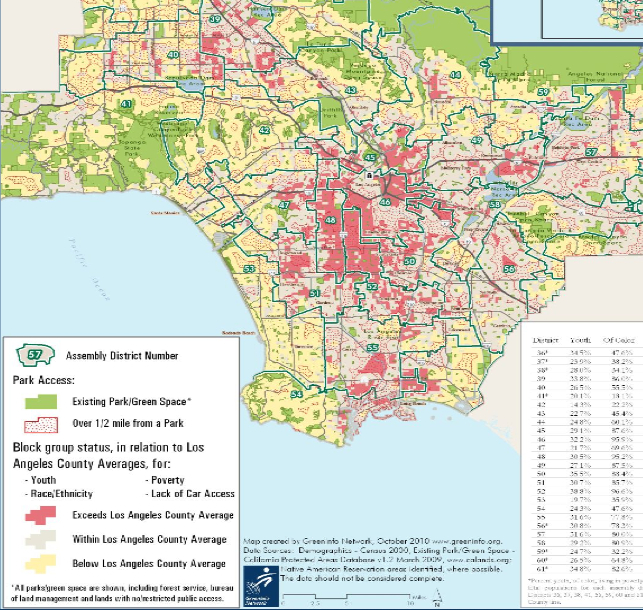
As a counterfactual, let’s look at some actual urban environments where the question of habitability responded to a striking lack of investment in creating a habitable urban space with adequate infrastructure or access to green space–one crucial measure of habitability. Consider, for example, the considerable distances at which less valuable property lie from green spaces or urban parks in Los Angeles, creating an endemic that led the “LA Streets” Blog Santa to bring the city more green spaces last Christmas. (African American neighborhoods enjoy .8 acres per thousand people, in contrast to the recommended 10 acres per thousand inhabitants, or the median 6.8 in high density American cities.) Pink regions here map a distance from park exceeding the LA average, most of which are concentrated away from the shoreline or surrounding national forest:
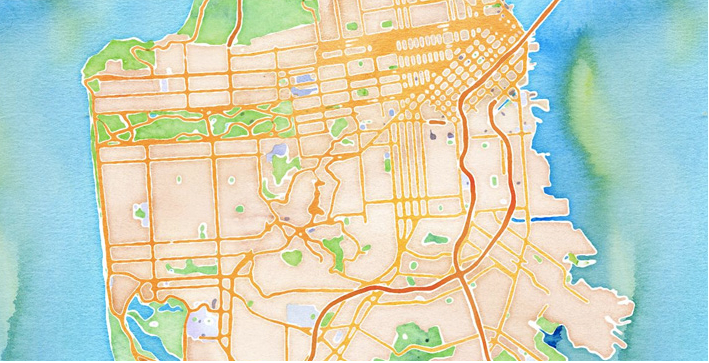
The value of land responds to how we map urban spaces as habitable often shapes property values, as much as the questions of the availability of space. Something like the new Stamen map that focusses on the readability of mapped space by watercolor tiles, pioneered by Zach Watson, provides a new resource to look at urban space to analyze questions of habitability without being distracted by data overload, in what was intended as a visually simpler and pleasurable alternative to the tedium of Google Maps, provides a manner to differentiate neighborhoods in San Francisco–albeit a region whose high real estate prices don’t need much explaining:
Krugman provoked an interesting comment that advances in GIS could provide new tools to include aggregate densities in urban spaces. Indeed, working with the above Stamen map, or with a time-lapse model of aggregation might provide tools to show the shifts in how space became ‘habitable’ or worthy of inhabitation. These tools offer the ability to map a new geography of work: one could model of the shifts in economic redistribution of wealth in urban space, or relative distance of residents to workspace, that might map the relation of neighborhoods to space beyond their relative income or real estate costs.
Flexible GIS models might also help reveal the different maps people create within a city as an environment in powerful ways. In juxtaposing the alternatives between two models of urban life–the metric of population growth, which creates competition for limited resources of land in a somewhat Malthusian fashion, or population density, or urban settlement informed by how agglomerations understood in terms of population-weighted density shape demand in extra-urban spaces or urban peripheries for land that changes land prices–the mutable map of the urban fabric is either dramatically oversimplified or ignored. When land is constrained, the first train of thought goes, rising populations increase the price of land faster than inflation; the questions of how people map land as habitable–and desirable–more informs the second proposition, pointing to the rise of “edge-cities” on extra-urban space that become desired centers of population.
That choice between population and weighted density seems a bit artificial, because both are abstracted from how people make concepts of neighborhoods out of open space–by mapping it as their own, or by not being able to do so. Today, New York has of course become the model of a high “population-weighted density” city, based on the average land density of its inhabitants, or the relative density of its populated areas. But whereas in the 1970s suburbia gained value in the 1970s around greater New York, leading them to abandon a city that became defined as less “habitable,” and to define preserves away from commercial activity, we now value habitability as a relation to a neighborhood, or something like one.
The remapping of the urban core as economically vital paralleled a shift in the understanding of its “inhabitability”– mapping not only its density, but what makes it conducive to habitation or less appealing as a living space. Could we map the shifts in aggregate population density to investigate patterns of land value, to examine the rise of prices in New York and in regions of uneven density of population spread out within large cities? One point here would be to chart the spaces made and created in individual cities over time that informed property prices by creating new models of the habitability of the same spaces and of urban life. To do so, I’ll use maps to illuminate shifting attitudes to space.
Before considering urban geographies, it’s interesting to map a distribution of the predominance of bars to grocery stores in a cute map that I can’t resist–with surprising concentration, the number of bars exceeded grocery stores in urban areas clustered in the Midwest and parts of New England, and areas of the plain states and spots of the Southwest. It would be interesting to pursue this map into urban areas–does the prevalence of bars over grocery stores suggest a greater role in serving neighborhoods, or a preference for the social function that bars serve in specific urban or rural regions?
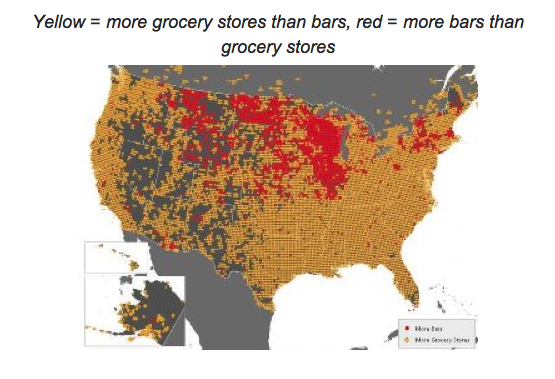
The map may tell us about a culture of sociability–in the colder midwestern north, and New England, bars are important sites of aggregation. The map speaks about how folks create habitability in urban space in response to different constraints. We can use this model, more importantly, and this will be the end of the post, to expand the criteria by which we look at urban spaces beyond density that can help raise new questions about the relationships between property value and urban milieu.
Others might reveal the increased livability of different spaces within the city, as this map of the green spaces in New York City, perhaps the city that possesses the densest urban core, in ways that map urban resettlement outside the region of its greatest densities by the foundation of community gardens and urban agriculture, discussed in an earlier post, which notes those places that accept volunteers by blue dots:
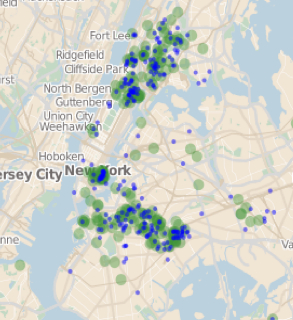
The map reveals not only an expanding urban green-space, but the re-envisioning of densely occupied areas as of more livable urban spaces, in ways that mapping population density or aggregate density alone don’t suggest.
Still other maps of urban environments reveal the constraints on the very maps we make of urban space that are so central to housing prices–a process perhaps missing from Krugman’s discussion of two attitudes to the analysis of land-value. Maps are a central tools of real estate to attract attention to property and shape urban space into neighborhoods, and fit notions of habitability into existing spaces. Many structures define these spaces of habitability, not necessarily understood in terms of weighted density alone. Los Angeles is not, as Krugman’s piece suggests, “hemmed in” by mountains that constrain city’s sprawl; its low density seems to run out to the Valleys, as freeways define the urban space and create anew map of property values and more habitable and valuable land. It almost seems land properties rise in their remove from the freeway, where the relation of land to freeway is more easily mapped, much as much of the value of land in Santa Monica seems to recede in value from the Pacific. Freeways or overpasses divide urban space and help structure maps of habitability; freeways of easy commute may, conversely, increase the value of hived off aggregations of “edge” cities, by improving connectedness to other environments.
We can map moreover habitability in different ways. Cities like Oakland CA offer a sort of counter-example of a space where habitability set off a rapid rise of real estate values and the price of land: there is no clear confine to urban space, but the spread of restaurants, green spaces, farmers’ markets, urban farms, and open public spaces fashioned a new notion of the inhabitability of distinct areas of its urban space in successive districts, earlier shunned, even when considerable crime continues to plague nearby parts of the city and the city hears the screaming sirens of police racing to the victim or scene of a homicide. (If some would say real estate prices derive from the flight from the property values of San Francisco, that only seems to be the icing on the cake.)
The value of land is not a simple calculus of limited supply, but of the mapping of urban space–first taken up by real estate agents who sculpted Oakland’s neighborhoods, but informed first by a shifting sense of the habitability of the land, whether in the middle of an old port-city or the more trendy area of the Temescal. Demographics prefer different models of habitability; the age of the population of Oakland seems exceptionally low, for example, as they might first define the city as more habitable. The shift of populations toward less densely settled urban areas reflects this shift in how we have come to map habitability, one might say, even if aggregates of population density reflect land value; without numerical data to show for it, I offer that the value of land reflects the relative scarcity of habitable areas in urban space, but also shifts as notions of habitability emerge. In New York, the premium on habitability drives the growth of new neighborhoods, from the allure of Soho or the East Village to Brooklyn Heights as more habitable than more crowded urban environments. Imaginative ways to map public spaces create habitability in urban regions; the lack of parks in Los Angeles fuels a somewhat undifferentiated urban expansion and settlement.
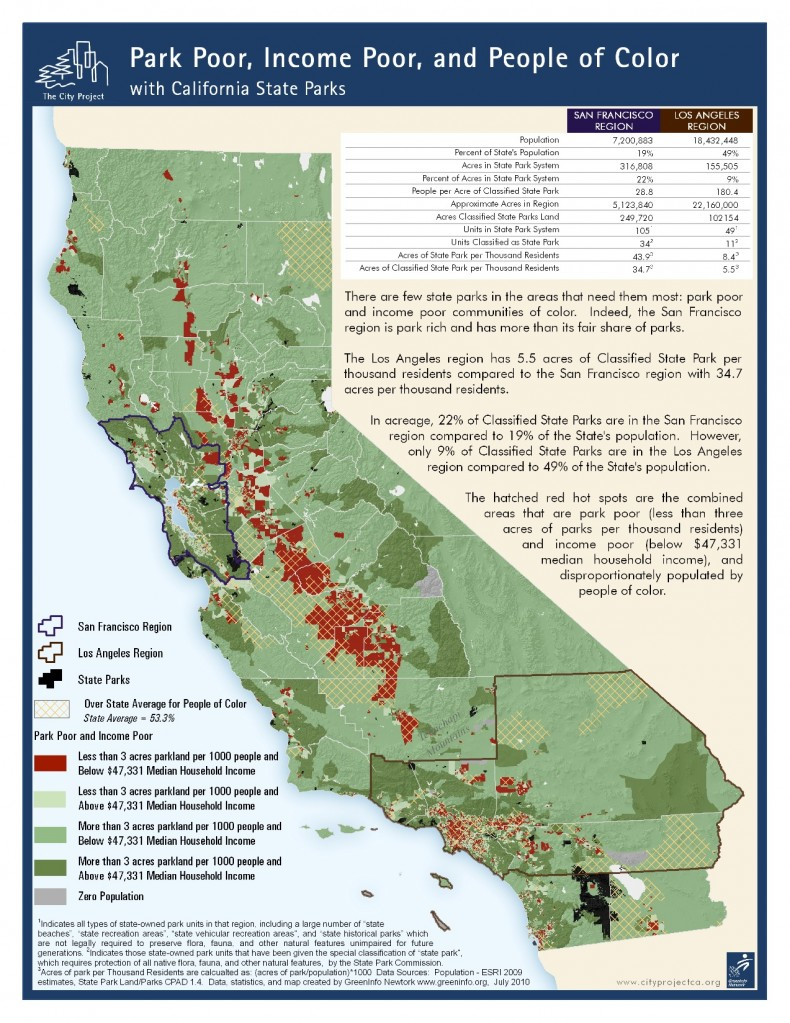
But there are huge obstacles to mapping the habitability of space in the very regions and cities that habitability might be encouraged, as we find habitability to become, in much of California, the preserve of the wealthier few, and urban spaces constrained by barriers to their physical improvement. Take a simple map of the distribution of parks in the state, and reveals radical differences between the parks/inhabitants: the polemic map ties park-poor areas to income, contrasting darker greens to show greater availability of acreage/thousand inhabitants in the San Francisco than Los Angeles areas:
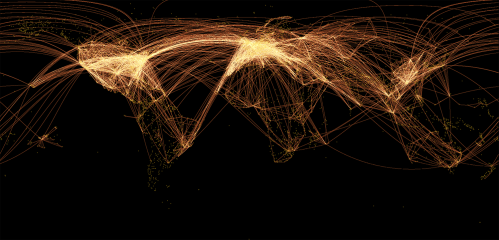
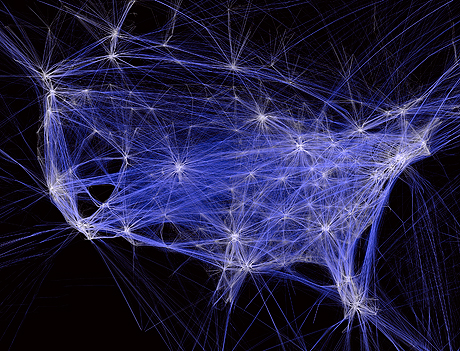
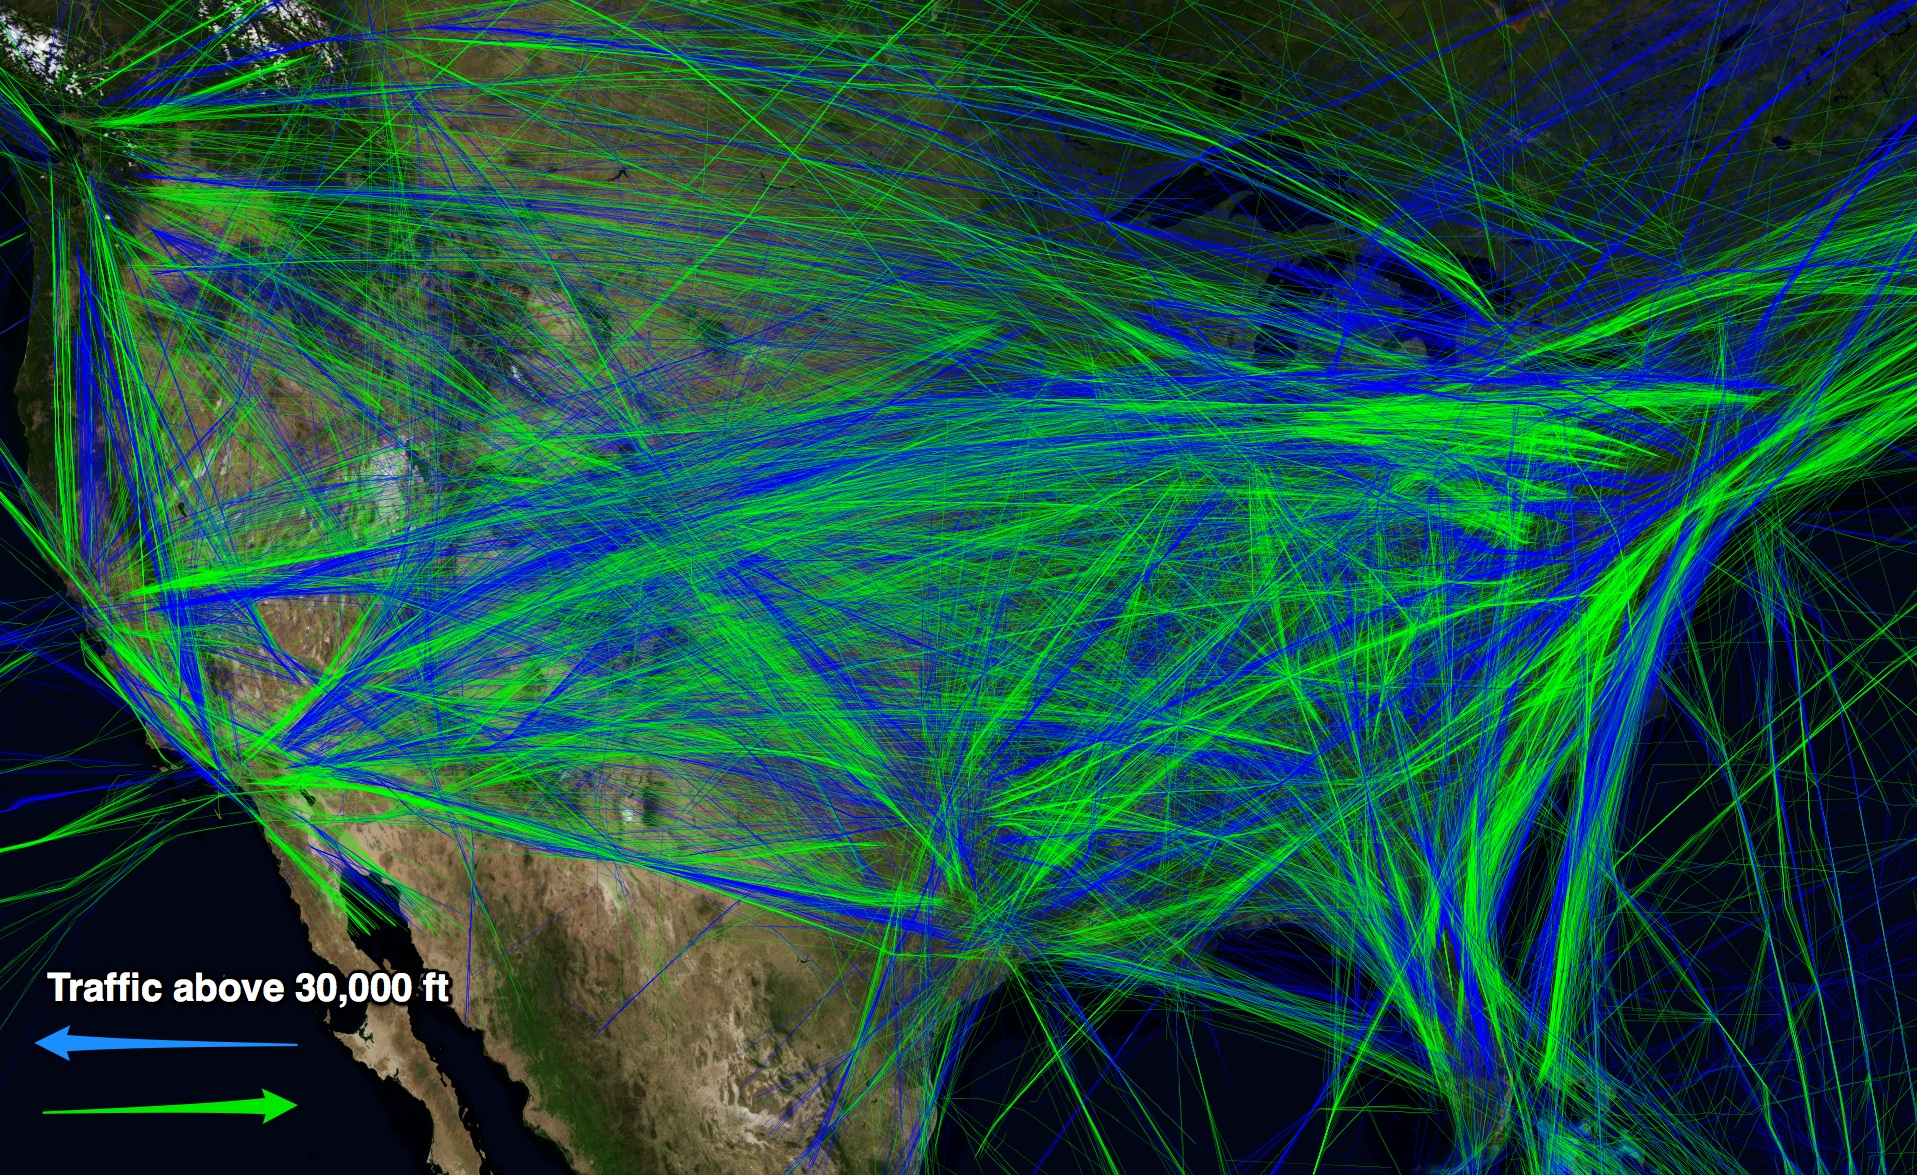
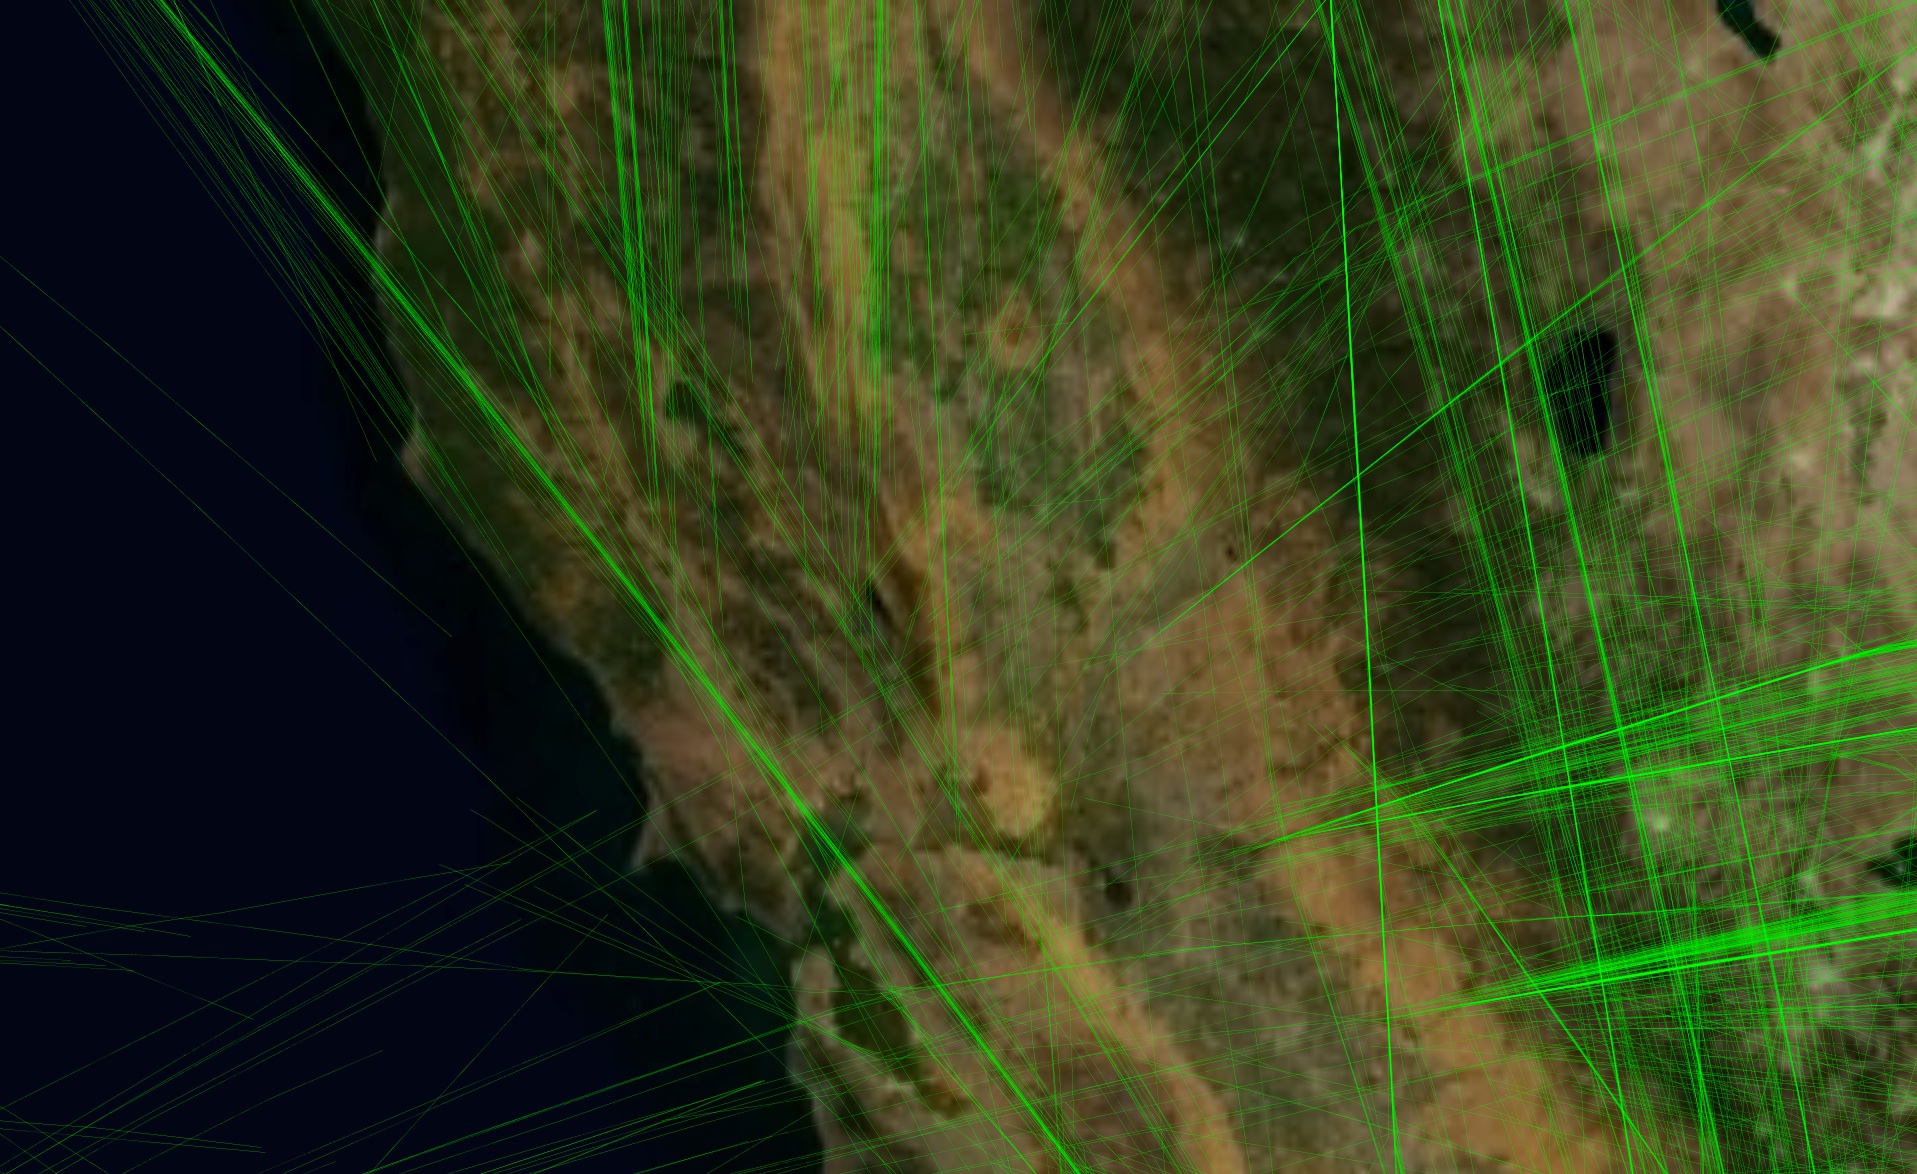
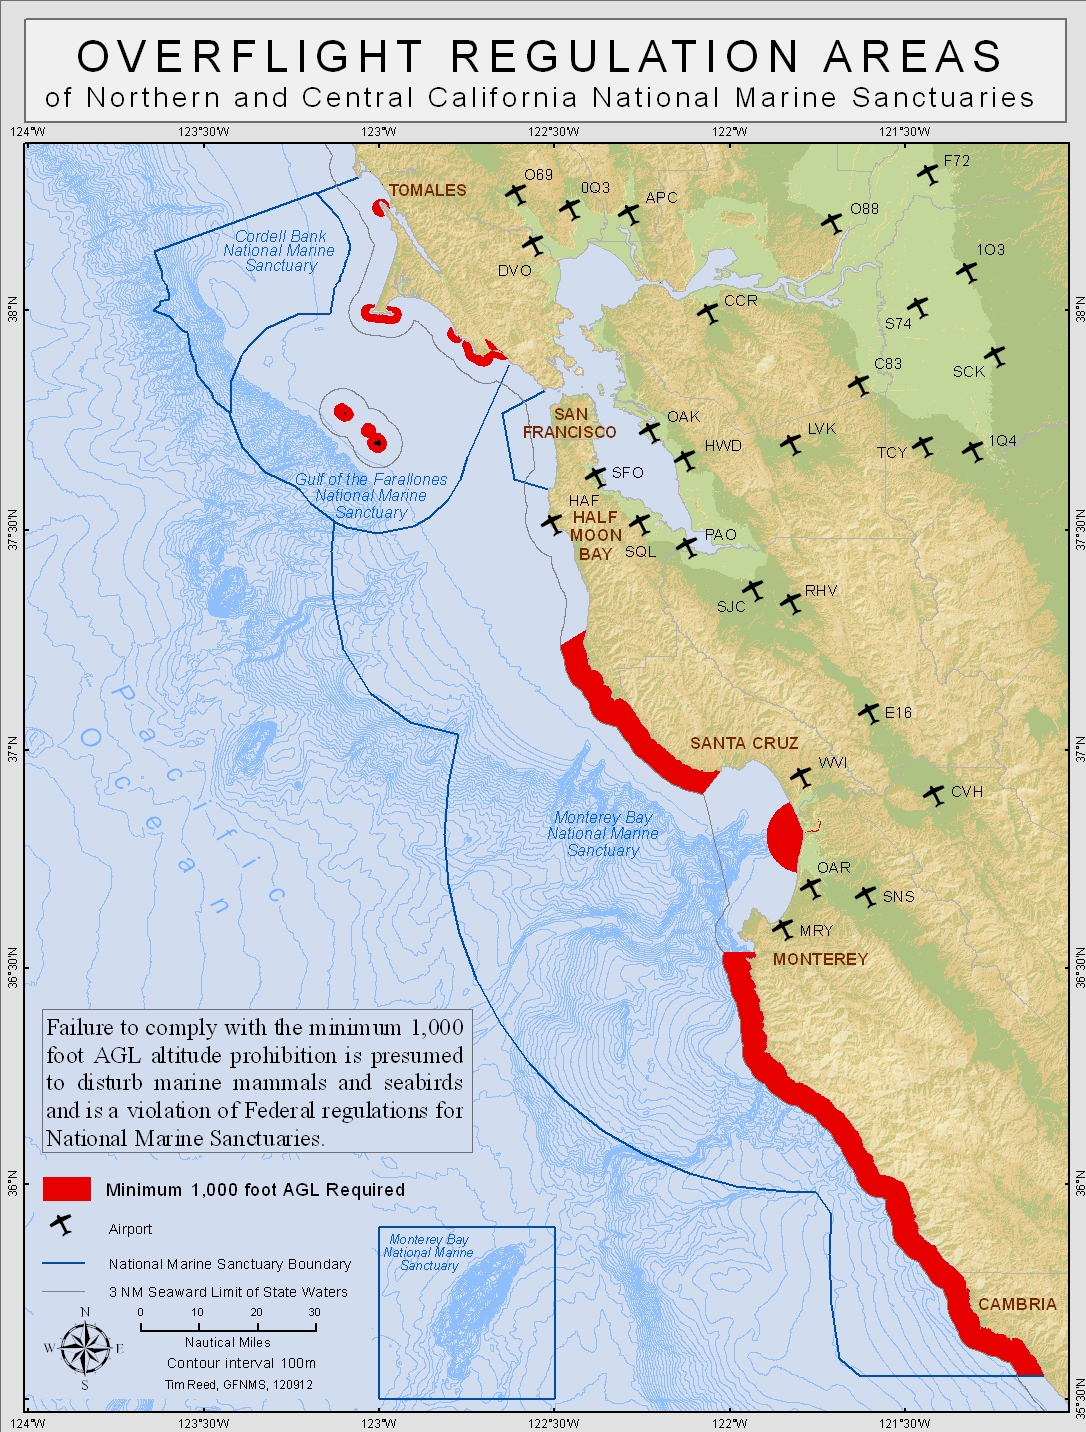
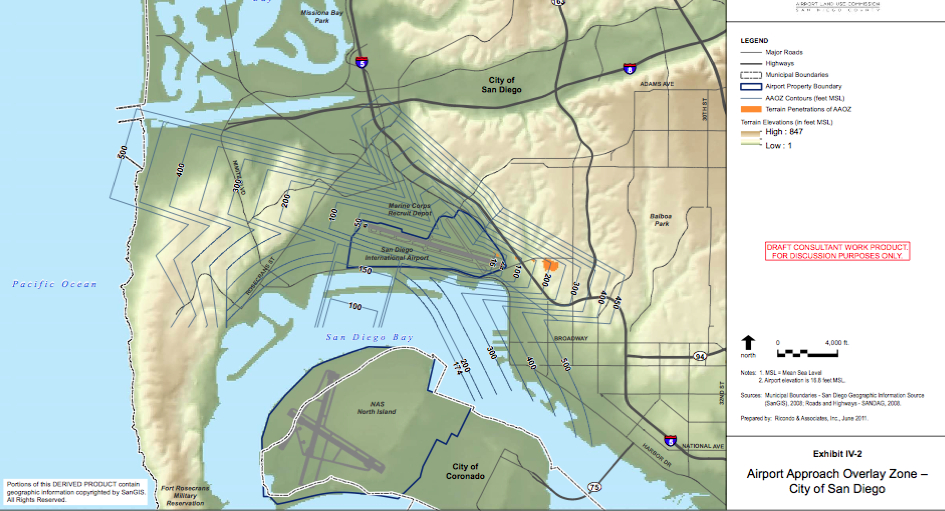
Income variations allow the possibility of a flexible and inventive relation to maps of habitable space–as the clumping together in aggregates or scarcity of desired urban lands reveals. As we become more movable in our work, and develop a more flexible notion to workspace, this shifts the relations of local routines of personal and work space, and there is considerable choice about the spaces where we live: workspace is less dense in different cities, to be sure, as silicon valley or other IT belts like the Research Triangle around Durham NC, but the premium on the flexibility of defining one’s own model of habitability seems to determine the new urban geography Krugman describes. Further anecdotal evidence, beyond the United States but in North America, might point to the shifting geography in urban Ottawa, where the residential Glebe was distinguished by rising residential real estate. Within the shifting infrastructural map of the city, one maps one’s own personal space. Indeed, the bizarre settling of San Francisco’s sky-rocketing real estate prices is partly driven by the arrival of highly paid executives working in Silicon Valley, shuttled to their work in select buses whose routes allow them to select an alternative to public transit, as discussed in an earlier post. The paths of flights into San Diego, to use another example, skirt more select residential areas like Mission Bay, create a zone marred by the rumble and whine of overhead airplanes. And the organization of urban space no longer reflects how we map and understand urban geographies as habitable–or come to dismiss them as simply uninhabitable and worth less.
Only by balancing what maps tell us about how an urban region gains value for its habitability can we effectively broaden the discussion and use maps to measure inhabitability against degrees of uninhabitability and will we be able to extend the critical evaluation of value beyond questions of supply and demand.


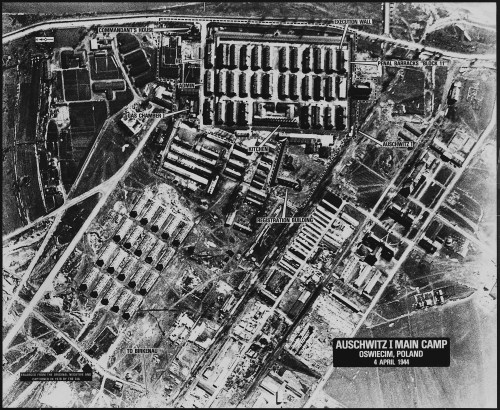
 aBefore these maps of spaces of dehumanization and devastation, we are really looking into hellish worlds we had not been able to see before. But even these dots cannot capture the scale of the hellscapes that emerged for the accelerated loss of life within the industrialization of death that proceeded from Heinrich Himmler’s order of 19 July 1942 stated that unleashed mass-killings from bullets, fire, and gas extermination to fullifll the demand that by the end of December 1942, all Jews, gypsied in Greater Germany be killed, leading to an unprecedented intensity of rates of mass-killings almost impossible to map on paper or by a graph, challenging as the spatial dynamics of the three-month long burst of killings is poorly documented–intentionally–and
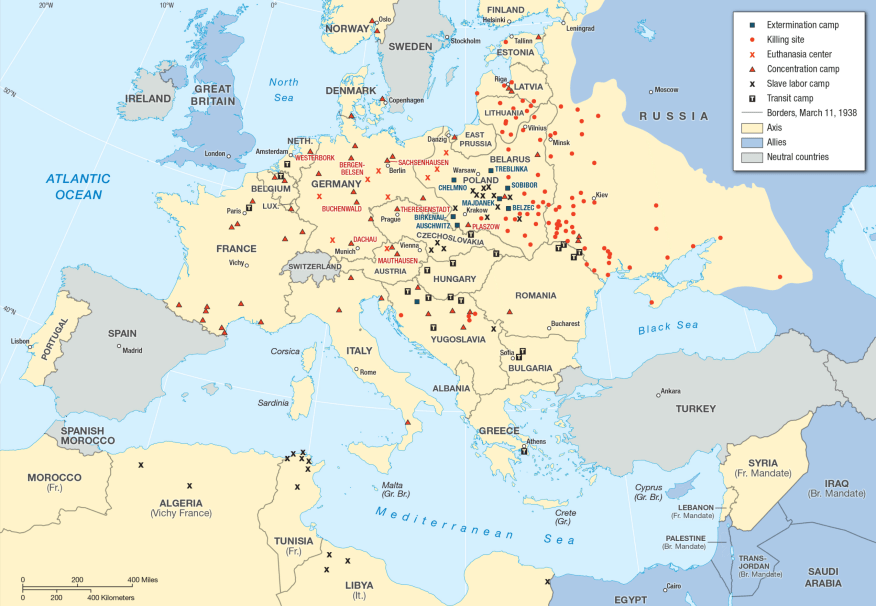


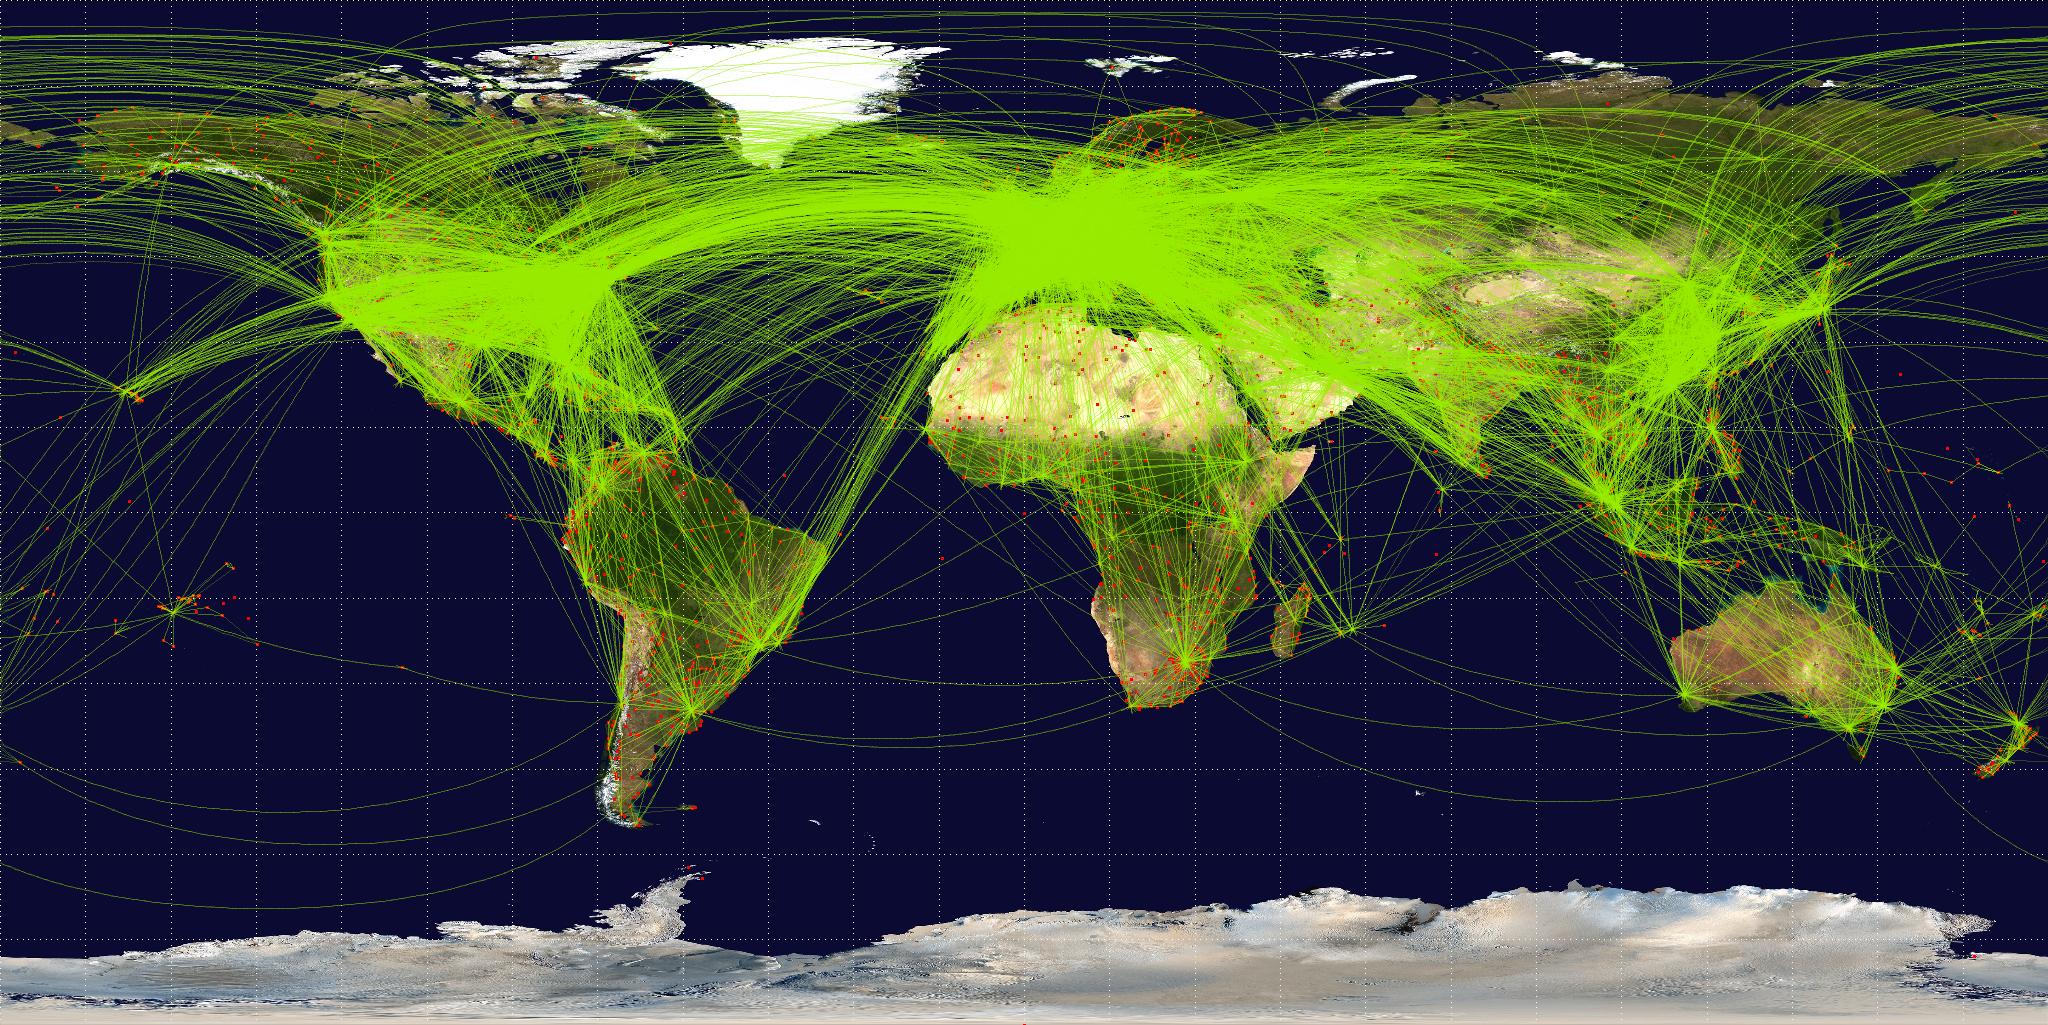
 Open Flights
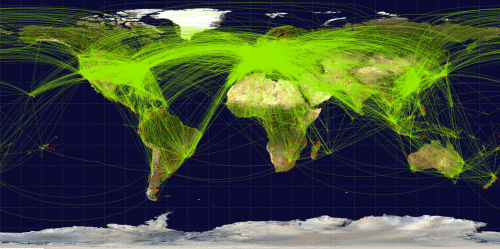


