
In an era of climate change and global warming, developing a positive relation to place–and an unpacking of its complex ecosystem of what Charles Darwin called the “endless form” of nature within a city offers what might be a more therapeutic and healthy relation to place than many digital maps and data visualizations afford their readers. Rather than focusing on the tyranny of a present–or on a diachronic view of past and present–the “endless form” of how nature interacts with and exists in the city is the focus of their map.
The image that the non-profit created of the spaces of habitat that can be nurtured and encouraged within the city–spaces for animal and plant habitat that are all too often overlooked in or absent from concepts of urban planning.
–and indeed how that space is mapped.
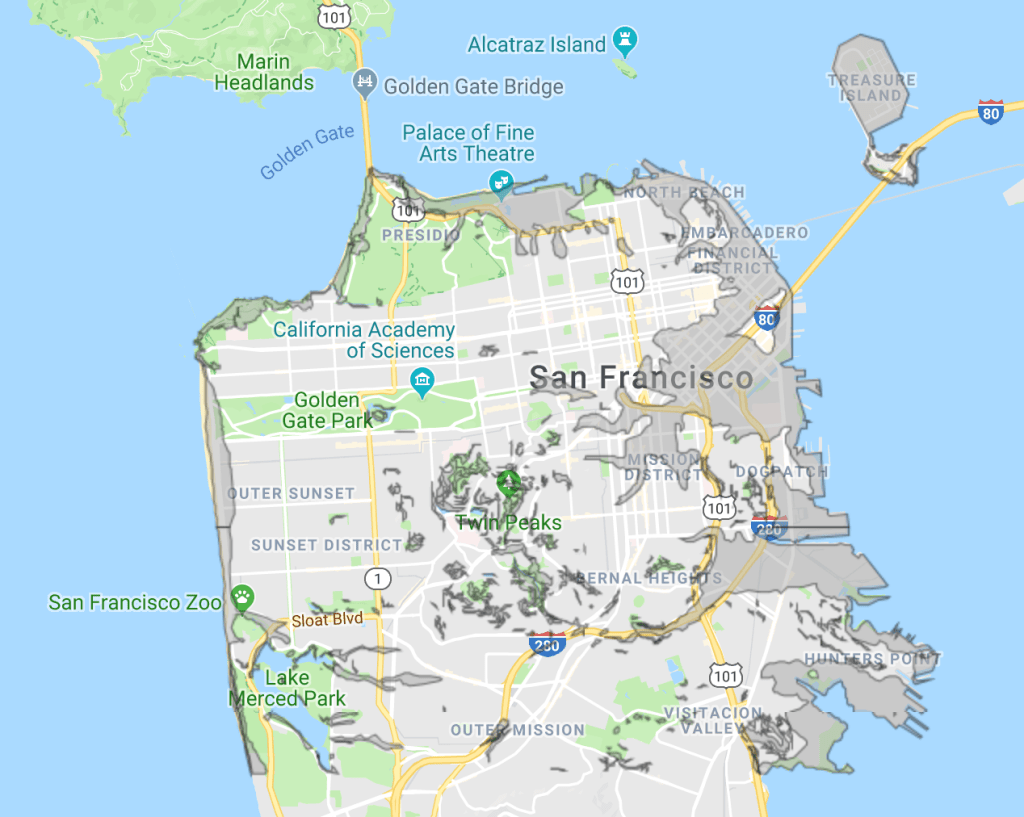
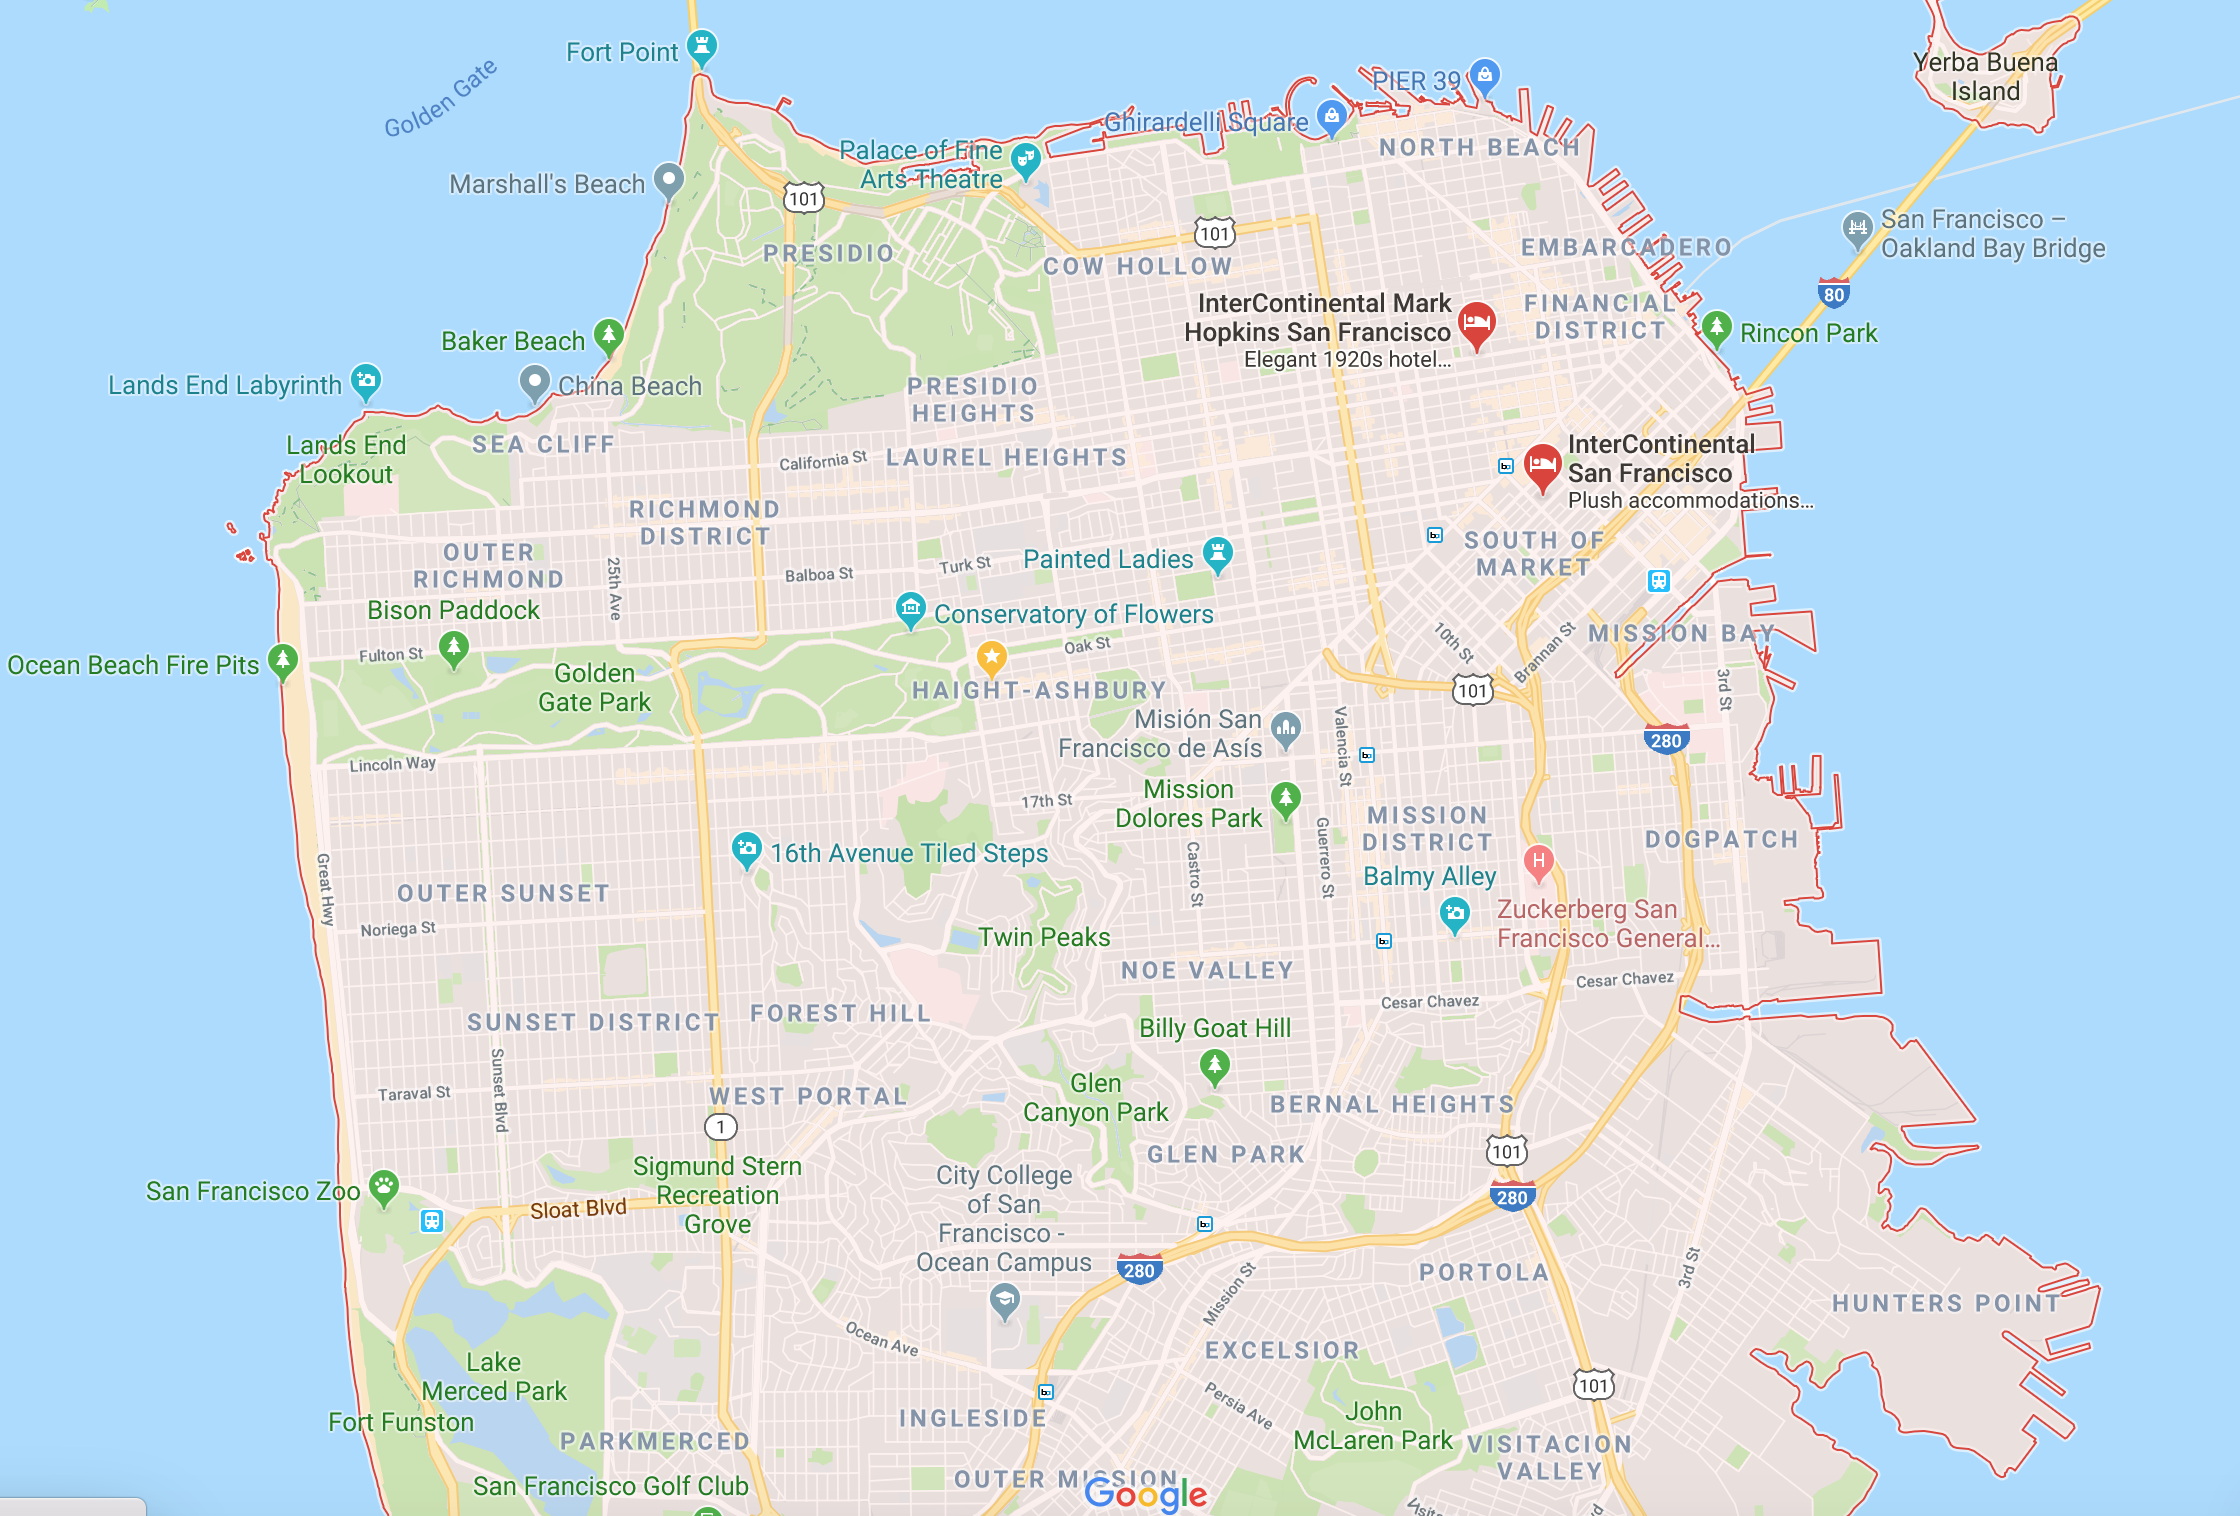
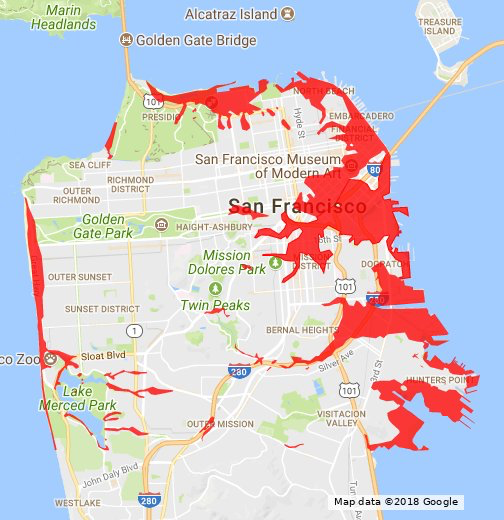
The reorientation to the urban map reminds us of the power of maps to redesign and re-appreciate place in an increasingly urbanized world. A long tradition of urban maps that celebrates the built environment as evidence of the city’s vital form: but recent debates about the prospects for urban livability have returned attention to the vital pathways and streams of live that undergird the city’s space; and in the case of San Francisco, perched between bay and ocean, and lying on multiple migratory routes of air and sea, the confluence between urban and natural spaces are perhaps especially salient to be of the moment as we try to remap urban space less in terms of buildings or built structures,–foregrounding empty areas of light green unfortunately rendered in rather generic flat light green hues in Google Maps that numb our visual curiosity for reading mapped space, or indeed of any of the other map servers we use to navigate the congested streets of urban space.
Even as we are enjoined to “navigate our world faster and easier with Google Maps,” and trust the promises of such enhanced abilities, we too often tend to forget–or not see–ways that might orient ourselves to our surroundings or indeed what other sites in the world we might do well to pay attention to. If there is a danger that we are at risk of loosing sight of places of nature in our mental geography of urban space, the data rich nature of the map of wildlife habitat compiled by Nature in the City don’t dominate the viewer with data, as strongly as some maps continued to do–
–but offer an ability to reorient ourselves to the dense population of the urban space.
For Nature and the City suggests something of an urban understory that supports a rich variety of habitats, on which we can re-map our place in the city, less to an abililty to navigate our relations to urban space on its streets, but learn how other taxa live in the city, and use its space, in order to appreciate how we can be the best custodians of their habitat. Indeed, the remove of any grey space from the map’s surface and open face–
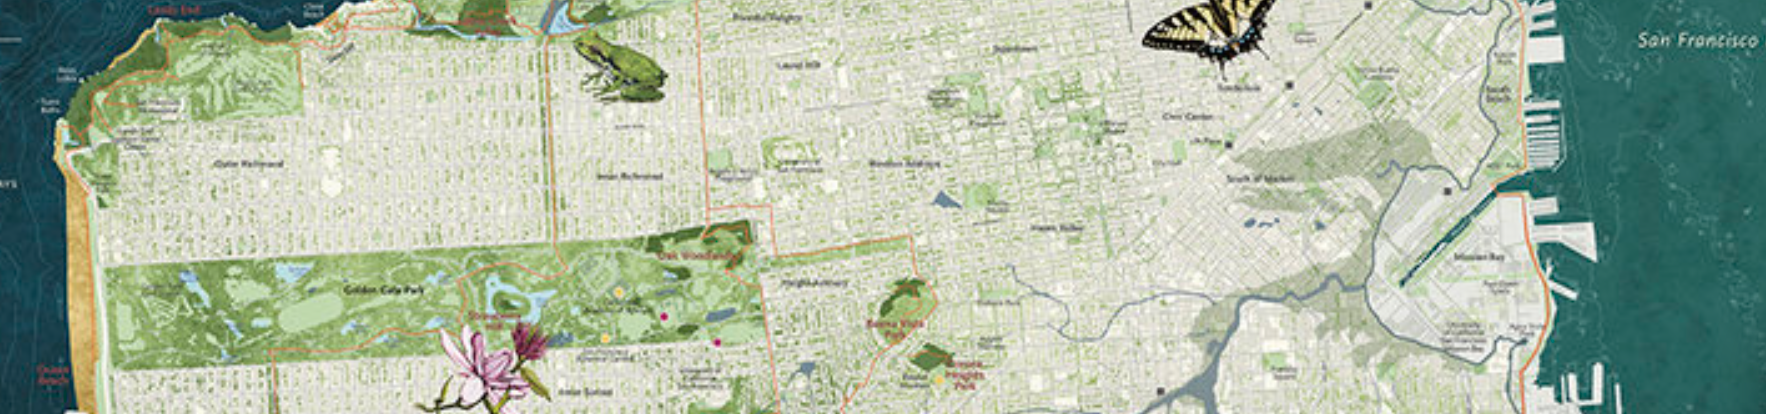
San Francisco from Golden Gate Park to the Bay (detail)/Nature in the City
The intention is to invite us into urban space through a new set of coordinates, so to speak, that invite the viewer to orient themselves to urban space by an expanded and enriched sense of its habitation not only as a grid, but as a set of corridors of open space. San Francisco has few dirt roads, fruit orchards, wooden fences, forest canopy or decomposing broad-trunked trees, or choruses of cicadas crowding overgrown fields. But an abundance of complex habitats define the city raises questions of the vital relation of open spaces to the ecosystem that also inhabits it–and to the endangered habitat that groups like Nature in the City work to nourish and preserve.
7. As we confront pressing questions of livability and the future of the long rhapsodized city of San Francisco, can maps better attune us to the changes of its urban space? Perhaps the notion of how maps work to “civilize a space” and prepare it for our eyes has changed–or is trying to change. The notion of cultivating and maintaining the order of a space seems better to respond to the exigencies and unknown future terrain that increasingly defined by global warming, climate change, sea-level rise, and a loss of species. The sense of what such a civilization would portend–or how the space might be civilized–has been called into question as the role of manmade change in the environment has been questions, and maps struggle to wrestle with and process that change, taking stock of eventual effects of over-building, shifting shorelines, and planetary warming on where we–and not only we–live.
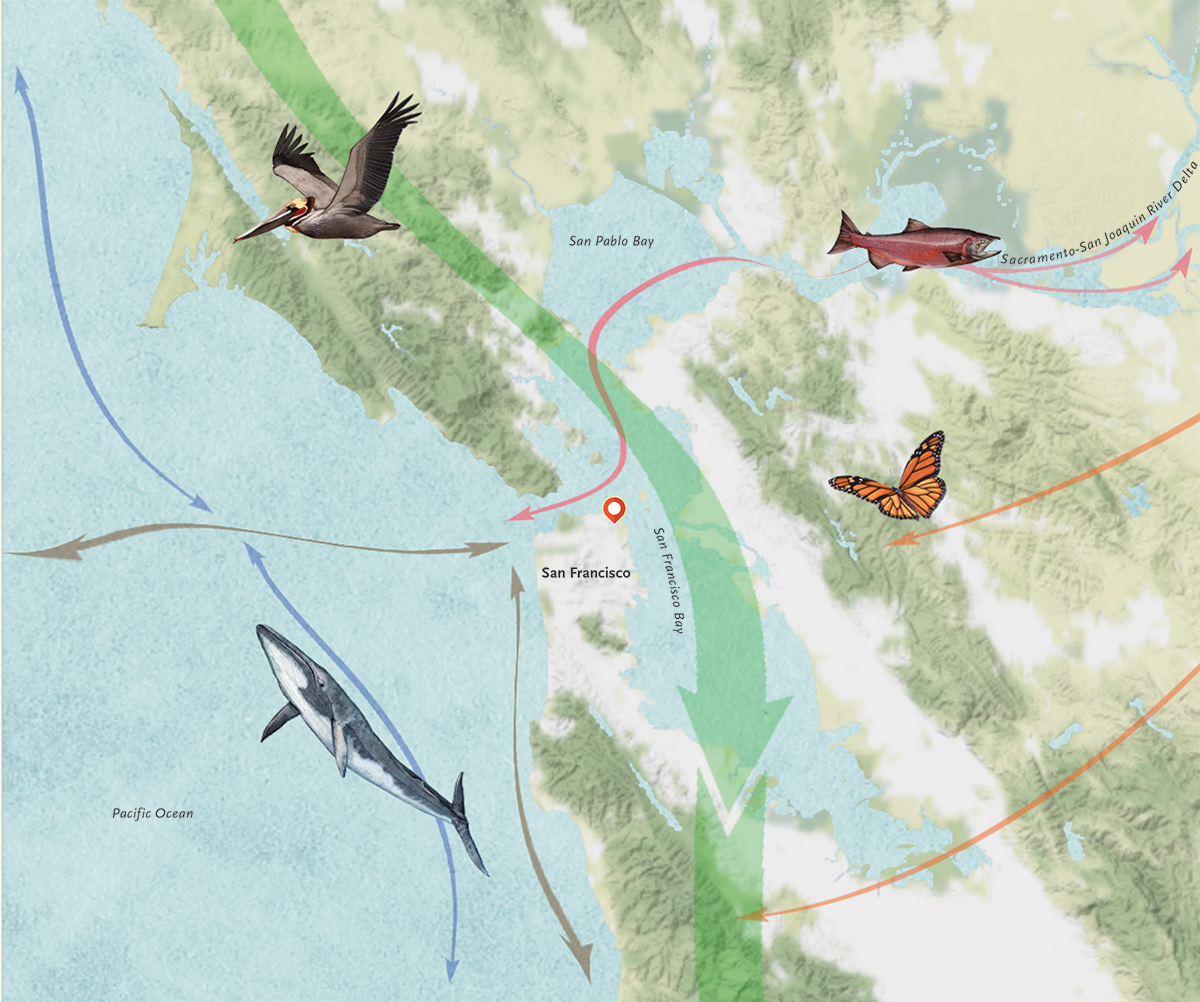
The problem of detaching the urban grid from the environment surrounding is addressed both by the image of San Francisco within migratory routes of birds, ocean mammals, and fish, and a living habitat for animal and plant life, and the increased awareness of dangers of overbuilding in a city framed by notoriously unstable fault lines at the edge of the continent. Given the complexity of the biosphere in an era when Presidential candidates proclaim their opposition to scientific consensus on climate change or Darwin’s evolutionary theory, the range of open data we have on the local biosphere provides a compelling way to place viewers in a complex ecosystem. The value of open data to offer a range of yardsticks that can help ascertain the extent to which a bucolic city retains and map its relation to the natural world in the new map issued and designed by Nature in the City, a public interest environmental group whose work raises consciousness about urban greenspace. While their map is not dependent on data alone, the map’s valuable text reorients us not to its streets, parks, or plazas, or its transit system, but instead to the levels of green cover in each neighborhood and the sort of ecosystems they afford–providing a new way to understand and explore its neighborhoods.
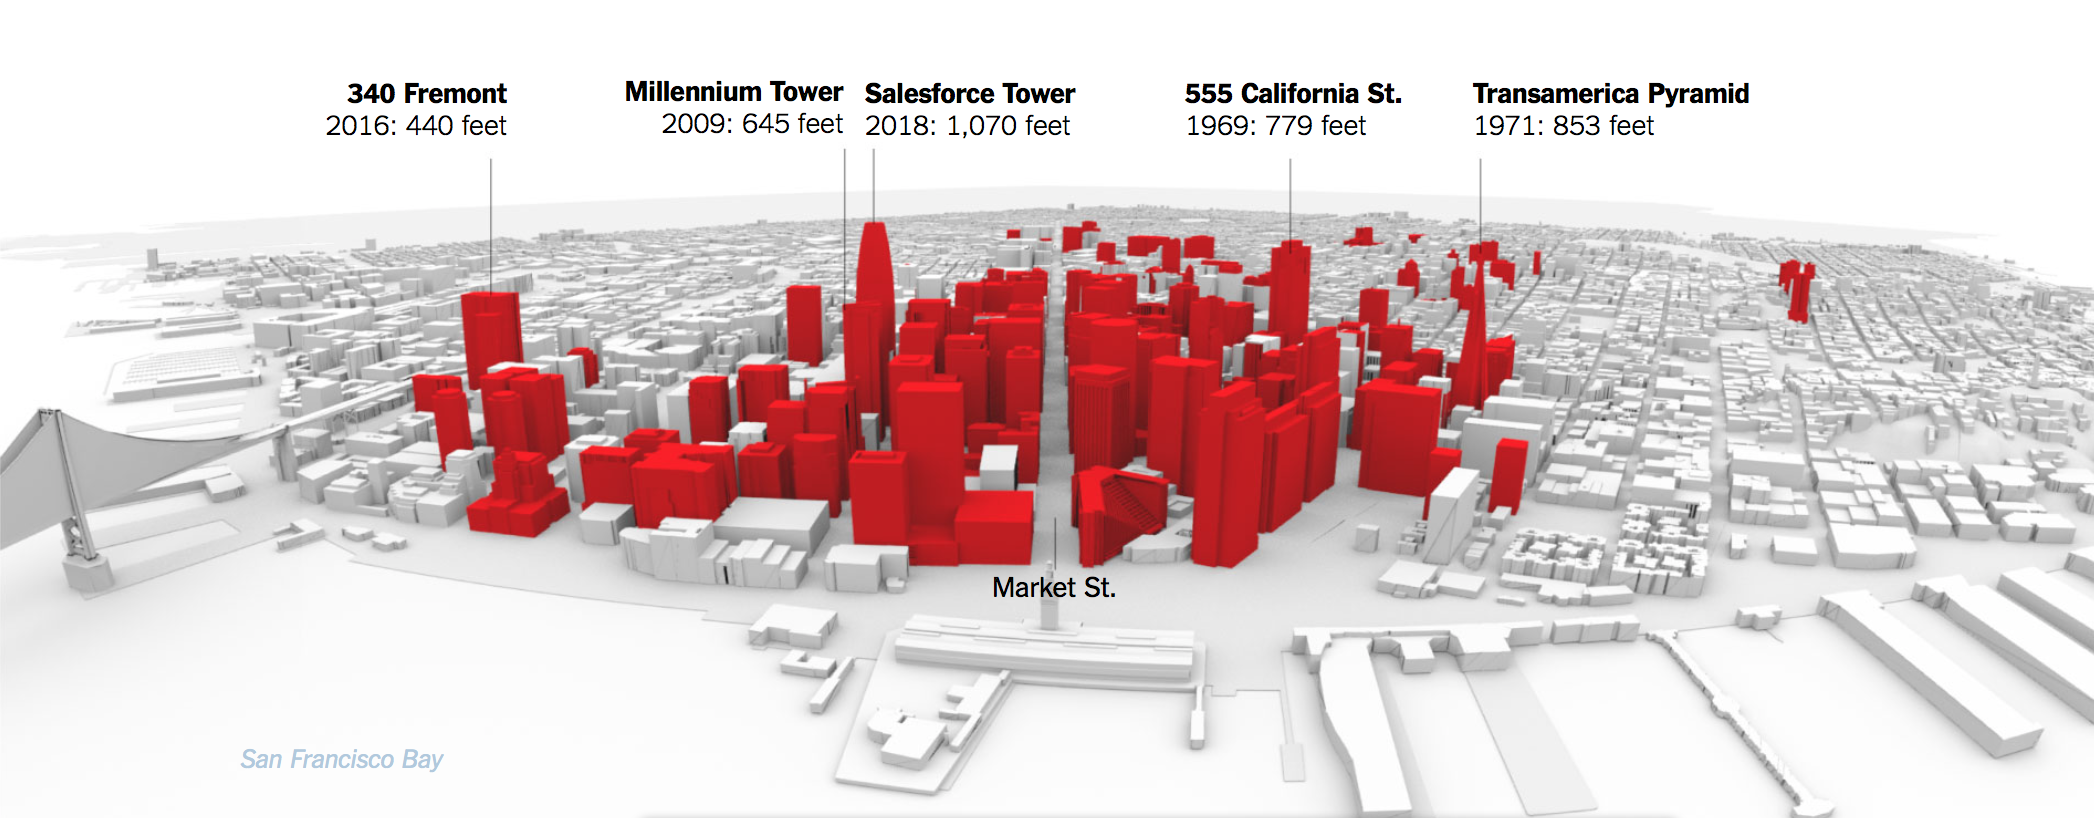
In contrast, San Francisco has been depicted as the center of a different sense of environmental vulnerability, subject to zones of increased seismic risk, based on its situation on a continental shelf: the different view of a city subject to natural forces and vulnerable to them is increasingly made evident in the recent spate of vertical building. A recent set of news articles in the New York Times has focussed on the question of how seismic risk was ignored in the expansion of vertical building in the liquefaction zone of downtown San Francisco: a web-based visualization of downtown compellingly used the new USGS maps of the shaky geological terrain of landfill to invite viewers to judge the questionable basis that sandy grounds to support ambitious skyscrapers. In a city that long lay close to the ground, unlike other metropoles, the juxtaposition of red extrusions of buildings of the steel-frame buildings that now dominate San Francisco’s skyline are placed against the memory of the 1906 earthquake,as if to show the looming danger of natural risks of their welded joints to inevitable seismic jolts–not to mention the large number of

–that may well demand them to be inventoried as public risks by the California State Legislature. For the recent spate of skyscrapers in the past decade cast a shadow over an iconography of urban hope, journalist Thomas Fuller’s illustrated articles for the New York Times reveals the instability of the city–and the limited safety that that vertical over-building on sand allows to workers in the densely populated downtown. Using the recent USGS maps of liquefaction areas abasing the buildings of increased height in public records–
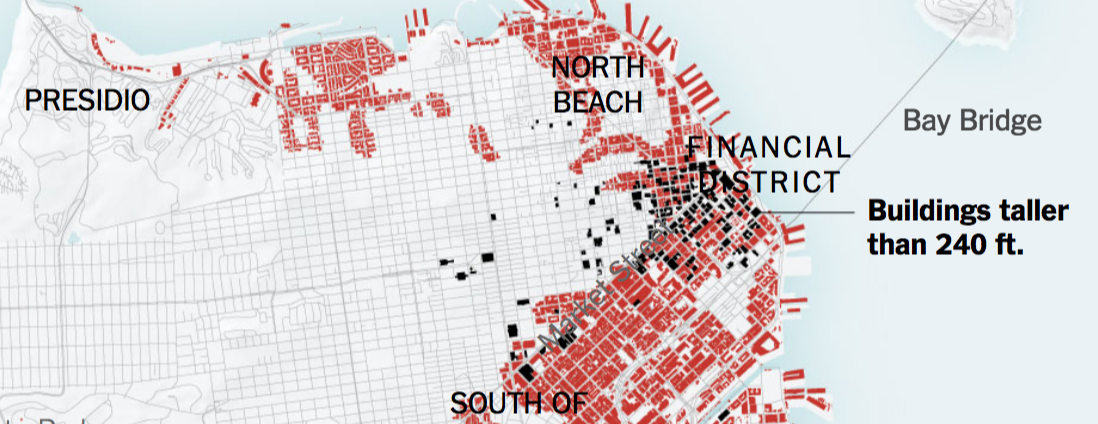
these maps tempt us to face fears of steel-frame office buildings fracturing, and the possible paralysis of water-systems and electrical in their upper stories. The set of powerfully monitory map that suggests an alienation from of builders from the inland Hayward Fault or San Andreas fault lines, and set off alarms to anyone who read the article whose rapid online shares reflect its visceral conjuring of the arrival of the “Big One” far more concretely than earlier maps of the city’s sizable liquefaction zones by the Times, that may traffic in alarmism on the recent anniversary of the earthquake, by inviting viewers to scroll down screens that make them ponder if the supervisors of building codes allowed the construction of real estate that papered over the natural risks of building on sandy ground in an area of high seismic risk.


Pingback: The Built World | Musings on Maps