
Near my house in Berkeley, a curious street sign that canceled the word DOPE beside warned motorists near a low-income housing police are reading their license plates. A relic of a war on drugs of an earlier era, when crime waves spun through a now gentrified neighborhood, the signage beside a four-way stop dissuaded prospective drug sellers–in what must have once been a hub of clandestine activity–of the vigilant eyes of ever-present police cameras–with added messaging that they have entered into a residential neighborhood that has taken crime “seriously.” How seriously? It offers a visual illustration of the etymology of surveillance from the French surveiller, “to oversee or watch.” This surveilling will, in other words, anticipate their punishment.
Beneath a roving eye, this Berkeley Neighborhood Crime Watch warns potential felons they will “immediately report all suspicious activities to our Police Department” as a caution to all, giving “buyers and dealers” cognizance that “your license plate numbers are being reported to the police.”

Signage on Ward Street, Southwest Berkeley, CA
The old signage that seem smart of a nation-wide advertising campaign of the 1980s and early 1990s to urge school-age kids to resist drugs, best known by Nancy Reagan’s “Just Say No” program, a slogan that gained national attention after the First Lady used the simple phrase in response to the question of an Oakland girl, interested in how to respond to the offer of drugs from her own cohort, responded in words to immediately powerful that “Just Say No” clubs emerged around the nation as well as at Oakland’s Longfellow Elementary School, where she was visiting. (I’d long been told it was used at my daughter’s elementary school my daughter frequented, but I will cede that dubious honor.)
The expansion of hidden cameras designed to capture license plate numbers of passing vehicles increasingly knows no bounds. Its collection suggest a new level of intrusion, justified in the war on drugs or crime, but has increased the gathering of license plate data registered indiscriminately in the name of law enforcement by automated license plate reader systems across many cities in America. They suggest the transformation of the very same landscape, forty years later, where the city has invited the placement of scanners situated at intersections of Oakland, Berkeley and Kensington, to suggests the readers able to capture license plate numbers. Any child watching cars on the highway may have fantasized about the legibility of the plates on passing cars, but the expansion of computer software has allowed the processing of a big data archive of license plates across the nation, allowing a database to be assembled for police departments to request information about individual cars on an unprecedented scale by scanners whose retention of data lasts for years–and has escaped much public regulation–and are hoped to have the potential for a permanent archive of the populations of many states, without secure protection of the data stored and without public access to many records that are deemed classified for public safety. The lack of protections on the technology of surveillance suggests a dangerous data breach waiting to happen, and even a lack of clear policies for storing, protecting, and archiving the data in different states. Have police departments improvised new technological tools to surveil their populations, with no method or adequate protection for the data that have overzealously grabbed from new devices in the belief that it would help ensure public safety?

The tools of registration are not single photo cameras, but the icons of the camera suggest the sense of watchful surveillance that groups like Electronic Frontier Foundation and others are trying to be vigilant against, providing maps of the levels of enhanced surveillance that the police department has on city streets. (They do so not to offer a reverse map of the routes of getaway cars, but in the belief that the public has every right to know about these massive information grabs of data, often sold to or made available to a range of other audiences.). Marked by cameras to denote the readers set up on fixed locations that scan all license plates that are within their view, license plate readers have vacuumed up up to 1,800 plates that come into their viewing range per minute, noting the time, date, place encountered, that are stored for years–a huge megadata trove now able to be mined.
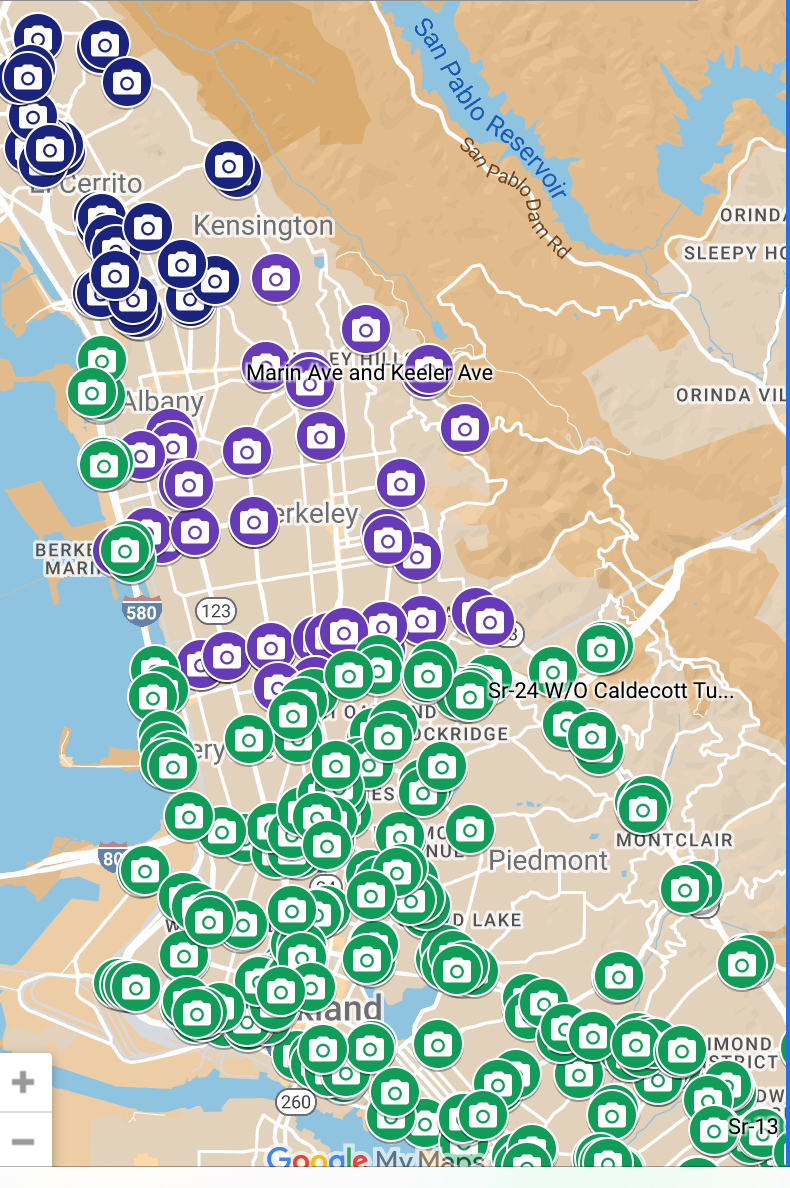
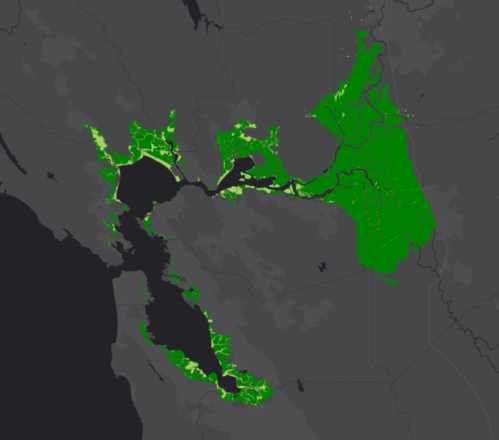
Autonomatic License Plate Readers Currently Active in Oakland, Kensington, Emeryville and Berkeley, CA
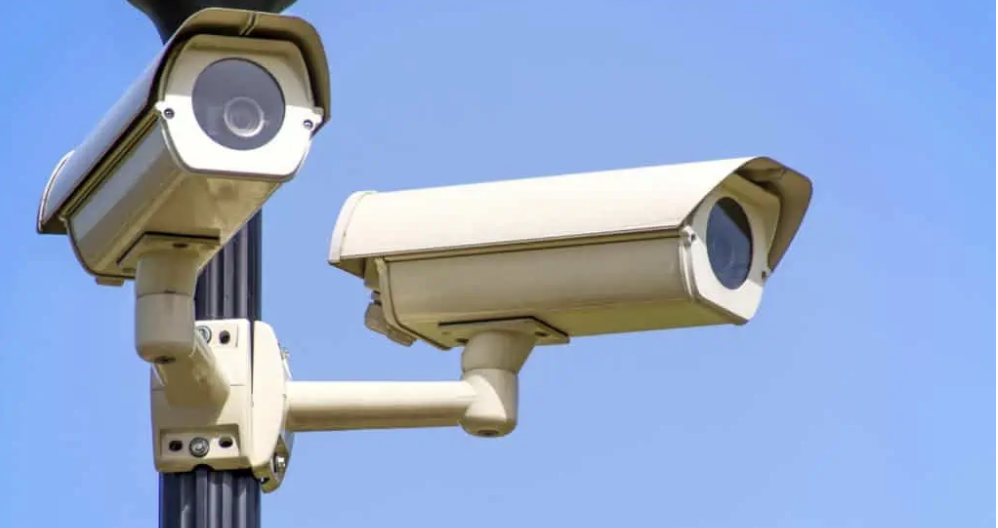
While cameras can be mounted on police cars or at fixed location, the scanning in the city of Los Angeles of about 3 million plates per week before the recent pandemic take up a range of information that predominantly includes law-abiding drivers, but allows should allow many to have a monopoly on data about drivers who move across America in all jurisdictions, data possibly shared with private policing groups, Homeland Security, border agents, and indeed immigration authorities and airport security that constitute a massive invasion of privacy–as was recognized in a precedent setting decision in 2017 in California in a public records suit against the Los Angeles Police Dept. and Sheriff’s Office on the classification of the data collected as open–and not investigative in nature. The massive datasets that are assembled by the proliferation of cameras and cameras on police cars, even if the “stacked characters” in the plates of many states prove difficult for ALPR software to decode with dependability. The demand to refine tools of surveillance that ALPR uses, however, has only increased attempts to fine-tune license plate readers to improve their possibilities of surveillance.

But the increased expansion of license plate readers suggests a continued expansion of neighborhood surveillance violating the privacy of drivers without their knowledge or consent that constitutes a huge database of street-level surveillance that is increasingly expanding in America. As the public benefits of ALPR’s are touted by law enforcement agencies as large as the LAPD, the movements of drivers have assembled a massive database of increasingly sensitive information that the Homeland Security is increasingly interested in using as a way of “fingerprinting” vehicles of citizens who have not committed crimes, or related to ongoing investigations, based on the technological success of having scanned up over 1.6 billion scans of cars’ license plates in the state of California alone in 2022,– allowing law enforcement to create a “fingerprint” of the movements of drivers, without offering any means to citizens of having this information cleansed or purged.
The result of surveillance on such a massive scale is itself a public safety threat. While the data on movements of such vehicular “fingerprints” are at extremely fine grain, they are preserved in a database that is stored to later identify cars near any protest, abortion clinic, or civil action–but constitutes a huge database of extremely close grain, but hardly encrypted or protected. Such a massive database of the movements of cars may be used to track individuals to expose them to robbery or security threats, and indeed the data stored in each camera is not only vulnerable, but the entire network poses questions of vulnerability that law enforcement never seems to have considered–as it has not considered the invasion of privacy posed by the mandate for scooping up all this data. On the first level of danger, the data is not be protected against ransomware attacks or hackers able to access the data by cyberattacks. At a smaller level, the streaming of data on LPRA The logic of assembling as much information as possible suggests a huge network of surveillance able to be used in other problems, while providing a rich resource that is not protected against vulnerabilities. While ALPR cameras have been criticized as themselves vulnerable to invasive hacking by criminal elements, the expansion of cameras in Washington, California, Texas, Oklahoma, Mississippi, Louisiana, Alabama, Florida, Ohio and Pennsylvania suggests a virtual dragnet of sorts that is being stored for future police work or investigation of police suspects. Yet it is also true that most of the data stored by ALPR cameras in Louisiana, California and Florida are at present connected unsecured to the internet, and are located on publicly accessible websites that if accessed might be used to manipulate the camera controls or siphon off the granular data.

What can be done to protect the privacy of all the drivers of those cars who pass daily across ALPR cameras? An analysis of the metadata and data by the Electronic Frontier Foundation in 2021 found that up to at least 99.9% of this data is entirely not related to public safety threats when collected, the hope is to store a massive database in which criminal license plates can be tracked, mapped, and potentially employed to target future arrests or apprehensions, even if the data was taken from those who were never proven guilty–most of whom are entirely innocent–but whose cars might be tracked by anyone who obtained the raw data, either directly from the police forces or with other agencies and organizations with whom they are shared. The avenues for harassment, stalking, and even kidnapping or extortion and blackmail are huge, if one wants to track the number of, say, wealthy individuals who would be tracked to a position that might compromise them based on data collected for public safety. The data assembled by law enforcement is is a crime waiting to happen.
If the feeds must have been unobtrusively mounted on traffic posts by the Berkeley Police Dept., at bout the same time, the open eyes of neighborhood surveillance linked to local police offered a new tech whose innovation has provided a new market for surveillance of cars, far beyond drugs, as the images of snapped license plates of cars, stolen or not, fills a nation-wide market for surveillance. If the cameras suggested a need for adult monitoring of the streets beside schools, however, or in border line neighborhoods, the market for clandestinely snapped up imagery has provided tools of mapping cars, traffic, and individual vehicles, as huge databanks that these cameras have generated provide a new form of big data for which endless new markets are being discovered–often without any knowledge of the owners of cars who happen to drive by vigilant cameras. We may soon need a set of signs, warning folks that their cars of vehicles may be fed into new information markets in ways that they little suspect, as license plate cameras have become significant intrusive tools on personal privacy.
The ACLU has explored the expansion of crude techniques used by the FBI in mapping American Communities–in a sort of darker side of the illuminating geography of data amassed in the US Census’ American Community Survey. Much as Senator Jon Tester not that belatedly strove to balance his desire for “law enforcement agencies to use cutting-edge tools to catch criminals and protect our borders” with the appearance that such technologies “potentially violate the Fourth Amendment and represent a significant intrusion into the lives of thousands of Americans,” the ACLU has recently mapped a growing geography of surveilling that the FBI has created in recent years that include the very surveillance devices of dirtboxes which Senator Tester, who has quite staunchly supported citizens’ civil liberties, invited Jeh Jenson of the Homeland Security office and the Attorney General to take time to explain to the country.
Senator Tester’s belief that stricter oversight is needed stems from the “extreme lengths” to which federal agencies have so assiduously cloaked such programs in secrecy, his letter of request about the widespread use of dirtboxes that act as cellphone towers to intercept phone communications by both US Marshals and the US Drug Enforcement Agency may well have stemmed in part from the geography of a widespread surveillance program that the ACLU has started to map in the state of California, but which might reveal both the dissemination of military technologies of surveilling across the nation, and the local expansion of the new level of worldwide surveilling recently focussed on and directed mostly toward areas outside the territorial boundaries of the United States. While we are waiting for Mssrs. Jeh and Holder to respond, the arrival of the scope of the mapping of residents of California–or even those traveling in the state–might well give pause if not raise expectations for the scope of what levels of individual surveilling will be revealed. For the map of degrees of surveillance shows something of a microcosm of the extent of the expansion of surveilling ourselves of the very sort that Senator Tester was so rightly wary that he has promised to his best to publicize should it pose so clear a violation of the US Constitution as seems the case, in an attempt to place them under the oversight of both courts and the US Congress in order to restrict their use.
The maps of surveillance that the ACLU has taken upon themselves to provide is not only “cutting-edge” in its use of tools of surveillance but suggest the degree to which law enforcement agencies actively aspire to something along the lines of precognition of which groups might be likely to commit crimes in recent years–as if in a gambit for the foreknowledge Philip K. Dick imagined pre-cogs helping police apprehend criminals before they commit crimes in Minority Report, but based not on the psychical foresight of “pre-cogs” so much as the statistical prediction of categories of probably cause of criminality or value of surveillance that runs against many of our legal traditions. Such snooping for intelligence gathering recalls the sort of racial profiling former which Attorney General Eric Holder (quite rightly) once lent his voice to strongly oppose, following the 2003 DoJ “Guidance on Race”–yet which he incrementally allowed from 2008 for both national security and law enforcement alike. Holder has hesitated to restrict or unmask such activities as an abusive expansion of surveillance over Americans. And he has allowed investigation and surveillance of “behaviors” and “lifestyle characteristics” to be directed at American Muslim communities from New England to Northern California.
These activities have actually continued to expand dramatically over the past decade–including instances of the outright abuse of community outreach programs first initiated to build trust. In a bizarre absorption of such outreach into the apparatus of a tentacular system of state surveillance, the monster seems to have been fed by the deep fears of the insufficiency of procuring further information, and the need to gather it at all costs. In ways that recall the suspension of individual human rights in the use of torture to obtain state secrets–but is directed to monitoring its populations, much as the extraction and mapping of such racial and ethnic data by the FBI’s Domestic Intelligence and Operations Guide (DIOG).
Such crude tools of mapping function by a pervasive sense and logic of invasiveness. We are mapped in ways that lack even the logic or ethics one expects from a government service, it appears, as government services aim to create a sort of all-seeing eye for mapping populations, vacuuming up information in an almost paranoid manner. ACLU’s Chris Soghoian has recently disclosed the existence of widespread surveillance program among US Marshalls across the state of California, including a fleet of airplanes flying from five metropolitan airports dedicated to collecting cell phone data and equipped with dirtboxes to do so–since 2007, that parallel the NSA’s programs of surveillance, now known to be concentrated on the Southwestern border of the US by the DEA, Immigration and Customs Agency, Homeland Security Agency, and FBI.
The degree of widespread and almost routine adoption of public surveillance systems by the government across the United States might be best understood as a sort of surveillance of the everyday, ranging from video surveillance, false cell phone towers, or facial recognition software that offer a range of tools to map populations to a degree never known. The new nature of law enforcement mapping may suggest something like a desperation to agglomerate information, and a deep difficulty to hold back on abilities and technologies to extract information on individual whereabouts, and indeed to track persons where they could not be often seen. The ability to map the invisible, and to try to intercept signals that move through the air, transcends whatever notions of mapping to which we might be habituated, cultivating new abilities of collating information that seem deeply intrusive.

Techniques of mapping populations have grown in their intrusiveness far beyond the mapping of ethnicities, initially pioneered by men like Francis Amasa Walker, that offered a statistical visualization of the demand for more information than most maps can provide. When Walker mapped the nation’s populations from 1873, as Secretary of the Census, he offered a way of reading national space in new ways for public ends as well, potentially, for the needs of the government. The recent mapping of ethnicity and behavior has of course augmented in detail in order to track individuals’ spatial position over time, as well as to chart patterns of individual behavior. The compilation of such an exhaustive map of spatial position has grown for reasons of security, but meets a increasing interest in reading maps of local populations at a level of detail and crude classification renders Walker’s tools of tabulating the composition of the population something of a precedent for enlisting new technologies of surveillance used to create the appearance of safety and quell fears–although the forms of tracking, intelligence gathering, and remote sensing must have created a broad body of map-readers whose charge it is to interpret the massive range of data that is daily culled.

What has perhaps most radically changed is the studied intrusiveness with which such data is culled–and the precision of ongoing surveillance that it allows by a proxy army of drones. stingray tracking devices that mimic cell phone towers to capture identifying information, cameras of automatic license plate recognition and scanners of facial recognition systems to create a state of surveillance that we are only beginning to map.
The quantities of data that such tools amass is suggested by a survey of the layers of procuring information across the state, recently issued by the ACLU to draw attention to their amassing of data without public notice, which seems to complement the large-scale infiltration of Muslim communities. But it goes beyond them, in suggesting a mapping project that monitors daily behaviors and to target individuals by a battery of technologies which abandon and depart from tools of rendering to collate data human minds could not visualize. These technologies cannot but change how space is experienced–and perceived–even if we lack an image of the results that such surveilling will be able to produce, since the master-map will remain inaccessible to our eyes.
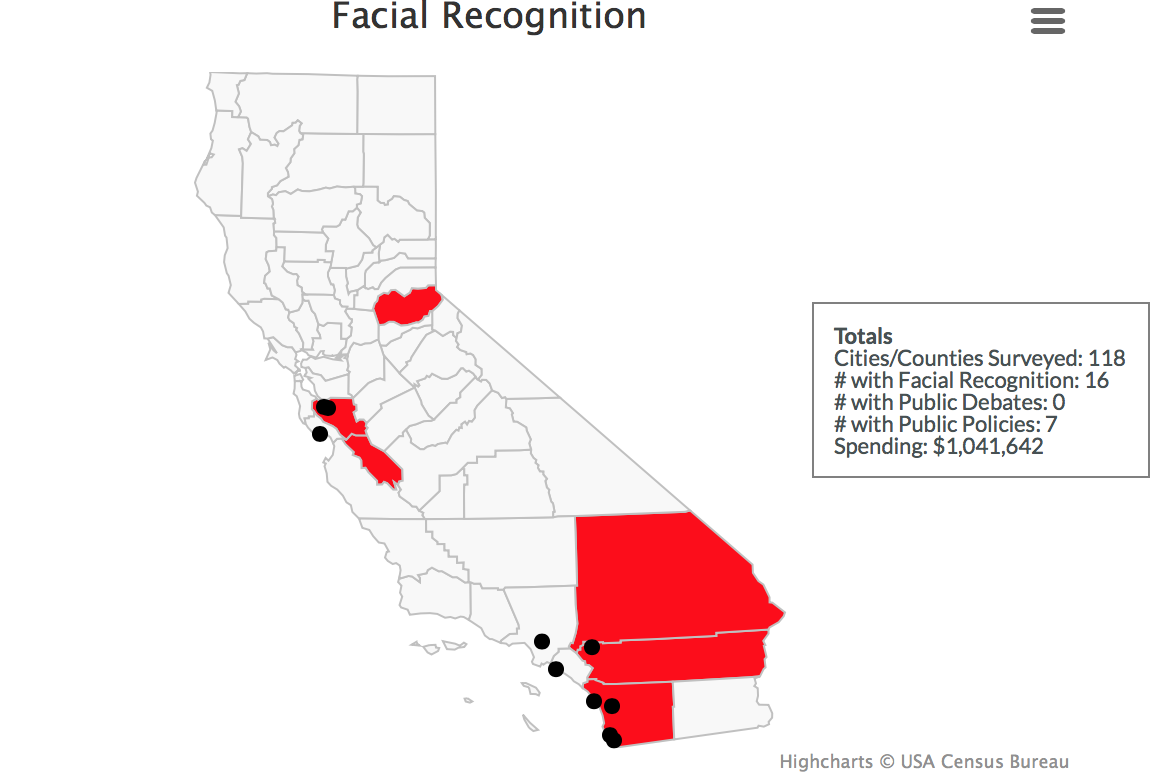
The government money that is directed to maintaining an intensive level of intrusive surveillance of the everyday across the state of California alone has been mapped by the ACLU in interactive form to allow comparisons between levels of surveillance that exist in California’s communities and fifty-eight counties. The map was appositely issued together with both a community guide to resist intrusive surveillance technologies whose use has so dramatically expanded, oriented to different technologies currently used, and its initiation of a statewide campaign against abuses of intelligence gathering that use drones (used in three counties or cities), body cameras (used in thirty-two), tools of facial recognition (used in sixteen) or video surveillance (used in sixty-one–roughly half the number of cities and counties surveyed).

Highcharts/US Census
That’s right, the cost of such surveilling of the state? Quite a bit over $18 million.
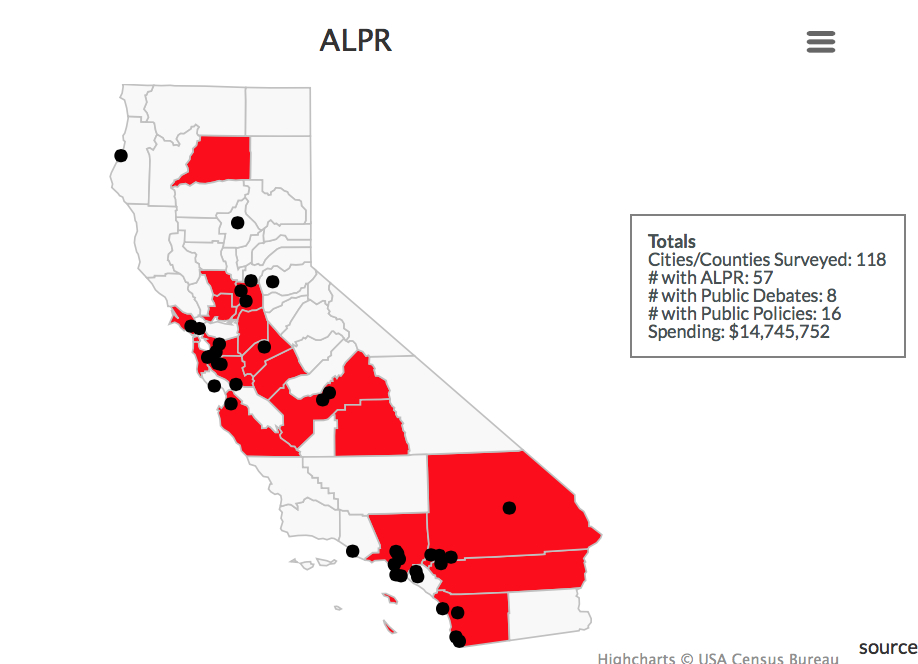
The number of states and counties using Automatic License Plate Recognition, a particularly invasive mode of monitoring populations on the road that comes at only a slightly lower cost, is similarly quite expansive (fifty-seven), suggesting the broad range of areas that are subject to surveillance in California’s largest cities and (interestingly) the Central Valley:
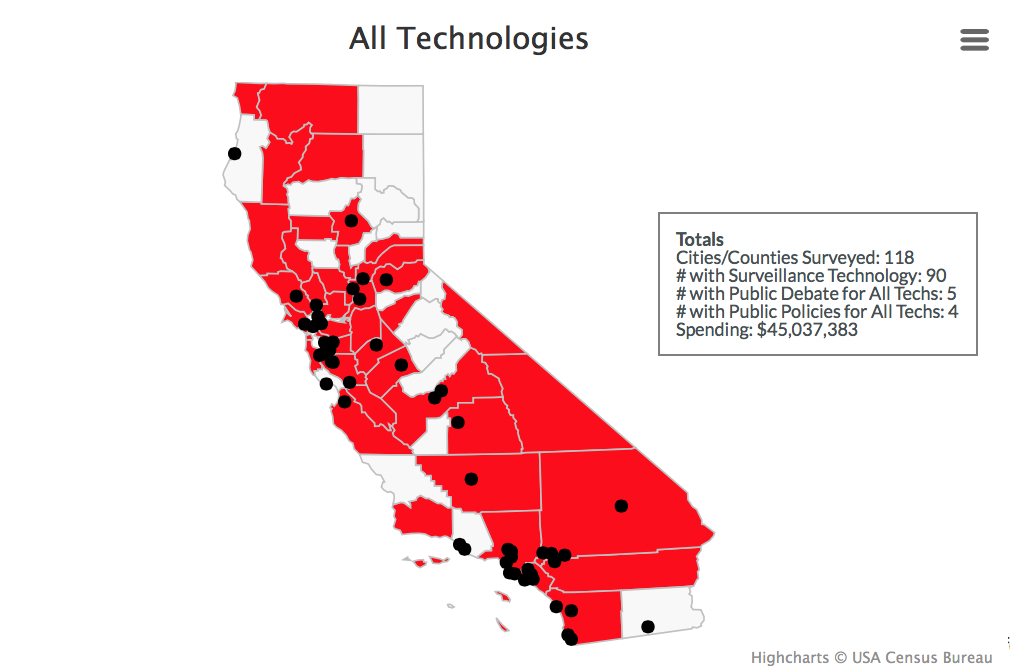
Grouping the technologies, Attorney General Kamala Harris, the state seems strikingly well covered for less than $50 million of your tax dollars:
While Facial Recognition techniques are concentrated in mostly in the Southlands, it augurs a particularly invasive form of individual mapping, whose apparent concentration on questions of immigration may be destined to expand with time beyond the sixteen counties and cities where it is used currently.

Although we have focussed on the technologies purchased by local police in Ferguson MI, we have done so perhaps ignored the spending spree on body cameras by local authorities across the nation. Uncovering the considerable expenditure of some $64 million on mapping the whereabouts of potentially suspicious individuals poses a new level of government invasiveness across the state.
The ACLU has created a specially designed checklist for local governments and authorities across the country to consider, before adopting technology that we associate with the NSA. Such advanced technologies, enlisted as useful without clear oversight practices having evolved or being instituted, or even with public notice being given, have been seem designed to create a comprehensive map that echoes, in microcosm, the state of surveillance we’ve been learning about increasingly this year. Stingray technologies, able to track a person’s location based on cell-phone signals, are a high-precision level of mapping, already adopted in twelve counties or municipalities including by police in Oakland CA, are increasingly widely used by police throughout the United States in fifteen states, the adoption of which can be tracked interactively, if you are planning on Thanksgiving travels and would like to know. (And it’s not only the government that is now in the business of using cellular interception technologies for the ends surveilling, we’ve been recently reminded, lest this sort of snooping only be understood as a top-down activity, rather than a widely available software for intercepting unencrypted calls long considered private by means of a radio scanner.)

ACLU invites members and non-members alike to send email letters, with the subject line “Don’t Map Me or My Community,” to express their desire to help restrict such intelligence-gathering and mapping tools that are regularly based on practices of ethnic or racial profiling, and set new standards for invasiveness. NSA has long been doing this sort of tracking worldwide, but the intrusive mapping of populations across the US has come home to roost.

Surveilling is a backformation dating from the 1960’s from “surveillance.” Its use has, however, unsurprisingly really taken off recently, even if it has crested from about 2000, as databanks of license plate information are sold on the open market. In may ways, the omniscient folks at Google let us know . . . and the question that this post might principally pose is just how much it is destined to further grow in common usage and in ubiquity in the physical world.
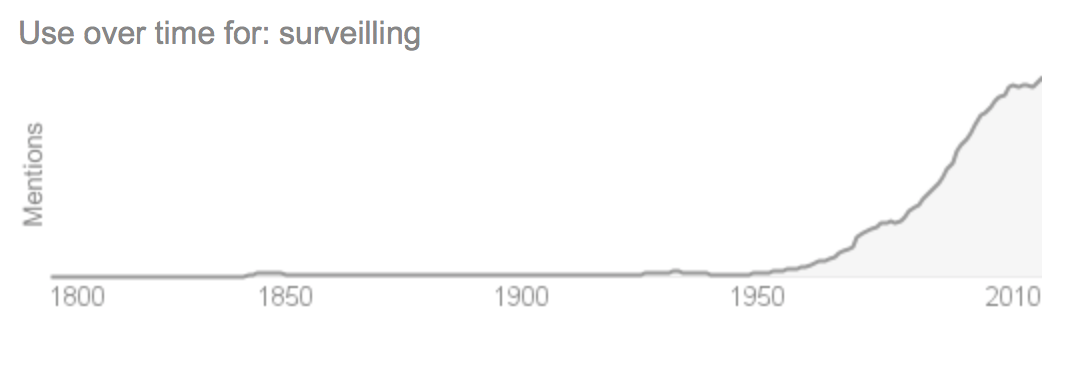
Increasingly, this is the State of the State, a growth of the postwar national security apparatus, perhaps, but a rapidly escalating compilation of tracking that has been normalized since 2000.


