
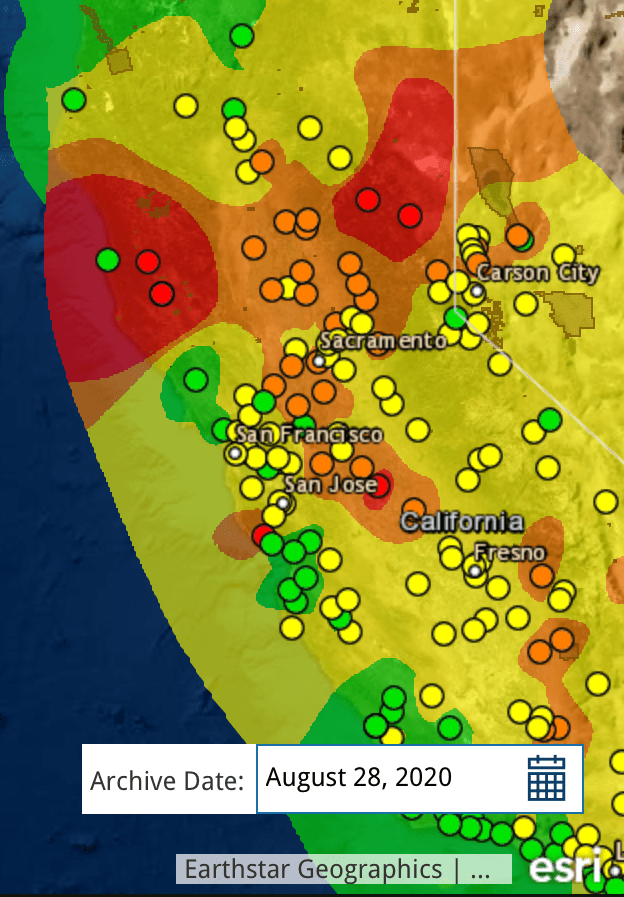
We think of earth, wind and fire as elements. Or we used to. For the possibility of separating them is called into question in the Bay Area, as wind sweeps the smoke of five to seven fires, or fire complexes, across the skies, we are increasingly likely to see them as layers, which interact in a puzzle we have trouble figuring out. Indeed, the weirdly haunting daily and hourly maps of air quality map the atmospheric presence of particulate matter by isochrones brought late summer blues to the Bay Area. Blue skies of the Bay Area were colored grey, burnt orange, and grey again as cartoon plumes of soot flooded the skies in a new sort of pyrocumulus clouds that turned the sun red, offering a disembodied traffic sign telling us to stop.
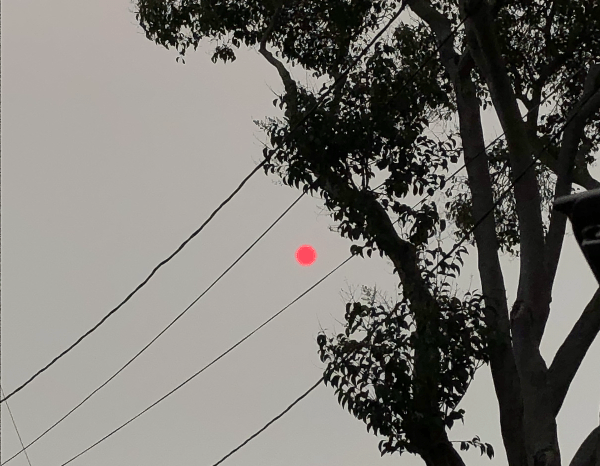
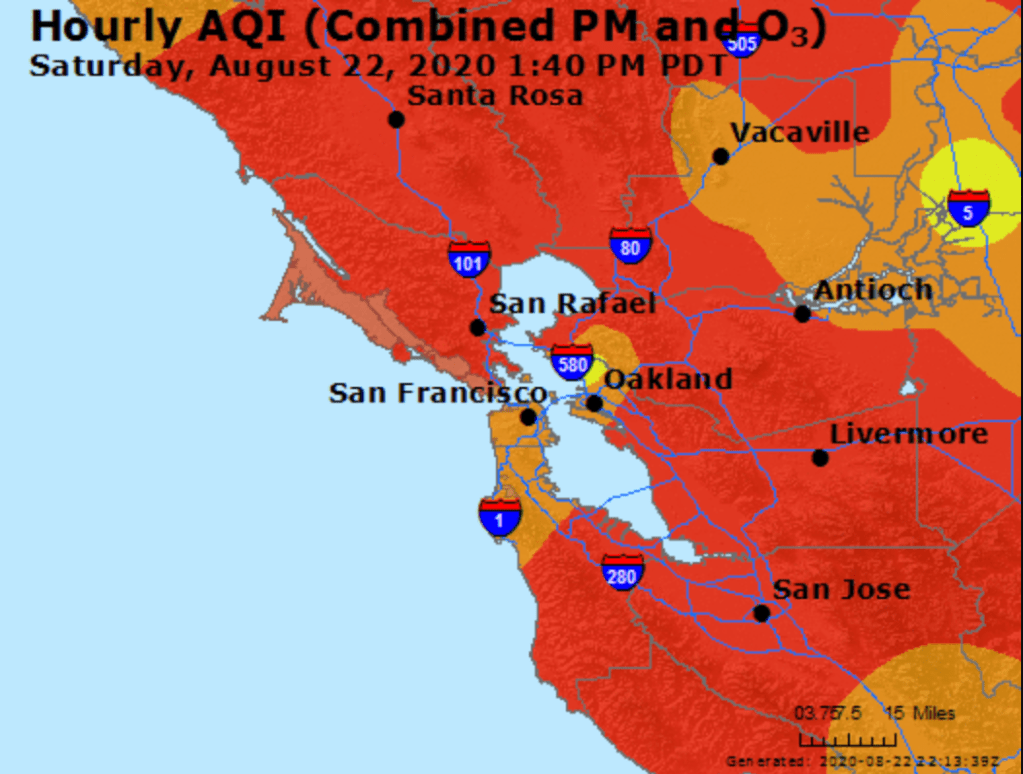
Fire season began by remapping the town in terrifying red that registered “unhealthful,” but almost verging on the “hazardous” level of brown, based on local sensors monitoring of ozone, but is also registering a deeper history defined by an absence of rain, the lack of groundwater, the hotter temperatures of the region and the dry air. The map is both existential, and ephemeral, but also the substrate of deep climate trends.
Is fire an element we had never before tracked so attentively in maps? We did not think it could travel, or had feet. But wildfire smoke had blanketed the region, in ways that were not nearly as visible as it would be, but that the real-time map registers at the sort of pace we have become accustomed in real-time fire maps that we consult with regularity to track the containment and perimeters of fires that are now spreading faster and faster than they ever have in previous years. And soon after we worried increasingly about risks of airborne transmission of COVID-19, this fire season the intensity of particulate pollutants in the atmosphere contributed intense panic to the tangibility of mapping the pyrocumulus plumes that made their way over the Bay Area in late August. As the danger of droplets four micrometers in diameter remaining airborne seemed a factor of large-scale clusters, the waves of black carbon mapped in the Bay Area became a second sort of airborne pathogen made acutely material in layers of real-time Air Quality charts.
The boundaries of fire risk charts and indeed fire perimeters seemed suddenly far more fluid than we had been accustomed. When we make our fire maps with clear edges, however, it is striking that almost we stop registering the built environment, or inhabited world. As if by the magic of cartographical selectivity, we bracket the city–the sprawling agglomeration of the Bay Area–from the maps tracking the destructiveness and progress we call advancing wildfires, and from the isochronal variations of air quality that we can watch reflecting wind patterns and air movements in accelerated animated maps, showing the bad air that migrates and pool over the area I life. The even more ephemeral nature of these maps–they record but one instant, but are outdated as they are produced, in ways that fit the ecoystem of the Internet if also the extremes of the new ecosystem of global warming–the isochrones seem somewhat fatalistic, as they are both removed from human agency–as we found out in the weeks after the Lightning Siege of 2020 that seemed a spectacle of the natural world that rivaled the art of Walter de Maria in their grandiosity of time-lapse photography–
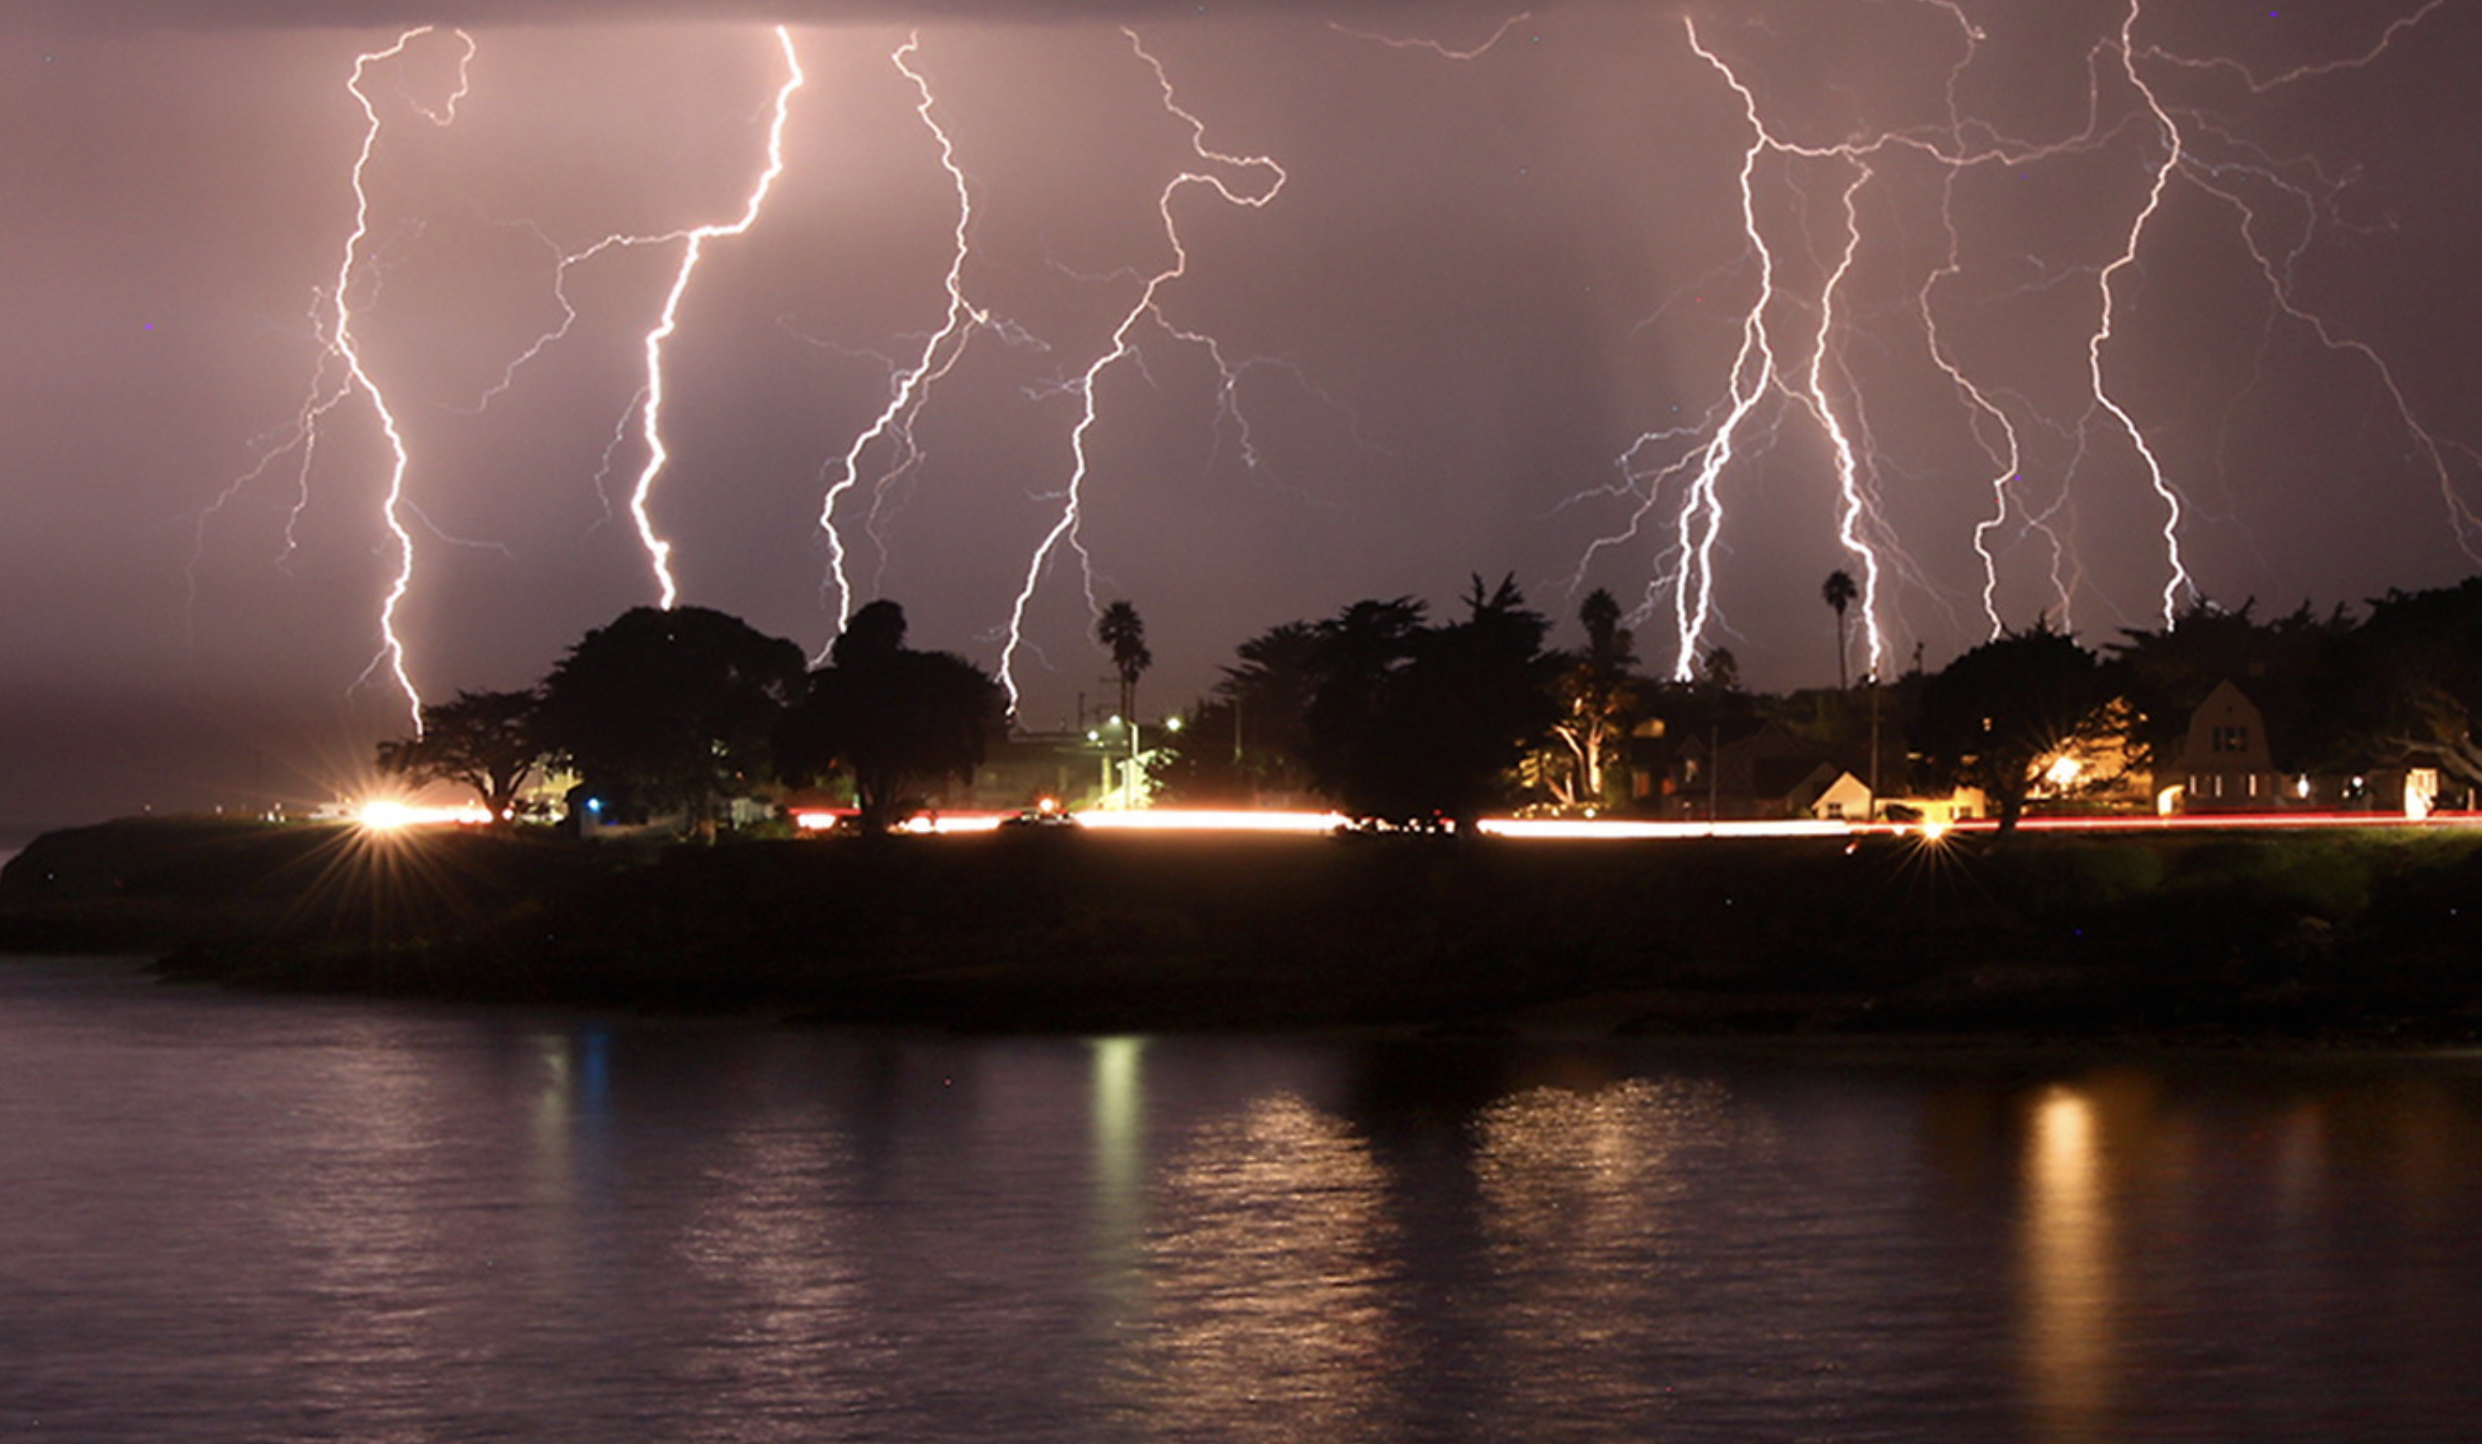
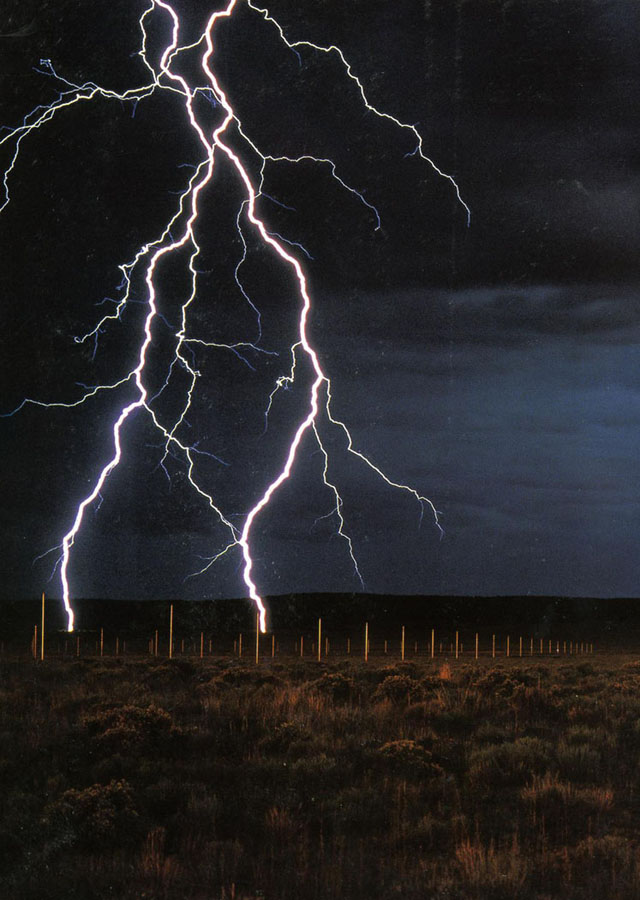
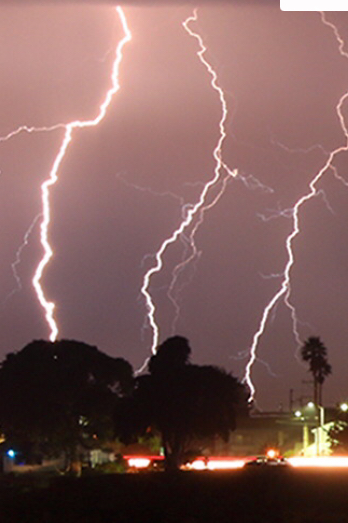
–the horizontal line of artificial light from Santa Cruz, unlike the images that De Maria created from The Lighting Field, remind us of the overlap between inhabited spaces where conflagrations in the dry wildlands that spread as the fires struck, and in way far less difficult to aestheticize than The Lightning Field set in a desert removed from human population, but was built as an isolated field for time-stop photography.
The CZU complex brought widespread devastation across areas of extra urban expansion in the Santa Cruz Mountains was almost a map that registered the expansion of residences to the very borders of forests. We haven’t ever faced the problem of maintaining and clearing in weather this dry, even if we have mapped the clustering of fires in the wild land-urban interface: but the strikes ignited underbrush lain like kindling, on the boundaries of the raging fire complexes. If the burning of underbrush by fire mitigation squads seeks to create fire lines in the mountainous landscape to create new perimeters to forestall the advance of major fires, working along a new fire line even as what is still called wildfier smoke travels across the nation, far beyond the Bay Area.
While watching the movement of fires that them in inhabited areas like shifting jigsaw pieces that destroy the landscape across which they move. These marked the start of megafires, that spread across state boundaries and counties, but tried to be parsed by state authorities and jurisdictions, even if, as Jay Inslee noted, this is a multi-state crisis of climate change that has rendered the forests as fuel by 2017–for combined drought and higher temperatures set “bombs, waiting to go off” in our forests, in ways unable to be measured by fire risk that continues to be assessed in pointillist terms by “fuel load” and past history of fires known as the “fire rotation frequency.” When these bombs go off, it is hard to say what state boundary lines mean.
If San Francisco famously lies close to natural beauty, the Bay Area, where I live, lies amidst of a high risk zone, where daily updates on fire risk is displayed prominent and with regularity in all regional parks. These maps made over a decade ago setfire standards for building construction in a time of massive extra-urban expansion. But risk has recently been something we struggled to calculate as we followed the real-time updates of the spread of fires, smoke, and ash on tenterhooks and with readiness and high sense of contingency, anxiety already elevated by rates of coronaviurs that depended on good numbers: fire risk was seen as an objective calculation fifteen years ago, but was now not easy to determine or two rank so crisply by three different shades.
When thunderstorms from mid-August brought the meteorological curiosity of nearly 12,000 dry lightening dry strikes from mid to late August 2020, they hit desiccated forests with a shock. The strikes became as siege as they set over three hundred and fifty-seven fires across the state, that rapidly were communicated into expansive “complexes” of brush fires.
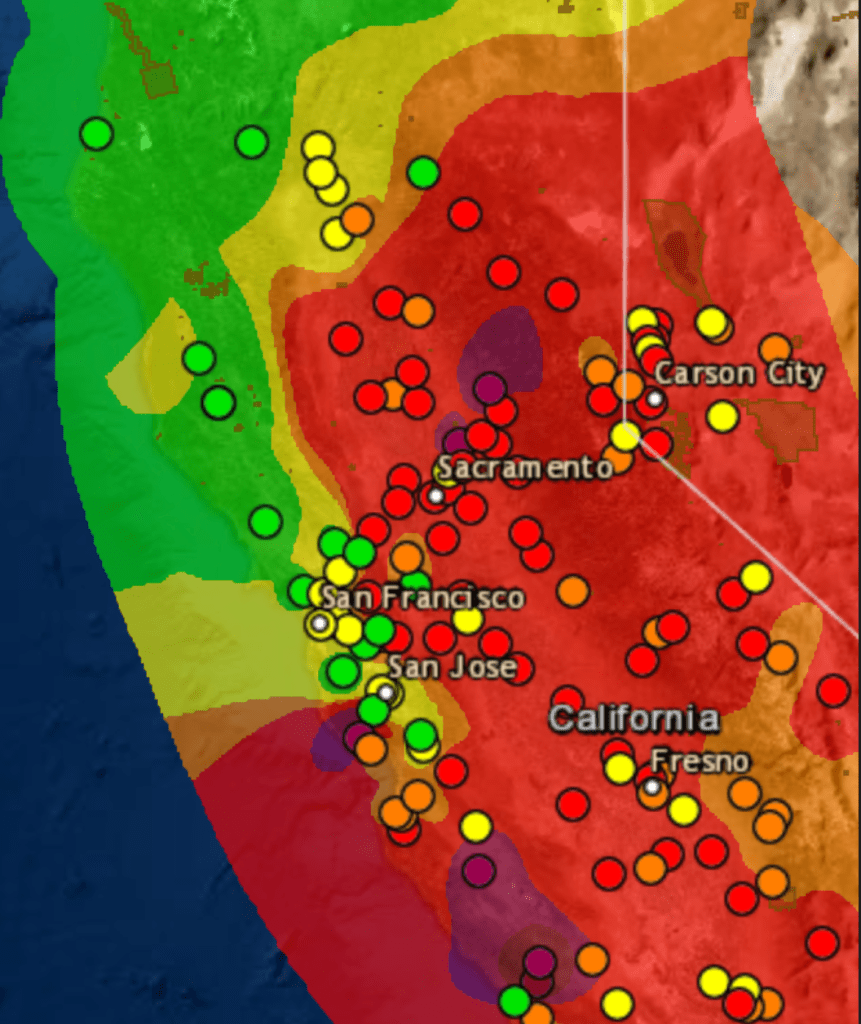
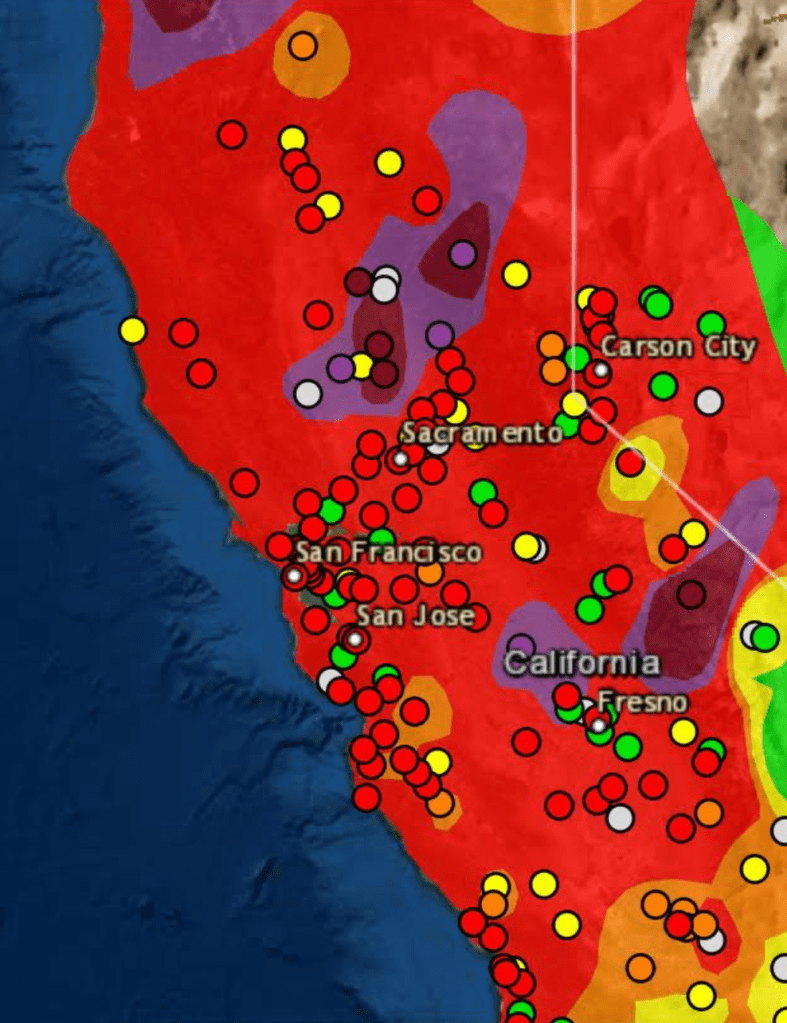
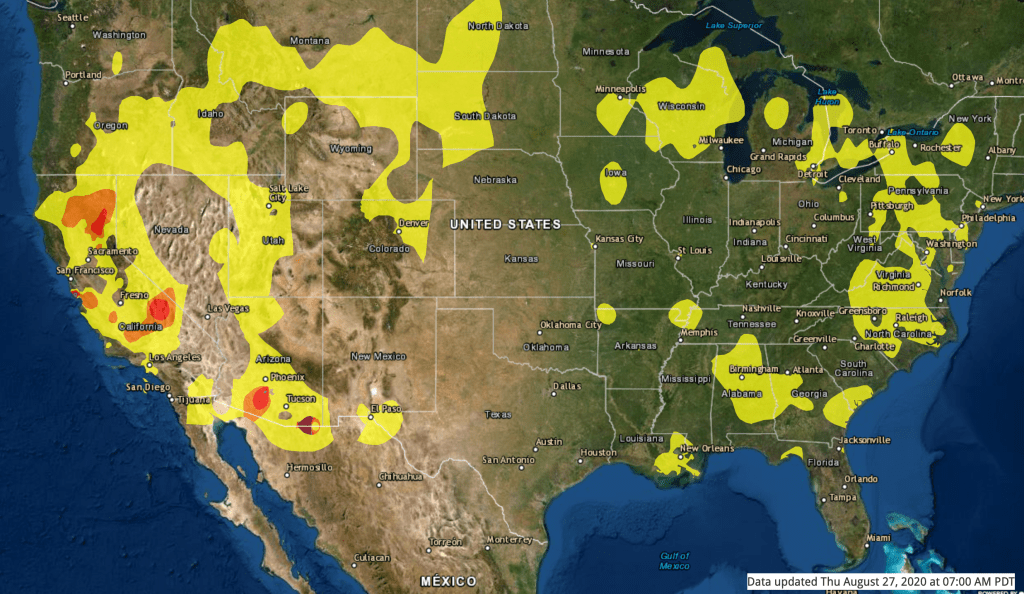
We map these fires by state jurisdictions, and have cast them as such in policy, by borders or the perimeters we hope to contain barely grasp the consequences of how three quarters of a million acres burned up suddenly, and smoke from the cluster of fires rose in columns that spread across state boundary lines as far as Nebraska, and how fire complexes that spread across three million acres that would soon create a layer of soot across the west, eerily materialized in layers of GIS ESRI maps of environmental pollutants, while toxic particulate mater released in plumes of black carbon by the fires cover the state, rendering the sun opaque where I live, in the Bay Area, now Pompeii by the Bay as smoke at toxic levels blanketed much of the state.
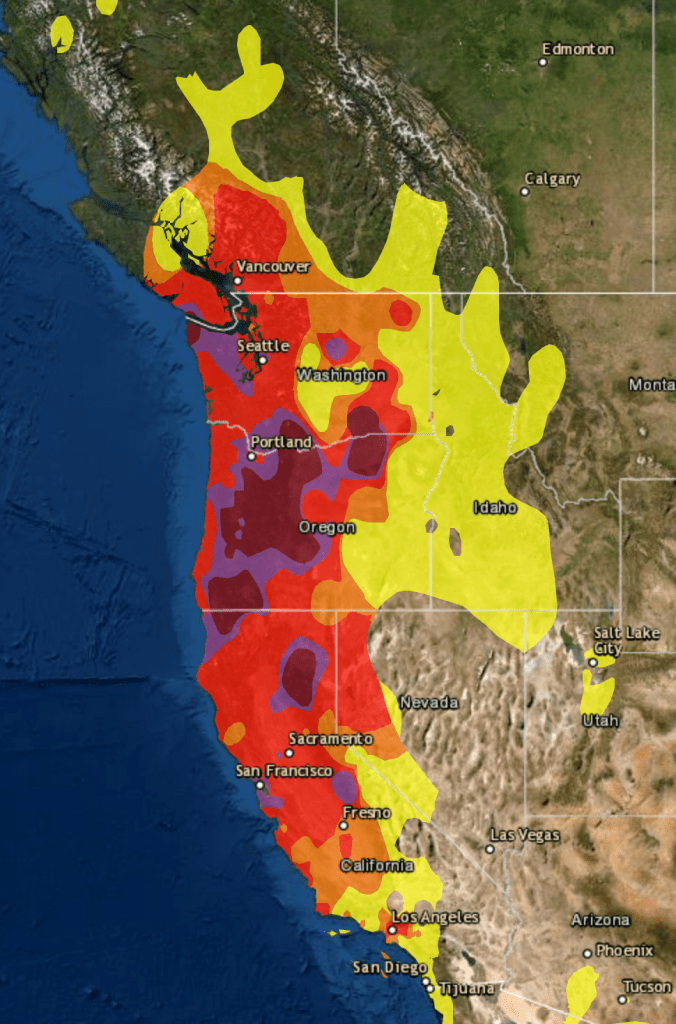
They even more serious map, to be sure, was of fire spread: but the maps of air quality set the entire western seaboard apart from the nation, as if threatening to have it fall into the ocean and split off from the United States,–even if the burning of its open lands was more of a portent of things to come, they were a historical anomaly, lying outside the record of fire burns or air quality, if the poor air quality traced the origin of black carbon columns of smoke that would rise into the nation’s atmosphere.
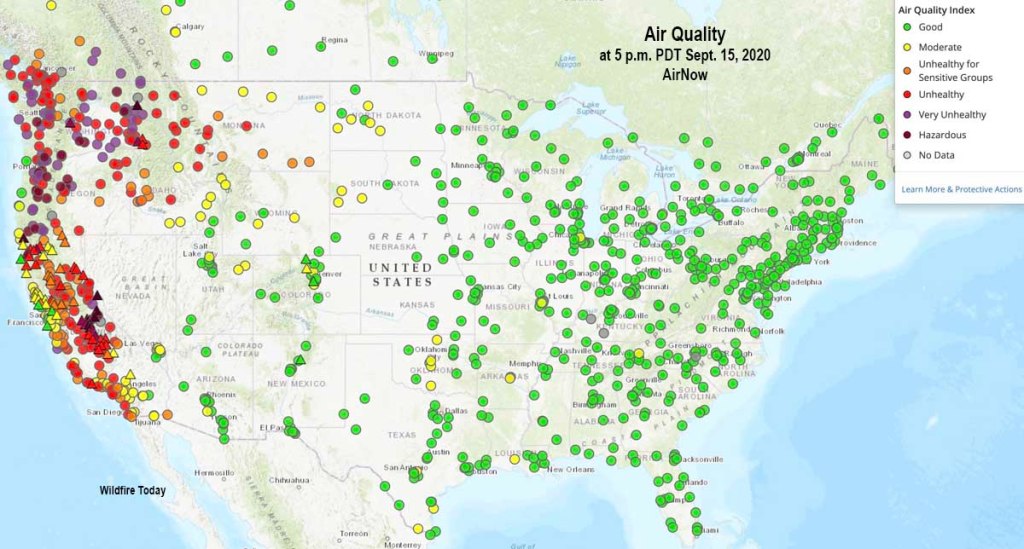
The boundaries of the state are erased in a regional calamity, as particulate matters hovers, as if an animal that has pounced on the state. But when they hit, the strikes seemed to be able to be contained, almost, optimistically, as they seemed to be pools of localizes carbon releases, terrifying, to be sure, but at a terrifyingly close remove from the Bay Area as well–in the EPA maps that we saw through the contours of individual air monitors that are stationed across the state, and provided a counterpart to the satellite maps of the fires’ burn perimeters.

–even as the fire complexes uncontrollably grew, and spewed carbon over an even greater area, pushing “green” air of low particulate matter and ozone to the coast or odd isolate points that might be argued to be the true “perimeters” of the fire.
We were foolish to think effects of the massive fires might be localized in their broad effects in earlier days, but the shores seemed more save, and less devastating in spread, just three days earlier, against the USGS topo maps that look so placid–even as we feared the worst from the complexes to the north and south, as well as on the edges of the Sierras.
Even after a week, we believed the boundaries of fires could be contained, as we hoped for localized fires at the end of August, not because they were not intensely toxic to so many, but because they were not yet blanket the entire state in ash and micro-particles that made eyes burn even from afar–
–as they seemed to be turning a week earlier, by August 20, before dry winds spread the brushfires that were burning from lightening strikes sent more smoke spewing statewide as more fire consumed dry brush.
While questions of “control” of the fires are surely paramount, the impossibly of confronting how climate change lies beneath these image. To grasp the shifts of this topography of smoke, we would have to admit climate change is the unseen actor that has invited the current spread of fires and fire smoke beyond what any fire-fighting team could contain–this actor remained for a time off the table, and impossible to process. And the story hardly ended as particulate matter from fires across the western states blanketed the entire state, and Bay Area, in ways that reminded us there were no firm lines and all boundaries of fires bleed.

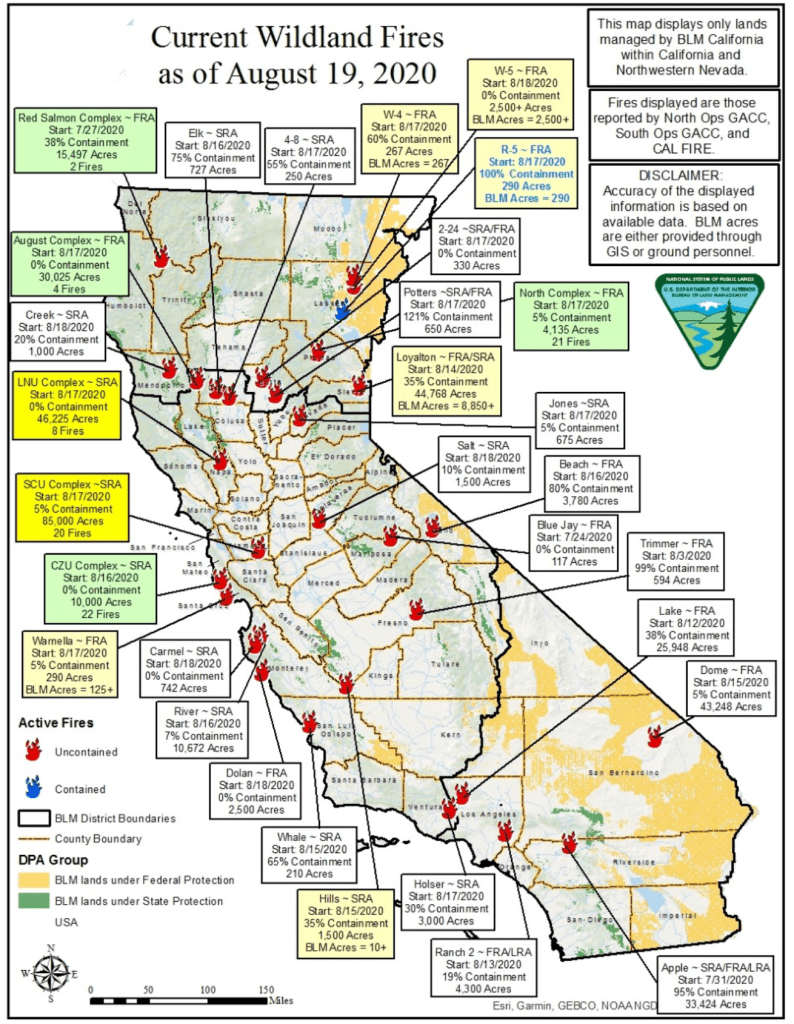
This map is hard to compare, but demands comparison, to parameters of the fires themselves, whose identification as “complexes suggest the impossibility of seeing the consequences of lightening strikes as localized.
Scores of individual fires during the lightening siege seemed to converge in ways that were exceedingly difficult to combat–and even disorienting to map, as they presented a bit of different beast–as fires multiplied across the map that we can no longer understand as static. Seven hundred thousand burned acres surrounded the Bay Area, as complexes of fires spread through the woods, and would be fanned by hot winds in western states across three million acres–an expanse burned with consequences barely imagined to be reckoned or mapped–although the local state maps of fire perimeters was more eye-popping and captured the intensity of their combustibiltiy.
But even the initial perimeters of ire complexes that the 72-hour lightening blast ignited created an onslaught whose onset started fires that seemed to endanger local residents again with pressing alarm, as we watched the fires that spread with alarming immediacy, and bad air spread in plumes across the more densely inhabited areas, as fire-fighting resources were spread thin in attempts to contain them., even as fires had already spread by August 24 to a larger area than the Grand Canyon.
The challenge of their containment efforts were challenged as the LNU complex in Sonoma and Napa stood at only 22% containment but fire fighters were “feeling confident” while the raging SCU complex near San Jose stood at 10% containment, and growing marginally. Fires were only expected to grow as fires spread over a climate change emergency in land filled with dry underbrush where old forests offered huge loads of fuel in immediate vicinity, and forests had been poorly tended or maintained. While the containment of initial complexes was the immediate focus of attention, attracting much initial mapping, by a composite of satellite views and land-mapping, offering real-time maps of the fires’ spread, the boundaries of fires grew increasingly unclear as they proliferated and were spread by hundred-degree winds across by the end of the month.

We seek to gain better situational awareness of the fires and its contours, or particulate matter that spew from the fires in black carbon plumes, but the fire is difficult to map with definite, despite the attention to the perimeters of fires we track in real-time maps. In an age of increased vulnerability, the edges of the fires–the fires, the fires–are not clear, as they blaze through dried out brush that has not been maintained, spreading in what are now multiple “fire complexes” across the Bay Area, and their soot-laden smoke bears black carbon across the region and the entire country, threatening to settle in our lungs which we now all feel with heightened sensitivity.
We are increasingly able to contain fires with considerable quickness, arriving quickly at a fire site to map its extent, allow it to blackburn areas of deep undergrowth, but contain its spread of the fire to large fuels, or a full fuel load, the problem of a failure of maintaining forests by fuel reduction faces increased challenges with the growing combustibility of dry forests and wildfire intensity. As record-breaking temperatures of 100 to over 120 degrees were set across the state, the spread of fires was a consequence of increased danger, that fire perimetes’ rapid advance only reflects.

In moving smoke from the fire perimeters of real-time maps tracking the contours of airborne particulate matter, winds push black carbon into striking proximity with settled space, and the soot that settles over the area, we stand at an odd remove of the ways that fires both stand to change radically the relation to the landscape in which we live, and reflect the ways that we have changed the landscape, in ways we are still trying to come to terms in trying to measure their levels of destruction. The recent spate of fires across California seems mapped to illustrate containment of their their violence, perhaps, or provide bearing on it, by creating a map free of needless noise, and uncluttered, even as dense clouds of black carbon smoke flooded the state from late August, growing intensely unhealthy across a large region of the state’s Central Valley, floating inland, and dispersing in clouds out to sea, far beyond the fires localized in maps of the fires’ footprints and perimeters.

While Air Quality standards have existed since 1968, based on ambient pollution, intended to calibrate the health of the atmosphere near industrial sites by synthesizing a range of pollutants, rarely has air quality shifted over such a large rural, agricultral, and urban expanse. And rarely have concentrations of ozone, carbon mnoxide, sulphur dioxide and clouded of small particulate matter measured over more than days or hours, let alone over multiple weeks. Sustained exposure to particulate mater of less than 109 microns that enter the lungs and bloodstream are linked to asthma, poor lung function, and heart disease; but the sustained exposure to fine particulate matter air pollution is of concern not only to at risk populations in an age of coronavirus.

But the focus on footprints of recently active fires across the state risks disembodying the burns and burn rates from the broad place they occupy in the region’s ecology, which real-time maps were busy sorting out for nearby residents as they came to term with the fires’ imminent spread. Can they be reconciled with the destructive effects of the fires’ spread?

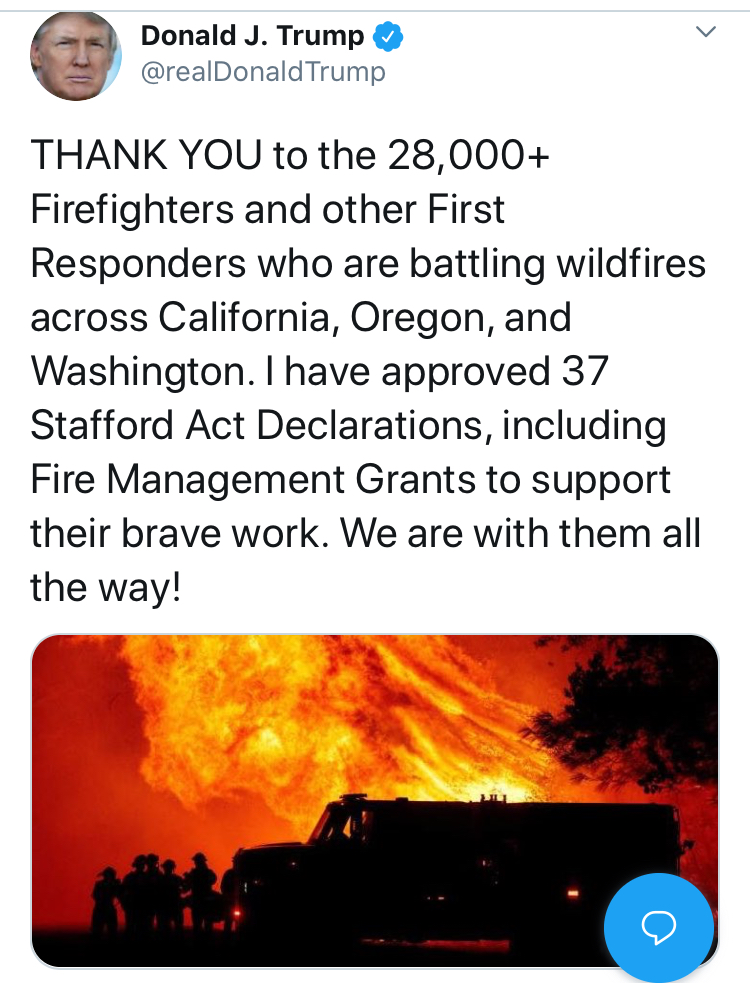
While we read about the possibility of containment lines about the fires, and viewed the advancing perimeters with apprehension, over the next few days, the striking change in air quality that we perceived in the East Bay on the ground suggested the broad diffusion of the fires’ consequences in ways we have not fully mapped–if often observed in real time, let alone managed so many fires at one time across multiple states. And when our Chief Executive decided finally to notice the burning up of the west–the very states that had created a climate compact to remain in the Paris Accords of 2017 that Trump had trashed–he avoided the massive scale of the tragedy or its underlying conditions which he suggested he met by providing states with disaster assistance, using a cheap photograph of the fires that seemed amnesiac in its relation to combustible landscape that helped the fires to advance across space so rapidly this time, driven by hundred degree winds, or the dried out brush that lay in forests that were themselves filed with high fuel loads.
Facing the fires go far beyond bravery or readiness, but wrestle with a pervasive failure of preparedness–a task we have not met, but that is also a moving target of sorts in an era of climate change: there is no level of clearing brush that meets the current need to clear desiccated grasses and underbrush that have faced both hotter temperatures and a sustained lack of groundwater of the likes we have not earlier seen. We watch the epiphenomena in the fires, and black carbon to which the grasses and fuel loads of forests have been reduced, as if to trace the atmospheric residue of habitats that are now up in smoke.
Of course, this is also the air we breath, so we consult these maps not for a sense of where to go–there are few spaces one could drive, or would make sense to drive, to evade the smoke–but how well our windows should be sealed and outdoor activities restricted. And we depend on how these maps aggregate information from the range of sensors on which they are based–are any broken? do they ever break?–to create the smooth contour lines that trace an atmospheric landscape, as it were, in real layers that exist over the natural topography that is still glimpsed below in green, but that exists as an ESRI layer atop the world we inhabit. Of course, the air is visible in the atmosphere for those on the ground, but there is no clear way of registering it than in terms of the indices of safety that were developed when daily measurements AQI was first measured, with the Clean Air Act, and 1977 amendments dedicated to monitoring air pollutants called fro daily analysis and reporting of air quality based on a uniform index: while indexing the air developed from toxic or hazardous industrial pollutants–chlorine; asbestos; hyrochloric acid; hexane–that one would never want to breath.
Woodsmoke was not monitored in residential areas until 1999, but the blanketing of the region with ozone presents a proxy of poor air pollutants blown into the region. The monitoring of wildfire-smoke for particulate matter able to lodge in the lungs and blood stream, with long-term respiratory effects, is tiled in intriguing real-time maps of an almost existential nature: airborne pollution arrives in gusts, blows out to sea, or migrates over space a map tiler can synthesize and track, in almost too much information about the fires that are raging elsewhere in the Sierras or even nearby, in the Santa Cruz mountains, Napa, and Nevada City, but blanketing the region in black carbon that obscures the sun.

It is scary to live under a grey sky. We turn to maps to interrogate the health consequences of fires that blanketed the state in an era when we are suffering from containing the spread of COVID-19 seemed eerily and tragically parallel, as they intersect in our respiratory systems, that demand their own public health maps, as the contour lines of particulate placed the state under a blanket–despite isolated pockets– of bad air.

The possibility of containment and clear edges is increasingly revealed by the range of maps by which we watch fire advance in the Bay Area. For the complexes of lightning fires–surpassing the acreage burned in a year during the modern era, and the total land burned in fires of 2018, as 2,094,955 acres destroyed would grow to over 2,200,000. The incineration of that acreage sent smoke across the nation, and a dense cloud over our houses, often turning the sun a deep red by September, as the cumulative impact of fire complexes around the area that sent many to correlate regional sampling stations of air quality with a new sort of weather map that maps the effects of the lightening fires’ duration over space.


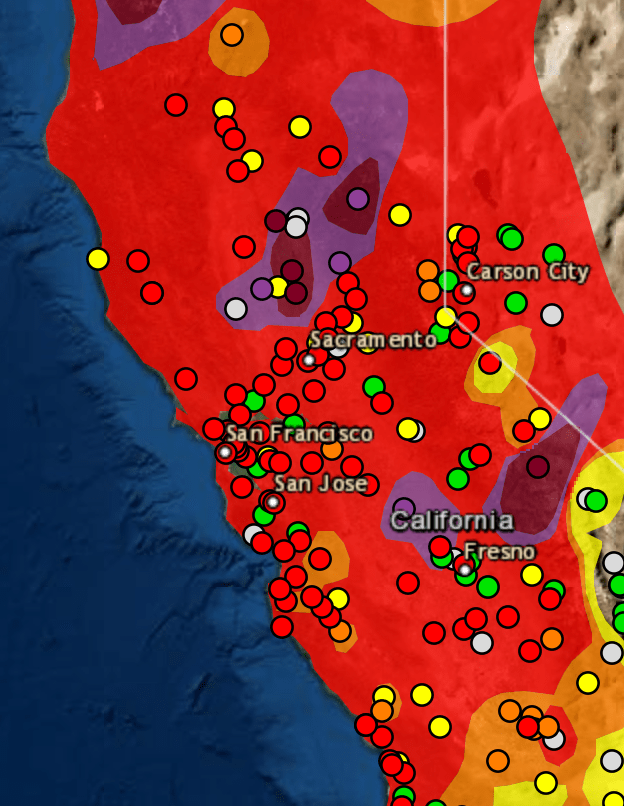
By September 11, 2020, the anniversary of an event whose tragedy we never thought would be repeated, we were surrounded by very unhealthy air across the Bay Area, whose layer imposed itself on the region as if it traced the outline of the future of extra-urban development of the super-urban expansion that one might soon anticipate–

–and the expanse of unhealthy air, filled with small particulate matter, stretched far across the entire state.
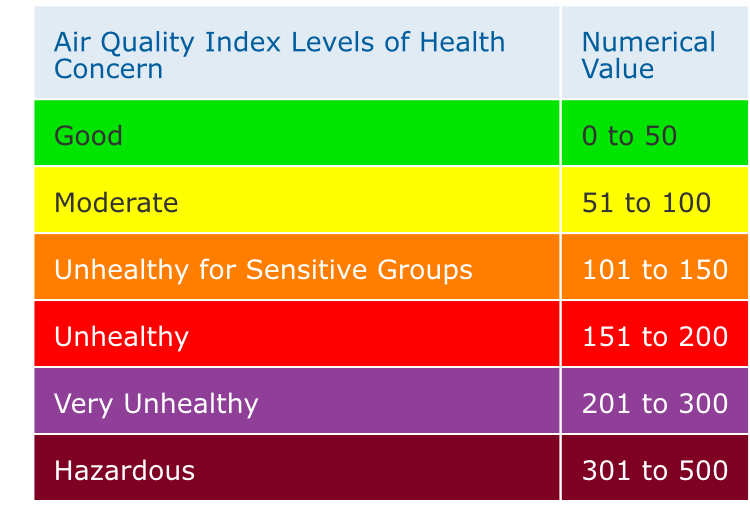
The climate of the entire state has been altered by these fires, not only by the destruction of property and acres of forest burned, but the release of black carbon particulate matter across the state over a period of days. Is not the worsening air quality around the spate of lightning fires that struck California in early September, part of a new landscape of fire? Even after the diffusion of much smoke over the ocean, we are waiting for it to blow back to the shore, as more and more acres burn–exposing us to levels of black carbon soot in a more sustained way than any models have imagined over multiple days–let alone weeks. And if the levels of moderate or unhealthy air are particularly dangerous to those with heart or lung conditions, diabetics, or children, the long-term effects of low air quality over time pose problems that are less well known in their long-term health effects, while the threshold for “unhealthy” air of over 150 ppm can be severe for sensitive groups even after a day. More importantly, perhaps, in an era of coronavirus, the respiratory problems that poor air could trigger might more seriously aggravate respiratory problems, and even cause more widespread dissemination of COVID-19.
The duration of this fire season, and the unsure resolution of the expanding range of the current spate of fires whipped up by dry winds suggest a problem of long-term exposure to carbon whose huge clouds and plumes converge across the skies. Even if the fires were not lying in proximity to inhabited areas, the smoke and poor air quality flooded the area. And the fact that drier than ever forests have been without any active management to mitigate fire hazard over time–a problem that is compounded by the absence of any U.S. Forest Management strategy–the combustibility of land has grown, leaving us to map not only the fires spread but the relation of fires to the winds that have fanned their spread out to sea, as well as the smokey plumes that have settled across the state.
We summarize a set of simple principles important to address in fuel reduction treatments: reductioAlthough sites of human settlement are oddly absent from the maps of the contours of smoke that spreads across the state, we watch the advancing perimeters of multiple fire complexes move across dried brush, leaving much of Northern California increasingly pock marked with fires and fire boundaries, as we smelled the acrid taste of ash in the surrounding air, which tried to orient viewers the destructive fires that had broken out across the region.

As we watched the fires, wondering about the spread of fire complexes that suddenly appeared on the map, we felt their devastating effect as soot pooled in the entire Central Valley from the black carbon they released. In ways that led us to question the coherence of our community, yet again, and the boundaries of our community, the maps both generalized heightened senses of vulnerability and of the fragility of a spate of lightning fires that had spread across the state, threatening to erase what was once seen as an island whose landscape was idealized–and threatening to undermine the coherence of the community and state. The recurrence of a spate of fires that were mistakenly and arrogantly called “wild” were yet another disaster of climate change for which the state was not ready, fed by the rapid burning of underbrush in forests, analogous to the destruction of Australian underbrush in the apparently spontaneous explosions across the landscape.

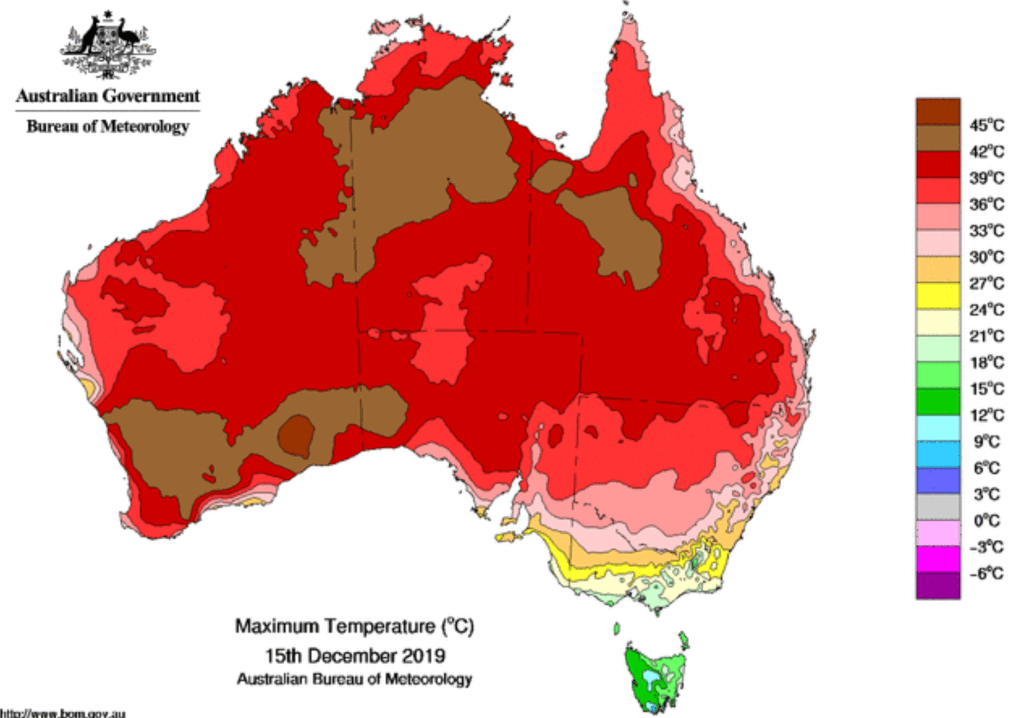
Increased firefighters were brought from outside the state in hopes to control, map, and create fire lines around their spread, coming from nearby states and even from Australian, its southwest coast recently ravaged by a series of burns the spread with fires of desiccated brush. If they were begun by lightning strikes that shocked the state in a fortnight, was their occurrence not similar to the spate of brush fires the destroyed regions of Austrlia’s eastern coast, near New South Wales, whose spread had inaugurated 2020 as a year of the apocalypse, and seemed poise to consume much of the greenspace on the subcontinent?
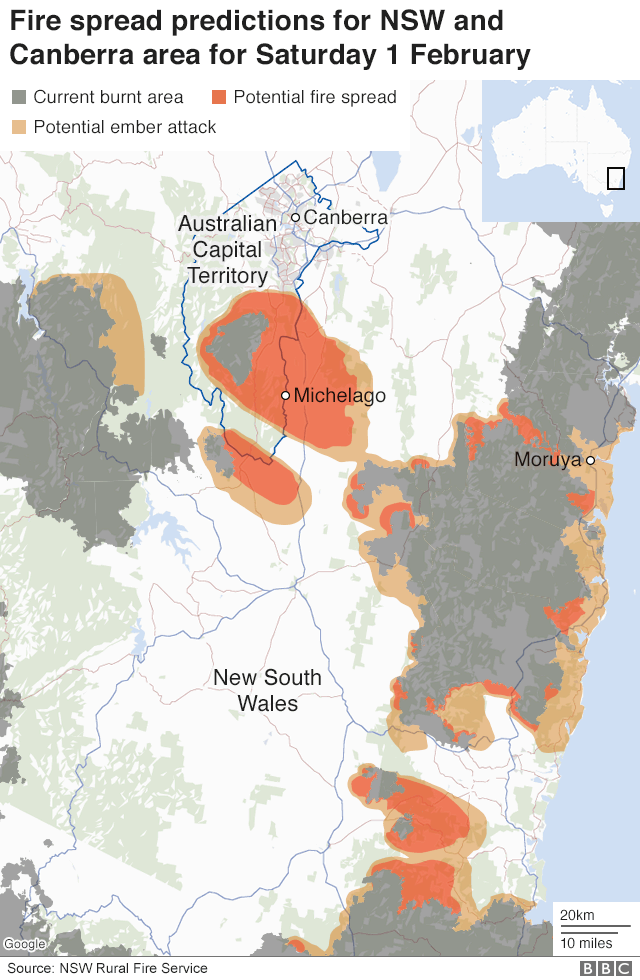

Those fires were angrily rejected on social media as the result of climate change, as websites noisily dismissed “the popular narrative” that linked their occurrence to climate change, but spectral arsonists, discounting–and displacing attention from–how sustained high temperatures and absent rainfall had so redefined the landscape almost to invite the fires.
The landscape had also been redefined in California, but we had a harder time looking at the maps to define our relation to the fires’ bounds.
We confronted the problems and paradoxes of real-time mapping of the fires as we juggled the synchronization of their layers–of landscape, or what counts as it today, of wind, particulate matter, and fire-perimeters, “active perimeters,” or what were once, more optimistically, called “rims”: but borders do not exist for the current spate of fires, which have spewed microdust, particulate matter, and ozone over much of the nation in an almost hallucinatory manner: maps of large scale cannot capture the small size of the billions of tons of black carbon born by winds across the nation, scarring the local land in long-lasting ways we cannot yet assess, even as it puts the poor local air quality in a national context of despair at the unleashing of such an expansive plume of particulate matter that spools disorientingly as it pools in Idaho and Montana and reaches Iowa and Ohio.


The local scale of destruction pooled like a miasma over the nation.

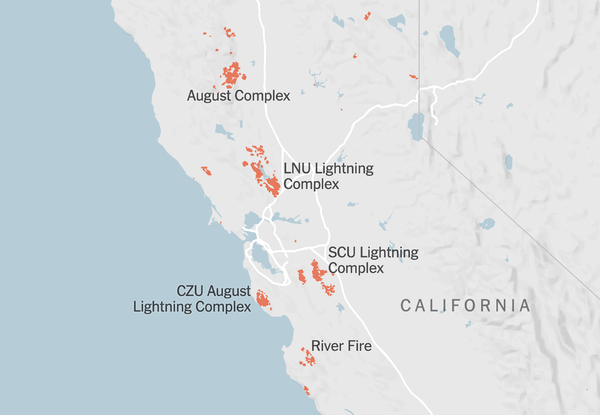
Lauren Dauphin and Joshua Stevens
If fire was flux, as for ancient philosophers, it assumed an almost apocalyptic sense in the conflagrations that started from lightning strikes, consuming the landscape about us in ways that seemed especially difficult to contain, and more difficult than even in recent fire seasons; maybe the thousands of mid-August lightning bolts that struck California in a day gave direction to the state’s future; they surely suggested fire governed the world, even as we wonder what to make of our government, and how to find anything harmonious in our terrifying state of change. For the fires have destabilized our sense of government and of a fire regime, merging air, earth, and fire that suggest the deep destabilization of global warming.
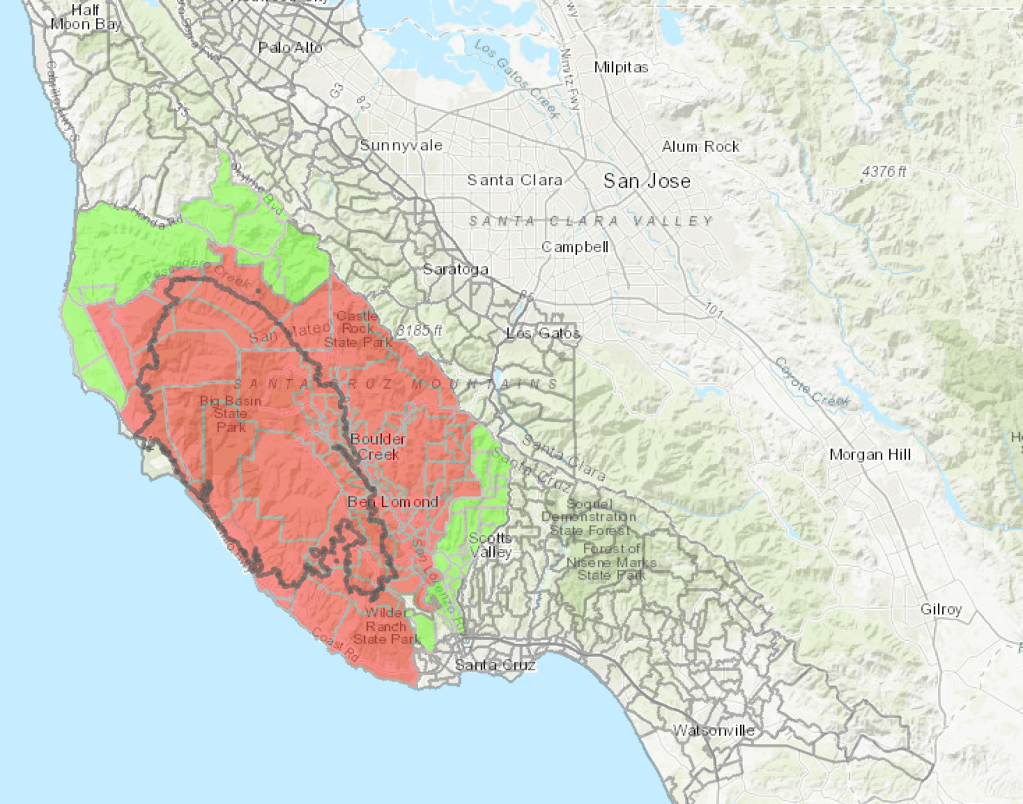
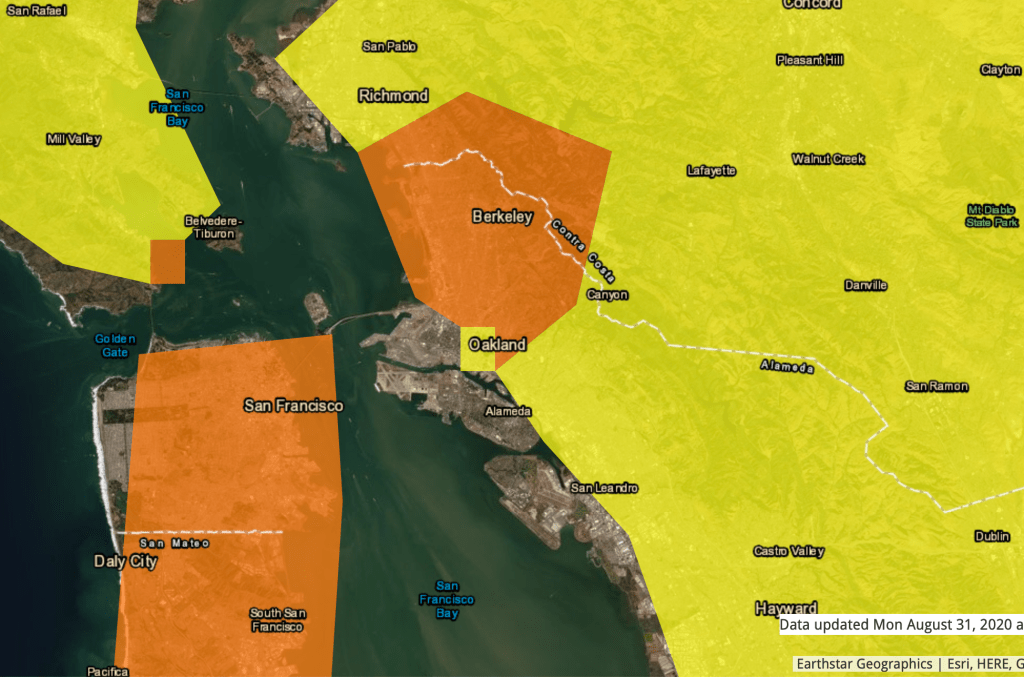
We mapped the fires we hope to contain by clear boundaries. But what are rims, and do such edges even exist? Clear perimeters surely are reassuring, but maps that chart the spread of smoke and particulate matter constitently compel us to dig deeper into the edges of the fires, the edges of spreading particulate smoke, and also the edges of settlement, as we are forced to ask ourselves what new edges of safety or protection remain. The smooth contours of air quality today revealed a bucolic green around the Bay Area, but it has long been hard to see any smoothness in the heavy smoke for a number of weeks; suddenly, the remove of this one region from a miasma of air pollution in the region–if something of a concretization of the self-image of this odd and exclusive area–as the air in the region was finally, after a period of days, if not a full week, something we could again breath–as an island of green air quality appeared, as if miraculously, into the island-like region we live, suddenly expanded inland from the coast.
The fragility of this island of green was something of a reprieve, but a respite that would of course be short-lived. While the smooth curves of these EPA maps of AirNow, detecting the purity of the air in isometric curves as if they were contour lines of clear divides, the approximate measurements projected a tenuous image of security in a moment of bad air quality.

Berkeley Earth

The respite of smoked up air and a week of ash on our car’s hood and clouded up skies was not only perceptible, but a for of reprieve unfamiliar in the Age of Coronavirus so mentally cluttered with fears of COVID-19, haunted by the increased sense of vulnerability that comes with masking, distancing, and other precautions of daily life, as we seemed to be entering our own green world, in a


The map was a bit of a shock in its flat kelly green purity–the sense of a green island, for all of its utter unfairness, was not something one has seen for days, and is a surprise to wake one’s eyes up to. One’s first thought after disbelief was the unfairness of those who work in the valley, rather than indoors and with windows closed, hearing the hum of air purifiers in different rooms, and wondering about the justice and ethics of breathing purified recirculated air, expending electricity in a time of rolling blackouts and concern for the expenditure of undue electricity.
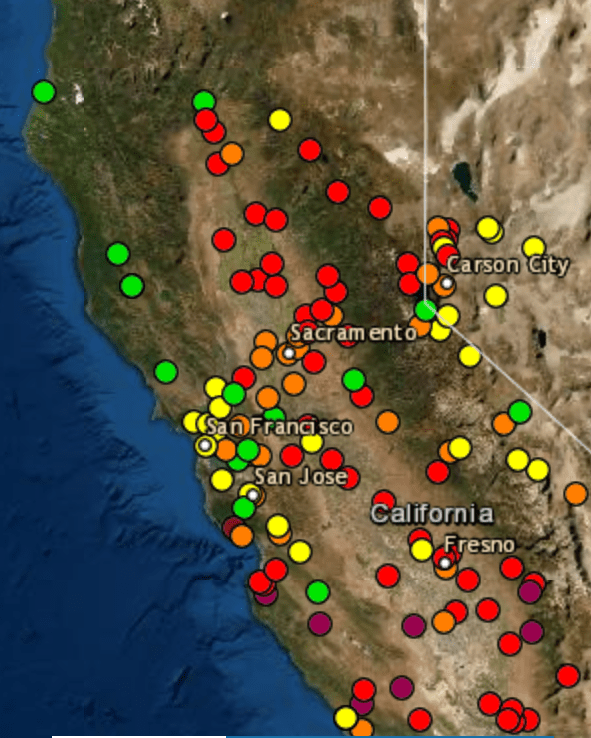
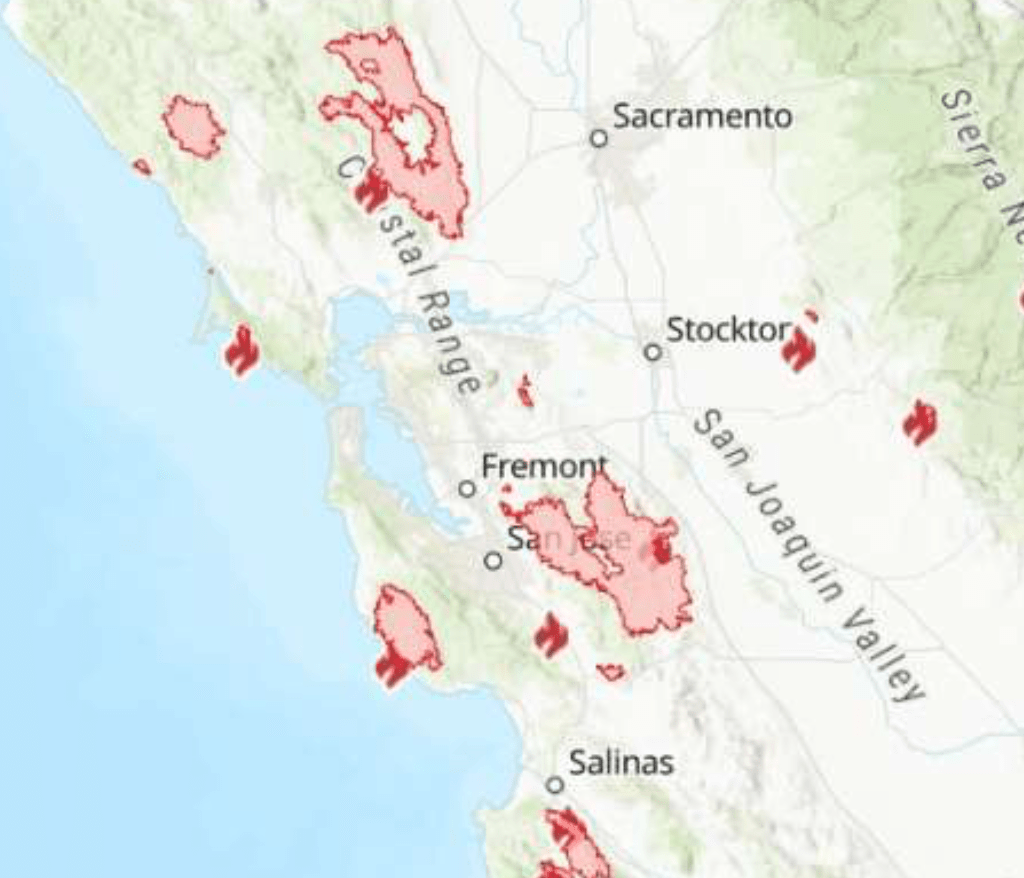
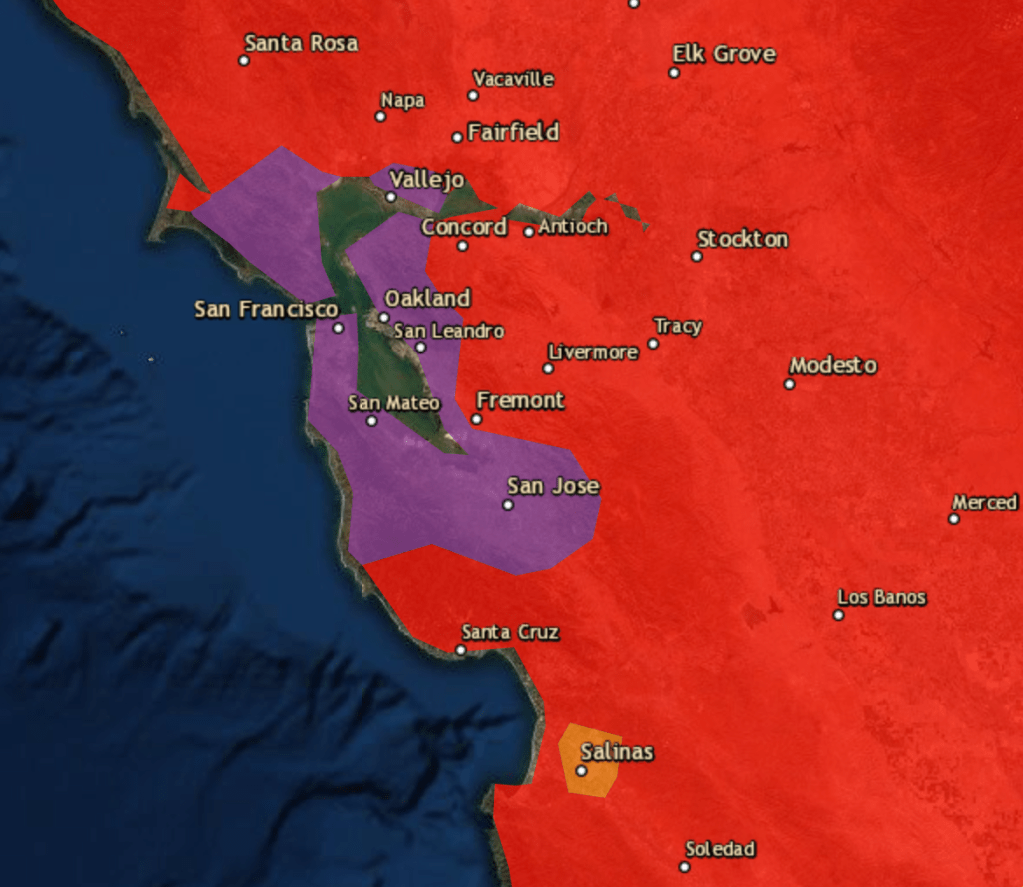
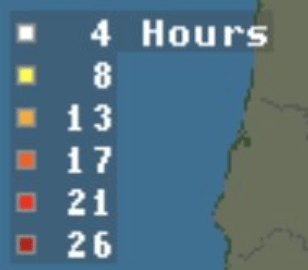
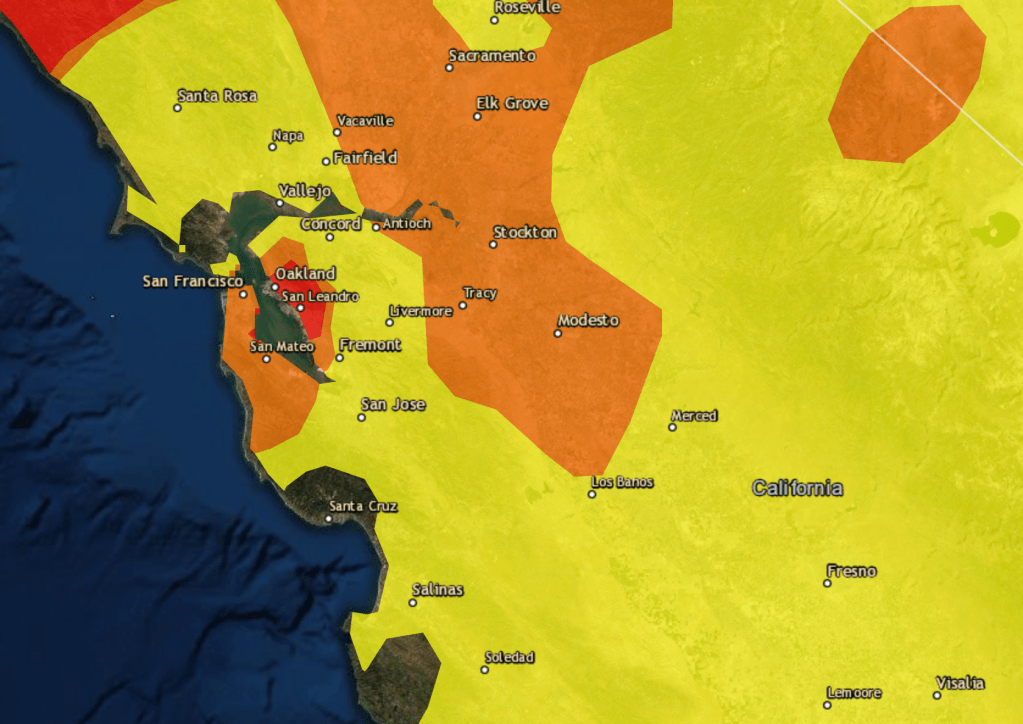
The range of active and contained fires that have sprung up from lightning strikes and a dry late summer environment have indeed crowded the expanded Bay Area–from San Jose to Sacramento–with a range of fire complexes this increasingly elastic ‘fire season,’ which is hard to describe as a season any more, but marks the end of summer and will be stretching longer and longer in elastic fashion: the dichotomy between red islands of active fires that appear lakes of red, rather than lakes of grey, set off the fire from the landscape but embed it in it, as the broad distribution of fires spread thin any combat. The Bay Area, surrounded by fires in Napa area, the Santa Cruz Mountaings and the natural treasures of Big Basin Park, and the complex of fires to the south, that are hoped to be kept away from densely inhabited areas in San Jose–or Silicon Valley–are perhaps best mapped by the lines of fire containment, shifting at times, by which fire officers position their command centers to monitor their explosive rage.

Statewide maps may give no sense of their destructiveness, the active fires being reduced to static icons even as they purport to render a landscape in real time. The map almost implies a failure of processing the communication, travel, and migration of fires that had been, in large part, caused by sudden lightning strikes that had suddenly struck during a quite uncharacteristic middle of the night thunderstorm that rocked the area.
And we are often left to contemplate, as if focussing on the immediate, but at an Apollonian remove, the smooth contours of atmospheric currents etched in truly mesmerizing air quality maps, as if to grasp the fires that were out of control and beyond human management: the contours of chromatic grades of air quality offer mesmerizing to track by loopy contours of abstract art, even if the “good” quality air lay only by the coast, where we looked to hope for some remove–and even drove there at times.

More recently, of course, we had been spared the worst among of particulate matter that could have traveled up from the southland, or down from Sacramento, but were in a haze of grey, told to pack our “go” bags, and waiting in a state of suspended animation as winds carried particulate matter south and, if we went outside unmasked, or sans N95, into our lungs.

We could track the synchronicity of layers of hazardous air and the increasing velocity of winds that were spreading it, heading south, pushing particulate matter across the atmosphere that both complicated and helped us ascertain our position to the clusters of multiple complexes of fires.
The landscape is changing, irrevocably and ineluctably, as winds ushered in the smoke of yet a new fire season to California in the Bay Area. Northern California has been long defined by its fire seasons, as well by its winter rains, but the seasonality of fires has so expanded that the crowding of fire cycles have punctuated not only the late summer–as they did for some time, before the destructive fires of September, 2017–or of fall 2018–that they seem a part of our elemental state of being for our bioregion, a new ecosystem, not linked not to a watershed, but a new logic for how man and nature intersect, and the exposure of individuals to risk that shows decreasing boundaries between the natural and man-made, and is superimposed upon our relation to what was once called nature.

Asked to puzzle overlays, as well as assemble the puzzle of the cluster of fires around the Bay Area, surrounding it like a wolf at bay, we felt as if there was some hilarity in being asked to pack those critical “go” bags, as there was, in a clear corollary to global warming, just nowhere to go–as there was nowhere to go not to be exposed to the novel coronavirus, but just to isolate ourselves socially instead. Social distancing from fires was another matter, however, as fire another element, and smoke close at hand.
We were spared by the limited duration of lightning strikes that hit in the High Sierras, strikes of shorter duration unlike the more sustained blasts that hit the desert sands, as we suddenly had the first good news of dodging a bullet of the expansion of an even greater complex of lightning-struck fires, even as the complex spread in the South Bay to a size that made it one of the largest California fires in history of over 360,000 acres, a mind-boggling size, in a complex of local fires, fed by the underbrush of dry grasslands that extend across space, already trying to be driven back from expanding to populated San Jose. If the area has not, in fact, burned, in a serious total manner for some time, was that time returning now, again, in the era of COVID-19, to destabilize our frayed nerves even more?
The map seems to only remind us again of our vulnerability, as the all in Bay Area communities to pack “Go Bags” at the ready concretize the sense of living on the edge as the standard operating procedure for the Fall of 2020. To be sure, the recent spate of damaging firestorms and fires of 2017 while far removed reminded us of a different topography, wind-driven, to be sure, but often tied to electrical wires and infrastructure, rather than the lightning strikes that have created questions of maintaining 100,000 miles of live electric lines that are strung across the state, creating questions of their management as we seek to provide electricity at greater currents to populations that have spread into the High Sierras and once forested coast.
The multiple fires, if each discretely named in haunting terms, as if they were both monstrosities and discrete data points–the Tubbs Fire, the Atlas Fire, the Thomas Fire, the Creek Fire–showed up best, in this GIS masterpiece, against the very Wildland-Urban Interface–the WUI, or Whooey–in which they so clearly clustered and occur, the casualty of increased overlap of infrastructure and electricity lines with dense old growth forest, badly maintained as dry underbrush and grasses provide a continuity of kindling for possible fires, often driven by electrical sparks from towers and cables that higher winds snap or blow to the grounds. That very sort of intersection seemed only to wildly increase fire risk in areas of unconstrained extra-urban sprawl endemic to California as a state.
The elegance of the state-wide data visualization seemed to answer questions of why we talk about fires and California that several years ago gained wide attention in the news–in ways that posed the question of whether we should treat the California fires that increasingly cluster in wildland-urban interface, where “nature” and built environment intersect, as “wild” or if “wild” has been superseded as a descriptive category for fires.


–that seemed to stake an alarm, if it also seemed to hampered by our remove from the very weather systems and deep drying that have increased fire risk. Yet we long knew, if not from such a totalistic and blanket persepective, the danger of the poor protection of fires igniting and spreading in the almost unsupervised growth of wild land-urban interface across the southlands, where destructive fires were since 2003 tracked in the dried out grasses of WUI, where housing density abuts forests and individual houses are nestled picturesquely in dried branches of trees; such infrastructure encourages higher temperatures of combustion that creates flying sparks, furnaces, and, at higher temperatures, dangerous fire whirls.
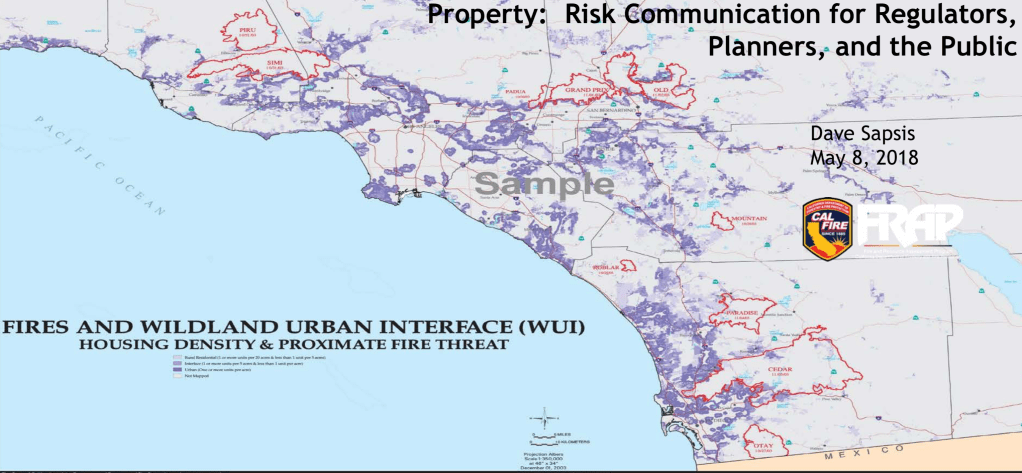
Yet “risk” was assessed with blinders. While graphically compelling and persuasive, the map that distributed fires against the increased “interface” of cities and wildlands–or an attack of real estate and unconstrained development–echoed earlier calls to manage fire risk better years prior: the hope to manage fire risk by maintaining standardized risk mapping of the increasingly inhabited expansion of infrastructure across largely undeveloped wild lands-urban interface in the western states, posed the demand for making and distributing detailed fire risk maps, much in the manner that has been long done for floodplains. Only by doing so could one prevent the egregious bracketing of risk by home buyers in hopes to encourage fire risk planning, better loan politics on building houses in areas of fire risk, tiered rates of fire insurance, and better community involvement in fire-fighting costs–all of which depend on robust practices of public data collection and creating a larger dataset of fires, property loss, and wildfire damages that are not fully tabulated in a universal way–and conceal risks of property development.
The increased danger of areas where insurers would now refuse to insure property, rather than create clearer stipulations for building and property maintenance, are only slated to grow, in ways that will have broad repercussions for a state where many safety nets have fallen out as the tax system has come under assault.
Could a clearer county-by-county view of the expansion of WUI across western states create better awareness of the extensively developed regions shown in light tan–the very area where many of the most costly fires in California have occurred–let us know the extensiveness of fire risk that was growing under our eye by better protecting the problematically expanding “wildland-urban interface” already at greater risk of fire back in 2014, long before the newsmap made the danger retrospectively clear? If the costs of firefighting was already hoped to be reduced by attention to better policy for land development in western states, the worthy call fell on deaf ears.

Wildfire Solutions Forum, 2014
The protection of such lands should begin from the minds of those who settle there. But how to place it there? The costs are considerable, and should be shared. Can we encourage the procurement of better fireproof building materials, underbrush removal, and lowered intensity of land use to instill a different culture of the relation to the land and best practices of settling open space, by a better apprehension of the scale of fire risk?
The need to instill such a relation only grows with rising costs of firefighting and our inability to do so as fire risks grow suggest a pattern that is in itself not sustainable, and has no vision for how to move forward–even as the increasing costs of the sawtooth graph of increased fires tended consumed increasing budgets as the fires spread over larger areas, and were harder and harder to extinguish, and more vicious in their spread.

But these questions were not foremost in mind as the lightning hit and the spread of fire complexes extended more broadly across the dried underbrush, as the return of ever larger complexes of fires created immediate questions of how the perimeters of fires could be contained. The sandwiching of inhabited areas by broad lightning “complexes” suggests a new relation of inhabited spaces to the destructiveness of fires.

(ESRI, Garmin, USGS, USDA, NPS data)
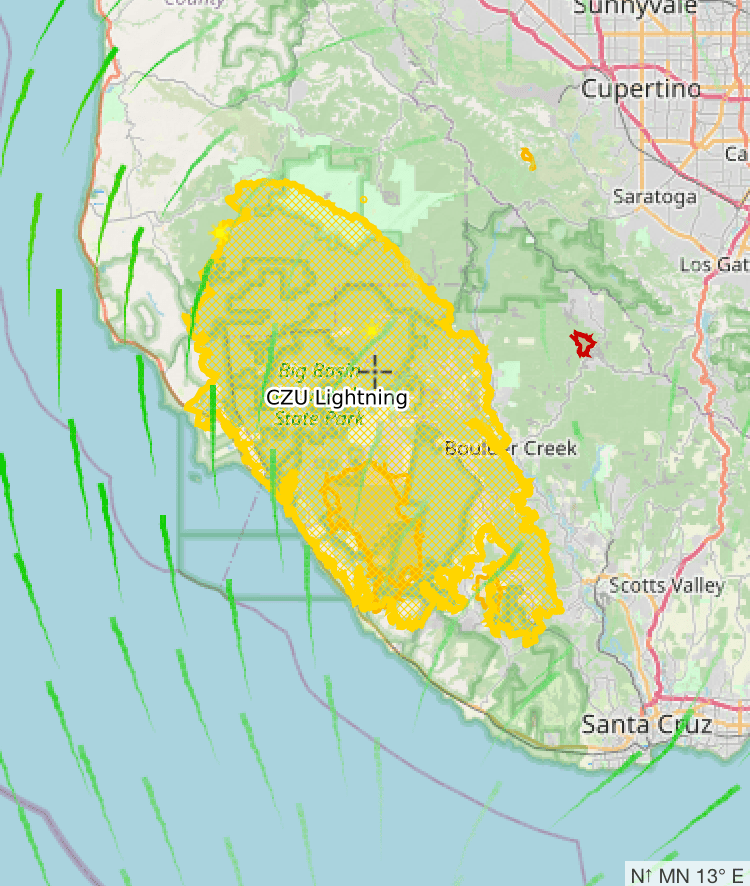
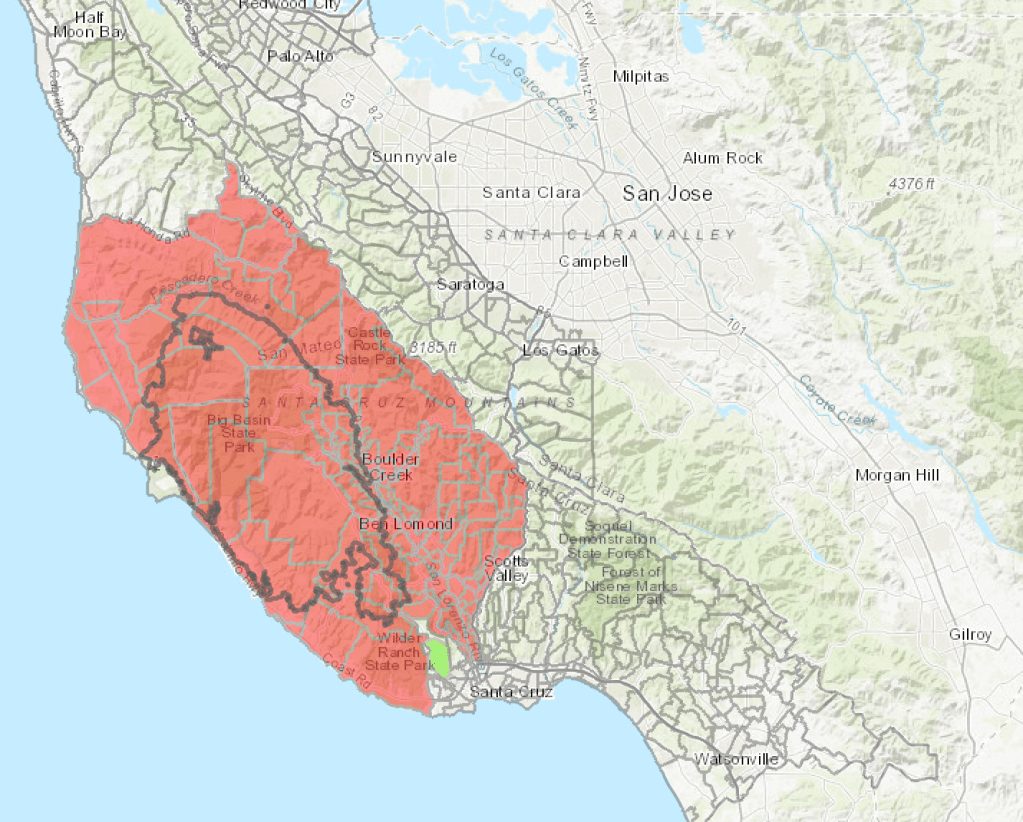
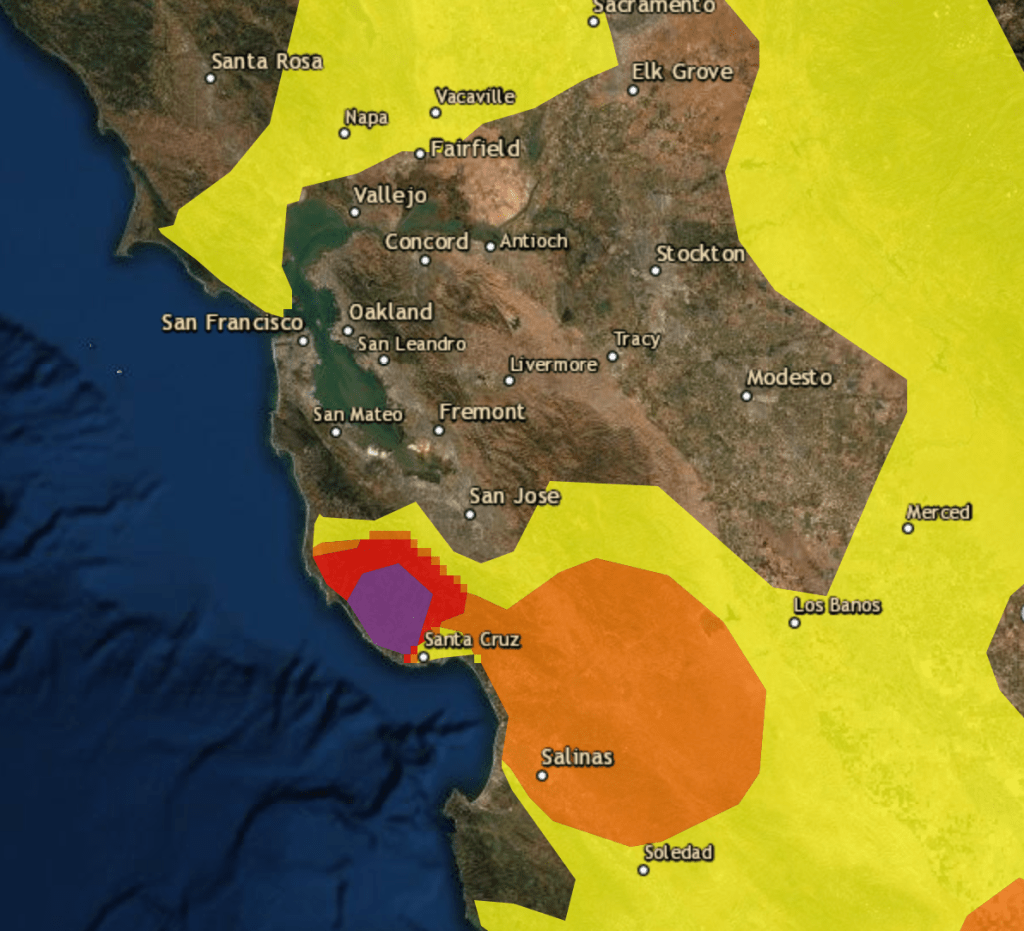
The large cluster of fires that sandwich the South Bay and Silicon Valley in the CZU complex, the smoke of which drifts at times over the Bay Area; one large complexes to the north on the Pt. Reyes National Seashore; the CSCU complex that bridges the Central Valley and Bay Area, stretching from Santa Clara and Merced to Alameda–whose perimeters are best understood as a jigsaw puzzle, the boundaries of whose pieces mutate by a hidden calculus of combustibility (aridity) and spread, shaped by wind, in danger of being pushed across the hard work that goes into fires’ containment by fire lines–

–and its smoke flooded Santa Cruz, and was swept up to the north.

While we seek situational awareness of the first that savage the landscape, we also shift to the smoke released by the complex of fires which send particulate matter far beyond their perimeters across borders nationwide.
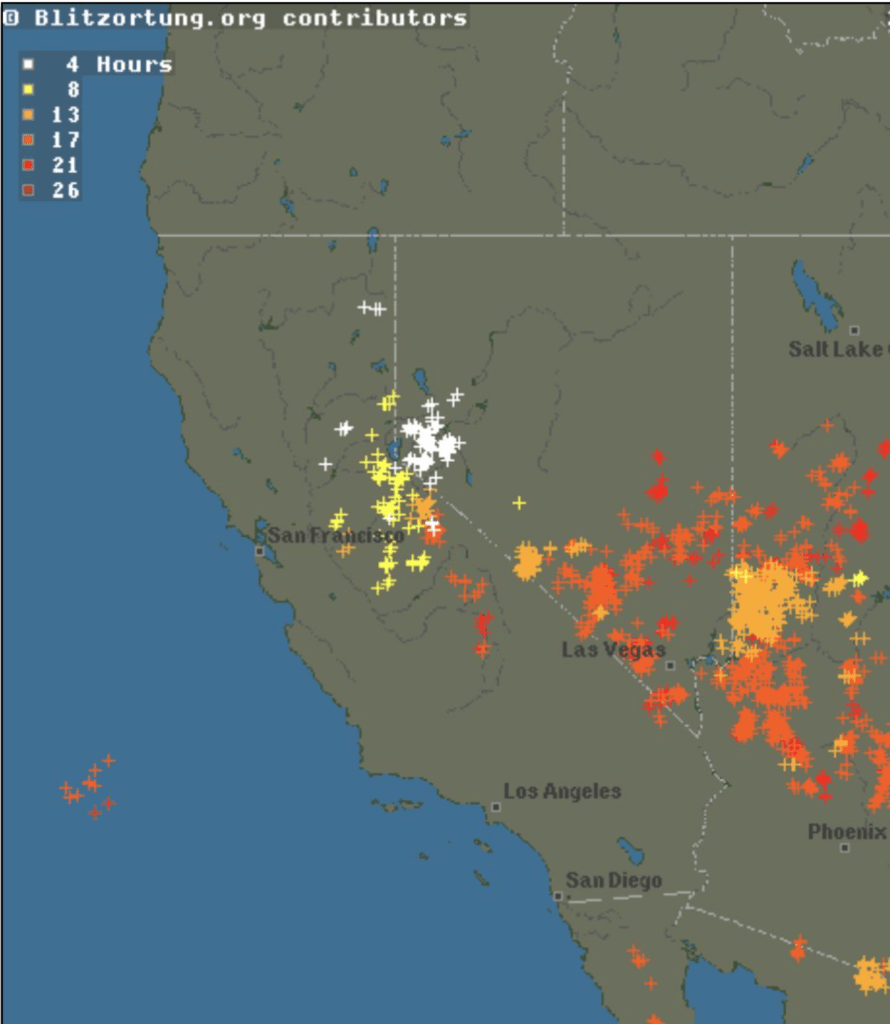
When wildfires however came into the national news again in 2020, they due to lightning strikes. The CSU and CZU Lightning Complexes began not by sparks from downed electrical wires, but a spate of unexpected lighting strikes that ran across the state, surprising meteorologists back on August 15-16, with twenty-four hours hitting an astounding expanse, often in national forests, as has been noted but eh Bureau of Land Management detecting just over 4,800 strikes, 1,089 of which struck densely forested lands in National Parks, suddenly creating a new geography of fire, and asking us to reconsider the question of the protection of forested lands with an urgency that even in California was a bit unexpected.

Data from BLM National Lightning Contract/National Interagency Fire Center
And more lightning has threatened to strike again in recent days, raising the prospect of starting a second set of fires with lighting strikes predicted for the High Sierra. We had something of a preprieve from thunderbolts, were surprisingly spared by their unexpected paucity, which amidst declining air quality streaming nation-wide came as a truly divine reprieve as they endured only a small time–giving a new sense to lightning as a manifestation of the presence of the divine within this parched terrain, as if the spread of lightning strikes are something we can only be spared by whatever stock remains in grace: the feared diminution of lightning strikes recurring in the Bay Area, Central Valley, and Sierra foothills, perhaps because high smoke cover made forecasting difficult, but sparing the region from the eruption of further fire complexes for now.
The complex of fires in Santa Cruz and San Mateo, already spreading close to the city of San Jose, in the heart of Silicon Valley, that had erupted in all the old redwoods of Big Basin, Boulder Creek, and Ben Lomond, flooding Santa Cruz and Soquel with smoke down to Watsonville, spread as a large lightning complex, merging one set of fires difficult to contain in late August quite rapidly over time–pushing the evacuation zone all the way up to a containment line–that the ARCGIS palettes serve so well to foreground–
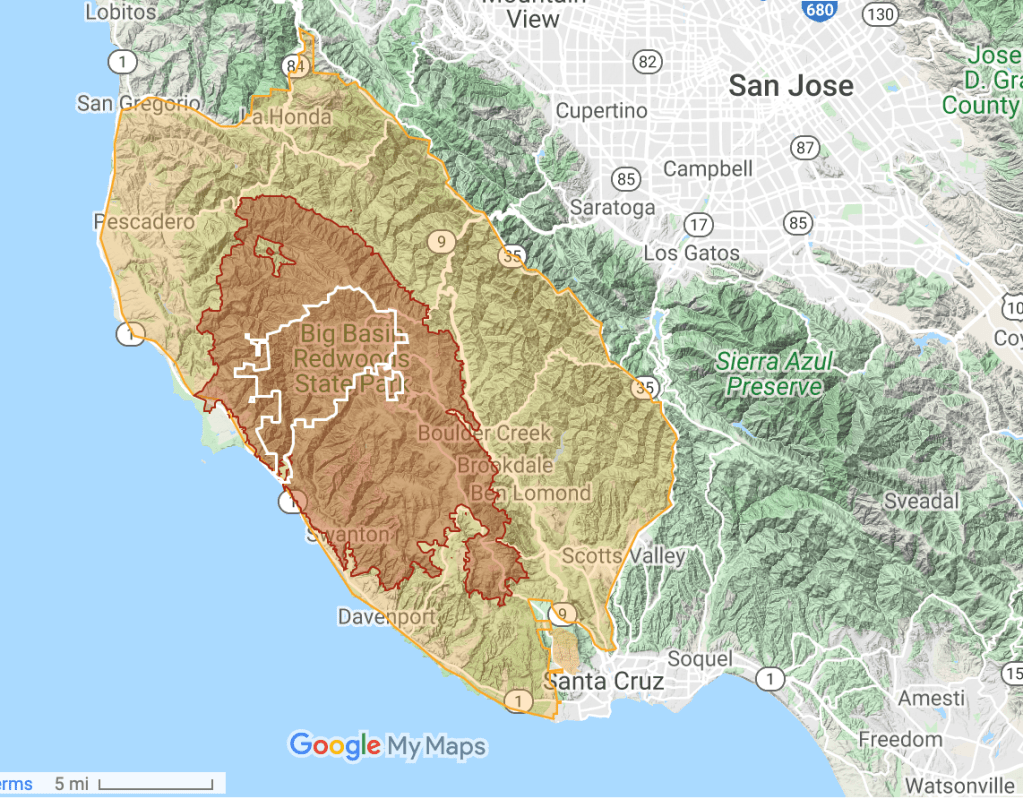

–whose perimeter was soon itself consumed by the expansion of roaring flames, as evacuation warnings extended into Palo Alto, and the fear of a fire line breach grew, and the complex proved hardest to contain.
The fight or flight reaction, as always, doesn’t serve us well. but there was once a sense, back when the U.S. President knew a bit about forestry, and forest management was a respected field, and the President called not only for better raking of forest floors, but might be imagined as Forester-in-Chief. When Donald Trump has enjoyed blaming poor local officials for the mismanagement for fires that have occurred largely on federally managed lands, the lack of a policy of fire management is increasingly dire, as the growth of huge fires and ad hoc fire prevention teams that are regularly assembled each fire season remind us of the unsustainable nature of trying to contain fires by current land management policies that already spread thin fire containment needs for the Bureau of Land Management across the entire state, overwhelming the fire fighters who worked to contain them before the lightning strikes hit the very same areas supervised by the Bureau of Land Management.
Is there a more long-term alternative, less based on an existential relation to the expanse of fire burns? Gray Brechin’s Living New Deal recently reminded us of the plans for cutting a state-wide “north-south firebreak” across the state through the Sierra Nevada foothills, a project based on confidence of protecting old growth base don building bridges, laying culverts, and grading roads that would help “to create a barrier to keep wildfires in the scrubby lower elevations from reaching timber at mid-elevations” organized as the largest project of the Civil Conservation Corps in the state of California in 1934: based on a 1933 survey of Associate Regional Forester Clarence E. Dunstand and Associate Silviculturist A. Everett Wieslander, running from Shasta Bear Lookout to Kern County, a planned fire break would have maintained fires from “sweeping eastward up the mountains and laying waste huge areas” of older growth forests in a man-made barrier even needed in an era of increased settlement of what is Wildland-Urban Interface.

Could the construction of such a “fire break” be something that reveals not only a different notion of the relation to the landscape, even if it originated from the economic interests of areas of standing timber that were seen as far more integral to the state and to its well being than they are today? The Ponderosa Way was built to the past areas of settlement, but sought to provide a tool of fire management that began in the foothills from spreading eastward into the Sierras, to protect valuable timber resources in the Sierra Nevada mountains by the huge land earth project of a nearly 800 mile fire “break” across forested mountains of the Sierras. While the site of the fire break may seem outdated, the project of clearing brush from a billion sq. feet of forest floor suggests a keen awareness of the need to create clear boundaries to fire spread, and maintaining forests, that should be even more apparent now, given the broad risks of health, homelessness, and property loss,–even if questions of forest protection have receded for most.
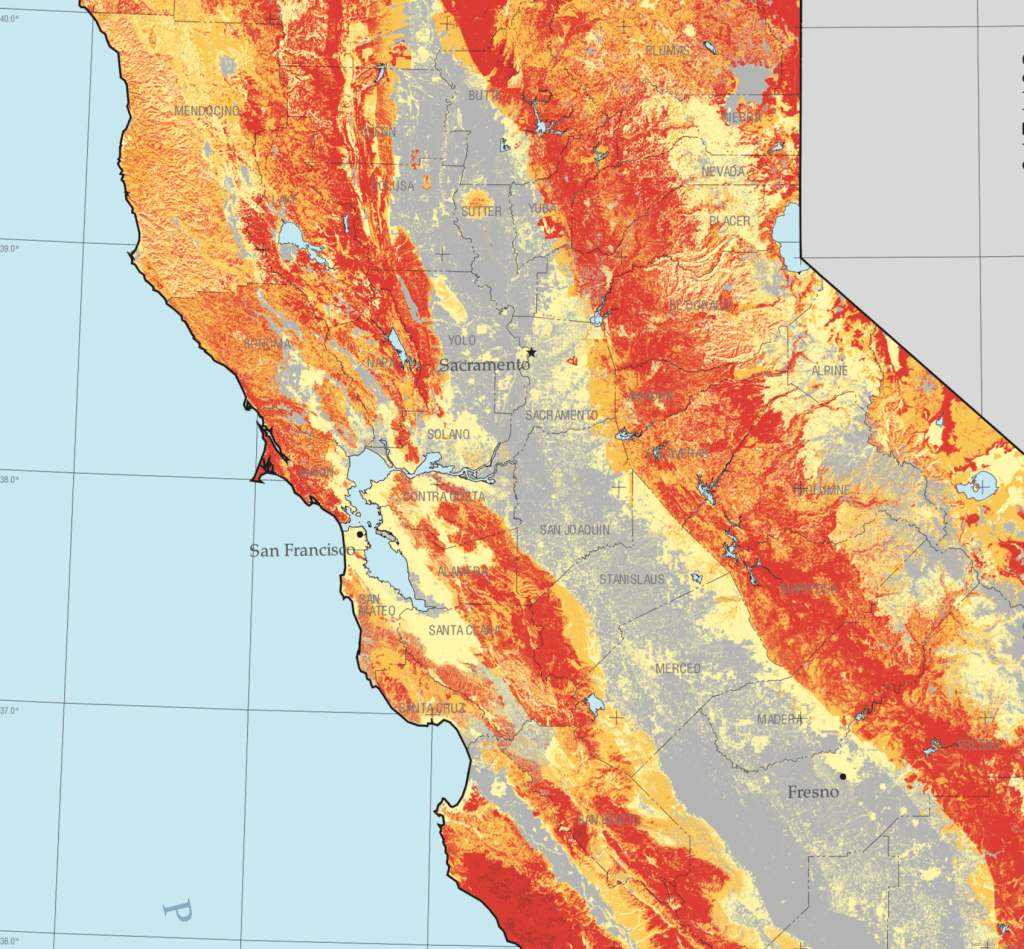
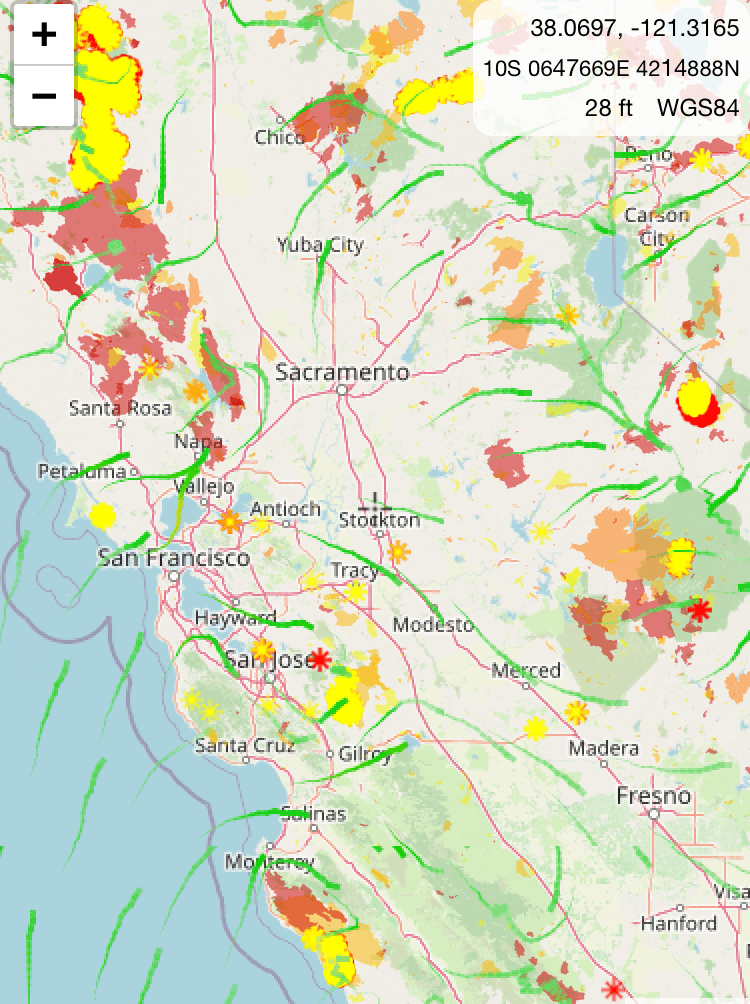
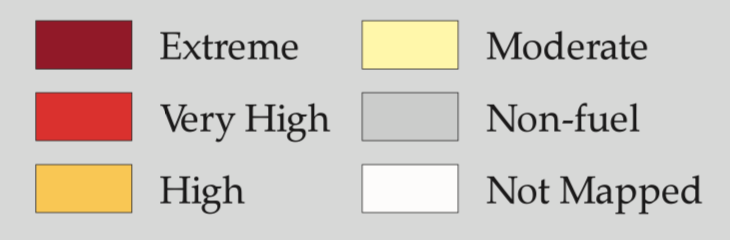
But perhaps the very fire-risk maps on which most insurance and construction depends is outdated–reducing the risk of many of the structures where the current complex of fires have most explosively and uncontrolledly spread, with high risk areas reduced to isolated hot spots–and state responsibility reduced or withdrawn from many parts of the state. A recent 2007 map of “fire hazard severity zones” that the state undertook predate the intensity and severity of the current drought, which has magnified exponentially since the Fire Resources Assessment Program map for the state was created in 2007. The very notion of “very high” risk zones was long on the record, while severely outdated, offering an outdated picture of the Bay Area and Northern California we would not be likely to recognize, before it was revised a decade later.


The map designed in 2007 was made with the assurances of predictive value, but in classifying the entire state–a region that is in a sense heuristic, as it has nothing specific to its contours of fire risk–the map seeks to classify by only three classes of fire threat severity–Moderate; High; or Very High–the totality of all areas of federal responsibility by clean edges. Their very clarity, however, ran against one’s sense of the broad levels of danger that migrated across borders and lines, or the messiness of the catastrophes that actual fires of increasing magnitude have since triggered. The FRAP map saw risk as focussed in areas close to the Bay Area and in Calaveras, El Dorado, Nevada and Tuolomne counties. If it is rendered almost obsolete since the scale of destructiveness seen in fires since 2007–over ten years ago–it omits “risk” and “hazard” of smoke, long-term land and air pollution by heavy metals, or the far greater sense we have of the fires’ risks–not only for the destruction of homes and displacement of residents, but long-term damage of property and local once-pristine ecology, even of protected lands.
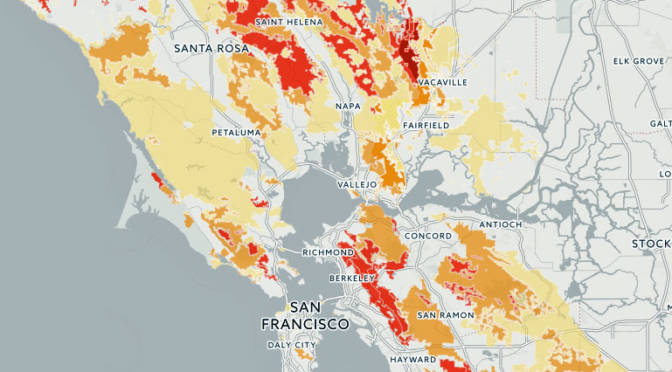
The more recent two-tiered Fire-Threat Map of the California Public Utilities Commission is less pointillist in scope, assessing county-based level of risk, to introduce clearer regulations in High Fire Threat Districts as of 2018, focus on regulating the wild land-urban interface and reflect the difficulties to contain fires in the very areas fires from lightning strikes occurred.
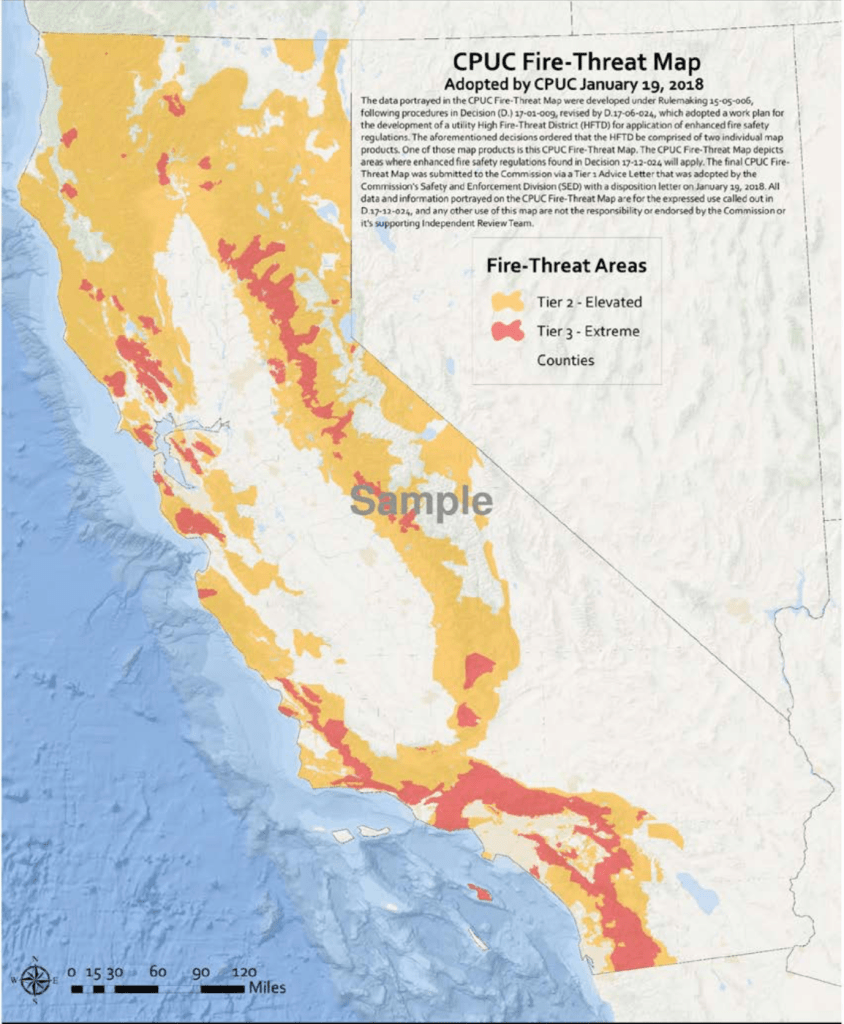
The maps suggests few sense of the prioritizing of what might be valued in a landscape, most importantly, and by its focus on crisp contours seems to depict, based on past fire history and “fuel” of a forest’s “fire load” or “fuel” load. While the map was updated in 2017, it was on the charts for several fire seasons, as decreasing moisture content of brush, shrubs, and grasses created a new picture of far steeper risks. Even as the map of fire risks was later revised in 2017, it again suggested an almost crazy granularity of levels of risk–now expanded to five–as if to map the risk of sites of ignition, rather than the risks occasioned by fires’ spread; Sacramento, a site where recent fires almost abutted, lies in the useful category of “no fuel,” if its suburbs were threatened by fire and blanked by smoke.

Fire Resources Assment Program
Years of elevated temperatures led to a situation troubled by blinders and a failure to care for forests, or to maintain defensible spaces around property. Indeed, a lack of attention to growing risk over at half-decade long drought prepared the ground for the extreme nature of fires that made the “Fire Risk” FRAP map of 2007 more of a reminder of the fire landscapes of the past. But while it rests on “fire land” or “fuel rank” as well las fire frequency, or “rotation,” the map’s crisp colors fails to distinguish dangers of fire spread, smoke, and in its preservation of sharp lines seems foreign to the fluid complexity of fires’ spread.
So what of the notion of a fire break? Only in select places in California does the Ponderosa Way project continue, helped by a combination of public funding from CALFIRE’s Fire Prevention Program, in communities where fire risk was unavoidably mapped as recognizably high. The coordinated creation of fire breaks are not in themselves nearly so costly as potential damage of fires, and grants from CALFIRE’s FPP offer the ability to create needed defensive zone for firemen to anchor firelines, taking a stand to reduce rising fuel loads on public lands in Nevada County, based on a deep sense of the stakes of landscape change and need of public-private partnerships against risk. By rehabilitating a project first proposed by a forester, familiar with the dangers of local burns, and the need to control their spread, local input of residents near the Grass Valley Defense Zone Project respond to the increased risk of regions denoted by pink, which spread through most all the region, and the need to plan for eventualities: this Local Responsibility Area (LRA), which lies outside of state responsibility, and as such isn’t rated for hazardous risk by the state, is of course most in need of the very fire breaks that growing communities in San Jose and San Matteo Counties so direly need as complexes of fires that were provoked by a spate of sudden lightning strikes grow. If this project was recommended to Governor Gavin Newsome by Cal Fire in 2019 as a “defense zone,” more than a fire break, the benefit of such vegetative clearings, akin to a controlled burn, now seems increasingly clear.

Military preparation for World War II compelled the Forester-in-Chief for shuttering the CCC and ending the fire-break project in 1942, which shifted back to local jurisdiction, and in which the Bureau of Land Management never showed much interest as it was judged not necessary to the mandate for fire protection that was oriented to protecting settled areas. But the spread of destructive wildfires of unseen scale in 2017 in Butte County that destroyed the entire town of Paradise CA from the map–creating refugees from climate change and spewing smoke across the state and nation–shocked Americans and occupied media attention by its destruction and loss of property so much that we may have forgotten, if Brechin didn’t remind us, that the old CCC firebreak, had it been maintained, would have been one of the only possibilities of protecting part of the recently growing town through which it ran–or might have offered an evacuation route to evacuees who lost their homes as over 18,000 structures were destroyed.

Paul Kitagaki Jr./Regional Pool, Sacramento Bee via AP November 17, 2018

November 19, 2018
There seems no clear evacuation route this time. Indeed, we face obstacles that the lands have dried out where forests are poorly maintained, and many grasslands allowed to grow long and grow dry, had spread in ways that spread inland, across the Central Valley, and down the coastal range–

We now seem as if we are destined to let our national parks burn, at the risk of bounding of fires in national seashore, old growth forests, and state parks, we leave landscapes poorly protected and have a reduced sense of risk. There was a sense of a re-engagement with a new healthy environment, which had been lost for weeks, today in Berkeley. We had a surprising respite in smoke, as the wind shifted, but the fires burned uncomfortably close. And, meanwhile, as we struggled to fit the pieces of the puzzle of these separate complexes that simultaneously seemed to abut against inhabited lands, destroying so much of the older growth woods and spread most of all through the dense brush of undergrowth, fire officers sought to explain with law enforcement the efforts of mitigation and containment that continued through the days, asking us patiently to take the reassurance they offered as to how much the fire lines had contained so far their spread, presenting the large spread of the parallel complex of strikes and fires across the hills, that was in danger of advancing to the South Bay. Cal Fire indicated the stationing of men on the perimeter of the active fire, beside mask officers of law, messaging continued vigilance of protecting the perimeter that threaten expansion to inhabited areas, but left us increasingly uneasy of the future landscape of fire prevention long term.

–along what popped into spatial consciousness a few years ago as the Wilderness-Urban Interface, a region that means little in these areas of urban sprawl. The large expanses of dry grass, old trees, and underbrush burned in ways that seemed to sandwich inhabited space, freeways, and work sites, in an area where, providentially, as it were, working at home and distancing had been policy for now several months–even as another complex roared on above Vacaville, the LNU Lightning complex, itself only a third contained.
It all was, as we struggled to fit the pieces of containment together, in more ways than one, a Fire Siege, as it is now being called in the state, guided as we are increasingly by the terms of fire management as much as by trying to track the ever increasing velocity of these fires’ rapid spatial spread.

That said, in this combustable landscape that seems to map the intersection of lightning strikes against remaining areas of what was once green, when we seem to be asked to say goodbye to stretches of old growth forest in Big Basin near Santa Cruz and down the coast in Salinas, the Marin Headlands, and across parts of the Sierra Nevada, amidst the puncturing of California, there is an odd sense of the pausing of that onslaught, as pools of poor quality air retreat in loopy ways over an ESRI terrain view, nationally,

–as if staying a holocaust of sorts that seems always threatening, even as its embers are still burning, sending what can only be called “moderate” air quality across the nation, leaving us wondering whether the buckets or the parameters of future air quality will soon decisively shift.
The retreat of moderate air from the local setting lifts a blanket of haze and grey particulate we’ve come to see as accustomed to fire seasons, now accompanied by the donning of N95 masks that are for sale in bulk at local hardware stores, and even convenience stores, this time made a bit more acceptable and widespread with the mask-wearing of COVID-19–but creating a bit of a quandary only in what type of masks to wear; the limits of low-count cotton threads to contain viral particles or protect the lungs form the inhalation of particulate matter make us feel more vulnerable.
But we can only breathe in relief, taking off our masks, locally, to inhale, as PPM counts temporarily descend, and clearer skies–save the fog–emerge in at least the limited local areas we live.
The very next morning, as the winds blew in more particulate matter and smoke, the air purifiers in our house went into action, as we wondered when we would next breath clean air. And by Friday, our interactive maps of air quality, rejoined us to the firescape, as the fires that surrounded us returned to occupy our minds, as their air filled our lungs, burned our eyes, and, perhaps, if we wouldn’t like to think so, reconnected us to the world.
Everything, as it were, flows across boundaries and into the air. And as the smoke from the fires spread across the country, one could only think this, too, was a national emergency, and an ongoing one, that would be with us for some time, even if the local skies cleared.

ESRI, HERE, Garmin/Earthstar Geographics
For smoke, particulate matter, and fire will be destined to continue to pool in this landscape, as the fires for which no clear breaks in the landscape exist, moving beyond state lines, until the layers of particulate matter threatened to superimpose themselves upon the forested landscapes that lie beneath them, and which peek out only at those rare spots where air quality suddenly, if only temporarily, improves.

The next day, a block of air thick with particulate settled in around our home.
ESRI, HERE, Garmin/Earthstar Geographics
But by September, even as the boundaries of the fires seemed contained, the poor air quality that had spread through most all of California and that extended west, had introduced not only unhealthy but very unhealthy air into many spots, setting a new standard for the hazardous outcomes of fires.
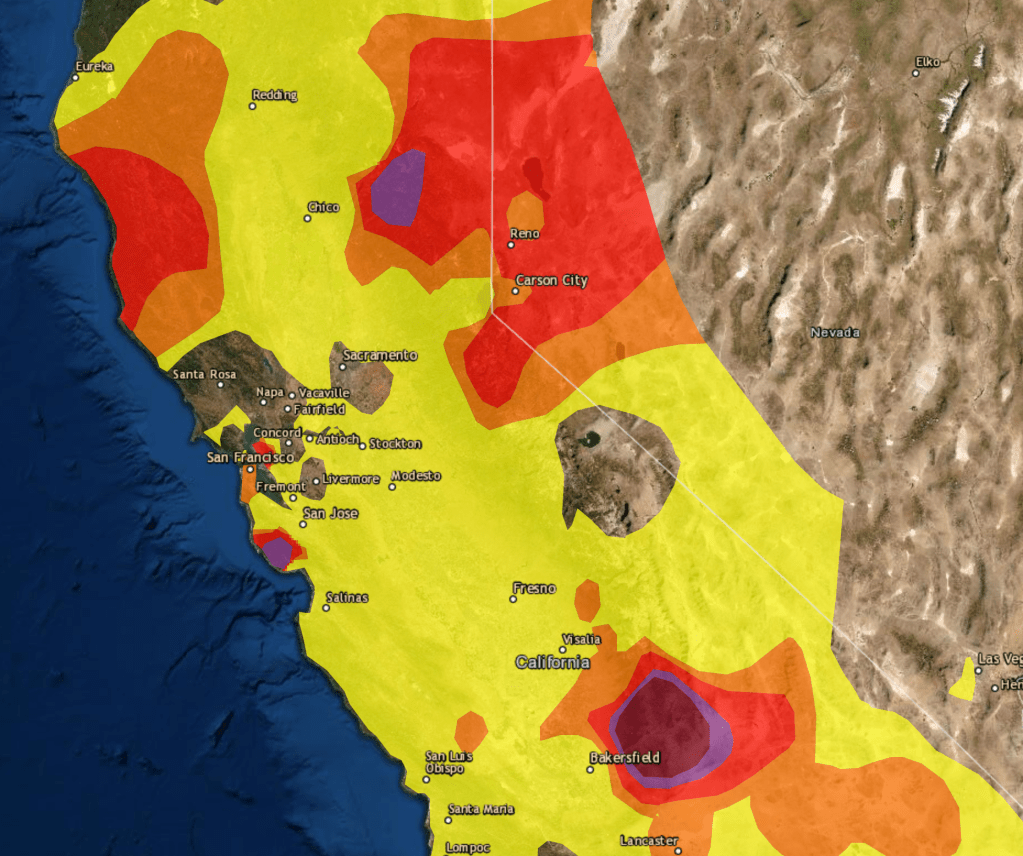

By the middle of the month, the skies were opaque with grey ash and orange clouds, blanketing the sky with an eery afterglow as ash migrated from forest fires across the Sierras over most of California, as the expanse of the fires grew in western states with no end in sight.


Much important data here, in urgent contexts. Alas, Berkeley’s emerald green island of clean air has already disappeared this morning.
There by the grace of God. Indeed, a new addendum offered this morning, as our own purifiers began to buzz.
The 4 ancient elements in your opener, then Heraclitus vs. Parmenides as it goes along to follow and take apart in layered detail CA fire mapping over time and in (your, our) real life experience. Will there be, have there already been, important shifts in public understanding and policies because of recent experience? If so, too little, too late?
I think this came as a big surprise, and we are still holding our breaths!