
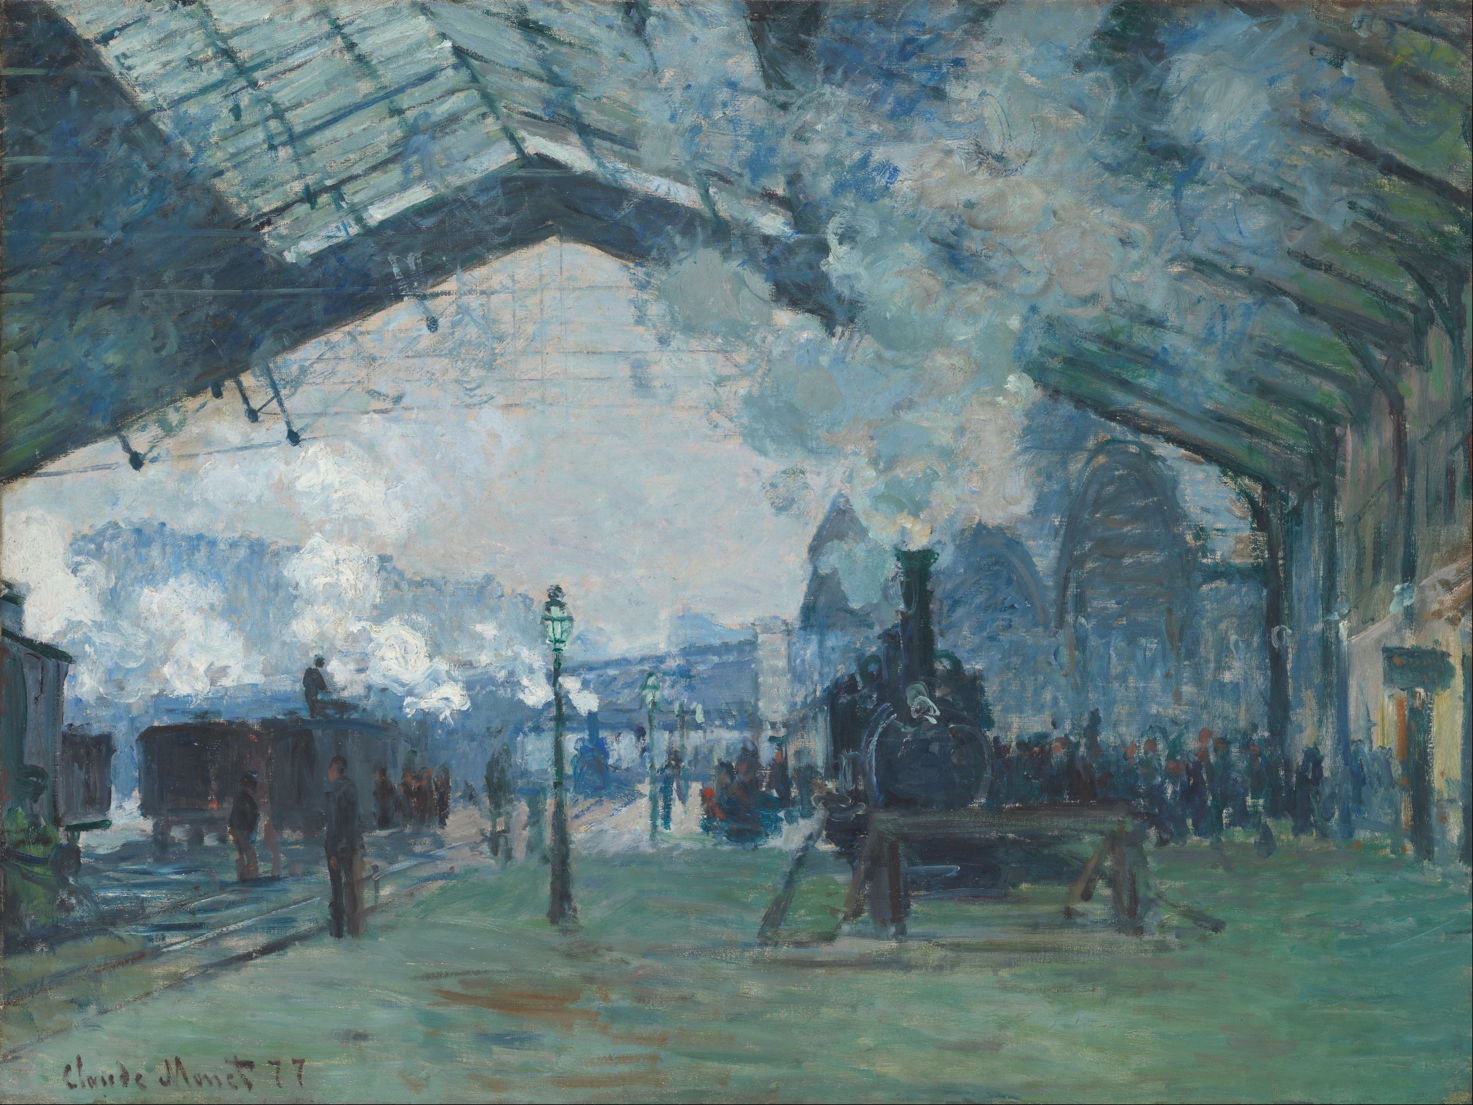
4. On the eve of re-entry into the Paris Accords, the entry of arctic air across our northern border wasn’t unprecedented, but a wake-up call. Search to the map’s colors to find some purchase on the plummeting temperatures across the midwest, ceruleans brought me back to Monet, finding traces of the increased carbon pollutants that filled the atmosphere registered in a map of the sulfurs that spewed up from power plants, the modern ancestors of the sulfur emissions that are in far better need of being mapped as we enter the Paris Accords.
We are in need of the very sort of about-face that Monet made in leaving idyllic garden at Argenteuil to face the carbon spewing out of the Parisian train station at Gare Saint-Lazare in twelve canvases that tried to capture modern life that ponder the dissolution of clouds, steam, smoke, and even asking the station master to leave train engines idling in the switchyard so he could to capture the effects of how steam smoke obscured the cerulean skies as the train station air filled with the bitter air of burnt coal. The 1716 urban Plan de la Ville et Fauxbourgs was relegated to the smoke-filled dustbin of history, by the inter-related space of networks of communication, fossil fuel combustion, paved space, and superseded it, or, that the warped Georage overlay old urban plan lies above.

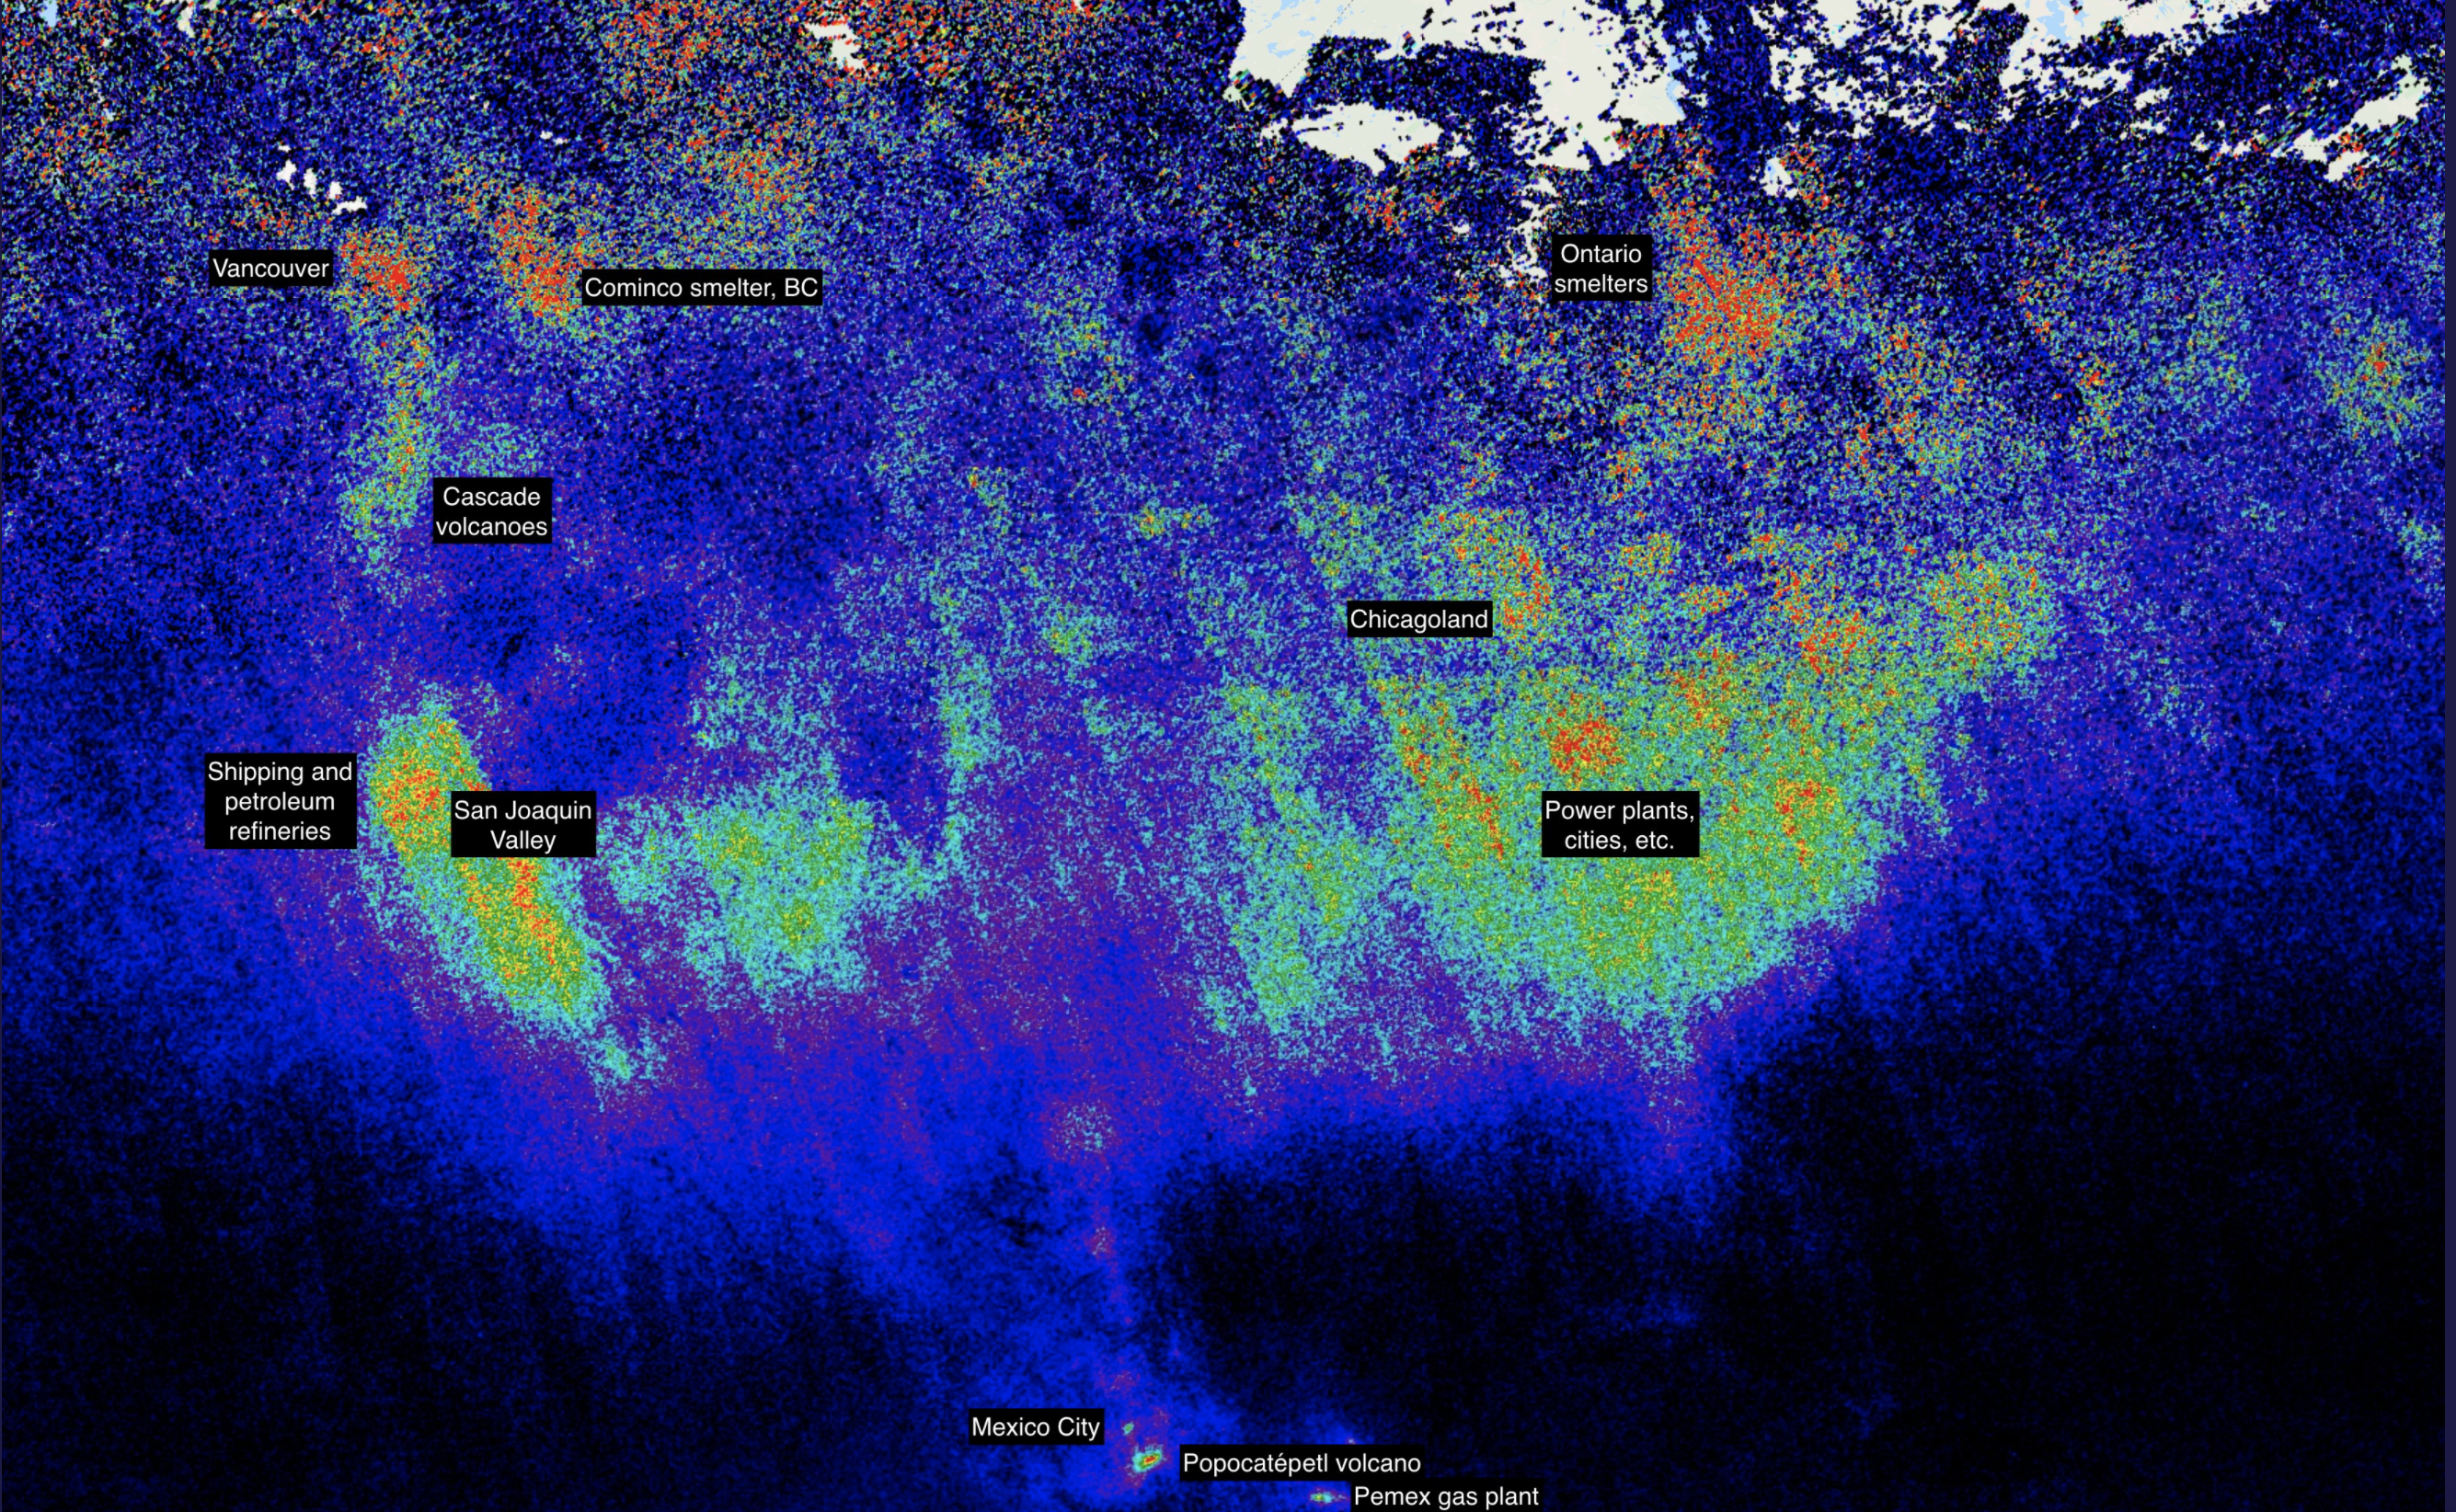
Shifting perspective to the sky, using satellite data on the far from cerulean skies, maps suggest the ghostly configuration of sulfur dioxide emissions emerging from what were increasingly less regulated North American power plants, refineries, cities, shipping industries, smelters and production of gypsum and fertilizer, as well as volcanos, to reveal the huge footprint of emissions released this past winter, cartographer Logan Williams showed in a snapshot that begs us to reconsider our relation to God’s green land. The continent is viewed by the anthropogenic release of airborne sulfurs registered by satellite, among the principle of climate change, where the once prominent contribution of the Cascades have been displaced by new hot spots of burning from power plants: these spots are not isolated, if there are clear concentrations of SO2 around them, but the products of a nation enmeshed in practices of carbon burning and fuel combustion, and dependent on the creation of electricity from power plants and refineries.

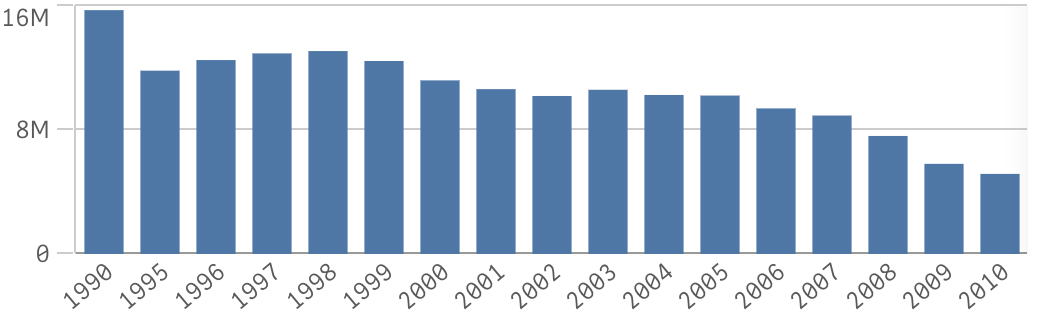
The blurry activity of a speckling of the national map in the visualization in part results from the pointillistic geo-referenced data of remotely sensed data from the NASA satellite Sentinel-5P: but there the data here invests the map with a ghostly tenor, as its pixellated blur recalling nothing so much as an after-image burned on our optic nerves, although it is labelled to give some legibility. It is an image we have burnt onto our world: volcanic eruptions like Krakatoa are studied for their historical imprint, and volcanic eruptions that have increasingly oxidized the atmosphere have historically marked major shifts in global temperature now manifested in climate change, and the industrial uses of carbon fuels that have released as much sulfur into the atmosphere as a major volcano every 1.7 years since 1950 have created a world that we are changing more rapidly than we can grasp. Emissions from power plants and refineries dropped since 1980, when they reached a high point, as we first reckoned with the effects of acid rains that led to Rachel Carson’s work on aquatic ecosystems, appreciating the ecological risks difficult to reverse it creates; if even trace amounts of sulfur dioxide can effect the biological ecosystems and rise temperature, levels of atmospheric emissions astound.
The cascading effects of all that atmospheric loading of gaseous sulfur dioxide released by combusting fossil fuel in industrialized areas wreak havoc on ecosystems, even if most often evident in inhibiting visibility by near-permanent haze. But the particulate matter combines with other pollutants create new level of obscuring smog, they not only enter human lungs to lower mortality, but sulfur acid aerosols increase pH levels to which aquatic creatures are sensitive, defoliating trees and inhibiting plant growth as increased acid rain move not through aquatic systems before leaching into the soil in ways difficult to map: the cascading aftereffect include increased in dying and dead trees across the landscape of potentially far greater combustibility. The United States, in this map, lacks crips outlines, but its global sulfur footprint glows as a deep blue blur of ultramarine that might be lapis, presenting the radiating afterglow created by widespread carbon combustion across the land. There is little differentiation we can recognize–without the tags of the Cascades, Chicagoland, and the San Joaquin valley we would have trouble orienting ourselves, but the BC and Ontario smelters, petroleum refineries, and power plants are the primary sites of orientation to red hotspots and challenge us to orient ourselves to the whole.
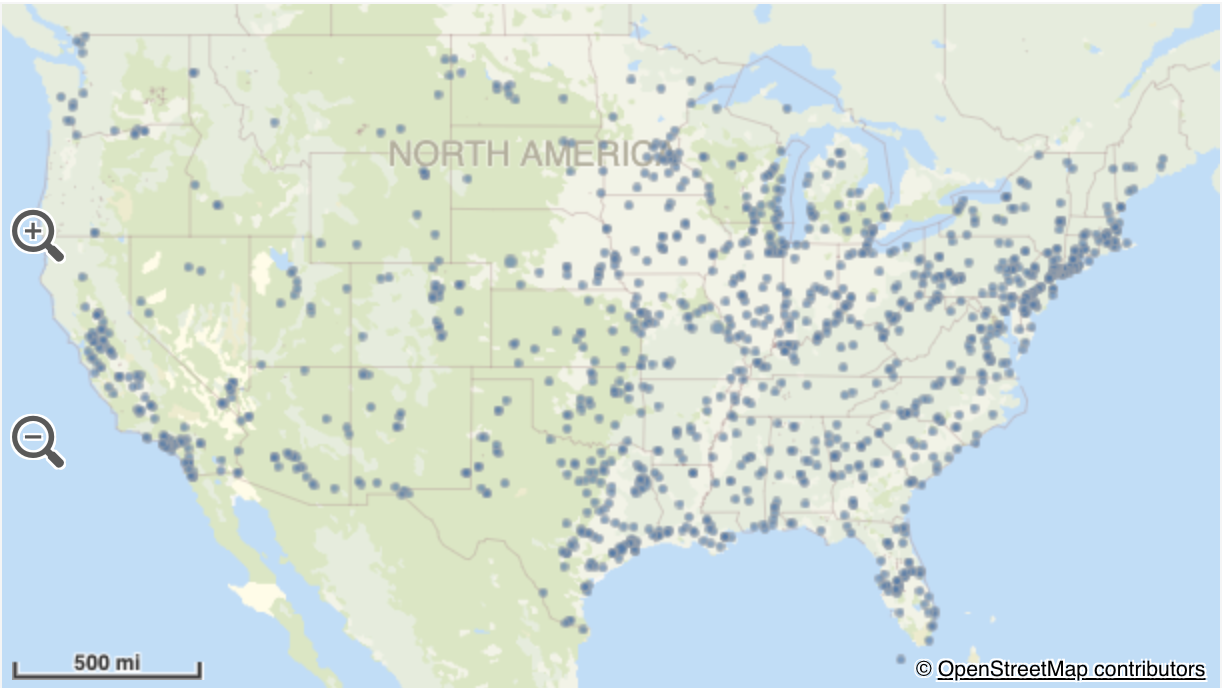
5. The alarming nature of that ghostly static might recall a classic heat-sensitive Talking Heads collective portrait that once graced a classic album cover. It is the anthropogenic residue of the nation, and in many ways the complimentary data vis of the intensification of climate change. The units of sulfur emissions are so staggering the best proxy for their production is perhaps not Dobson units but the active emissions of volcanic eruptions: anthropogenic sulfur emissions have created such a catastrophe in temperature rise, sulfur emissions equal to a rate of a large volcanic eruption every 1.7 years by 1962, and their carbon production exceeded that since by two or three factors, forcing acceleration of global climate change; anthropogenic sulfur emissions decreased after 1980, but rose so dramatically from 1950 through 1980 to provoke the first efforts in national policy to curtail and limit the increasingly devastating effects of acid rain. Concentrated in industrial areas, our sulfur emissions seem to be exploding by 2020 across North America, increasing industrial emission of sulfur even if these emissions were not accorded any clear contributory role in climate change models of the Intergovernmental Panel on Climate Change. And if we focus, as the EPA, on production of SO2 at power plants alone, in a less jarring color palette, the less jarring “data” viewer almost conceals the tonnage of atmospheric pollutants released.
The ease of registering SO2 from satellite scans provides a clear basis for charting the extent of anthropogenic emissions in once remote Indonesia: anthropogenic emission of such climate-forcing gasses now by and large drown out volcanic activities that constitute a major source of sulfurs’ atmospheric release, easily registered remotely, that overwhelm the Indonesia peninsula to put Krakatoa in its place among anthropogenic SO2 emissions overwhelmed the passive release of sulfuric gaseous emissions from local volcanoes, indicated by triangles in low bands of Dobson units, presenting a somewhat complimentary picture of how man-made off-gassing outweighs the passive emissions of volcanic ranges that once created the largest atmospheric off-gassing, so that the emissions of a local power plant may indeed overshadow the passive off-gassing of sulfurs, 2005-7, from Krakatoa, after all.

Interactive Data Language (IDL) version 8.5.1
The extent to which the passive volcanic release of sulfur gasses across Indonesia drowns out the site of volcanic off-gassing, including Krakatoa, in this remotely sensed image from NASA’s Aura satellite’s Ozone Monitoring Instruments (OMI) that the effects of gaseous emissions pale in the force of overwhelming anthropogenic releases of climate-forcing gasses. But, to end this post on an up-beat note, although all these many data-points are remotely sensed, they have been embodied in both graphics of North America with a compelling coherence that allows them to be consumed: if the planetary climate seems to be punching back across the red-blue divide due to the shift of the polar vortex, beyond the nation, global warming is far from mysteriously sourced; the increased combustion of fuels that is effectively spewing increasing sulfur dioxide into our atmosphere remind us of the need for regulation, and help us process, assemble and map the cascading effects of atmospheric pollution on the world.
There is luckily more than a bit of visual intrigue and pleasure to help us process a dire story of anthropogenic change: the fading of the territory of the United States to a vivid deep blue blur that recalls artificial luminescence or background radiation is a classic heat map of pressing concern, and the increasingly cataclysmic new frontiers in climate change we may be poised to confront, perhaps less vertiginously than Monet watched the steam of coal-fired engines fill the capacious station’s atmosphere to obscure the sky seen through its skylights, even as the smoke from their engines seems to blanket out the blue sky.
6. Yet the house of experiment is not large enough in the parameters of our maps: for we have stuck obstinately to the conventions of national borders, and to the land, mapping the areas of human habitation by pattern and habit, although it is likely from the ocean and wind currents that shape our patterns of warming, heating, and cooling, despite the familiarity we have with manners of laying our isotherms atop the land, to predict or forecast the sense of weather that we move through. Yet as the patterns for heating and warming are determined by global air flows, and global patterns, the flattening of data streams compiled from remote observation sources are less than helpful in trying to map the changes that the increase of heat-trapping gasses are about to provoke.
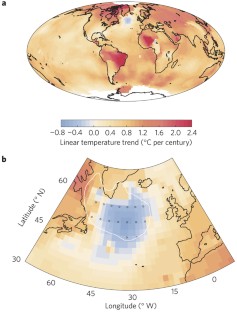
For the disturbance that is provoked in global temperatures seem to cascade, and the shifting of weather patterns that may be due to the surprising blob of cold water that is the outlier to warming temperatures–and the stubborn persistance of those declining temperatures in the northern sea, which may be slowing the inking of cold water into the ocean in the gulf stream, and the shunting warm air from the carribean into Europe and Africa, altering ocean currents after the melting of Greenland’s ice shelfs rom the 1950s, perhaps wrecking havoc in the stability of temperature systems
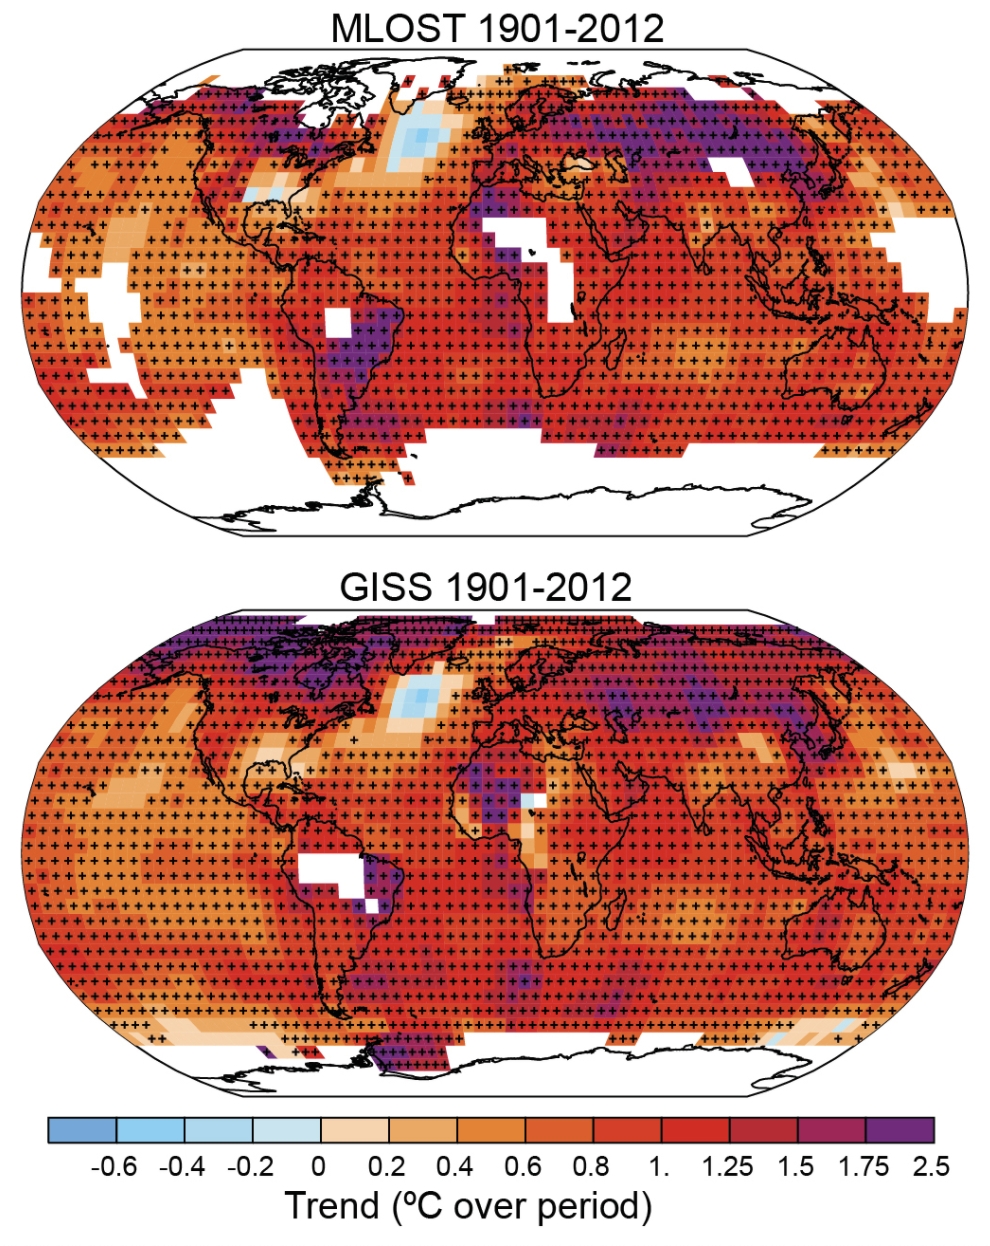

Such changes in the circulation of ocean water that has long sent warm water from the tropics to Europe, arises from the sea, rather than the land, but stands to alter land temperatures more radically than an isotherm of land temperatures alone can hope to capture, and suggests a huge disturbance that has shifted atmospheric currents long in place, which stands to accelerate as the blue blob of cooler water lying in the northern Atlantic grows as a paradoxical result of climate change, changing the salinity and the temperatures of water, and reducing its ability to accept atmospheric heat. The cold blob that has lower by nearly a degree centigrade as most of the world’s temperature has increased by over a full degree–and some risen by two–the shifting nature of the conveyor belt of oceanic currents that create a sense of atmospheric stability could trigger a cataclysmic shift in habitats and livability as the warm water of the Gulf Stream, feared to displace the very stream of warm surface water north that returns cold water to the southern hemisphere raises fearsome questions of altering ecosystems if it slows global ocean cycle.
The very possibility of such a shift in currents could lead to cascading changes of global performance, from increasing intensity of hurricanes forming in warmer waters of the Caribbean, accelerated ocean-level rise along the Atlantic coast, a shift in wind currents along the ocean and ocean waters absorbing fewer CO2 emissions; the cold water lurking off the coast of Greenland that prevents warm waters from flowing northwards may send more Caribbean air entering Europe–and drying out Africa–in a “global weirding” of cascading consequences more than current maps can portray.
To be sure, the striking NOAA map of atmospheric sciences dates from early 2016, or just before the climate change research program of the government agency was slashed and would continue to be reduced in half by a President who called global warming a hoax perpetuated by the Chinese government to paralyze the American economy, rather than a global crisis–before pulling out of the Paris Accords, of course, in June, 2017, after broad cuts to the EPA’s monitoring of national data and the closing of a climate change website the EPA long maintained, after the EPA administrator prioritized economic interests over environmental protections, demanding “protecting the environment by engaging with state, local, and tribal partners to create sensible regulations that enhance economic growth” after Trump dismantled all action of the previous President on climate change–economic growth he saw as rooted in protecting leases for coal mining on federal lands, regulation of coal-fired power plants, and expanding nuclear power plants, hydraulic fracking, and pipelines to provide more fossil fuels.
The map composite is an eery echoe of the past, and perhaps marks a sort of tipping point in itself that we are only revisiting now, with Trump out of political office. The strikingly pronounced reduction in funds for all polar weather satellites by the Trump administration in each of its annual budgets downgraded the very weather system satellites crucial to the creation of compelling maps and forecasts–but that had led to concerns of the slowing of the Meridional Overturning Circulation”–AMOC–in land/sea satellite composites that blended surface temperatures by 2016. The maps placed a premium on questions of the feared slowdown of the circulation of ocean currents as a result of fewer salty waters sinking to the depths of the Arctic ocean, leading warm water to flow toward England and Scandinavian lands and creating huge marine ecosystems for Atlantic migration. As more of the Greenland ice sheet melts, sinking far less water of greater density to ocean depths, the fears of a disturbance of AMOC stands as a tipping point to shift global temperatures we look at in isolation, in month-by-month nightly weather reports, rather than a global context–let alone in the hundred-year syntheses of trends in surface temperatures.
7. But searching for maps that describe contingency, and multi-causal mechanics that threaten to throw a series of switches in climate change may be hard to look to maps to try to portray, but rarely examine in global context. Have we become overly focussed on the land alone? We rely on maps to narrate and make concrete the prospect of impending danger, and they remind us of the linkages and intertwined causalities of land, air, and water, that a focus on atmospheric conditions or conditions on the ground alone will not be able to capture, when the cascading dynamics of once stable land-ocean dynamics are destined to erode. We face questions only of when such boundaries will erode, but struggle to map the interdependent nature of air temperatures and deep water temperatures and currents. As the masses amount of ice shelfs currently melting off Greenland sent more and more freshwater into the Atlantic, sinking less saltwater into the ocean, and reducing northward flown of the Gulf Stream, as a warming waters in the Caribbean create conditions for a coral reef die-off, and a regional cooling of North America, as increasing methane cases are released by the melting northern tundra and thawing of frozen grounds release more greenhouse gasses.
We badly need far better mapping of the mechanics of climate change; but the mapping of “tipping points” that start with changing ocean temperatures and salinity span land and sea-level rise. The dangers of shifting ocean currents pose problems of creating the very feedback loops that oceanographers are raising increased concern.
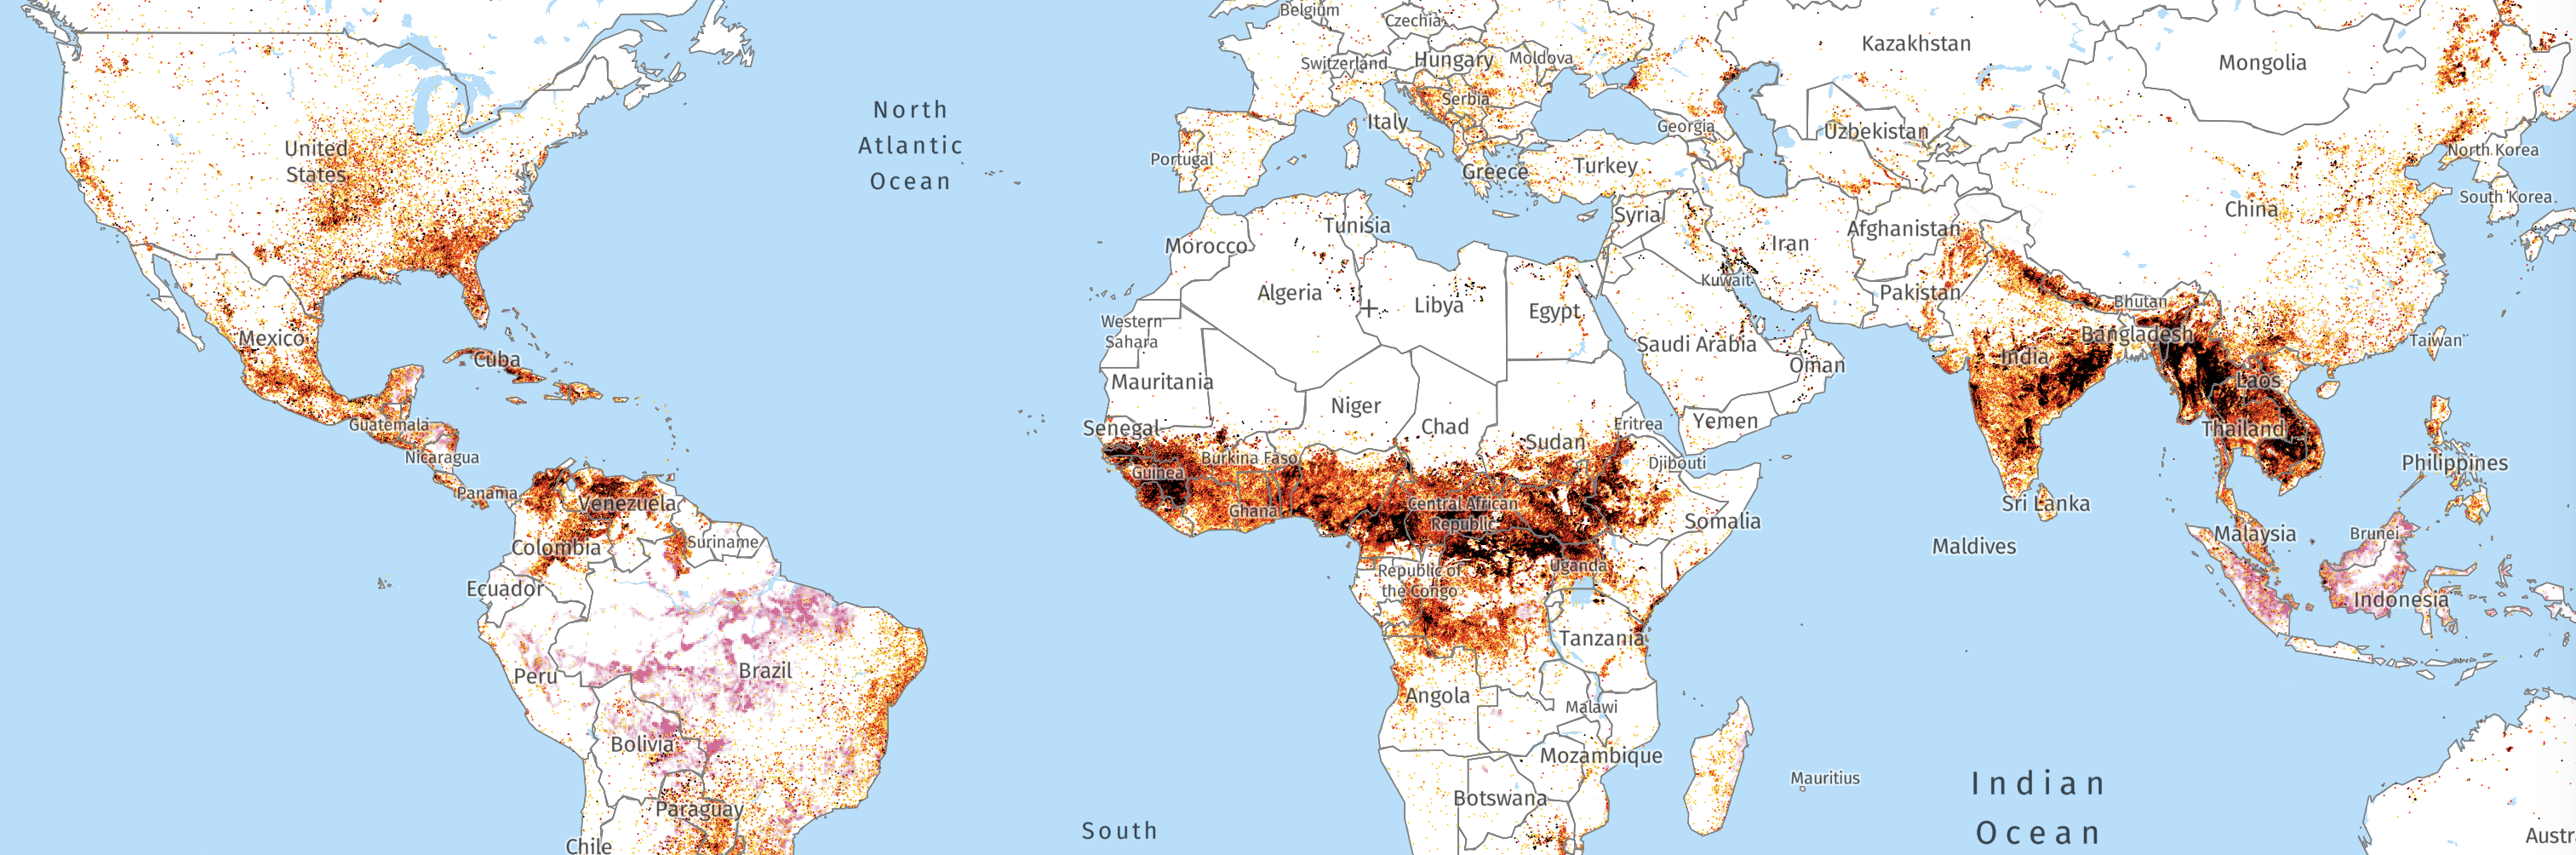
6. The layers of our maps are, locked to land as they are, difficult to link to the atmosphere, but as maps of emissions, the addition of remotely observed data is an addition of the loss of old growth forests and forested land due to fires, that has deprived us of one of the biggest sponges of carbon emissions on which the planet relies. The increased deregulation that has deprived the world of this carbon sponge on which it has long relied to decrease greenhouse gasses of anthropogenic origin is limiting the ability to pull carbon from the atmosphere, as forests have been burned and old growth trees that have long sequestered carbon are lost. The destruction of those old growth forests has been steadily accelerating with deregulation, of course, with a rapaciousness that seems to akin to the bolstering of freedoms of plunder, enrichment, and mismanagement.
The problem such maps direct ot he need for the mitigation of forest fires are clear. Deforestation has been credibly argued to decrease emissions by up to 5.8 billion tons of carbon dioxide emissions annually, but the reduction of forests by the combination of fires and clear-cutting, according to Global Forest Watch, have meant the loss of tropical forests that undermine attempts to restrain warming temperatures–as forest ires have consumed an ever-increasing amount of forests across the globe, and not only at the equator, that might be able to provide as much as 30% of the solution to keeping global temperatures low, but were removing CO2 removal in the past twenty years: improperly monitored agriculture, forestry, and land use has contributed almost a quarter of totoal anthropogenic emissions of CO2, methane, and nitrous oxide, with high confidence, and a driver of total land-atmosphere CO2 flux. Wood harvesting alone accounts for some 13% of anthropogenic co2 emissions, foreclosing possibilities of removing anthropogenic carbon from the atmosphere: the elevated temperatures stand to leave growing risks of severe fires in the rainforest biomes with high confidence, as well as in boreal forests.

As it stands, the rapid pace of fires–including the fires or cutting of old growth forests that were long reserves of carbon–demands to be seen as a consequence not only of deregulation of forest clear cutting on each continent but as coupled with poor fire prevention a poor global preparation for climate change, hobbling us in the fight to keep global temperatures low, by mitigating climate change: if not as concentrated as industrial emissions, when each tree is burned from the global forest, the carbon that it stored–and the timespan across which it stored it–returns to the atmosphere, putting us in an ever more precarious position in relation to runaway climate warming.

While the sustained loss of forests able to sequester released carbon is a major share of the maintenance of a healty climate as we court climactic disaster at extreme temperatures, and the world over-heats, with untold consequences of catastrophe, the train is surely coming into the station as we seek to adopt better regulation and mitigation programs, but also to manage forests more resonsibly in the coming millennium.

