In an age it is disturbingly familiar for news maps to place us on tenterhooks by grabbing our attention, the existential urgency of the blanket of the continent with icy arctic air was no exception. But if the images of sudden entrance of frigid air shocked most states in the union and lower forty eight, the farther one collapsed the week of freezing cold, the more one could see a clarion call for the re-entrance into the Paris Accords. It was as if NOAA visualizers of meteorological disturbances, newly liberated, were free to show the dangerous consequences of the tippy polar vortex and uncertain weather in an era of extreme climate change. Bright color ramps foregrounded falling temps in rich magenta or icy blue were almost off the charts, from the uppermost end of the spectrum in their duration–below–or in the low temperatures that were advanced–in maps that push the boundaries of expectations with urgency.
As maps of the hours the nation was plunged into subzero trace a purple cold front advanced all the way into the deep south as it spread across the continent from up north, the continent shivered under the icy blues over the mid-February cold spell. As we re-enter global climate accords, and consider what global accords can come to terms with climate change, it seems opportune to consider the alerts that remotely sensed mappings of our changing global climate chart. The chromatic intensity jarred with the familiar spectrum of meteorological maps to shock the viewer: the map challenged any reader to try to place the arrival of cold air and hours below freezing in a frame of reference, to dismiss the incursion of icy air up to the US-Mexico border as an irregular occurrence, more than a harbinger of premonition of the cascading effects of extreme weather, let alone a warning of the limits of our national infrastructure to adjust to it.
If the focus of the NOAA maps of the National Weather Service fulfilled their mandate by focussing on the territoriality of the United States, these images and the news maps made of them communicated a sense of national violation, if not of the injustice of the incursion of such unexpected freezing temperatures and Arctic air, as if it were an unplanned invasion of the lifestyle, expectations, energy policy, and even of the electric grid of the United States, oddly affirming the American exceptionalism of the United States’ territory and climate, as if the meteorological maps that confounded predictions were not a global climactic change.
And in the maps of the fall in national temperatures, as in the header to this post, the news that the nation witnessed a frozen core spread south to the southwest, almost reaching the border, seemed to shift our eyes from a border that was mapped and remapped as permeable to migration, to a map of unpreparedness for climate change, almost echoing the systemic denial of climate change that has been a virtual pillar of the Trump Presidency on the eve when Donald Trump had permanently relocated to Mar a Lago, one of the last areas of the nation that was not hit by the subzero temperature anomalies that spread across north Texas, Oklahoma, Kansas, Missouri, New Mexico and Iowa, plunging the many states we though of as “red” during the past election an icy deep blue interior in mid-February down to the Gulf Coast–as if the colors were a national crisis not of our own making for a nation that had obsequiously voted Republican, withdrawn from the Paris Accords, and allowed the warmer temperatures to be located only in the state where Donald Trump was now residing in Mar a Lago.
–that , as the week of arctic air’s arrival wore on, the newspaper of record glossed by a color ramp of low temperatures few residents southern states expected to be plunged into subzero surroundings. The color ramp they chose to chart how gelid air poured set off a cascade of events and disasters nicely demonstrated cascading effects of climate change on the nation, as the shock of low temperatures sucked the national attention away from the border, and begged one to come to terms with the challenge of climate emergencies in global terms. The frozen core of the nation was a wake-up call, re-re-rendering the familiar Red, White and Blue in faded out terms of the distorted levels of cold the nation currently confronts–the increased escalation of which we are projected to face.
The entrance of gelid air from a polar vortex poured across much of the midwest in unrelenting fashion. Plunging subzero temps hit the Texas coast that overloaded electric grids and shocked weather maps that seemed out of whack even for mid-February, as even the sunbelt of the southwest turned gelid cold as subzero temperatures arrived over a week, plunging the arctic neckline down into Texas, and almost across the southwestern border.
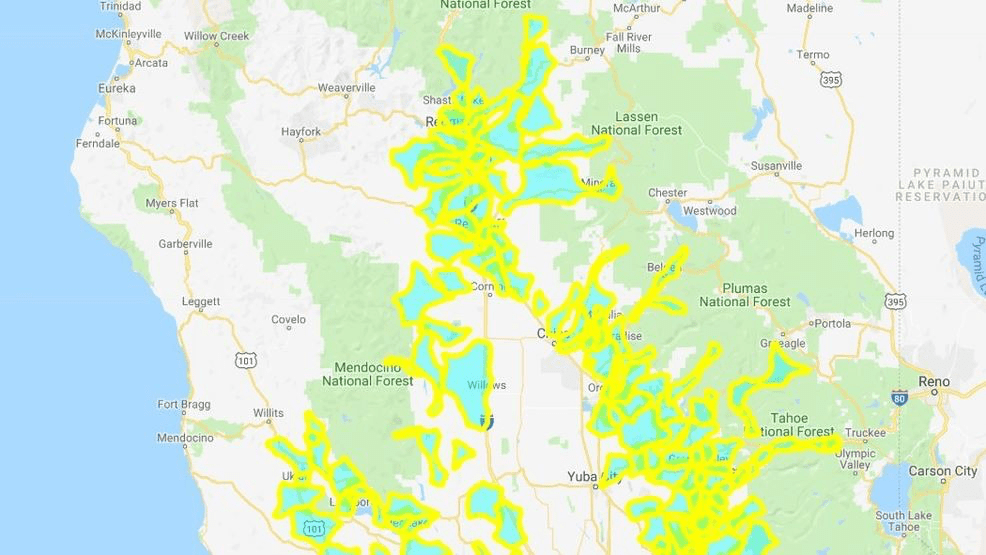
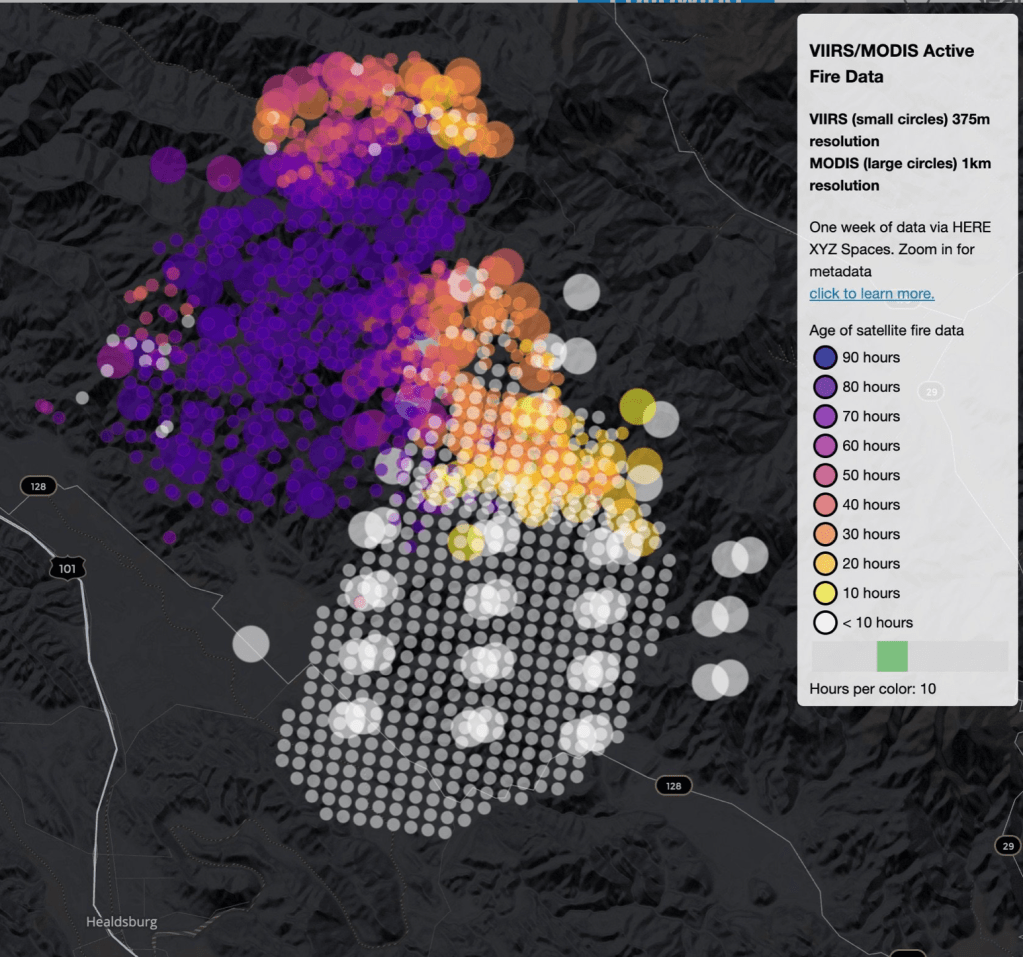
The announcement in California of the arrival of random power shut-offs this fire season sent everyone scrambling to maps. In order to stop fires spread of fires, the impending public safety power shut-offs crashed websites as folks scrambled to get updates in real time, frustrated by the relative opacity of maps in a hub of high tech mapping and public data, as the impending possibility of power shut-offs wreaked neurological chaos on peoples’ bearings. From mapping fires, we transitioned to the uncertainty of mapping regions where consumers would lose power in an attempt to prevent fires from spreading due to strikes on live wires of broken limbs, branches, or failed transmission structures whose immanent collapse were feared to trigger apocalyptic fires of the scale of those witnessed last fires season, as the largest fire in California history raged for days, destroying property and flattening towns, burning victims who followed GPS lacking real-time information about fires’ spread.
In an eery mirroring of looking to maps to monitor the real-time spread of fires, which we sensed in much of California by smoke’s acrid air, the expectancies to which we had been habituated to consult real-time updates was transferred to the availability of electricity, in a sort of mirror image unsurprising as the outages were intended to stop fires’ spread. The decision to continue public power safety shut-offs as a part of the new landscape of controlling fires’ spread in future years–perhaps needs to be accepted for up to a decade, although this was walked back to but five years in recent years.
Expanded power shut-offs justified by needs for public safety suggest how much climate change has changed the expanded nature of fire risk. But in an era when the vast majority of televised segments that aired on network television– ABC, CBS, and NBC combined–despite an abundance of powerful image and video footage the 243 segments on destructive wildfires raging across northern and southern California, a type of public disinformation seems to have been practiced by most news outlets that served only to disorient viewers from gaining any purchase on the fires, colored by the shifting validity of climate change denial as a position among their viewing public: only eight of the news media mentions of the fires, or 3.3%, mentioned climate change as a factor in the fires’s spread, from October 21 to November 1, as the spread of fires in northern California grew that precipitated public power shut-offs. If new cycles shy away from citing climate change as a factor on the spread of fires, most of the mentions came from specific weather reporters, from NBC’s Al Roker to CBS’ Jeff Berardelli, extending the range of fire seasons and area of burn, the silo-ization of such explanations were rarely digested in mainline reporting. And if FOX ran 179 segments on the fires, more than other cable networks, climate change was mentioned in 1.7%, with most segments mocking the contribution of climate change.
If we are poorly served by the news media in reporting the fires and downplaying climate change–or indeed criticizing California for poorly maintaining its forests’ safety, as President Trump, the eery landscapes provided by PG&E raise questions about the messages they communicate.
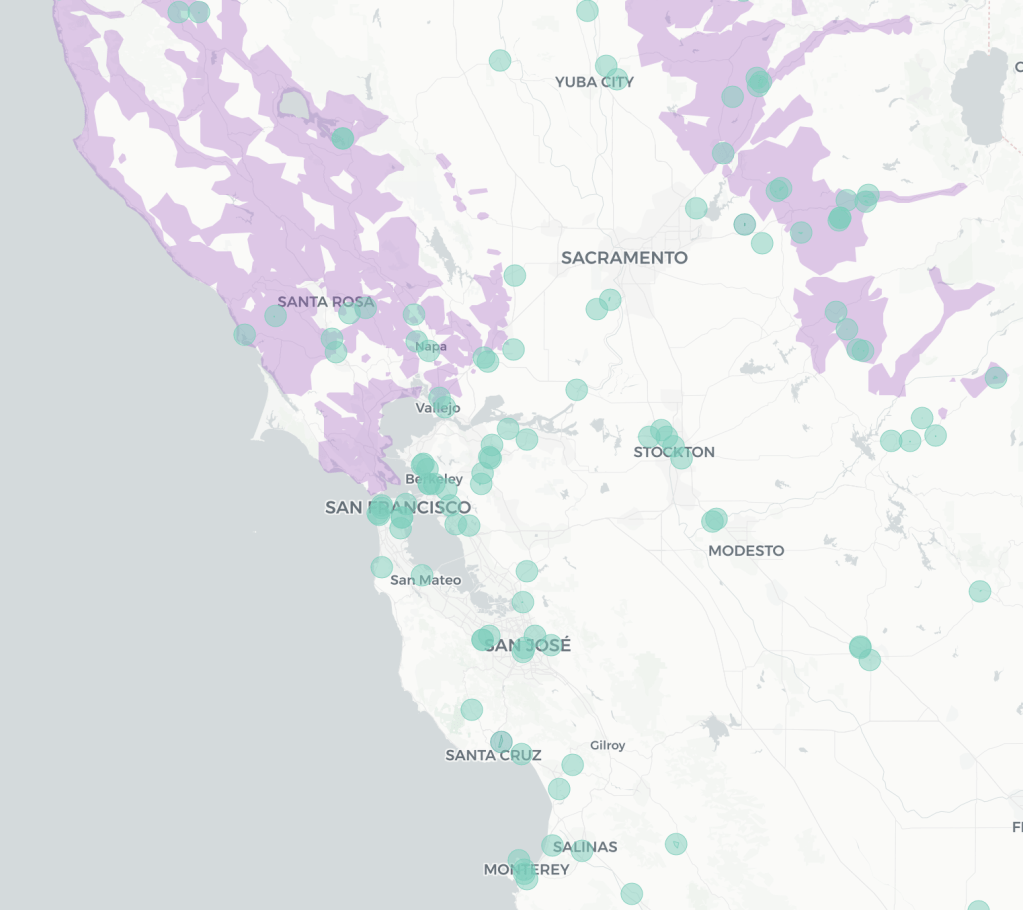
But the electric green maps of a startlingly unnatural aquamarine, yellow, and orange suggested a strange distantiation of the landscape in the age of Climate Change. The electrified hues of the maps, which monitored the possibility of customers loosing electricity in many districts, reveals a level of poor management and lack of any coherent strategy for climate change as much as the huge area that is served by PG&E, and the man-made infrastructure of electricity and transmission towers, which courts have rightly decided the privately-owned power agency that serves state residents is responsible for.
While we follow the news, even among the most die-hard news addicts, the prospect of “public safety” power shut-offs seemed unannounced and irresponsible, and a premonition of a new landscape of risk. For the shut-offs that were announced as impending by PG&E reflect a deep insecurity of fires, climate change and perhaps what we feared was a collective unpreparedness to deal with a new set of implications of climate crisis we have not even been able to acknowledge or even fully recognize, but which seemed spinning out of control–even in the nature of maps that were made of it–and to betray a lack of imagination, creativity, and foresight, abandoning the long-term view.
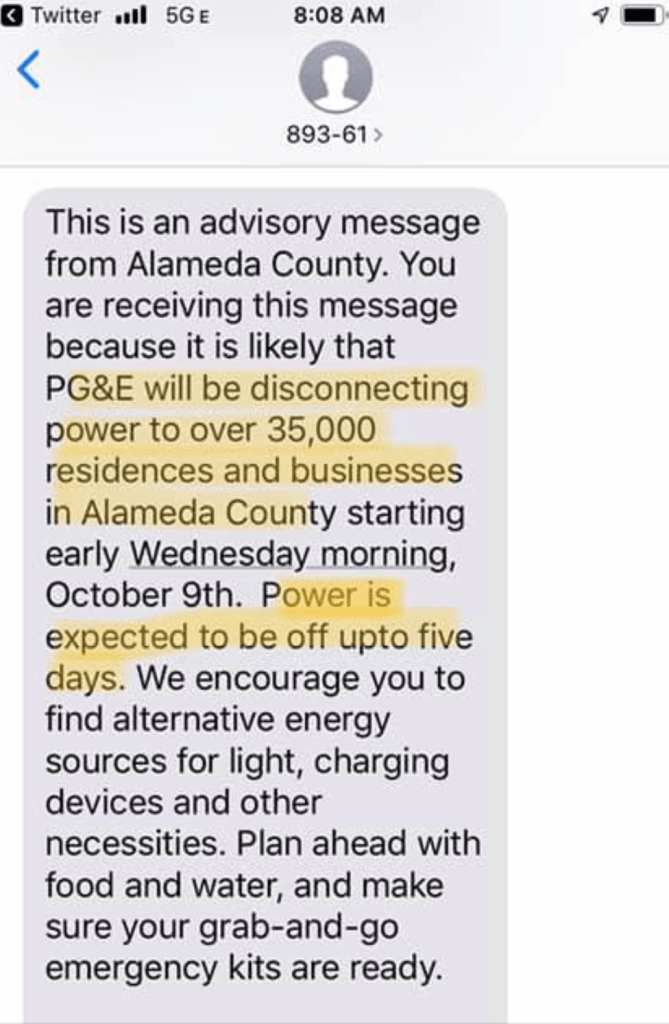
The sense of emergency electrifies a landscape whose woodland-urban interface is electrified by aging power structures and transmission lines, carrying increased current to extra-urban areas. And there is a fear that the long-term view is lacking, as we continue to turn to maps, even months after the first shut-offs were announced to forestall fears of a raging fire season. As we map the expanding sense of risk to respond to both demand for currently updated real-time maps for fires, and the calamitous images of apocalyptic fires raging that dominate the news cycle and make us fear the near future, or have a sense of living with a deferred sense of emergency at our doorsteps. And so when we received a text message of impending loss of electricity, we turned en masse to maps to learn about outages at risk, alerted to the need to ready ourselves as best we could by our local government-
Extreme fire prevention funding, precarious in the Trump Era, stands to be abolished as the Dept. of Interior retreats from federal fire programs: the Wildland Fire Office, funded at $13 million in 2012, if slated to be abolished in the Trump era, in an agenda denying climate change, lacks funding, undermining close scientific examination of a new topography of fires, even as climate change has increased the costliness of fires and the ferocity of their spreads. If the costs of the Camp Fire of 2018 grow beyond $10 billion–or over six times as much as the Oakland Firestorm of 1991–those costs and the cost of insurance liabilities only stand to grow. As we confront poor planning of climate readiness, as we lack real images of extinguishing fires’ spread–and imagine the temporary shut offs can intervene as a deus ex machine to prevent fires’ spreads all we have to forestall the fears of spreading flames and intense firestorms or whirls.
In the Bay Area, where I live, the danger of the new firescape is so pressing, and so impossible to process, that we can only digest it as a danger that is ever-present, akin to living in an active seismic area, but we cannot process in a static or dynamic map.
But this is an area of risk that we are living cheek-by-jowl beside in ways that are truly unfathomable. As the power shut-off zones have been expanded in clearer detail by PG&E in response to the growing gustiness of winds that threaten to compromise the safety of residents as well as the aging electric infrastructure of the state, we are oddly haunted by past promises to maintain or upgrade our national infrastructure–the promise to rebuild national infrastructure was itself an energizing call of the Trump campaign–only to be demoted by being assigned, with improved veteran care, the opioid addiction, workforce retraining, and the Middle East peace to Jared Kushner, in ways tantamount to moving it to the way back burner, soon after being mentioned in the State of the Union as a non-partisan issue in January, 2018.
And yet, the spread of fires with increased rapidity, across landscapes that remain highly flammable, has created terrifying imagers of a highly combustible landscapes, where the recent growth of fires–in this case, the Kincade Fire that did began only long after the shut-off policies began–chart the spread of fires across terrain multiple times larger than cities, moving across the landscape rapidly, driven by unprecedentedly strong offshore winds: the passing overhead of satellites charts its expansion, making us fear the expansion of the next pass overhead as realtime images of the durations of fires only grows.
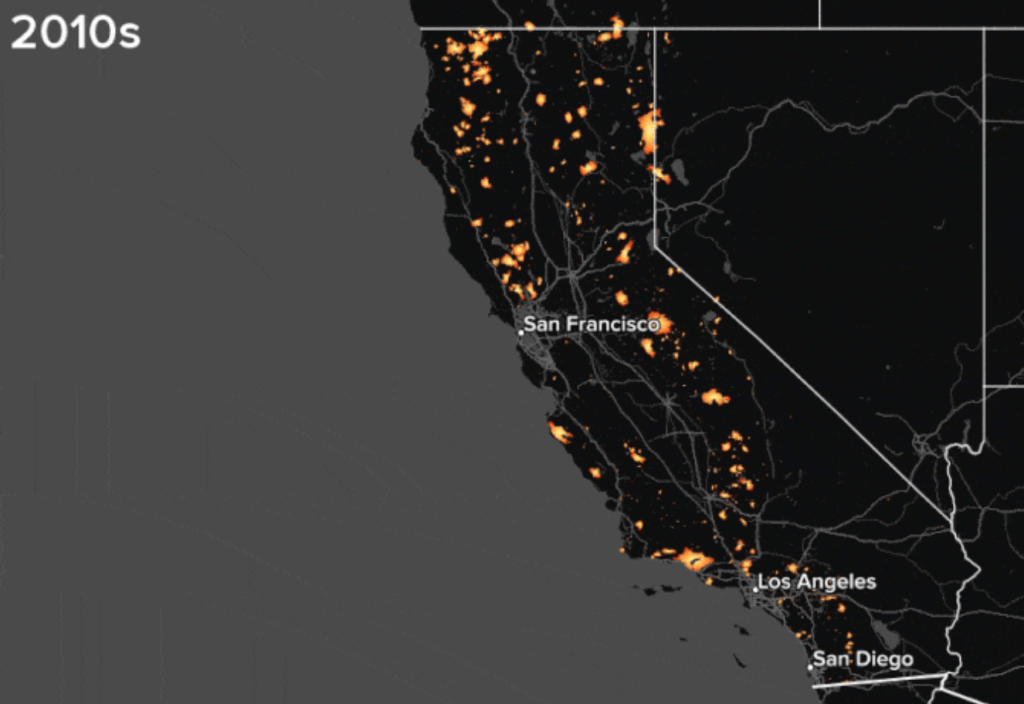
Sure, the current landscape had long seemed to be burning up at a rate we had not begun to adequately acknowledge–as Peter Aldhous promptly reminded any of us who needed reminding in Buzzfeed, providing a GIF of CalFire’s data of areas of California that had burned since the 1950s, decade by decade, in an animation of red bursts of flames atop a black map, that seemed to eerily illuminate the state by the 2000s, and hit much of the north by the 2010s, as they close,–illuminating fires as a state-localized crisis–
Peter Aldhous for Buzzfeed from CalFire and frap.fire.ca.gov
but the scope of human-caused fires that have consumed land, property, and habitat are a truly endemic crisis in California, he showed, in ways that he suggested reflect a parched landscape and the uptick of human-generated fires that are a direct consequence of climate change, especially in a region of increased residential construction. This sense of illumination places a huge onus on PG&E for its corporate responsibility, and the very notion of distributing electricity and power as we once did,–and illuminates the imperative to think about a new form of energy grid.
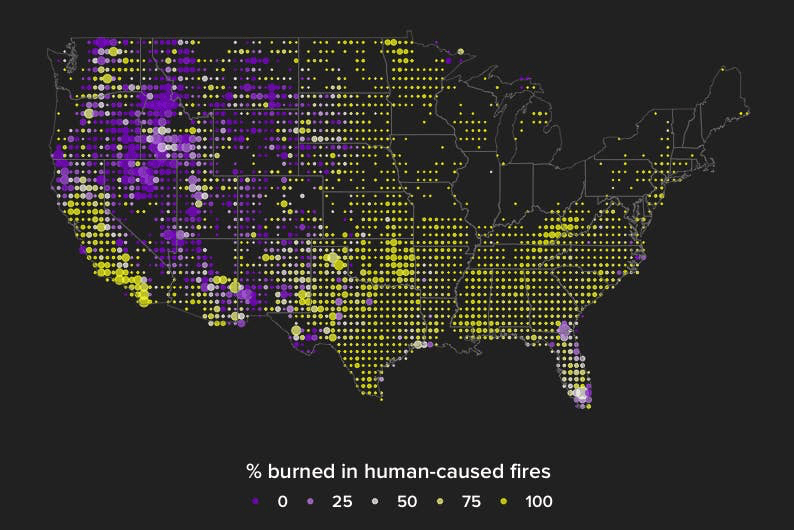
Indeed, the parsing of “human-caused fires” as a bucket suggests the real need to expand the classification of wildfires. Whereas most earlier fires were caused by lightening strikes in the western states, the expansion of housing and electricity into areas suffering from massive drought–as if in an eery reflection of the spread of “slash fires” across the midwest during the expansion of railroads that caused a rage if firestorms coinciding with World War I–press against the category of fires as wild. The deeper question that these maps provoke–as do the data of Cal Fire–is whether the term wildfires is appropriate to discuss the hugely increased risk of fires that damage or destroy property and land.
We read more maps than ever before, and rely on maps to process and embody information that seems increasingly intangible by nature. But we define coherence in maps all too readily, without the skepticism that might be offered by an ethics of reading maps that we all to readily consult and devour. Paradoxically, the map, which long established a centering means to understand geographical information, has become regarded uncritically. As we rely on maps to organize our changing relation to space, do we need to be more conscious of how they preset information? While it is meant to be entertaining, this blog examines the construction of map as an argument, and proposition, to explore what the ethics of mapping might be. It's a labor of love; any support readers can offer is appreciated!