Coasts have provided the primary cartographical invention to understand the risks that erosion pose to property: the coast-line is the boundary of the known land, and determines the outer bound of the real estate. But the coastal fixation of the landlubber privileges the illusion of the fixity of the shore. More than ever, assumptions about the fixity of shorelines must fall away. Perhaps the most haunting take away from the Surging Seas web-based map of global shorelines forces us to take into account the inevitable mutability that must be accepted with the rising of ocean-level associated with climate change.
The web-map presents itself as a set of tools of analysis, as much as cartographical techniques, by which the rise of sea-level that has already risen globally some eight inches since 1880 stands to accelerate–emphasizing the alternate scenarios that the acceleration of sea-level rise stands to bring over the next hundred years, introducing a new concept of risk due to coastal flooding. The availability of accurate GPS images of the elevations of homes have provided the possibility of sketching scenarios of sea-level rise to create readily zoomable maps of elevated ocean levels that confront us with at least the image of the options which we still theoretically have. The contrasting futures created in this cartographical comparison shocks viewers with a salutary sort of operational paranoia only increased as one fiddles with a slider bar to grant greater specificity to the disastrous local consequences of rising sea-levels world-wide.
In ways quite unlike the wonderfully detailed old NOAA Topographic Surveys which map shorelines at regular transects, or T-Sheets, recording the high waterline of tides across 95,000 coastal miles and 3.4 million square miles of open sea, the coastline is less the subject of these web maps than levels of potential inundation. In a negative-mapping of possibilities of human habitation, blue hues invade the landscape in a monitory metric emphasizing the regions at risk of being underwater in a century. Whereas scanned T-Sheets can now be viewed by a historical time-bar slider, the fixity of space or time are less relevant to the web maps than the gradients of possible sea-level rise caused by carbon emissions might force us to confront.
Surging Seas forces us to confront the possibilities of the future underwater world. The infiltration of a deep shade of blue commands the eye by its intensity, deeper shades signifying greater depth, in ways that eerily underscore the deep connection that all land has to the sea that we are apt to turn our backs upon in most land maps, showing the extent to which a changing world will have to familiarize itself to water-level rise in the not-distant future. It’s almost paradoxical that the national frontiers we have inscribed on maps has until recently effectually made impossible such a global view, but the attraction of imagining the somewhat apocalyptic possibility of sea-level rise seems almost to map a forbidden future we are not usually allowed to see, and has a weirdly pleasurable (if also terrifying) aspect of viewing the extensive consequences of what might be with a stunning level of specific and zoomable local detail we would not otherwise be able to imagine, in what almost seems a fantasia of the possibilities of mapping an otherwise unforeseen loss, not to speak of the apparent lack of coherence of a post-modern world.
For the variety of potential consequences of disastrous scenarios of sea-level rise posed can be readily compared with surprisingly effective and accurate degrees of precision, in maps that illustrate the depths at which specific regions stand to be submerged underwater should sea-level rise continue or accelerate: zooming into neighborhoods one knows, or cities with which one is familiar, the rapid alteration of two to seven feet in sea-level can be imagined–as can the fates of the some 5 million people worldwide who live less than four feet above sea-level. For if the shores have long been among the most crowded and popular sites of human habitation–from New York to London to Hong Kong to Mumbai to Jakarta to Venice–the increasing rapidity of polar melting due to climate change stands to produce up to a seven feet rise in sea-level if current rates of carbon emissions, and a mere four degree centigrade rise in global temperature stands to put the homes of over 450 million underwater, which even the most aggressive cutting in carbon emissions might lower to only 130 million, if rates of warming are limited to but 2°C. (If things continues as they stand, the homes of some 145 million who currently dwell on land in China alone are threatened with inundation.)
The recent review of the disastrous consequences of a rise of two degrees Centigrade on the land-sea boundary of the United States led Climate Central to plot the effects of a-level rise of at least 20 feet on the country–and foreground those regions that were most at risk. The webmap serves as something like a window into the possible futures of climate change, whose slider allows us to create elevations in sea-level that the ongoing melting of the polar ice-cap seems poised to create. As much as offer compare and contrast catastrophes, the immediacy of recognizing the degree to which places of particular familiarity may soon stand to lie underwater performs a neat trick: for whereas a map might be said to bring closer the regions from which one is spatially removed or stands apart, making present the far-off by allowing one to navigate its spatial disposition in systematic fashion, the opacity of those light blue layers of rising seas obscures and subtracts potentially once-familiar site of settlement, effectively removing land from one’s ken as it is subtracted from the content of the map, and charting land losses as much as allowing its observation.
The result is dependably eery. The encroachment of the oceans consequent to rising sea-level propose a future worthy of disaster films. But the risks can be viewed in a more measured ways in the maps of sea-level on the shores of the United States calculated and mapped by Stamen design in the Surging Seas project that allows us to imagine different scenarios of sea-level rise on actual neighborhoods–the set of interactive maps, now aptly retitled Mapping Choices, will not only cause us to rethink different scenarios of shifting shorelines by revisiting our favorite low-lying regions, or allow us to create our own videos of Google Earth Flyovers of different areas of the world. Mapping Choices provides a way to view the risks and vulnerabilities to climate change made particularly graphic in centers of population particularly low-lying, where they testify to the clarity with which web maps can create a vision of imagined experience as we imagine the actual losses that global warming is poised to create. And although the recent expansion of the map to a global research report, allowing us to examine possible global futures that are otherwise difficult to comprehend or process the potential risks posed by the inundation of low-lying inhabited regions for a stretch of thirty meters, the potential risk of inundation is perhaps most metaphorically powerful for that region that one best knows, where the efficacy of a simple side-by-side juxtaposition of alternate potential realities has the unexpected effect of hitting one in one’s gut: for debates about the possibilities of climate change suddenly gain a specificity that command a level of attention one can only wonder why one never before confronted as an actual reality.
Maps are rarely seen as surrogates for observation, and web maps often offer something like a set of directions, or way finding tools. But the predicted scenarios of sea-levle rise allows one to grasp the local levels of inundation with a specificity that allow risk to be seen in terms of actual buildings–block by block–and wrestle with the risks that climate change portends. The lack of defenses of populations in many regions are definitely also at great risk, but to envision the loss of property and known space seems oddly more affecting in such an iconic map of Manhattan–and somewhat more poetic as an illustration of the fungibility of its hypertrophied real estate and property values.
Of course, the data of Climate Change allows a terrifying view of the future of four degrees centigrade warming on low-lying Boston and the shores of the Charles, as the city is reduced to a rump of an archipelago–
or the disastrous scenarios for the populations in the lower lying areas of Jakarta–
or, indeed, in Mumbai–
Viewers are encouraged to imagine the risks of the possible alternate futures of just two degrees with an immediacy that worms into one’s mind. The possibilities that GPS offers of instantaneous calculations of shoreline position and elevations allow one to view a potential reality where one can focus on individual streets with inspirational urgency.
But such scenarios seem somehow particularly graphic illustrations of risk for those regions where there has been a huge investment of human capital, as New York City, where it might seem credible enough to be mapped that they are poised to melt not into air but vanish beneath ocean waves. For if Marx predicted with spirited apocalypticism at the very start of the Communist Manifesto that capitalism would destroy value to money as it expanded into future markets, as market forces abstracted all things into money–and “all that is solid melts into air”–the twentieth-century expansion of possibilities of environmental and human destruction have lent unprecedented urgency. While for Marx the metaphor of melting of inherent value was the product of the capitalist system, the capitalist system bodes a strikingly similar image of sinking into the seas. For huge expanses of the old industrial city–the piers and the old manufacturing zones, most all of the Jersey shore and area around Newark, Long Island City and the Gowanus canal seem sink apart from the shoreline in the future New York that Surging Seas creates, in ways that seem the consequence of industrial production and carbon surging far beyond 400 parts per million (ppm), with the addition of some 2 ppm per year, in ways that make it a challenge to return to the levels deemed healthy–let alone the levels of 275 ppm which the planet long held through the mid-eighteenth century.
That drought, hurricanes, disappearance of arctic ice (up to 80% in summertime) and rising sea levels are tied to the growth of greenhouse gasses hint how global capital might be closely linked to the sinking into the seas, and suggest the surpassing of a tipping point of climate change that is the counterpart to melting into air might be viewed, in New York City’s economic geography, as if to offer a poetic reflection of the migration of capital into the financial centers of the city downtown from its piers or areas of industry–
–although half-hearted joking references to Marxist maxims (or geographers) is hardly the topic of this post, and the island of high finance that would be created in downtown Manhattan would hardly have ever been planned as an island.
What one might someday see as the lopping off of much of lower Manhattan might be far better tied to the runaway markets of a free-trade economy, rather than rational planning, and has no clear correspondence to property values.
Indeed, the mapping of the prospective loss of those residential parts of the city “where poor people dwell” (as do minorities) is undeniable, if one looks at the 2010 American Community Survey, regarding either in the city’s distribution of ethnic groups or households earning below $30,000, who remain the most vulnerable to the danger of rising ocean levels.
But the disappearance of the Eastern Parkway and the Jersey shore are a blunt reminder of the extreme vulnerability of the built environment that lies close to sea-level–
–and an actually not-too-apocalyptic reminder, but the mapping of consequences of man-made change that goes under the rubric of anthropocene, and is most apparent in the increasing quotient of carbon dioxide in the atmosphere and the warming that this may bring. For if it has been approximated that there has already been a rise of sea-levels by some eight inches since 1880, the unprecedented acceleration of that rate, which will increase the dangers of floods from storms and place many of the some three thousand coastal towns at risk, are likely to increase as the sea level may rise from two to over seven feet during the new century.
The distribution is by no means uniform, and more industrialized countries, like the United States, are producing far more particulate matter, although they have been recently overtaken by China from 2007, and have atmospheres above 380 ppm in the Spring, making them more responsible for rendering higher temperatures–although the lower-lying lands below the equator may be most vulnerable to the consequences of climate change.
The increasing levels of particulate matter are attempted to be more locally mapped in Surging Seas.
The changes extend, in a nice dramatic detail, into the Central Park Meer rejoining the East River with the predicted inundation of much of the posh residential area of Manhattan’s East Side, all the way to Fifth Avenue.
It is difficult not to compare the scenarios sketched in Surging Seas maps to some of the maps of those future islands of New York that Map Box and others allowed Sarah Levine to create maps of the heights of buildings from open data after the pioneering maps of Bill Rankin’s 2006 “Building Heights.” When Rankin remapped Manhattan by taking building height as an indirect index of land value, he saw the island as clustered in distinct islands of elevation above 600 feet:
Levine used similar data to chart the fruits of Mammon in buildings above sixty stories. Maps of skyscrapers beside the gloom of Surging Seas suggest those towers able to withstand the rising seas brought by global temperatures jumping by just two degrees Centigrade. If one moves from the map of the bulk of lowest sections of lower Manhattan–
with reference to Levine’s brilliantly colored carmine mapping of the highest buildings in the Big Apple, above forty-seven or fifty-nine stories, which one imagines might provide the best vantage points that rise above the rising waves, especially when located on the island’s shores.
There’s a mashup begging to be made, in which the tallest buildings of over fifty stories at the tip of the island peak up above the cresting waves, and the rump of buildings in lower Manhattan offer contrasting vistas of the city’s contracting shores. The buildings that create the canyons of urban life, the buildings of elevation surpassing sixty stories might suggest the true islands of Manhattan’s future, as much as the points that punctuate its skyline.
The realization of this possible apocalypse of property made present in these maps offer the ability to visit impending disasters that await our shorelines and coasts, and imagine the consuming of property long considered the most valuable on the shore–as rising seas threaten to render a whispy shoreline of the past, lying under some six meters of rising seas. The prospect of this curtailing of the ecumene, if it would bring an expansion of our nation’s estuaries, presents an image of the shrinking of the shores that suggests, with the authority of a map, just how far underwater we soon stand to be.
All actual maps, including Levine’s, provide authoritative reporting of accurate measures with a promise of minimal distortions. But visualizations such Surging Seas offer frightening windows into a future not yet arrived, using spatial modeling to predict the effects of a rise in sea-level of just five feet, and the potentially disastrous scale such a limited sea-level change would bring: the coasts are accurate, but their inundation is a conservative guess, on the lower spectrum of possibilities. For in a country in which 2.6 million homes are less than four feet above current sea-levels, the spectral outlines of chilly blue former coastlinespeak at a future world are still terrifying and seem all too possible, as much as potential cautionary tale. The concretization of likely scenarios of climate change remind us that however much we really don’t want to get there, how potentially destructive the possibility of a several degree rise in ocean temperatures would be.
As we attempt to navigate the ever-expanding seas of data in the information economy, we can overlook the extent to which data streams run underneath the world’s seas to create a quite concrete sense of the interlinked. For such cables underlie the increasing notion of geographical proximity we experience daily, from the world of big finance to mundane online transactions. Ocean floor mapping had barely begun when the first cable was laid underneath the Atlantic, connecting England to the United States by being painstakingly laid by throwing thousands of kilometers of telegraph cable overboard ships from wooden beams loaded with cable, moving from the middle of the Atlantic in two opposite directions. The efforts that lasted four years, begun in 1854, created a subaquatic bridge of metal wire, by 1858, eight years after the first cable beneath the English Channel, brought nearly riotous celebrations in New York City,–where the latin of the first functional transatlantic cable led to citywide celebrations.
Crowing that “at last the great problem is solved,” Walt Whitman heralded the achievement of the laying of the Atlantic Telegraph as a precedent that “set all doubts are forever at rest as to the practicability of spanning the world with telegraph wire–of joining Europe, Asia, Africa, America and Australia together by electric current,” at the same time as revelers invaded City Hall. The celebration of the shrinking of the world was an early mark of globalization, and the erasing of continental frontiers. The image of electricity as a fluid able to be channeled, controlled, and conveyed, all the while insulated from harm, provided a basis for joining America to the Old World, founding father Benjamin Franklin had argued a century earlier, tying Philadelphia to the capitals of European learning, beyond state governance–long before a national electric grid. While the seashore was being celebrated as a discovery of the wild in an increasingly overpaid world, the laying of cable was an achievement worthy of celebration beyond previous limits of human travel, erasing all natural obstacle and edgess, if the cable’s breaking quickly emerged as the weak links of a triumphal vision of globalization: the increased vulnerability of internet cables in recent years, whether in the North Sea or Baltic or off the coast of Africa, suggested the material fragility of transnational networks of finance, communications, and audiovisual streaming we are overeager to naturalize, forgetting that they rest on infrastructure. If we want to see ourselves as modern, and globalized, overly eager to forget or deny the fragility of global linkages.
Even if the cable broke in four years, the insulating jute fibers wrapped around the wires eaten through by a hungry worm, the steel casing of cables’ housing was reengineered against breakage in punishing conditions of the ocean floor, the protection of deepsea cables has extended as an independent offhosre infrastructure we all depend, at depths of over 20,000 feet below. The electric lines were almost in fact a country apart. Several generations earlier, the founding father of America, Benjamin Franklin, animatedly announced “Electricity is a vast country, of which we know only some bordering provinces; it is yet unreasonable to give a map of it, and pretend to assign the laws by which it is governed.” The metaphor is pretty stock, but the map he imagined might have as its basis a way of attaching pre-revolutionary Philadelphia to the wider world, as, even by the Schuylkill, “we are in a fair way of soon becoming as well acquainted with that terrible element, as with . . . the invention of the air-pump,” by advancing the new nation into new realms by drawing electricity from the thundering sky, using silk as an insulator to protect the experimenter flying the kite from the shock of electromagnetic charge drawn from the heavens on the string on which he had suspended a key.
Benjamin Franklin was quite eager to imagine the European innovation of Teutonic scientists with sparks and charges to be recreated in the colonial entrepôt, imagining that the fearsome world of a fluid “electrical fire” might be “collected” and “drawn off” as a resource of generative power, if he imagined the kite would be flown from a window indoors, harvesting electricity from the heavens as a fluid resource that might be understood by market dynamics as flowing in directions and along straight lines. Franklin seemed to imagine electricity as a new resource of fluid wealth, drawn from the heavens and generated out of the air, whose currency might be gathered to be redircted across borders of nations or state jurisdictions, as if from as yet unmapped lands.
The attempts to map the current iteration of underseas cables that carry internet signals rather than only electric charge as a new vital network of a global economy, in inevitable need of repair but also of maintenance, demanding to be mapped as it runs outside of the limits of state governance. But the map of electric cables and WiFi lines across the oceans increasingly in need of mapping as the infrastructure of underwater current seems a country apart, a region offshore and hidden in the deeps. The generative power of electricity by which Franklin was so excited seemed able to be channeled through bodies, human and animal, as a dynamic “currency,” whose oscillating flows mirrored market transactions, as if it were able to suture the global division of continents by new “bonds” that carried and put in circulation the bipolar interface as a harmonized market, anticipating underseas cables, but depended on the material ties.
The hopes of governance of a network of cables suggest almost a living structure of its own. The cables are the material substrate of our sociability and economic ties, but a have become increasingly difficult to map in necessary detail or expanse to scale. The mid-nineteenth century optimism of joining continents by underseas cable were imagined as a network that spun out from London, contracting the surface of a world that appeared the ghost of a British Empire, the delicate web of tangled underseas cables of fiber optic cable, that now are estimated to extend across the global seabed to connect most of the world’s data plans and streams at over 1.4 million km, along the ocean’s floor, buffeted by currents, mudslides, and even the lines of fishing trawlers, even as the global spinning out of submarine cables has grown astoundingly over the past thirty-five years, since the first fiber-optic cable extended on the Atlantic Ocean’s seabed floor in 1988, by ATT, France Télécom, and British Telecom, with an optimism mirroring the first underseas cable of the mid-nineteenth century.
The mapping of such cables–carrying not only telegraph signals, as in the 1800’s, and, much later, wifi along fiber-optic lines wrapped in steel, lie among the hundreds of cables that would collective run over a million miles back to back beneath the earth’s oceans. The criss-crossing of underwater canyons and deepwater divides, linking the financial transfers, ensure the continued global transit of messaging signals, and internet providers’ continued service, in a complement to the satellites which ring the planet in outer space. Although the satellites are only be able to carry a fraction of the information that the cables send between continents that hug the seabed: satellites can indeed only carry a half of a percent of the traffic that courses across underseas cables, making them a vital infrastructure on which we increasingly depend in more ways that we imagine. The hidden infrastructure of the hidden deep suggests a network that is terrifyingly fragile, and is able to be mapped in quite concrete terms as a material substrate on which globalization can be mapped if its fragility can be maintained, and the dangers of underseas breakage and disruption prevented against.
1. The global impact of the underseas cable was, to be sure, seamlessly felt to be a contraction of the global surface analogous to shipping routes of trade, as they were mapped in an 1893 global map trumpeting shipping routes and cables that contracted the world’s surface as the dawn of a new era of an earlier globalization.
The World on Mercator’s Projection, Showing Sailing Routes and Underseas Cables/1893
The smoothly curved hatched routes of lain cable that crossed from England to the Boston and Newfoundland underseas promised the realization of the globalization that Whitman had celebrated, if Thoreau turned a cold shoulder, predictably, to the “grandeur of this creates achievement of the Nineteenth Century.” Thoreau was not impressed at the cables of telegraphy, who found its benefits rested on illusion as much as advances, in his predictable skepticism, as “pretty toys which distract our attention from serious things,” presciently fearing the contents of the first messages born by underseas cables were more frivolous messages than ones of import, worrying that the haste of the construction of telegraph cables proceeded more quickly than there was information needing to communicate. But the amount of economic transactions, speculations, and data flows that are flowing under the world’s oceans outstrip the powers of reflection, or indeed comprehension.
For the American Poet, it confirmed the “practicality of communicating across the Atlantic,” on the eve of America’s Civil War, was a triumphant enterprise whose “immensity” threw cold water on doublers was cast in disturbingly radicalized terms, to be sure, as a bond that liberalized a bond by which “Saxon extends the hand of amity to Saxon,” of an “all-conquering race that is always progressing and extending its power and influence, whether in the icy Arctic and Antarctic or in the tropical heats of India” by “lighting flashes from shore to shore: Whitman sung the “chord of communication” that would “vibrate forever with the peaceful messages of commernse, the lightning-winged words of the press, and the thousand anxious queries of individual affection to the health and happiness of the absent and the loved” in the Brooklyn Daily Times, as an ethnic triumphalism that “conquered time and space . . by man’s inventive power” as a sublime achievement. And the raptures into which the transatlantic cable set the poet who so desired worldly unity in 1858 saw the miracle of allowing the world to “reason together,” “without the aid of palpable agencies” suggests a fascinating promotion of a discourse network uniting Old and New Worlds whose map was aptly chosen by Telegeography as a harbinger of a new horizon of information exchange in the twenty-first century.
And even as the landlubbers Leopold Bloom and Stephen Dedalus paused with the hoi polloi of actual sailors in a wooden cabman’s structure in Dublin, overhearing Italian and imagining the opening of new routes to London–not to say that they had ever traveled extensively–“fell to woolgathering on the enormous dimensions of the water about the globe, and ineluctably found the conversation of others turn to “talking about accidents at sea, ships lost in a fog, collisions with icebergs, all that sort of thing,” in 1904, the contraction of global transit cannot but be seen as a precedent of the smoothening of information transit today, pace James Joyce.
2. The spans of privately funded fiber optic undersea cables that have been lain across oceans floors, some stretching over 28,000 kilometers, are a literalization of global circumnavigation. They provide an image of global networking as well as offering the most massive engineering feat on earth that is hidden to human sight–and are more an emblem of globlization, in many ways, than the contraction of global space. And the rapidity with which further cable is being lain to link the world’s data flows along faster and more secure lines of communication mirrors global interconnectedness–senses of connectivity and warping past concepts of proximity, unifying the differently owned cables. Conjuring of a surprising antiquated format of charting coyly suggests the increasing interconnectivity of the Information Age, and it also channels the extreme novelty of being interlinked. The retro iconography of a chat channels the very claims of modernity that TeleGeography, a global telecom, pioneered to channel information–and done so by familiarizing viewers with a distinctly concept of space by how we are increasingly interlinked on information highways often concealed far beneath the sea. Rather than naturalize an image of high-speed connections, the clever choice to rehabilitate a slightly romanticized earlier mapping of oceanic expanse suggests the new space of online data. And it takes the notion of the electronic frontier seriously, by seeking to orient viewers to the new mental space that such sunken data lines create. If the map of the bridging of oceanic by sunken internet cables domesticizes the transcendence of distance through the increasing interconnectedness of information flows.
There is clear pleasure in the retrograde mode of mapping also reveals the actual distances that the physical substrate of the World Wide Web inhabits in so doing, and suggests that we would do well to remember the physical substrate by which the global financial economy is interlinked. To be sure, the format of the map echoes laying the first undersea cables across the Pacific, in the mid-nineteenth century in 1850, when the thrill of mapping the expanse of undersea cable was mapped for the first time enabled possibilities of direct communication networks in the Anglophone world that the poet Walt Whitman himself–he who asked readers ponder the image of a thousand acres, and the linkages among all Americans, and in older age would celebrate the inauguration of the first transcontinental railroad.
Whitman provided a vertiginous reaction that registered the excitement that the cable trigged in the United States in a rather short newspaper article of 1858 focussed on the “moral effect of the Atlantic cable” on the nation, which barely touched on its technological triumph: it is striking that Whitman, long practice in the material practices of setting type to mediate the human voice, celebrated the technology of the cables laid under the ocean by wooden boats as linking communication between England and the United States, as Anglophone nation, by a cutting edge technology of deeply spiritual significance by which he was fascinated. The piece is a sort of meditation on human geography, or the aesthetics of space that the cable changed in a profoundly deep historical–as well as submarine–manner, bridging distances of communication in new ways.
Whitman was long fascinated by the compilation of voices in type, and networks of communication that spanned nations as the railroad. In 1858, already an established poet, he celebrated the cable as as a material network for transporting semaphore, if not human voice, transcending space and binding England and America in truly inseparable ways as a sign of the fostering of global peace–attracting much popular celebration, even if he judged it would not “bring one iota of personal benefit” to the majority of American inhabitants, the electrification of “unbounded excitement” makes it seem as if the internet was introduced to all, in democratic fashion, generating a level of excitement, evoked in the map below of the Submarine Telegraph, worthy of “glorifying a grand scientific achievement” that outstripped any “merely material considerations” by its ability to “thrill every breast with admiration and triumph” in ecstatic terms: Whitman waxed poetic as he praised how “the sentiment of union that makes the popular heart beat and quiver,” more than its technological advantage, imagining that the network set a deep tie spanning the Anglophone world betwden two countries “no longer [able] to keep each other at arms-length.”
The role of technology in furthering the natural relations within or coherence of a nation–a point of fascination common to the institutional infrastructure of America Whitman also celebrated of his own poems–was almost cartographically conceived as a way of unveiling unities within the world able to bridge space, and even, at times, time, able to transport and convey messages that depended on oceanic travel.
Was the technology of the Submarine Cable an extension of the national unity Whitman already celebrated of the United States? The bond that the cable created was cast as a profound historical event, leading England and the United States to set aside any rivalries, having forged this deeper bond of both “heart and feeling”–the network was a deep-lying embodiment of shared purpose, even if it was not seen! Perhaps its very invisibility added to its power. Whitman had celebrated in the 1855 Leaves of Grass the very conceit of achieving such a “merge” through his poetic voice, a merge between peoples, races, and classes; he was open to the idea that the Cable achieved a merge between nations, allowing voices or at least semaphore to span space. Accordingly, he invested the transatlantic coupling of two nations with almost spiritual dimensions. The cable’s laying open new chapter of global history opened by triumphs of ingenuity, skill and technology was less of interest than the “exultation with which it has been greeted and the unbounded enthusiasm with which it has everywhere been received” to foster a sentiment “that makes the States throb with tumultuous emotions and thrills every breast with admiration and triumph.” The cable indeed became a form of sexual congress and intimacy between continents, for Whitman, as much as a communications network, the cable from Newfoundland a fundamentally triumph over international dissensus.
Can one imagine a better promoter of the sort of information highway that realizing poetic goals “material bond for the transmission of news of the rise and fall of stocks,” as Whitman seems to merge his role as newspaperman and poet to celebrate the mystical resonance of cable that would make the designers of the internet applaud. Whitman was amazed that the “mighty outburst of enthusiasm all over the land” that the laying of the cable provoked in the United States, greater than any in his recollection, beyond other celebrations of the nation: the apparent contradiction that “Probably to an immense majority, the Telegraph Cable will not bring one iota of personal benefit” would be outweighed by the “union of the Anglo-Saxon race, henceforth forever to be a unit.”
Whitman was almost anticipating how TeleGeography didn’t only borrow the antiquated iconography of marine charts to celebrate globalization, but found a precedent to celebrate relying high fiber optic cable across the ocean floor: a communications network has perhaps rarely been cast so openly in spiritually elevating terms by someone not its promoter. There was of course considerable physical effort, and much planning, now unseen, as well as the loss of thousands of cable underwater for several years, until warships, loaded with cable, divided the oceanic span by setting off from a point in the midst of the Atlantic in opposite directions, to create a subaquatic bridge, after having lost kilometers of metal wire, by 1858.
The first message took over sixteen hours to arrive in full from England’s Queen Victoria to U.S. President Buchanan, by undersea cable–
The shrinking of distances was a powerful breakthrough of the ability to map space in different metrics, however, than every seemed possible for transatlantic travel. And it’s hence quite apt that the antiquated techniques of mapping global relations were reprised by the folks at TeleGeography to remap the current global growth of internet cables by the syntax and aesthetics from an Age of Discovery.
The appealing charting of the hidden network of submarine cables designed by TeleGeography didn’t only borrow the antiquated iconography of marine charts from an Age of Discovery in order to promote the expanding spread of submarine fiber-optic cables in amusing ways. For the image served to suggest the shifts in spatial connectedness that such increasingly rapid data flows have allowed, and to suggest a map that, in focussing on the seas–and the overlooked areas of marine space–returned to an interesting if somewhat overlooked spatial metaphor to consider and visualize the extent to which global financial networks and information systems move in particularly flexible ways across the permeable boundaries of nations, if not the degree to which national units have ceased to be the confines that matter, as cross-border flows are increasingly the primary sorts of traffic that matter to be mapped.
4. A more familiar global remapping of phone calls,constructed on a study by students of business, Pankaj Ghemawat and Steven A. Altman, partly funded by the logistics firm DHL, an approximate quantification of globalization was made by the metrics of cross-border telephone calls in 2012 worldwide, in which the thickness corresponds to the minutes spent on the phone–and presumably the closeness of connections, if filtered through the relative costs of calls and the ability to pay them.
In a sense, the chart featured by TeleGeography openly incorporates less data, while noting the varied speeds of connections, in an image of interconnectedness, and positions itself less as a cutting edge snapshot of globalization or globalized than at the dawn of the possibilities of future interconnectedness that the laying of fiber-optic cables of greater speed can promote. If the map of telephone calls raises questions of information flows, some 41 percent originating in what the authors identified as “advanced economies” to “emerging economies,” and only a small fraction (9%) originating in an “emerging economy,” the technology may also illustrate the precise demographic that continue to adopt telephony: the authors observe that the dominant “calling patterns” reflect “interactions due to immigrants,” with most international calls being placed from the United States to Mexico and India, countries of first-generation immigrants–rather than reflecting actual information flows.
TeleGeography seems decidedly optimistic about the possibilities for global circumnavigation fibre-optic cables can promote. In place of offering a map of actual flows of data, or a revealing look at where cables lie, the adoption of an aestheticized image and iconography of the nautical chart to map the ever-expanding web of cables that connect the world advances an argument about the sorts of ties cables facilitate, in order to illustrate and promote the ever-increasing multiplicity of ways information can travel across the globe without regard for the bounds of the nation-state. Even as we bemoan NAFTA, or raise concerns about the Trans-Pacific Partnership, the networks of cables that currently span the terrestrial sphere divide into 285 separate privately owned segments show a coherent network has rapidly grown–its extent more than doubling in length over the past three years–and seems poised to only grow in coming years, to render national protectionism a thing of the past: the map leaves viewers only to imagine its benefits. While not seeking to quantify actual data flows, the scope of the map seems to be to naturalize the broad range of traffic lying such cables allows, if it is also jumps backwards over the many traditions of oceanogapahical mapping to show a seafloor that is not marked by drifting continental plates and scars of underwater earthquake activity–
NOAA
–but a smooth surface of cables that seem to be lain without ever encountering natural obstructions or topographical variations in the ocean floor.
The expansion of transcontinental submarine travel was on the cutting edge of the 1850s, and the laying of miles of lost submarine cables the Atlantic floor may have led Thome de Gamonde to realize hopes for a tunnel between England and France that parallel the previous laying of cable–
–and project the first underwater tunnel linking England and France in 1855 for rail, a project stopped for “strategic reasons” though the idea of such a chunnel–imagined by Napoleon’s mining engineer of mines as conveying horse-drawn carriages–
–was only completed until Francois Mitterand was driven by Rolls Royce (a concession?) to board the inaugural train.
The linkage between the nations was a feet of boring a hole, but bridged the very question of territoriality that the first plans of the 1855 version, presented to both Napoleon III and Queen Victoria to be forged through undersea rock, as if piercing the earth’s mantle–
–posed to territorial bounds, and the definition of sovereignty.
5. The submarine network of cable now totals upwards of 550,000 miles. Although it is never seen above ground, and lies concealed beneath the seas, it now seems to animate most international commerce. There is a pleasant irony in adopting the decorative aspects of marine charts to map a contemporary image of global circumnavigation, since they gesture to deep shifts in the seas of information, but also evoke the marvel of rendering visible what is all but unseen. The exact locations of such cables are not displayed, of course, but the stylized presence suggests a decidedly early modern form of boastfulness–“according to the best Authorities [and] with all the latest Discoveries to the PRESENT PERIOD,” the extent to which the infrastructure of the Information Age spans the seas. What once was a site of marvels revealed by the officer turned conservationist Jacques Cousteau is a field for information carriers, even if monsters inhabit its depths.
The “New Map” updates the recent rapid exponential expansion of the network fiber optic cables in recent years as a sort of corporate promotion, rehabilitating the marine chart to naturalize the submarine network that now carries a large share of global financial and administrative information worldwide. Retrospectively mapping the expansion of this exoskeleton of the anthropocene ignores the technologies on which such mapping suggest, recalling the abilities to technologically harness steam, wind, and power to recreate the romance and adventure of global circumnavigation in an updating of the 1873 romance and fast-paced adventure Jules Verne told of a race against the mechanized clock by a constellation of transit networks.
For much as Verne offered a quickly paced adventure mildly disguised celebration of technological unification of the globe, the retrograde if glorious map masking as an engraved superimposing high-fibre cables on image of the ocean as understood in days gone conceals the clear corporate interests or material technology that underpin the Information Age. And the recent expansion of a trans-continental high-tension submarine fiber network able to carry 26.2 terrabits/second of data across the undersea floor–which once took seventeen hours and forty minutes–is an awesome acceleration of time that unbinds us from all accustomed temporal constraints in a dizzying fashion. Even as Russian and other spy ships are operating in dangerously close proximity to the cables that carry an infrastructure of global communications that maintain the illusion of the open exchange of information across territorial bounds. (The safety of the antiqued map dispels any such fears of disruption of information exchange in its friendly presentation of a mysterious unknown underwater world.). And now that 99% of global internet traffic occurs thousands of feet undersea–from Netflix to now literally offshore financial transactions to email, the more black-boxing a map can perform, the better!
The appeal of the map not only is of an oceanic unknown–but an act of traversing the very national boundaries that seemed so solidly perpetuated in paper maps. The map of the oceanic unknown celebrates the laying of a material web of the world wide web as if it were another oceanographical detail, but masks the unseen nature of the cables that were lain in hidden fashion underneath the seas: indeed, rather than the slightly earlier Verne-ian classic of 1870 with which it is often paired, the map doesn’t heaven to futuristic science, but sublimated a similar story of submarine itineraries. Indeed, the map offers a picturesque recuperation of an aesthetics of global unity that serves to reframe the newly prominent submarine network that ships recently strung across the ocean floor. It conceals the labor and mechanical drudgery of doing so–both the engineering or the fragility of the fibre-optic network, and the material basis of an electromagnetic carrier lurking deep under the seas. In the Cable MapGreg Mahlknecht coded, the spans of current cables already connect hubs of communication across oceans at varied but increasing speeds, now approaching 26.2 terabits/sec across an astounding 6,6000 km from Virginia Beach to Bilbao, Spain. And while the depths of such cables is not apparent in most maps, the lodging of the cables on the ocean bedrock, 8,000 meters beneath sea-level, is argued to promise the “stability” of such an infrastructure that seem removed from the effects of human interventions from such old-fashioned add-ons to the seafloor as anchors or submarines.
And the planned additions to the network, in part enabled by warming waters, are poised to greatly expand:
The work that the map modeled after an engraving of global seas does is serious, for it integrates the growing network of fiber-optic cable at the ocean’s floor into the seascape that nautical charts showed as a light blue watery expanse. For as the price for fiber-optic cables precipitously dropped since 2000, this material infrastructure of global financial markets has not only grown, but kept up with the rapid improvement in network communication along a growing network of 250,000 km of submarine cable most folks have limited knowledge, and whose public image is in need of better PR, the more eye candy the better. The complex web of what Russ Fordyhce of Infinera has slyly called “the workhorse of the Internet” using fiber optic–a seemingly antiquated technology in an age of streaming and cellular towers, in a high-speed fiber network able to carry internet traffic that roots a virtual world. Such high-pressure sub-sea links expanded subsea capacity by an Intelligent Transport Network, expanding the network of undersea cables to meet broadband needs across the word by 100G flows.
6. The increased speed of such expanded capacity for submarine transport is akin to a living network of “intelligence transport.” But it also suggests a massive updating of our notions of transportation, by a restricted number of undersea fiber cables that seem staged to supersede cable networks in providing bandwidth. The pictorial addition of such fairly florid decorative detail from nautical charts to invest the routes of hidden submarine cables’ with an aesthetic that both caused it to be named one of the best maps of 2015 and exemplifies how to lie with maps, if the current expansion of fiber network capacities suggest that the network of just four years ago are indeed antiquated by the Infinera and other organizations promising to transport data at significantly greater and greater speeds.
The 2015 map, published online, but emulating the paper map, seems to conceal the extent of work that went into not only laying the cable, but ensuring that it was not disrupted, but blended seamlessly into the surrounding submarine landscape. FLAG–the Fiberoptic Link Around the Globe–after all offered a sort of modern updating of the boast of Jules Verne’s Phineas Fogg. For Fogg wagered £20,000 that the speed of the combination of trains and steamboats would allow him to travel around the globe so that he could return to the very same seat he occupied in the Reform Club in London in only eighty days–a boast based on his trust in the speed of modern conveyances of steam travel. For Fogg’s image of interconnectedness was realized in the copper cables that conducted telegraphy traffic.
These telegraphy cables lain under the Atlantic by the 1880s by the Eastern Telegraph Company across the Atlantic and Pacific, which by 1901 linked England to North America, India and Malay in a network of communications that offers a vision of corporate interconnection spanning the expanse of the British Empire and providing it with an efficient communications system that was its administrative and commercial underpinning.
Eastern Telegraph Company (1901), planned cables shown by dotted lines–Wikimedia
But rather than perform the feat of circumnavigation, the matrix of underwater internet cables is based on the creation of a submarine matrix to carry any message anywhere all the time–when it can be linked to an on-land cable–save, that is, in Antarctica, where the frigid waters, for now, would freeze the cable and disable it. Fogg staked his wager after noticing a map showing the construction of British rail exchanges that allowed long-distance transit across India, believing in his ability to achieve global circumnavigation on a network of carriers, based on his trust as a passenger and subject of the British Empire–and the infrastructure the enabled news, commerce, and administrative connections to travel with velocity, leading twenty-four of the thirty ships capable of laying cable-laying to be owned by British firms by 1896. The framed cartouche in the upper right of the 2015 Submarine Cable Map echoes the triumphalism of the “present day” in boasting of the achievements by which, since “the first intercontinental telephony submarine cable system TAT-1 connected North America to Europe in 1958 with an initial capacity of 640 Kbps, . . . . transatlantic cable capacity has compounded 38% per year to 27 Tbps in 2013,” as US-Latin American capacity has nearly quadrupled.
The map, revealing the material network to what most of us perceive as coursing through the air, less effectively places the course of cables in evidence than depicts their now naturalized course. The seascape of the Information Age seems, indeed, to demand the naturalizing of the courses of submarine cables, shown as so many shipping lines, running across the Atlantic and to the Caribbean, around the coast of Africa, from India to Singapore and to Hong Kong and Japan, before coursing across the Pacific. Is its quaint cartographical pastoralization of the courses of communication under the oceans, we see a reverse rendering of a materialized image of globalization, disguised by a faux nostalgia for the mapping of the as yet unknown world that will be revealed by the impending nature of an even greater increase of data flows. Indeed, the breakneck speeds of data transport are noted prominently in some of the cartouches framed at the base of the map, which suggest the two-fold subject of the map itself: both the routes of cables that were laid on the ocean floor, and the speed of data transport their different latency allowed. The cartouche is a nice rendering of the corporate promise of delivering data that TeleGeography presumably makes to its customers, despite the different ownership of many of the stretches of cable that exist, and the lack of harmony, proportionality or geometric design in how the cables are in fact lain.
That the network of submarine cable retains a curious focus on relays in England that is a telling relic of the nineteenth century.
The internet’s network still seems to start in England in Porthcurno, moving to Spain and through the Strait of Gibraltar, across the Mediterranean to Alexandria and then turn down the Gulf of Suez through the Red Sea, and around the Arabian Peninsula to Dubai, before moving across the Indian Ocean to Bombay and on to Malaysia and through the South China Sea to Hong Kong and up the coast of China, it creates an even more expansive set of exchanges and relays than Fogg faced. For while Fogg was dependent on rail to traverse the United States as well as much of Europe, where he could pass through the Suez Canal to reach a steamer engine, and then cross India by train, before getting a ship at Calcutta to Hong Kong and Yokohama, the multiplicity of connections and switches that the submarine cables create disrupt any sense of linearity and carry information at unheard of speed–fiber-optic cables carry information at a velocity that satellite transmission cannot approach or rival.
Voyage of Phineas Fogg by rail, steamship, and boat–Wikimedia
The relays of paired cables now enable the instantaneous transmission of information between continents realize a nineteenth century fantasy of an interlinked world in ways that expanded beyond contemplation, the possibility of visiting the countries that FLAG traces are actually verges on impossibility–if only since the network offers multiple pathways of simultaneous transit.
The ambitions of those earlier Telegraph cables in connecting the world far transcends Fogg’s plan to create a path by which he could move between transit hubs. His plans are dwarfed by the ambitions of modernity of the range of active and future underwater cable revealed in Greg’s Cable Map in ways that suggest the ambitions of creating an ever-more intensely interlinked world, where increasing number cables have been laid to fashion the actual physical infrastructure of the internet.
We often render the “hidden world” of privately owned transatlantic and other cables as a separate underseas world of cables lying on the seabed, able to be disrupted at its nodes, but removed from alike the shoreline and terrestrial world.
In strong distinction from such an image, the recuperation of something like nautical engraving by TeleGeography makes the clever point of naturalizing the greatest infrastructure of the Information Age–one that sometimes seems to have outweighed investment in the visible infrastructures of our cities and roads–within the currents of our seas, and as colored by the very hues by which the land is mapped as if to show the seamlessness of the communicative bridges that they create.
Given the extreme overload of data that these maps reveal–and the eeriness of a world created by the extent of cable laid–It’s in fact quite apt that the telecom firm TeleGeography showcased the interconnected nature of global communications this year by adopting the style of nineteenth-century cartographical tools. It’s probably not at all a coincidence that in this age of big data, there’s a deep romance in the symbolic reclaiming of the crisply engraved lines of nineteenth-century cartography that folks like Nathan C. Yau of FlowingData pioneered in the online publication of a Statistical Atlas of the United Sates with New Data, refiguring information of the 2010 Census and 2013 American Community Survey. Although designed in bits, the maps emulate the engraved delineations created for Francis Amasa Walker’s first Atlas: Yau announced he had done out of some disgust that budget cuts prevented the Bureau of the Census from creating the atlas displaying its data in a Census Atlas–despite its success in accumulating so much data.
A quite clever and versatile graphic designer, Yau has often publicly posted sequences of detailed non-dynamic maps that evoke the lithographic detail and crisp objectivity with which Walker created multiple legible embodiments as the Director of the US Census from 1870, when his interest in data processing led a set of new maps of the nation to be printed in Harpers Magazine, and the Census to grow to 22 volumes. So well are we trained in grasping information via elegant visual forms that Yau bemoaned the absence of a similarly set of stately maps by evoking the project Walker envisioned as a form of mapping serving the public good: and his online images embody data lying in the repository of Census data, from geological records to the distribution of human populations–and digest data to recognizable form, whose individual snapshots seem a nostalgic embodiment of data available from the American Community Survey.
FlowingData, “Map Showing the Area of Land Cover for Forests within the Territory of the Coterminous United States” (2015) from data compiled by American Community Survey (2013)
Flowing Data, “Map Showing Five Degrees of Density, the Distribution of Population” (2015) from American Community Survey (2013)
It is somewhat less expected that the format of an engraved or traditional map be showcased to reveal the system of submarine cables lying on the ocean’s floor: few would consider the invisible network with nostalgia for the medium of the paper map.
To be sure, the very subject of internet cables are more appropriately rendered in an appropriately futuristic mode that habituates us to its ambitions by expanding the colors of a public transit map to reveal an image of an interlinked world–
The decision to “go retro” breaks conspicuously with such a choice for the futuristic design, and accommodates the multiplying extent of fiber optic cables that have been laid across the world’s waters so as to network the globe. Only in 2014, TeleGeography issued a staggering map of the improvements in linkages of relays in submarine cable systems, suggesting the extent of the interlinked world to which we have become familiar not only thanks to Edward Snowden, but to our reliance on global data flows that increasingly enable financial markets worldwide, surpassing material constraints.
Such a map is overly schematic, indeed, since many of the cables’ paths are not openly disclosed. From the land, we cannot see the landing sites where such fiber-optic cables go underwater, as Trevor Paglen has recently reminded us, in a series of diptychs that contrast the cables barely concealed in NOAA maps and the otherwise placid landscapes of the beaches beneath which they run; few realize the extent to which the information that travels on them is likely to be monitored as a form of mass surveillance, which we are far more likely to associate with satellites or surveillance, but are in fact far more efficient.
But the complexity of the how information is carried along such cables is as boggling to the mind as the awesomeness of its ambitions. Perhaps recognizing the sense of overwhelming its readers with data overloads in its maps, the 2015 map of submarine cables from Telegeography updated the format of an engraved map, and put in online in a fully zoomable form, to allow one to examine its lovingly rendered detail in a map that harkens back to charts of nautical discoveries but celebrates the rapidity of delivering information in an updated version of the corporate triumphalism of the Eastern Telegraph Company. That map, which boasts in evocative language to be revised “according to the best Authorities with all the latest Discoveries,” foregrounds the multiple linkages of fiber optic cables that carry the vast majority of communications–of which “oversea” satellites link but a fraction–so efficiently they at first carried upwards of a thousandfold as much data compared to the older copper cables that lay below the sea recently–280 Mbps of data per pair–and moved 100 Gbps across the Atlantic by 2012–and the prediction 39 Tbsp is even feared to barely satisfy demand. For transatlantic cable have come to carry some 95% of international voice and data traffic, and are viewed as a fundamental–if unseen–part of our global infrastructure, potentially vulnerable to disastrous interruption or disruption.
The familiarity of the “New Map of the Submarine Cables connecting the World” is not only charming; it is a somewhat subtle naturalization of the new materiality of information flows so that they are regarded as a part of our new lived environment. To be sure, the paths of cables are highly stylized, as if they fit within the oceans’ currents, although they sacrifice accuracy even though they suggest their private ownership and considerable density.
The open-ness of this mapping of submarine cables has been rare until recently–as recently as 2009, the location of the cable that arrives in the UK at Cornwall Beach was kept secret even on military maps, although commercial fishing trawlers and other boats are provided with access to them, somewhat paradoxically but unsurprisingly, lest they run across and damage the undersea cables that relay so many vital data flows across the globe under the seas, and whose severing could potentially come at a cost of as much as $1.5 million per hour.
The actual density of such cables laid at the bottom of the sea is not displayed on the above map, of course, which conceals their precise locations or the complexity of their routes, which are tantamount to secrets of state and off most maps.
The map designed by TeleGeography is indeed a romanticized vision of the pathways that information courses around the world, undersea, in an information age; the recuperation of the iconography more familiar from a printed map of the seas than the layers of a web map or data visualization naturalize the presence of such submarine cables in an odd exercise of familiarization. We might be more suspect of the cartographical tricks of rendering, naturalizing the courses that submarine cables take when we examine the definitive maps of actual submarine cables or study the extent of such offshore cables in an interactive map and more carefully scrutinize their actual expanse. (Such maps are not actual renderings of their situation on the seabed, if the stark layers that chart these cables are decidedly less harmoniously balanced with the light shades of the mock-engraving, Submarine Cables Connecting the World.)
Decidedly fanciful if naturalistic sea monsters could denote the limits of the known world or the boundaries of secure navigation in many early modern charts, the inclusion of this most pictorial of cartographical iconographies familiar from early engraved maps are aptly appropriated to suggest the absence or gaps in the interlinked nature of space and of what passes as our sense of continuity in 2015–as well, on a not so subliminal level, to evoke the dangers of their disruption.
So naturalized is its cartographical iconography that the map suggests the new environment of internet cables in which we live. This naturalization might be nowhere more evident than in the exotic appearances of marine creatures included in its seas. A longstanding historical association exists between sea monsters with the North Sea, after monsters were first rendered as crowding its overflowing oceans in glorious detail by the bishop-geographer Olaus Magnus in his 1539 map of the land and waters around Scandinavia, who seems to have borrowed from bestiaries to illustrate the dangers that sailors would face in its waters, and to delight his readers and attest to the variety of the created world.
James Ford Bell Library, University of Minnesota
A strikingly similar sort of horned seal and spouting fish quite appropriately make an appearance in the 2015 Submarine Cable Map of TeleGeography within the North Sea and Arctic Ocean, as if to suggest the frigid waters that restrict the services such cables deliver–the spouting animals and seal lifted from Olaus Magnus’ Marine Chart frolic just beyond the regions that are currently covered by the cables’ crowded course.
Is this a hidden representation of what actual spatial limits constrain where countries are able to lie further submarine cable? Or is our dependence on underseas cable not a new affordance that we are unlikely to want to leave, demanding we fall back on the paper maps of the ocean floors as we attempt to repair, reconnect, and preserve the networks of cable on which we increasingly have come to depend? Telecommunications giants like Orange, the French communications company, have come to employ a miniature dedicated marine fleet of repair ships, on call 24-7, to address the dangers of cables broken due to mudslides, tsunami, ships setting anchor, trawling nets, or deepwater avalanches arriving with detailed nautical charts and grapnels to locate, capture, and rejoin the ends of cables in order to lift them up from the ocean floor to splice, repair, and then allow them to sink again to the ocean floor, keeping the fiber-optic network alive, for the time being, as if it were a living being, in need of rewiring and surgical repair. Several secret fleets are dedicated to repair what might well be the world’s most important infrastructure–and perhaps the infrastructure that has most enabled the phenomena of globalization–
The hundreds of thousands of miles of slender cables that lie on seabed paths along the world’s oceans floor is an apt image of globalization, aptly colored in deep sea blue by the Verge, remind us how fragile so much the oceanic expanse we neglect in our increasingly landlocked era is in the globalized world, linking Europe to Asia and erasing the divisions of continents, demanding constant attention for subsea repairs, ensuring the global network that carries bank transfers, internet communications, and an international economy can survive across borders, shepherding signals across the ocean deep we neglect at our own risk.
Almost any graphic is inadequate to represent the plight of displaced refugees. The aggregate numbers astound: the sixty countries from which 30,000 people were forced to leave their countries each day over the previous year. While these numbers reflect only those designated candidates for asylum and refugee status–and do not reflect the extent to which those fleeing from persecution and have expanded so dramatically–the image charts the number of asylum-seekers that grew to over 1.2 million in 2014. Yet the quantities of those considered for refugee status can hardly be adequately processed, let alone mapped in aggregate–or the recognition of refugee status processed on Europe’s borderlands. The map of refugee flight in red arcs across a map lacking political frontiers and boundaries seeks to foreground just how frantic the desperate search for pathways to new homes have become, and how wide-ranging these itineraries. If they seek to provide a sort of negative to the privileged paths of an age of increased air travel and suggest the desperation of forced spatial migration, they silence the actual stories of refugees.
What sort of stories does this simplified map simply omit? The stories of those journeys are interrupted by death, while they are far smaller, of course remain absent: the perilous trajectories of individuals fleeing Syria, Iraq, Africa, Indonesia, Afghanistan and Pakistan however risk not only their lives, but increasingly their legal status as they undertake huge geographic migrations in search of new homes elsewhere, traveling by boat, on foot, or along paths promised by human traffickers. The sleek image, despite its attempted accuracy, shows the intensity of itineraries as embossed on the map as if to disfigure the notion of global unity that runs against the very narrative of global unity implicit in a iconic equidistant azimuthal projection centered on the North Pole which emphasized global harmony as World War II was tried to be forgotten, which as the official flag adopted by the United Nations adopted in October, 1947 promoted an image of global unity:
Harrison Polar Map/Official UN Flag
But the problem of effectively mediating the growing plight of stateless and displaced from “hot-spots” across the world poses not only a problem of the geographic imagination, but of the ethics of mapping. For the aggregate mapping of those deserving or awarded refugee status not only presses the limits of the data visualization, bound to simplify itineraries of refugees far more fragmented and indirect than can be mapped, but that no data visualization can group the individual stories that the sheer numbers of those displaced by conflict and violence are barely possible to comprehend. Refugee traffic suggests a level of instability difficult to condense in any map: and is “traffic” not a fatally flawed metaphor, suggesting a possibility of monitoring or policing, bureaucratically inflected, blind to varied reasons for the rapid growth of refugees?
The hot-spots from which those crossing borders were readily recognized as refugees were increasingly focussed on wealthier countries since before World War II, but the growth in those granted humanitarian status as refugees had already been defined around clear epicenters back in 2007, when millions of the population in Pakistan, Syria, Palestine, and Iran were accorded status, after having crossed borders, as refugees, and large numbers of asylum seekers in the United States, Canada, and Europe had started to grow–the map, which seems an earlier version of the decentered azimuthal projection later chosen by the graphics editor and cartographer at the New York Times, similarly serves to suggest the global nature of a problem largely centered in the Middle East.
The choice of trying to map the data of those declared refugee to show the arcs of their arrival from global hot spots on a decentered azimuthal terrestrial projection aptly maps the crowding of the globally displaced in 2014. But the choice of transferring the collective itineraries to a global projection–in a sort of perverse mapping of flight paths suggests the most deeply troubling side of global inter-connectedness, and perhaps its deepest source of stress–by scarring the world’s surface in a frenetic criss-cross of arcs. UNHCR data of the global monitoring of refugees’ origins and points of arrival in new homes served to reveal an aggregate picture of resettlement in “Global Trends in Migration of Refugees” based on the accordance of refugee status, but in doing so erases the complex negotiation of the fate of asylum seekers, as well as the painfulness of the itineraries the globally displaced increasingly suffer. Is it ethical to hope to draw equivalences of the growing problem those claiming asylum as refugees by showing their arrival along idealized clean arcs?
Are we in danger, moreover, of representing refugees by the designation that western countries who grant them asylum accord them, for lack of complete or adequate data of the dynamics of displacement and mass-migration?
1. The graphic seems apt by rendering a scarred world. But it also seems an all too cool comment on the violent status quo, in which the number of displaced people raising risks by falling back on a modernist aesthetic that fails to capture the violence of displacement and indeed the placelessness of the refugees: the distinctive azimuthal projection, whose particular properties orients the world around the common locus of refugees’ eventual destinations, so as to suggest the range of their flights, rendering the range of collective arcs of geographic displacement at a uniform scale. Although the projection, which echoes the cartographical rendering of a global space in the flag of the United Nations, illustrates the actual global consequences of the heartbreaking tragedy of over fifty million refugees and internally displaced (IDP’s) across the world, their fortunes remain impossible to map, and difficult to visualize. Indeed, despite the difficulties of mapping those displaced, and problems of protracted displacement that have eroded societies, images often remain far more powerful than maps.
By mapping the aggregate destinations of the displaced by flared arcs, of uniform size, the visualization maps the eventual destinations of refugees, as determined according to the UN’s Refugee Agency, and foregrounds the question of their destination rather than the reasons for their displacement. The costs of such an omission are considerable. The question of how to represent displacement, and how to mediate the experience of the refugee, raises questions of how to visualize population within a map. The record numbers of those forced to flee their homes over the past year raise questions of whether resettlement can ever be enough–and if the tragedy incurred by displacement, without a clear destination and often just beyond the borders of the country one fled, trapped in war zones, or stranded in temporary settlements, aggregate trends of displacement seem oddly removed from refugees’ experience.
For while the smooth arcs of geographic relocation data are compelling, they transform the often desperate flight of refugees by an aesthetics of minimalism that rather reduces the scope of the spatial displacement that the terrifying numbers of persecuted refugees experience, and foregrounds the sites at which the displaced arrive–perhaps to remind us of the distance of the United States’ retention of an annual ceiling of resettling 70,000 refugees–and not the unrepresentable scope of the violence of spatial dislocation and tragedy of searing social disruptions. The deepest difficulty to represent is the precipitous slide toward poverty, hunger, and poor health care of most refugees, whose arcs of travel are both far from smooth, but so rocky and economically destabilizing that the challenges of orienting oneself to its crisis are indeed immense. And they only begin to chart the number of internally displaced and causes and scale of displacement–and the lack of political will that protracted displacement and flight have created on the ground, in their abstraction of refugee flows. For while the distribution of internal displacement challenges one to create a compelling graphic, the dynamics of displacement by the Norwegian Internal Displacement Monitoring Center across some sixty countries seem so difficult to embody–or process–that to demand clearer visualization to comprehend the scope of internal displacement of those who are rarely granted asylum–or are accorded the so desired status of refugees.
In its gesturing to the equidistant azimuthal projection of the United Nations, the visualization of refugee traffic evokes the clear ideals of the UN as an institution in its refusal to privilege a specific geographical centering.
The focus in the visualization on UNHCR data of resettlement emphasizes a narrative of resettlement, even some sixty years after UNHCR first directed global attention to the “World Refugee Year” in 1959, with hopes “to encourage additional opportunities for permanent refugee solutions through voluntary repatriation, resettlement or integration, on a purely humanitarian basis.” For in showing clean arcs that deliver the displaced, analogously to a frenetic set of flight paths, collapsing the time of one year, the tragedy of the unsettled are oddly ignored. For although the flared arcs on the projection effectively pose questions to the reader about the impact of refugees’ arrival in Europe and wealthier countries, it shifts the question provocatively from the human rights abuses and disasters which provoke such flight–and ignores the terrifyingly young age of so many refugees, over half of whom are less than eighteen.
In seeking to grasp the scope of statelessness and displacement, and the psychic as well as economic questions of displacement, can’t we do better?
2. Representing the global crisis of the displaced is by no means simple, and data visualizations are often inadequate to represent the travails of the refugee. But although the movement of the displaced mirrors what UNHCR determined were the destinations of the displaced in 2014, the minimalist projection of terrestrial expanse oddly and dissonantly removes them from the humanitarian crises that created their displacement: the countries noted in the terrestrial projection recedes into the background behind bright flared arcs that trace in aggregate the migratory paths refugees actually took in ways almost abstracted from experience–and in ways that may effectively unintentionally serve to diminish their plight by expressing it in an aggregate. While an alternating focus on Southern Sudan, Syria, Iraq, Ukraine and Burma where many have been forced to flee their homes can afflict the most clear-headed with a temporary case of Attention Deficit Disorder as they puzzle at the multiple crises that convulse refugees to flee, leaving millions of Iraqis (2+), Syrians (3.2+), and Rohyingya to remain stateless, their flight is rarely linear, and the omission of the uncertainty of any refugee’s path or flight is troubling.
If the global visualization illustrates the increased intensity of the problem of displaced refugees over the previous year, even as it tracks the scars that divide it. By using a set of specific points to another on a globe centered on where the greatest refugee traffic occurred, the data vis represents actual distances to countries of asylum, displaying pathways of asylum refugees took on a map of accurate distances, and traffic of truly global scope. Although the densely crowded red arcs obscure much of France, Germany, and other sites of destination for the displaced as if to exaggerate an influx of to Europe, they illustrate a growing recognition that the scale of human displacement is a global crisis–as much as a crisis of resettling refugees.
The array of intersecting red arcs in the map underscores the proximity of an inter-related world, and provocatively foregrounds the increasingly global scope of a multiplying crisis of displaced persons that have come to scar much of the world’s surface. The problem of how to synthesize the diverse local experiences displacing increasing refugees across the globe both internally and to other countries is resolved by using UNHCR data to map the growing traffic of the displaced that the we will increasingly be challenged to come to terms. Yet what of the image of interconnectedness that they reveal? While foregrounded in an equidistant projection that renders evident the symbolic unity of around a nexus of departure of refugees from Africa, Syria, and Ukraine who arrive in Europe, the crimson arcs literally cut across the image of coherent harmony emphasized in the azimuthal projection, by locating sites at uniform distances to emphasize its unified image of the inhabited world–the same reasons it was adopted in different form in the flag of the United Nations–which also downplays the very national differences and frontiers more often inscribed in terrestrial maps, using an equidistant azimuthal projection of the world centered on its pole to project an ideal of global harmony.
The data visualization “Global Trends of Migration” foregrounds a marred world, however. In it, the sites of refugees’ arrival is often even rendered illegible, disorientingly, by blotches of solid red created by converging flared red arcs. Was there a somewhat alarmist decision to flare the ends of these arcs at the sites of the “arrival” of refugees, as has been suggested elsewhere by Martin Grand Jean? For Grand Jean observes that in doing so, the concentration of apparent endings attract greater visual attention than the sites from which persons are displaced, or the intensity of the displacement: we hide our eyes from the atrocities, in short, and the true nature of the crisis and humanitarian disaster, perhaps in ways informed by UNHCR data on the need to better process refugee flow. One might go farther in this critique: for in flaring such endpoints, the image not only oddly downplays the sites of emergency from which they seek asylum, and the unmitigated tragedy of those who remain displaced, but conveys a sense that the flights are smooth.
To be sure, the very term “traffic” that recurs to describe the “Trends in Global Migration of Refugees” seems a bit of an oblique misnomer. It almost obfuscates the experience of those who were only recently forced to flee their homes, as much as render them for the viewer. For the elegant aggregation of such a uniquely tragic dataset may not fully come to terms with the growing global tragedy of the apparently unmitigated spread of refugees from an expanding range of sites–and the steep human rights challenges the exponential expansion of global or internal exiles creates. Although the attempt to synthesize UNHCR data and map those flows offer one of the clearest tools by which to process, comprehend and synthesize the rapid expansion of individuals who were forcibly displaced over the past year, and come to term with that expansion. But it hardly comes to terms with the desperation of their travails or the difficulty of their departures. Indeed, by covering much of Europe in busy red blotches it disarmingly foregrounds and describes the arrival of refugees who have successfully left their countries–more than the mechanics of their displacement. And there is a sense, almost paranoiac, and to be resisted, that the arrival of these streams of refugees who enter the Eurozone almost threaten to cancel its identity.
What is lost in the image’s busily crowded surface is perhaps made up for by the frenetic intensity it uses to ask us to confront such trajectories of tragedy and desperation. But as an illustration, the elegance of the visualization seems to mislead viewers through its concentration on a geometry of arrival–and the smoothness with which it invests the desperation of forced departures. Despite its impressive effects, there seem multiple reservations about the possibility of creating an adequate data visualization. In translating the tragic dataset of forced migrations as a point-to-point correspondence, its simplification approximates the wide geographic itineraries of that the globally displaced have been forced to seek–and understates the tortuously complex paths they actually followed.
Indeed, tensions are implicit in the stark modernist aesthetics of rendering the paths of refugees and the global imperative to address the pressing refugee problems that raise questions of the ethics of mapping the displaced. The cool modernist aesthetics of “Trends in Global Migration” obscure the messiness of refugees’ own lives. In recent years, the Refugee Highway and others have sought to address in foregrounding the global “hotspots” of mass-migration–by combining qualitative and quantitative data. They have tried to reveal what open routes exist for those seeking asylum and capturing the resourcefulness of the refugee–noting possible destinations of asylum, and sites of resettlement, or differentiating between routes taken in fleeing by land and sea to help viewers appreciate the scope of the refugee disaster. In the image below, Refugee Highway reveals the presence of airplanes over industrialized nations where more refugees are apt to settle or seek asylum suggests the steep symbolic liabilities of Wallace’s stark “Global Trends.”
The Refugee Highway
Another alternative visualization, proposed by Grand Jean on the basis of the very same UNHCR 2014 database, places less visual emphasis on the sites of refugees’ arrival, or sites of eventual asylum, but use similar lines as the red arcs of migration, apt for suggesting bloody scars but less illuminating of the proportions of displaced and, as Grand Jean nicely notes, not weighted in any way, so that the 6,000 Mexican refugees that arrive in Canada are illustrated in an equivalent manner to the million refugees from Syrian territory that have arrived in Lebanon. Gran Jean has generously proposed an alternative visualization that salutary in varying the thickness of lines that denote refugees’ displacement from sites of humanitarian crisis that confronts the limits of doing justice to the representation of displacement, sacrificing the modernist aesthetics of the image to ensure its greater readability:
Martin Grand Jean
The attention Grand Jean returns to the sites of displacement can be easily rendered in ways that distinguish the different regions and countries from which the 14.37 refugees UNHCR registered have sought asylum, using color to start to distinguish the sites from which refugees were displaced–and start to diminish the information overload of the data visualization of this global crisis.
Martin Grand Jean
There is value to imitating the information overload created by the expanding crisis of global refugees, but it raises questions of the ethics of mapping disasters. Much as it is difficult to comparatively map the multiplications of centers of forcible displacement, it is difficult to even heuristically approximate the varied qualitative circumstances of the world of the refugee–as much as one would like to grasp the extent of the desperation of exile from the boundaries and neighborhoods of one’s former home.
2. The elegant economy of the jaw-dropping visualization in the Times of the refugee crisis compellingly transposes the aggregation of annual refugees to illustrate its deeply global nature. The crisis of those forcibly displaced on a symbolic level by the harmony of uniform spatial relations–in the mode of early modern cordiform maps–although, of course, those thin red lines of scarification disrupt whatever harmony exists across the globe, despite the attention that it calls to its inter-relations, in the manner of the polar azimuthal projection surrounded by two olive branches of peace that was designed as an emblem of the United Nations to suggest the proportional representation of the continents, and lack of privileging one area of the world by Donal McLaughlin, who interest in the transparency of visual communication led him to propose its design in 1946 as a seal for the UNO.
The popularity of the visualization of “Global Trends” lies in its success in cleanly sorting a significantly large dataset in a readily legible terms in ways that insist on the proximity of accumulated crises dispersed across the globe in isolation from one another–but which affect the world and demand a global response.
\
One unarticulated if implicit institutional message of the equidistant polar projection in the “Global Trends” graphic is that it captures the pressure that the displaced place on the ideals expressed by the equidistant polar azimuthal projection featured on the UN flag.
Even if the very globalization of a refugee crisis makes it hard to focus on the status of those forcibly displaced or the context of collective hot-spots from which folks have fled, so clearly does it abstract individual itineraries of flight from their local contexts, the intensity of its busy red lines captures the overwhelming image of desperation, even if limited to those who have found asylum–not the refugee camps clustering on the borders of Syria, Sudan and Myanmar–it captures the intensity of forced migrations worldwide, if not the circumstances of their internal displacements or their deaths in transit and at sea. The poor and often perilous conditions of the camps and settlements are left off of the map, as it were, as are the circumstances of ocean travel often brokered by human traffickers.
For the greatest lie and fabrication in the narrative of Global Trends of Displacement is the illusion it perpetuates that all refugees possess and have a destination–and indeed that all refugees arrive. The extreme unmessiness of rendering the actual tragedy of refugees’ itineraries in purified form with a coolness worthy of Le Corbusier or Eero Salonen frames the crisis of refugees as if tracking airplanes’ movement or allocating resources. To an extent, this is the result of the UNHCR dataset, which focuses on the arrival in camps or countries of asylum, rather than displacement or the camps were refugees and fleeing persons congregate along the borders of nearby countries. But the visualization deriving from the data provides readers with a quite misleading illustration of the crisis at hand. For in concealing local details, they obscure both the individual stories of sacrifice as well as the conditions or scarcities that has driven such a steep expansion of fleeing across what have often increasingly become quite shaky and undefined border-lines, readily renegotiated in theaters of war.
UNHCR, Refugees from Southern Sudan by mid-December, 2013
Rather, the image created communicates an impression of cleanly engineered arcs of geographical mobility and direct paths to resettlement. Unlike earlier visualizations, the elegant red arcing lines adopted in “Global Trends” present the UNHCR data as if to suggest that all refugees arrive–even though the dataset is of course only about those who do seek asylum and resettle elsewhere, and predominantly in countries far removed from their homelands. This narrative of spatial displacement may obscure a deeper set of narratives of dislocation.
One sacrifices a sense of the local in the arching red lines in the gripping aggregation of global refugees over the past year in “Global Trends,” also pictured the header to this post. The data vis indeed broached the difficulties of comprehending what has increasingly and ultimately become a global crisis at the end of an age of empire in readily comprehensible terms. Although the paths of refugees’ flights threatens to muddy the specific travails from which folks are forced to flee in the data visualization, as well as their specific circumstances and travails, it synthesizes and processes the almost unsustainable streams of forced flights from refugee hot spots by foregrounding the actual routes of displacement–while misleadingly suggesting that all refugees found future homes.
Indeed, it maps the unmappable by mapping the pathways of those forcibly displaced: yet of the 60 million displaced globally, the map focusses on the 14 million (almost a quarter of those displaced worldwide) who have left their countries in 2014 alone, offering what is probably an under-estimation of the encyclopedia of travails that can never, at another level, map or synthesize–as if the routes of fleeing can ever be adequately represented by being sketched on the perfectly engineered arcs akin to the smoothly engineered pathways of multiple airplane flights along which a very different demographic travels. Refugees are of course unlikely to experience such travel, more characteristic of readers of the Times, who would surely be prone to recognize the map as a sad perversion of global flight paths, converging on Eruopean capitals, the United States, Canada, and Australia.
One feels only awe at the overwhelming nature this sort of dataset, itself difficult and dizzying to process because it offers little real cue for orienting oneself to the complex totality of narratives it collectively encodes. Whether the augmentation of refugees worldwide can be seen as a quantifiable crisis–and removed from human terms and individual costs–is a question that cannot be here addressed. But the conversion of the crisis into human flows is a compelling way to try to come to terms with how we’ve come to inhabit the world in rather chilling ways, by plotting some of the data from the United Nations High Commissioner on Refugees on a global projection centered on the primary areas of regional crisis–not without posing the question of why such a global focus of the refugee crisis exists. The nexus of the refugee “crisis” is so widely spatially distributed, indeed, to leave its “focus” dizzying as one tries to better internally process the extent of displacement worldwide:
3. The frenetic business of the long distance “traffic” pictured on the global map can also be reorganized and viewed, or disaggregated, piecemeal, luckily, in order to make some sense of the terrifying abundance–or obesity?–of the disturbing dataset whose aggregation reveals the close relations between countries in an age of globalization, if it cannot threaten to obscure the dramatic narratives of individual experience. The data is condensed into misleadingly orderly (if dizzyingly distracting) mesh of intersecting red lines, arcing over the earth’s surface and boundaries–as if to capture the global nature of the crisis, but which painfully erase the multiple individual narratives of struggle, internal displacement, and blossoming of the unplanned cities of refugee camps, and the different material and environmental constraints against which refugees have to contend and struggle. The comforting illusion that each refugee has a destination–or endpoint–ignore the improvised settlements now dot maps of Jordan, Turkey, Chad and South Sudan, and hold some two million souls, or the deaths of refugees in transit or at sea–runs against the demand for an adequate dynamic map of their own, as if in a sort of reverse map of sites of human habitation inscribed on maps.
Such a map would describe dislocation in greater detail than the valiant ESRI “story map” of those refugee camps administered by the UNHCR, whose slippy map invites one to inspect the numbers of displaced in different camps, but stands at a significant remove from their actual circumstances or experiences of displacement of the story it purports to tell.
4. Could one rather include in such a map variables such as the length of time required for transit from each country, the amount of time required for transit, or the possibility of making such travel–all potential ways to represent the ordeal of displacement in ways that viewers might understand? Or could one indicate the violence of the displacement in a quantitative way?
Indeed, the focus of the data vis on the routes of migration that refugees take runs against the widely accepted and reported truth that the number of internally displaced persons has expanded far beyond the growth of refugees seeking asylum in recent years–also reported by Sergio Peçanha–if the growth of IDP’s worldwide has surely increased the desperation of those refugees who leave countries of origin.
The greatest single lie that this elegant map of refugees across the world tells in its distribution of a dataset is that all refugees have a destination to which the flee that can be mapped–a lie that the red arcs that imitate the paths of air traffic encourage. For the paths of those fleeing are of course rarely so removed from the ground or so truly globalized in their dispersion. In addition, there is a shift of attention from the sites where a truly unmanageable set of crises for refugees exists to the density of points of arrival in European countries as France, Germany, England, Italy, and Sweden, as well as Australia, Canada and the US–all rendered by but a single point or nexus of arrival, or destination–and often obscured by clotted red lines. Does this detract the readers’ attention from the sites of humanitarian emergency that prompted the rush of refugees? The crowded the image evokes the image of something like a blood splatter, the result of the expansion of the intensity of combat in multiple theaters that, after all, set the mechanisms of displacement in motion, which the practice of aggregation erased. In ways that imitate the The Refugee Project’s attempt to map arcs of resettlement of those seeking asylum since 1975 in interactive fashion within a single globe, the density of lines that converge in Europe and elsewhere suggest the deeply linked question of the global multiplication of forcibly removed refugees, and the proliferation of a forcible statelessness across so much of the modern world.
But, on the other hand, the visualization’s immediate popularity, registered by wide retweeting, responds to the cognitive difficulty–if not impossibility–of coming to terms in a clear-headed manner with the dizzying multiplication of growing numbers of refugees and internally displaced people in our increasingly destabilized world. There is considerable clarity in how the orderly arcs mirror the readily recognizable form of a map of destinations of flights, if there is something truly odd in how they represent the terrifyingly troubled transit of peoples in times of war. Perhaps the map aptly captures in symbolic fashion the desperate flight from regions in its numbers alone, acting like a sort of blood splatter map on the world–although one where the wounds seem to lie in those countries that receive refugees, rather than the sites of the violence that provoked their transit.
For the greatest difficulty with the data visualization remains the remove of its narrative content from the subjective experiences of the refugees than the absorption of refugees in their new countries, and the apparent equivalence that it draws between both the proportion of refugees or the experiences of refugees from different countries. Hence, the conspicuous inclusion of numbers of departed whose final destinations were a specific country and the foregrounding of the names of those countries that were most likely destinations in the developed world–the United States, Canada, France, and Sweden among them–several countries were a sharply xenophobic ultra-right has been recently recognized as on the rise. Take, for instance, the dispersion or draining of Syrian populations, which despite its orderly symmetry offers only a stripping of data to approximate the ongoing struggles on its disintegrating borders. During the recent Civil War, some 11.6 million people, almost half of its entire population, have been displaced, half arriving in Egypt, and only a relatively fortunate few arriving in European or industrialized/westernized nations. Representing the length of time required for resettlement would at least be a surrogate and index for the nature of the experience of refugees that would be a possibly more ethical model for mapping displacement than the dispersion of the Syrian population on simple arcs–without notation of how many displaced Syrians remain, and omit the distortion suggested below of a smoothly engineered migration from refugee camps.
New York Times
5. The infographic maps but one corner of the dilemma of global refugees. One way that the infographic must be read is in dialogue of the as-yet limited reactions of advanced economies to the growing global refugee crisis, to be sure, at a time when it may make less sense to retain the attitudes of protectionism and fears of immigration, evident in the expansion of only 70,000 refugees to the United States during Fiscal Year (FY) 2015 on the basis of “humanitarian concerns” as “in the national interest,” and the retention of limits of admissions in accordance with clear ceilings for each region. For does such an imposition of such ceilings come to terms with the global desperation felt by the displaced?
There is an obligation to come to terms with the steep fears of immigration and better help readers better wrestle with the plight of the displaced.
An untold understory of the infographic that is less evident in the image used in this post’s header is the considerable concentration of a huge proportion of refugees–some 85% by the count of the United Nations High Commissioner for Refugees–in one specific geographic region, and the lack of resources that are effectively able to be devoted to these refugees’ fates. (And this may well be an underestimation of population flows among the internally displaced.) The majority congregate in regions running from Turkey to Southeast Asia, past Ethiopia to Kenya and the Central African Republic, although one imagines that the displaced in Ukraine are just absent from the dataset, and less able to be accurately measured by the UN numbers. The region populated by millions of displaced is circled by dotted lines below. In each of these regions, most relatively impoverished, refugees are often exchanged among countries with limited resources to process compelling human needs–for example, Ethiopia holds 665,000 refugees from Somalia and South Sudan–where they are bound to press further upon limited existing resources and fragile economies.
What will be the result of these interconnections–and whether they won’t demand far greater global interconnectedness–is not clear.
But the ongoing expansion of refugees in areas where there is no clear governmental or administrative organization will prove especially difficult to map adequately, despite the compelling nature of the “Recent Trends” visualization, such trends are poised to expand in future years, especially from Ukraine as well as Syria and Myanmar.
It seems most likely that, at some level, the data visualization of the destinations of refugees as seeking asylum from their country of origin unconsciously records how far we have come from the optimism of picturing the possibility of global unity the United Nations auspiciously hoped to inaugurate in 1946–by the agency which compiled the UNHCR database.
6. There is a significant difficulty, of course, in mapping refugees and the increased clustering of camps that they create in so-called demilitarized border zones. For each image condenses multiple narratives that one wishes one could tease out, but confronts an image in which one sees limited apparent possibility of resolution save further instability. South Sudan possessed some of the greatest emergency of the refugees of modern times and the twenty-first century both in the some 700,000+ asylum-seeking refugees in neighboring countries at most recent count and one and a half million plus internally displaced persons (IDP’s) within its fragile boundaries, many driven by intense food shortages as well as by an increasingly militarized and fearful situation: almost a third of the country’s population lack food. Emergency refugee activities have haven mapped in South Sudan from 2012. Even as the subsequent refugee crisis generated in the Syrian Civil War has further pressed credulity, South Sudan exemplifies a refugee situation spun out of control with no clear resolution, before which one stares at the map agape,–almost conscious of the continuing inadequacy of ever resolving its narrative in the immediate future. Back in 2012, UNHCR helpfully mapped refugee settlements (camps) and clusters of individual refugees–denoted in the second map of South Sudan below by inverted triangles; refugee settlements are shown by pink houses–spread both to camps in Ethiopia, and less organized communities on the borders of poor (and undeveloped) countries like the Democratic Republic of Congo or Central African Republic, states with their resources already spread thin.
UNHCR By 2013, the number of displaced was combined with arrivals of those displaced from nearby areas and states:
By 2014, about three-quarters of a million displaced persons were displaced and 4.9 million were in need of assistance as the borders continued to be particularly permeable and fear drove displaced persons out of the country:
The continued displacement of refugees has only grown considerably during 2015, with increased fighting in South Sudan and the Upper Nile states, at the same time as water and sanitation has continued to deteriorate across the region. Spurring the possibility for increased refugees, food insecurity of food has grown–as food grows more scarce–in ways that the visualization leaves silent but might provide a telling under-map of the flow of refugees across increasingly fragile borders, in situation maps that foreground departure and the failure of containment within civil society. Such maps obscure the systemic problems that are bound to make the tally of refugee counts only tic higher over time, perhaps, which might be revealed in deeper layers to suggest the levels of instability that afflict the region. One telling map to compare reveals the increasingly imperiled aquifers and drastically declining availability groundwater.
If we consider the drought to be located in California’s central Valley–a thin orange strip by the Pacific Ocean–the decrease in groundwater NASA satellites have mapped over the past decade quite dramatically extends across the Sudd Basin and Lower Chad Basin in Africa and the entire Nubian Aquifer System and the Congo Basin–as it groundwater shortages has drastically grown across the Arabian aquifer and Indus Basin over the same time. Water is not the sole issue here, of course, but the unrest that scarcity provokes demands mapping, and GIS visualization, as a layer below the civil society, which in much of Africa and regions without and which never saw the need for infrastructures of water transport is no doubt particularly acute.
The consequences of depleted aquifers and groundwater across the Lake Chad Basin, Sudd Basin and the Nubian Aquifer System (NAS)–the greatest body of fresh water in the Nile basin, and Congo Basin have provoked a catastrophe of global proportions, while we returned to the possibilities of the contagious spread of Ebola across the world as if it were the sole apocalypse on our mental radar for much of the past year. The rise of fatal–or near-fatal–the expansion of those attempting to flee food shortages and declining economies in Africa have appeared in or occasioned increasing news reports from the western media, as Italians have called in increasingly strident tones for all of Europe to turn its attention to focus on the flight of refugees in the Mediterranean ocean–which the Italian navy can barely respond to in adequate manner, and create a web across the Mediterranean simplified in the red routes below. Already the most “deadly stretch of water for refugees and migrants” in 2012, the refugee crisis intensified in 2014–often encouraged by human traffickers who deceptively promise perilous passage that is often not followed through, perhaps making this current year–2015–the most deadly in recent memory for those attempting the crossing in ships as they flee humanitarian disasters in Libya in ways that have only begun to be quantified and mapped.
The Guardian
National Geographic
The complex story of tragedy and loss that the map conceals is difficult to communicate in conventional cartographical forms, as the each circle represents the suspected or confirmed loss of human passengers.
One understory to this migration, without doubt, is the huge refugee crisis across the Sub-Saharan continent, where 15 million have been displaced in the past year alone:
The “refuge flows” are oddly almost not with a human face, as if they seem a triangular exchange of goods. As we map refugee traffic in a manner that suggests that the flows of people are removed from a dynamics of struggle on the ground, but guided by an invisible hand or able to be imagined as a coherent network of flow, as if they at times arrive and depart from the same place, we lose a sense of the human costs of the deep scars that they draw over the surface of the inhabited world.
But these overlapping and crisscrossed waves of displacement, if terribly difficult to disentangle, are compressed into so many misleadingly orderly arcs: their stark form and geometric curvature elided or erasef the struggle, or indeed desperation, that we know companies the experiences of all refugees, and show an image of migration that may be as good as it gets. It surely sends an alarm about the status and state of the stateless refugees forced to flee their homes that forces us to negotiate our own relation to the changed face of the world. But its curved red lines decisively and assertively arrogate the numbers of those who have sought asylum into smoothly completed arcs in an oddly unproblematic way, given the scarcity of solutions at hand.
The mosaic of ethnicities in the United States today appears so inclusive and diverse that echoes of the state’s sanctioning of the forcible spatial segregation of one ethnic group –Japanese Americans–would seem impossibly remote in time and culture until quite recently. But the tragic and yet state-sponsored episode of Japanese internment by the US military reveals the existence of historical rifts in the historical landscape of the American West, which not only resonate with a history of exclusionary practices, but suggest a striking geography along which practices of exclusion were effected and organized by means of existing maps. And the recent invocation of executive order 9066 by Donald Trump, seventy-four years later, when over 110,000 Americans of Japanese descent were forcibly removed from their own houses and relocated to camps of internment as a precedent for the relocation of resident aliens–which Trump has called a “tough thing,” but refused to condemn in any way–“I would have had to be there at the time to tell you, to give you a proper answer”–not only to cave to his instincts of fueling prejudice if not racial violence among Americans, but to celebrate a precedent for treating illegal immigrants as alien enemies with no understanding of history or the law. As the grossly illegal and shameful episode of internment was cited as a basis for racial profiling during the state of exception of War on Terror by Michelle Malkin, the horrific readiness to accept the episode of internment of those with Japanese ancestry as a part of the American legal tradition is not only an instance of unlearning but an act of amnesia that is utterly irresponsible.
And yet, the continued reference of the non-state spaces of American internment in much of the current American West suggests the survival of the landscape that internment produced. The partitioning of space in maps enabled the exclusionary strategies, moreover, which have a striking overlay with earlier landscapes of exclusion. Despite a stated mission to keep the country “safe” in the face of the shock of war, detainment of Japanese Americans was not at all something of a historical unicum, but rather fit within landscape of ethnic opposition with possible roots in the nineteenth century, whose secret geography informed the use of sites of sequestering those stripped of citizenship at the start of the twenty-first century. The space of Native American reserves, or reservations, had been mapped by F. E. Leupp of the Bureau of Indian Affairs in 1905 as if it were a hidden nation within a nation–land set off from the four-color map of the United States, if largely concentrated in the lands west of the hundredth meridian–
–an image of spatial separateness that continued by 1941.
The memory of the experience of internment was far more suddenly and deeply inscribed in the national landscape at a single moment, however, if one not without historical precedents. T
he permission Executive Order 9066 gave the Secretary of War to “prescribe military areas . . . from which any or all persons may be excluded” from 1942 that enabled an internal “enemy” population to be stripped of citizenship. The establishment of an archipelago of confinement across Arizona, inland California, and Nevada echoed the confinement of native populations–and resonates with recent attempts to define areas of detainment as “off the map” and consequently removed from legal oversight in ways that we might be all too apt to associate with the Cold War–as much as it was improvised. The geography of the confinement of Japanese Americans provides an instance of something not like race warfare, but the opposition of the state to its enemies perhaps as telling as the geography of ghostly munitions of the Cold War from missile silos, remains of nuclear testing, facilities for storing and developing plutonium, and anti-missile radar that dot the landscapes of Arizona, Nevada, New Mexico, and South Dakota.
In mapping the inclusiveness of national diversity, we are increasingly reminded of the ethnic classification of the nation’s population by the carving out of predictions of the behavior of the electorate at the polls–partly because the distribution is so relatively easy to map, partly because how such divisions map onto political parties is a growing riddle, not only since it is less clear that their increasing political voice maps onto a single agenda, but also because of the scare of predictions of white-minority status by 2045. For the apparent cultural remove of the arrogance of an administration that formally instituted the forced geographic relocation of Japanese Americans to camps away from the west coast seems an odd artifact stoked by the proto-fascist flames ignited by the fear of war.
Might it rather be comprehended as a part of California history? If the episode of Japanese American relocation seems removed from the state’s current mosaic of diversity, it has eery ties to the hidden history of the West–and the political landscape of recent years. Although when trains transported individuals to hidden locations inland,their forced displacement for the general safety of “all” was promoted as coalescing home front–based on their predesignation as “enemies of the state” in ways that have recurred in recent years. It pays to return to them to excavate the map of displacement that defined the west coast, and situate its occurrence within a landscape of longue durée.
The interned painter Chiura Obata was a devoted student of the western landscape of the United States, particularly in Yosemite Park, and created an image that inescapably suggests the portents of a shifting political landscape while interned in Topaz, in his quite contemplative painting of the deeply and heavily smeared reddened sky over the stark landscape of the Relocation Camp where he was interned, after having taught art at the University of California, at a War Relocation Camp that opened its doors in September 11, 1942.
Chiura Obata, “Sunset, Water-Tower, Topaz, March 20 1943” painted in the Topaz Relocation Camp
The smears of rust-colored cirrus clouds that Obata drew as reflected on Utah’s barren desert landscape at the Topaz War Relocation Center overwhelms the barbed wire fences barely discernible beneath telephone wires, lending the landscape a monumentality that dwarfs a makeshift guard tower, and creates red lines like scars across the land. Rather than treat the landscape relocation and internment camps as a panicked response to fears of impending military attack, the rapidity of relocation along fault lines in a political landscape that we may have too readily repressed, when the landscape has been forcibly divided along ethnic or cultural lines in terms of belonging–a division that seems to have been rehabilitated in recent years.
1. The recent mapping of the notion of “diversity” based on data culled into one of the appealing visualizations displayed on the website of Trulia–the realtor which seems primarily in the business of making us feel good about the prospective places where we might live, if we really and truly had our druthers–expanded the maps of demographic density designed by Randal Olson in more interactively searchable ways that offer an opportune starting point for this post. The dynamic visualization is based on self-reported Census data promised to capture the current “racial/ethnic” composition of regions across the country where smallest difference existed between a dominant ethnic subset and secondary ethnic group, ranking the relative levels of “diversity” by that metric across the country’s largest metropolitan areas–from Oakland to San Francisco to New York to Houston to San Jose–so that we might better envision the ethnic compositions of the neighborhoods where we live in an era where ethnic diversity seems the closest metric we’ll ever get to what’s cosmopolitan. It is, however, a map of strong ethnic integration that contrasts with the clearcut demarcation of otherness in the map of several generations past that is the header to this post..
The data visualization is impressive despite its clear limitations–especially evident in the broad equivalences that it draws implicitly between the uniformity of “diversity” as a transparent derivative of data of variety. Building on data encoded in Dustin Cable’s “Racial Dot Map,” Trulia provides a metric for “diversity” that ignores exact ethnicities, providing a new way of reading a single argument in the 2012 data of ethnic differences that Cable encoded by five different colors–which can be read as a follow-up map of the image of ethnic segregation in the map with which the musing of this post began.
The Trulia map of America’s Racial Kaleidoscope nonetheless offers an interesting and somewhat jarring image for all of its superficiality, even with apparent bearing on the sociology of the red state/blue state divide. For all the very slipperiness of “ethnic/racial” categories as meaningful demographic tools of parsing populations–when were these two terms ever equivalent seen as surrogates for one another, and how do the categories of the 2010 Census, which use such undifferentiated envelopes as “Asian” or “Black” or “Hispanic, Latino, or Spanish origin” as authoritative diverse to parse populations?–to image diversity, there may be some meaning able to be extracted in the visualizations that show their difference and distance from a historical past, when ethnic differences seemed far more starkly inscribed in a pre-globalized world.
For the folks at Trulia created a visualization to map “diversity” that erases whatever degrees of actual racial or ethnic integration exist within counties. While this may hardly offer a metric of actual “diversity,” the visualization reveals California as the largest continuous body of “diverse” ethnic groups in the country and of its sharpest non-“majority white” areas:
Even without introducing the potentially complexifying newly trending category of the “transracial,” or those individuals who, to use another term diffused in online media thanks to Rachel Dolezal, realized or felt that they were “miscarried”–a term that has touched a clear nerve, given the unclear meaning “race” retains in contemporary America, and the uncomfortable nature of the term. Where Trulia finds diversity to be concentrated in coastal regions and objectively present in a range of areas that seems to correlate with sites where the home-buying market is tight, the visualization seems most useful to force us to ask what diversity means–as well as to mask the sort of rhetoric of ethnic opposition that so often scarred the landscape of the west.
2. “Diversity” is a new world, but may once have led to the one of the clearest instances in US history of the forced marginalization of a population of citizens during the early years of American engagement in World War II. Despite the frustrating failure of imposing categories to classify the composition of our national population at the start of the twenty-first century, the cultural remove at which Japanese ethnicity became a basis for the forced migration of citizens must be balanced with the proximity of the recent circumscription of individual rights. If panic and fear unjustifiably provoked the systematically organized deportation of Americans of Japanese ancestry–in which a strong dose of economic resentment may have played a large role–the act of remapping civil rights in the United States, if seriously compromised, also sanctioned the remapping of rights in ways that both built on and provided some rather scary precedents.
Did the confinement of a considerable section of the population–and indeed the confinement of a somewhat arbitrarily reclassified class of citizens–created something of a crucial precedent to redefine the rights of citizens by unilateral executive fiat? The decision to reclassify a segment of the American population recalls the legal justification for a “state of emergency” which the “crown jurist of the Third Reich” Carl Schmitt notoriously advanced as an adequate rationale to suspend rights in the hopes to re-establish order, responsibility for which, Schmitt argued, ultimately lay with the sovereign alone, but whose actions created shared bonds preceded the very notion of the state–and rested in a political nature of the opposition between friend and enemy. In a cold-hearted logic ways recently revived in George W. Bush’s administration, such an occurrence “extreme emergency” could justify the suspension of the constitution and law, with striking similarity to the political state of emergency by which internment was justified and understood–and was associated with a state of war, both by Schmitt and in the War on Terror of the early twenty-first century. Nowhere is this more evident than in the remapping of California during the Japanese Evacuation Program, where Japanese Americans were segregated from all “exclusion areas” in the name of a political imperative that transcended political practice.
The institutional order that was created between zones of confinement and zones of exclusion in the “Evacuation Map” created “in satisfaction of the impelling military necessity created by total war with Japan” defined some 108 individual “exclusion areas,” in each of which approximately 1,000 persons were evacuated–allegedly totaling the 100,000 persons evacuated during the two weeks between March 24 and June 6. Many were concentrated in the Pacific Northwest. But the repartitioning of the West in terms of Military Area 1 and Military Area 2–a sort of Newspeak of Orwellian resonance–was premised on the presiding rationality of political belonging against the otherness of Japanese Americans that is so foundational in Schmitt’s thought. The exceptionality of “wartime” provided the basis for suspending their right, and insisting on the primacy of the political for redividing national space, and suspending legal or constitutional precedent by a political mandate that, for Schmitt, would indeed historically and existentially precede any legal or constitutional order.
What sort of networks would have allowed the forced migration of a large section of the Japanese American population to internment camps? The imposition of such a nation-wide policy of legislated relocation remains conceptually remote, both as a practice and conceptual possibility, let alone as one accepted by the region’s residents. Its logic lies in the legend to the map, which echoes a truly Schmittian rhetoric of a “state of emergency” in which constitutional rights are suspended; the necessity of “the political” reveals the deep opposition based on “otherness” whose rationality is revealed in its legend. This state of “otherness” was clearly inscribed in the landscape of the two areas of Military Areas, rather than states and superimposed upon states, is linked to “wartime,” but which echoes of the earlier political orders of the American West: its legend offers the underlying logic of the state of emergency during which local division was inscribed.
The partitioning of the same region that seems particularly noted for its diversity–the western region of California–as in the framing of an “Exclusion Zone” that was deemed so sensitive in its concentration of state secrets to be off-limits to members identified with Japanese immigrants that they could be stripped of constitutional rights–and forced to board trains from the cities to anodynely-named “Relocation Centers” that were located in the state’s interior–suggests a civilian partitioning of the country not only in the name of war-time exigency, but in fact a paranoia that was fueled not by actual military dangers or actual risks of espionage, in retrospect, but something that was more fed by a combination of opportunism and on-the-ground animosity and ethnic dislike. If the notion of such dislike might have lain in economic competition, the ethnic opposition was reified in the boundaries of otherness exposed on the map.
The network of relocation camps are often seen as a unicum–and as something like a quite particular circumstantial combination of jealousy for a group of successful immigrants who had often lived in distinct settlements, and whose difference was now cast into political relief, both by the war, and the culture of imperial allegiance that Japanese were seen as increasingly ready to adopt. But the very network of the camps of resettlement recapitulated narratives of the European occupation of Native America by completely effacing an imaginary frontier between Native Lands and European-American pioneers, placed in evidence by the confining of native peoples in discrete sites that were later known as “reservations,” the bounded areas of the absence of any existence of a Native/American divide across the very western states from which Japanese Americans were banned–and indeed denied narratives of racial or ethnic differentiation, where the destruction of the frontier was replaced by the contained presence of the Native populations in reservations, at the same time as many other reservations were reclaimed as military sites for engineers or the army, in the demand for a wartime effort, even as Native American languages were adopted, as they had been in World War One, to encode military communications and Native Americans participated in huge numbers in the US Army.
The rapid constitution of new networks to displace Japanese Americans from their former homes to the periphery of what became defined as Military Area One in the United States was enabled by the infrastructure of railroads that linked cities to removed “War Relocation Centers” in areas where their inhabitants would not be easily noticed or indeed seen. The forcible relocation of Japanese Americans was largely enacted and by non-military authorities, but led to the removal of the large number of immigrants to the country to remote areas, cordoned off from sight, in the four months from March, 1942, by which time some ten centers of “war[-time] relocation” were established that removed Japanese Americans from the coast region that they had increasingly migrated in the past thirty years, to areas where they were less likely to be noticed, and the stripping of their civil rights–and allegedly inalienable liberties–were not even seen.
The deep suspicion of ethnic difference created a proclivity to separate Japanese American citizens as a military threat. Yet as early as 1930, the Office of Naval Intelligence began surveillance on Japanese communities in Hawaii, wary of the military power of Japan. And from 1936, the same Office in fact compiled lists of those Japanese to be “the first to be placed in a concentration camp in the event of trouble” between the countries–long before the idea of confinement camps were broached as a possibility on American soil.
That list would become the Custodial Detention Index, compiled in 1939-41 with help from the Federal Bureau of Investigation as a tabulation one of explicitly “Alien Enemy Control” as enumerating those ostensibly “engaged in subversive activities” or actions deemed “detrimental to the internal security of the United States.” The list was drawn up a decade after further Japanese immigration to the United States had been banned in 1924, and significantly before Executive Order 9066, issued on February 19, 1942, allowed regional military commanders to designate “military areas” from which “any or all persons may be excluded.” The establishment by the civilian-run War Relocation Agency of what were very euphemistically termed “relocation centers,” together with the six internment camps run by the US Department of Justice, were officially built to house all Japanese-Americans who had been removed from the “exclusion zone” that stretched across the entire western coast of the United States, after March, 1942.
Although the scope of detention was not widely known, or discussed in contemporary maps, a relatively recent map of the Assembly Centers and Internment camps emphasized their existence and geographic distribution in areas that were removed from population centers, lending greater prominence to their considerable geographical remove from areas Japanese Americans had settled and the inhospitable places to which these forced relocations in internment camps occurred–in the desert, in relatively abandoned villages of the High Sierra, in areas often excluded from common maps.
Ben Pease
The reparative remapping of such sites as Poston and Gila River to our common memory offers a wonderful way to start to come to terms with the network of civilian-administered internment camps that place into relief a less well-documented or perhaps fully apprehended scale of the effective apparatus of state surveillance and that was in place of over 125,000 Japanese Americans into the desert-liike interior of the country for ostensible reasons of suspicions of a Fifth Column in the country of fully US naturalized citizens, who were stripped of all civil liberties.
The stark existence of such an “Exclusion Zone” or ten euphemistically named ‘relocation centers’ to which Japanese-Americans were without distinction detained from 1942 were inhumanely mapped in purely logistical terms to evacuate the western coast of ethnic Japanese with amazingly well-coordinated efficiency over six months with the sort of reflexive unreflectiveness so often characteristic during the unfolding of events occurring during a war: but the sites were also intentionally created as sites absent from federal law–or international conventions–and in a sense existed as black spots on the national map.
Such practices of forced relocation to sites far removed from cities near the shoreline–and ostensibly near sensitive military sites–depended on a very systematic division and re-assignment of Japanese Americans suddenly dispossessed of their ownership of houses, land, and real estate, which was imagined in a quite cartographical manner–as the movement of Japanese Americans from coastal cities and communities on trains removed them to remote places, as if to expunge their memories, and in locating Japanese Americans in remote areas allowed to be forgotten and go unseen. The subsequent destruction of any buildings, gardens, or evidence of confinement after the war, when the spaces of confinement were promptly shuttered after January 2, 1945–again by executive order–erased any evidence of the space that were bulldozed and razed, effacing memories of the internment, no doubt more problematic after the discovery of Nazi Concentration Camps. Despite the total lack of support for accusations of security threats, suspicion seems to have reigned. If the construction of Internment Camps were officially mandated to be situated in places deemed “climates suitable for people,” from the newly created Military Area #1–western Washington and Oregon; western California; Southern Nevada–to the Mississippi, in ways that created a new geography of the United States during wartime, ostensibly for reasons of state. Yet living in quasi-military improvised unheated barracks ringed by barbed wire that enclosed the thirty to forty blocks of barracks separated by empty spaces, patrolled by soldiers from watchtowers, lacking any privacy or cooking equipment or kitchens, and without any medicine or medical institutions, with only improvised medical care and with nothing but cots in collective rooms, such containment centers were undeniably more than austere–they were dehumanizing by intent. And while not dedicated to a project of ethnic cleansing, they were motivated by a sense of deep suspicion based on ethnicity alone, and reflect a similar fantasia of spatial containment and confinement that was enabled by a new attitude to space that the wartime maps of the Civil Control Administration reveal. The landscape coded in pale pastels masks and obscures the violence of collectively reclassifying Japanese-Americans as if “internal enemies”–and as threats to the national state–within national political discourse in truly Schmittian terms.
Within the intentionally dispersive extended archipelago of camps, removed from centers of habitation, inmates were largely supervised or overseen by the Wartime Civil Control Administration–a civilian unit–because of falsified reports of a proclivity to espionage. Such reports were diffused largely through the military and future Department of Defense (then Department of War) and were also fostered by intense lobbying efforts of white or Anglo farmers (who saw the Japanese American farmers as a threat) encouraged the perpetuation of a race-based paranoia. Even though J. Edgar Hoover at the FBI doubted that any real threat was posed by Japanese Americans, the decision to confine seems to have been preemptively made to quiet a home front: President Roosevelt’s issuance of Executive Order 9066 led to over 112,000 Japanese Americans to be moved to effective prison camps located in nine states–California, Arizona, Utah, Wyoming, Colorado, Texas, Arkansas, and the porto-state of Alaska. Although two-thirds had already gained citizenship, they were asked to submit to loyalty oaths and swear not to interfere with the ongoing war effort that had consumed the country. And were excluded from much of the country. The internment sites were removed in the interior–and located in “Military Area 2”–whose definition somewhat bizzarely, and, quite Orwellianly, departed from the boundary lines of individual states.
They created a new logic of displacement and of the suspension of individual rights. 3. We associate the transport of prisoners as human chattel destined for ethnic cleansing on trains with Hitler’s Final Solution, perhaps the paradigmatic instance of the forced migration of populations becoming a national project and mission. But the national network of trains similarly provided the basis for the relatively fast geographic removal of US citizens of Japanese descent across the state from Exclusion Areas, effecting the legal reclassification of citizenship in was that oddly reflected the claims of spatial purification that the abstract order of maps almost inspires. The spectrum of pastel colors of the map issued by the Western Defense Command of the Exclusion Areas where men, women, and children of Japanese ancestry were forbidden to set foot conceals its violent measures.
The process of internal evacuation conducted “in satisfaction of the impelling military necessity created by total war with Japan” created an “evacuee population” in the United States whose movement was to be controlled and supervised by military forces, ostensibly to remove them from areas where there was any military presence that might be observed. When immigrants from Japan had been banned from becoming naturalized citizens of the United States–from either owning any property of their own or the ability to vote–Japanese Americans formed independent communities of their own in the western United States, often with separate schools. The forced transport of Japanese Americans to sites where they were stripped of citizenship and pursuant rights created something of a new standard for the imposition of classification on naturalized citizens for unstated reasons of possible danger to “state secrets”–although the actual likelihood of any attempted infiltration or espionage on existing military installations was not particularly credible. Forced transportation from communities in San Francisco, Los Angeles, and Seattle created an archipelago of the confined not only in California–and prevented from entering “exclusion zones” that came to include almost one-third of the country, eliminating the presence of Japanese Americans in anywhere save the less densely populated lands of the interior. While ostensibly directed against possible espionage of those sensitive military areas “from which any or all persons may be [rightfully[ excluded,” the expansion of exclusion zones to constitute a large share of the country became something of a pretense to redirect populations to areas where they were not seen. Not only was a third of the Territory of Hawai’i Japanese–between 140,00 and 150,000–in ways that make it ethnically complex, almost 127,000 Japanese Americans were listed in the 1940 Census as living in the country, mostly in California, Oregon and Washington, of which 40,869 resident aliens, born in Japan.
The rapidly expanding rate at which camps opened across the country over five months testify to the paranoia and unjustified fears that fed the relatively quick establishment of similar internment camps where local rights were suspended or stripped, and the role of the rail in moving a sizable sector of the population nationwide:
This quite carefully planned and strikingly extensive network to move populations from Assembly Centers to Relocation Centers–all since anodynely named–allowed the significant expansion of the areas of exclusion from which Japanese were not allowed to set foot. They were codified quite rapidly in the months after the December 1941 attack on Pearl Harbor led to all of “Japanese ancestry” to be reclassified as potential security threats, despite little evidence of their disloyalty, as attempts to argue against imprisonment that fell on deaf ears: six weeks after Pearl Harbor was attacked, after some ethnic Japanese living in Hawaii helped a downed airman, leading to a questioning of their ability to not be imperial subjects and “unassailable” as such, set the basis for a new geography of confinement and exclusion of Japanese from public areas that Earl Warren spearheaded, creating the basis to prevent ethnic Japanese from entering exclusion zones” of almost a third of the country–and encouraging by May 1942 all Japanese to be moved to network of assembly centers and readied for transport to permanent relocation centers across the country.
The declarative bluntness of the administrative languages in the authoritative public notices placed in the street corners of cities such as San Francisco that trumpeted the specter of foreign racial “ancestry” of Japanese Americans–
or the expanse of almost a third of the country from which Japanese Americans had been displaced–
cannot speak to the surprised faces of the deported who arrived by train in Arcadia, California, fresh from San Pedro, and the machinery that brought them there, and the helmeted soldiers who are staring down those recently stripped of citizenship, who don’t seem to have fully fathomed the reasons for their fate, or what perhaps the suspension of all legal rights would mean.
The role of the trains in moving populations in California would have paralleled the travels that the young Steve Reich made with his governess across the country from Los Angeles to New York in 1939 and 1940, and the “music documentary” he composed that retrospectively juxtapose those trips with the contemporaneous forced transport of European Jewry for ethnic cleansing. Reich’s travels occurred almost immediately before Japanese-Americans were moved en masse from Los Angeles to Relocation Centers as Poston or Gila River. Rendered in the propulsive straining tempo of violins that alternately suggest accelerating pistons and air raid sirens, and accompanied by parallel intonations of porters calling railway stops and voices of survivors, Reich’s braiding of memories intentionally evoked parallel lived geographic relocations as fantasia of forced displacement that mechanized electric rail travel allowed.
4. Was there a precedent for such forced movement under military oversight, in the confinement of native Americans in much of the American West to “reservations”, in a manner that Adolf Hitler himself has been noted to have particularly admired for the effective reorganization of the population of the West? (Hitler was a large fan of Karl May as well as Fenimore Cooper; Navajo reservations provided not only an architectural model for early concentration camps, according to John Toland, which he took as a promise of the extermination of those unable to be “civilized,” in a bizarre bit of cross-cultural reading.) The precedent of the forced 1864 “Long March” of over 300 miles–some fifty of which in fact occurred between designed to create forced migrations of American Indians from more potentially valuable mineralogical resources to reservations of contracting size.
For between 1864-6 of up to eighteen days attempted an ethnic cleansing of Navajo, from the ancestral homelands of hunters and gatherers located in current northeastern Arizona and northwestern New Mexico to the Bosque Redondo internment camp on the Pecos River nearby Fort Sumner–an internment camp that was itself an attempt at ethnic cleansing, where some 3,500 Navajo men, women, and children died and that stood as an inspiration of the possibilities of ethnic cleansing to the Nazi party, as did the camp for Boer prisoners in South Africa, and perhaps a model for the first plans to deport Jews to the area of Lubin to die of disease. (The image of the confined Native American was potent: Karl May remained among Hitler’s preferred authors, and Hitler continued to read May’s stories of the grizzled white cowboy Old Shatterhand as Führer and personally recommended to his officers, David Meier notes, during the Russian campaign–perhaps providing a model for the forced marches of prisoners of war to death camps.)
The forced migration of a hunting and gathering migratory tribe to an arid 40-square-mile reservation with contaminated water, to face failing crops, disease and raids from neighbouring tribes is a not-so-hidden part of the landscape of the “wild” west that must have been present in the minds of those who administered the transportation of Japanese Americans to sequestered sites of minimal economic or strategic value.
While such equivalences in atrocity can hardly be drawn, and should not be encouraged, it remains striking on a conceptual and genealogical level that so many of the camps of internment for Japanese Americans were geographically located not only on state land, but at times on the very reservations on which Native Americans were actually confined–and restricted–in ways that provided a powerful precedent for such practices of territorial confinement and surveillance.
The Poston Relocation Center, for example, built on the Colorado River Indian Tribes Reservation in Arizona, working to provide the Reservation with electricity; the Leupp Isolation Center on the Navajo Reservation in Arizona, northwest of Winslow; the Gila River Camp, approved in March 18, 1942, for 10,00, over pointed objections of the Gila River Indian Tribe; Tule Lake in an area that was the ancestral home of the Modoc, surviving members of whom were exiled to Oklahoma in 1873; Manzanar, located in the Owens Valley, in an area whose farmlands were worked by Shoshone and Paiutes for some time. In these circumscribed and well-defined areas, the Constitution was deemed not to apply. Despite no clear reaction between the Relocation Authorities and future Bureau of Indian Affairs, the director of the War Relocation Authority, Dillon S. Meyer, from 1950 to 1953 worked as the Commissioner of the Bureau of Indian Affairs.
5. Few of these sites of isolation were known to the public, moreover, or showcased in the media, with the exception the “show-camp” of Gila River, Arizona. But the existence of a “hidden geography” necessitated the show-camp among the numerous centers of sequestration Japanese-Americans might have faced. Lying quite literally “off the map,”and not appearing on maps of the west save in those redacted by the government, the internment camps provide more than a solely symbolic predecessors of what Trevor Paglen has so accurately characterized as the “blank spots on the map Trevor Paglen described, run by the National Security Administration, in the wake of the newfound popularity of the juridical writings of Carl Schmitt.
For the that became centers for the rendition of foreign nationals deemed security threats, like dry lakebed of Groom Lake, the area of the testing of the U2 missiles and other military aircraft in Area 51, run by the Air Force, or the National Data Center, sites run by the government but which lie outside the legal administration of the state, perversely, and in which the suspension of constitutional rights that Schmitt had claimed was argued to similarly apply.
The suspension of constitutional rights for the American-Japanese who were sequestered has an analogously long set of precedents of its own: the forced displacement of Native Americans had been an established government policy and project for over sixty years in the nineteenth century, based on denying precedence to claims of residence in lands they had traditionally occupied.
The result created some unique patterns and combinations of interior settlement. The Japanese Americans in one region came to outnumber the Mohave and Chemahuevi in the area of the desert where they had confined: the Office of Indian Affairs, indeed, ran many camps together with the War Relocation Authority, based on the hope was to use Japanese labor to construct larger spaces of confinement for Native tribes–either using the confined to confine tribes already stripped of land, or using the dispossessed to create spaces of confinement for the nation-state that had stripped them of their own property–by the canalization of the desert or the construction of newly electrified living quarters. Native Americans as the Cherokee had earlier been confined to “internment camps” before these were termed “reservations–internment camps whose plans may have served as models for the confinement of Jews in what became Death Camps–in World War II, the US also displaced Aleut people from the Pribilof Islands to internment camps located in Southeast Alaska.
Do such sites of isolation provide an alternate genealogy for the foundation of rendition sites–“blank spots on the map“–that the NSA much more recently operated at a similar remove from the coasts, public memory, or legal oversight? Do they provide one genealogy of the “black areas” of the law that allow the invocation of state secrets by the government and especially by the Air Force and CIA, but also the Department of Justice of Alberto Gonzalez, where the torturous logic of Schmitt’s emphasis on the state’s right to name its enemies regained respect, partly through the validity that the conservative icon Leo Strauss had given his “political theology” as one way for a strong state to unite men against “evil”: it is tempting to see what role Schmitt had in providing a precedent to invoke state secrets privilege to shore up the “black worlds” of the NSA, where extraordinary rendition of foreigners like Khaled El-Masri or the Canadian Maher Arar occur, and Groom Lake stays black–and effectively off the map–removing the construction of Air Force bases in Area 51 from criminal persecution, and effectively sanction violations of both federal law and the international Convention Against Torture in some locations. Indeed, the establishment of Relocation Camps mirror and echo the temporal creation of military sites in Southern Nevada that sprung up in the 1950s, nearby Area 51, which has been imagined both as a site of alien abductions and an alleged site for the US military to dedicated efforts to converting alien aircraft, have long remained hidden, and most probably not only to conceal contact with extra-terrestrial life for reasons of state. The recently expanding government centers tied to extradition offer an an odd gloss on the myths of alien crafts’ conversion to the US military. In a perverse fantasy of military omnipotence and natural providence, where for some the US Government is believed by many to have inherited the manifest destiny of the nation into the otherworldly relations to alien life. Just past Death Valley National Park, the Nevada Test Site and Yucca Mountain almost constitute the areas that the nation has removed from most maps–
–even if the secretive area around Region 51 and Groom Lake, just above the Nellis Air Force Range near Las Vegas, became best-known as sites of an secretive space of rendition and imagined extraterritoriality.
Is the ideal mapping of these areas as removed from oversight, and not subject to prosecution, not only a relic of the Cold War, but a region rich with precedence as offering a theater of opposing the enemy, to maintain enmity, in Schmitt’s curious words, and to maintain such enmities to cultivate the primacy of action, and sustain a not-so-hidden sort of political theology? If nothing else, it is an odd through-the-looking-glass sort of authenticity that seems located in these areas hidden from oversight. The imagined extraterritoriality which the government entertains is after all a sort of fictive escape from recognizing rights agreed to be accorded individuals, by the escapist alternative of removing them from the actual map: it is as if, by leaving the map blank where they lie, the conventional rights accorded to all who inhabit the actual world are somehow exempted by their placement off of the recognized map, and outside the nominally universal rights that are accorded citizens by US law and by international legal conventions. The map, in this sense, seems to have more power for removing people from international treaties and standards that the law could otherwise allow.
Is this a landscape of paranoia, whose contours were poisonously sculpted by a nuclear arms race of the Cold War–or a map of a secret history of sequestration, whereby an expanding nation state subtracted places from judicial review and removed them from public scrutiny?
The long-fears impending destruction of Palmyra, not “just another town on the map,” says the NBC Nightly News, but a site for “erasing history” has been identified as an epicenter of the feared project of cultural genocide of opulent archeological remains–as well as of actual human deaths. After the Islamic State published photographs of the destruction of the World Heritage Site, the recent damage assessment of the city recovered by Syrian forces suggests the preservation of some 80% of ruins, and despite the reduction of several 2,000 year old temples to rubble, after Syrian Army jets helped retake the ancient city. Yet the episode suggested the horror of the loss of ancient fragments that ISIS seems to have decided, with good judgement, to preserve, including its Roman amphitheater, despite the apparent destruction of its elegant Triumphal Arch.
The concentration of destruction of sites that were deemed to be of cultic value–as the Temple of Baalshamin or semitic Temple of Baal, or statues of Athena–seen as heretical, while benefitting from media attention to the survival of ruins to treat them as hostages. But the city offered a stage for conductive provocative assaults,
Maher Al Mounes/Agence France-Presse/Getty Images, March 27, 2016
Many objects were, of course, sold on the black market to raise needed funds.
The longstanding difficulties of securing artifacts from smugglers from ceramics to bronze lamps to mosaics illustrating Homer’s Odyssey to medieval illuminations of the Quran, to the destruction of actual minarets, souks, and entire sites of archeological excavation. David Brook’s claim that ISIS has created a wormhole of history that has transported us to a “different moral epoch” as much as a different political landscape, utterly removed from the moral codes he has recently celebrated, affords a prime spot to the destruction of archeological treasures. As much as introduce a “wormhole”–a space-time passageway, theorized by Einstein and Rosen as a theoretical “bridge” that jumped huge distances that connect distances of billions of light years, the topography of Palmyra’s ruins offer something of a historical echo chamber as the fears of the disturbance of its awesome ruins were relayed across the world wide web, as well as an act of unpardonable criminal destruction.
The fears of losing such cultural monuments may reflect deep uncertainties in the possibilities of devoting military forces to protect physical objects from looting and destruction–and to continue to guard them in the face of military–but also reflect the scorched earth policy that the Assad regime has adopted in relation to its own lands. And months after Syrian forces assured the world of the security of Palmyra’s ruins and of the city’s surrounding hills in mid-May 2015, the late-August announcement that explosives have demolished the Baalshamin Temple, a site to worship the Phoenician god of fertilizing rains which once stood some five hundred meters from the city’s amphitheater, has realized deep fears of cultural destruction and become emblematic of the extreme fragility of one’s relation to a historical past. The site, long emblematic of a material presence of the ancient world in the wilds of the Syrian sands, became a theater for the destruction of antiquities, and even of the beheading of an eighty-two year old scholar of antiquities, Khaled al-Assad, whose executed body was strung up and suspended as an object-lesson. The report that the Islamic State purposefully planted explosives in the city’s monumental ruins–“western” ruins in addition to the Assyrian monuments in Nimrud–and the recent images of explosives at the Temple of Baalshamin–offers grounds for the realization of fears to the pledge of an unidentified militant that “whenever we seize a piece of land, we will remove signs of idolatry and spread monotheism.”
Although the capture of the city may have been more closely tied in the mental geography of ISIL figures to Tadmur prison‘s destruction, a site of arbitrary and inhumane detention from the 1970s–“High walls of cold cement/ Control towers/ Mine fields/ Check points/ Barricades and special military forces/Finally… A space of pure patriotic fear,” wrote the poet Faraj Bayrakdar, who had been imprisoned there for some six years, “If the whole of Syria falls/ This prison will never ever fall.” But the French-buiilt prison, fashioned as a panopticon in true Benthamite style, was the in the 1930s in the desert, site of a massive slaughter of members of the Muslim Brotherhood by Hafaz al-Assad’s henchmen and of sanctioned beatings and whippings, whose interiors were first broadcast by the ISIL as they recaptured the site and before they had destroyed it, were almost emblematic of the crimes against humanity of the current regime’s predecessor.
The attention to this site of fear and horror were quickly shifted, however, to the fears of the destruction of the city’s ancient amphitheater, which quickly became an arena of institutionalized violence for ISIL occupiers.
Such growing fears of expectations of destroying a Unesco World Heritage Site that would surely lead to a swift world-wide condemnation–as well as an offense against Syrian culture–were stoked by worldwide media, and must have partly led ISIS to release multimedia images that affirmed the preservation of cultural heritage that lies on the site of the Syrian-Iraq border to calm such accusations. Even as the Director of Antiquities in Damascus has asserted that many treasures have been preemptively removed from the city, a counter-offensive by ISIS was adroitly waged on the world-wide web, as they posted images of intact ruins in the Syrian city–even as the humanitarian crisis in the area grew with air-strikes from the forces of Syrian strongman Bashar al-Assad.
But the very images themselves conceal a bit of a debate about what a cultural heritage actually is: as much as ISIS commander Abu Laith al-Saoudi somewhat convincingly assured Syrian audiences that his forces could commit to no violence against a cultural patrimony. “Concerning the historical city, we will preserve it and it will not be damaged,” al-Saoudi clarified that his targets were idols, rather than architecture, as if to lend the veneer of a theological disputatio to their actions: “what we will do is to pulverize statues that the miscreants used to pray for,” he clarified, but “as for the historical monuments, we will not touch them with our bulldozers as some tend to believe.”
Whether the Palmyran monuments would be considered part of Syria’s cultural patrimony or antique architecture is not clear, although the manner that the winged Assyrian bulls or horses constituted part of an Iraqi cultural patrimony–much as the ruins of Palmyra for Syrian–may be very tragically overlooked.
In asking what constitutes a historical monument and what a religious icon, al-Saoudi raises a cultural quagmire and a debate on iconoclasm all too familiar from the sixteenth-century Reformation if itself also inherited from the ancient world–even as he seeks to invest the destruction of a classical heritage with an aura of doctrinal debate.
But the possible preservation of many statues, if indeed taken to safekeeping before the invasion, has not led to any hesitation of using the backdrop of its second-century ancient Roman amphitheater to round up and execute at least twenty supporters of the Syrian state, according to the Syrian Observatory of Human Rights, and kill two hundred more. What constitute the Palmyrene divinities–reliefs on funerary monuments? lions and eagles with open widespread wings? images on tombs?–is open to interpretation and will probably not be that closely overseen. The monuments that have remained less vulnerable to air bombardment, weather damage, acid rains, suggest a vulnerability to the widespread but only recently recognized looting of antiquities that have slowly resurfaced on the black market, providing a source of income that has recently rivaled Syrian oil fields as a needed source of cash as other sources are drying up for ISIS–if we trust the record of financial transactions recently found on one of the flash drives of an ISIS commander, which detailed the sales of some $36 million of stolen ancient artifacts that were sold on the black market.
The recent specter of the destruction of tombs outside the city of Palmyra by explosives offered a taste, however, of the destruction that might be waiting to be unleashed.
Joseph Eid/AFP/Getty Images
Is it really true that, as the New York Times reports, the cultural vandalism of tombs and statutes–a destruction whose propagandistic value Amr Al-Azm of Shawnee State University compares to the choreographed beheadings of captives as designed to appeal to some ISIL supporters–occurred as a cautionary warning to nearby Syrian troops? or a sign of their withdrawal from a region, and the acceleration of demolition in the face of military defeats? The value of the Palmyran antiquities to ISIL, whose sales of antiquities from an Abyssinian monastery in Syria’s Nabek district totalled $36 million, must reveal canny knowledge of the calculus of their value as intact objects. So many antiquities now stand guarded by Syria’s government that a list of Emergency Red List of Syrian Cultural Objects at Riskhas been distributed to border guards, as many looters in ISIS have become amateur archeologists, and, until ISIS troops took the city, a guard was stationed at the amphitheater itself, as if to declare its worth to the state.
The release of some ten photos by the Islamic State showing the preservation of architectural ruins contrast to the familiar photos posted online in February of the destruction of antiquities in Mosul, but seems to be an attempt to repristine their image, despite the brutality of the executions, as Syria’s official news agency, SANA, released file photos of the city’s antiquities that were threatened with destruction, no doubt in an attempt to gain world attention as well as stoke nationalist sentiment as well as horror. The place of antiquities is a delicate one within the propaganda forces that have mobilized behind the war, with ISIS using the destruction of antiquities as a bit of a rallying cry to supplement Jihad, long after it had actually destroyed substantial numbers of churches.
But if the value perceived in the destruction of antiquities may have been feared to make Palmyra something of a poster-child, the videos that successfully cast the ISIS trips as philistines for folks like Boris Johnson, the former mayor of London who confessed to be moved to future mobilization by the hopes to defend Assyrian Gods who sport “those curious ringleted beards in the shape of typewriters” and profiled horses, as if they were ready to suddenly sign up for fighting on the frront lines to defend the heritage, or at least give thanks for the oft-criticized custodial role London’s British Museum–which seems to have been Johnson’s real (and openly knee-jerk nationalist) point.
Telegraph
Although Barack Obama and the United States has not openly entered the conflict, the ongoing promises of continued military, economic, and diplomatic assistance has been poised behind the notion of joint Sunni-Shi’ite counteroffensives yet to materialize, but seemed to place us on the brink of war. But Palmyra stands at more than the symbolic epicenter of the war, or as a strategic gain of the extent of “territory” that ISIS (or ISIL) can be said to “hold” as a cohort of alliances: it is a benchwater of how rapidly the Islamic State has spread, and the rapidity with which the Syrian Free Army, without any credible external assistance, has been able to hold agains the two-fronted assault it faces from government and foreign troops, and its effective marginalization to the West.
The expansion of the congeries of ISIS/ISIL-held lands have effectively isolated a front in the northeast from the western fronts against which limited resistance remains, and Assad’s forces have proved to be little effective military resistance.
In a sense, the ruins of Palmyra are enshrined as sources of material contact with the past in the landscape in the engravings from Robert Wood’s Ruins of Palmyra, otherwise Tadmor, in the Desart [sic] (London, 1753), based on the surveys taken by the architect and artist Giovanni Battista Borra, informed by Borra’s own close study of Vignola, which are again echoed in the visual composition of many of the images of the local ruins now feared to be facing destruction or destroyed in the global media. Borra’s expertise in such neoclassical views had been honed, interestingly, in his own set of views of Turin, Vedute principali di Torino disegnate in prospettiva, as well as his views of Rome and Tivoli, which his dramatic elevated views of awesome intact colonnade and surrounding ruins echoed.
But Borra’s Palmyran views of Wood’s archeological sites gained an international appeal that provided immediately accessible memories of the elegance of the city’s ancient past and a repertory for neoclassicism. And rather than a prison, their grandeur suggest the odd emptiness of Ozymandian ruins of past grandeur that his own architectural expertise allowed him to recognize.
Special Collections, University of Washington Libraries
Borra’s majestic engravings are romantic, if oddly analytic in their silent statuesque melancholy. They also evoke the tragic prospect of the loss of such sites, whether due to ISIS militia or possible future aerial bombardment of the region from Assad’s Syrian air force if not American troops. While standing at quite considerable chronological remove, their silent beauty serves to underscore an enormous potential tragedy of looting a desert landscape of ancient architecture.
Jonathan Klein/AFP/Getty Images
All too often, however, we are apt to focus on the awe of monuments that have so long occupied the Western imagination–with a legacy this post has rather cursorily tried to map–rather than the humanitarian injustices of the continued displacement of human refugees in the ongoing Civil War, according to images released by Human Rights Watch this April, for which there seems no clear end in sight–especially along the so-called “demilitarized” border between Syria and Jordan.
We read more maps than ever before, and rely on maps to process and embody information that seems increasingly intangible by nature. But we define coherence in maps all too readily, without the skepticism that might be offered by an ethics of reading maps that we all to readily consult and devour. Paradoxically, the map, which long established a centering means to understand geographical information, has become regarded uncritically. As we rely on maps to organize our changing relation to space, do we need to be more conscious of how they preset information? While it is meant to be entertaining, this blog examines the construction of map as an argument, and proposition, to explore what the ethics of mapping might be. It's a labor of love; any support readers can offer is appreciated!

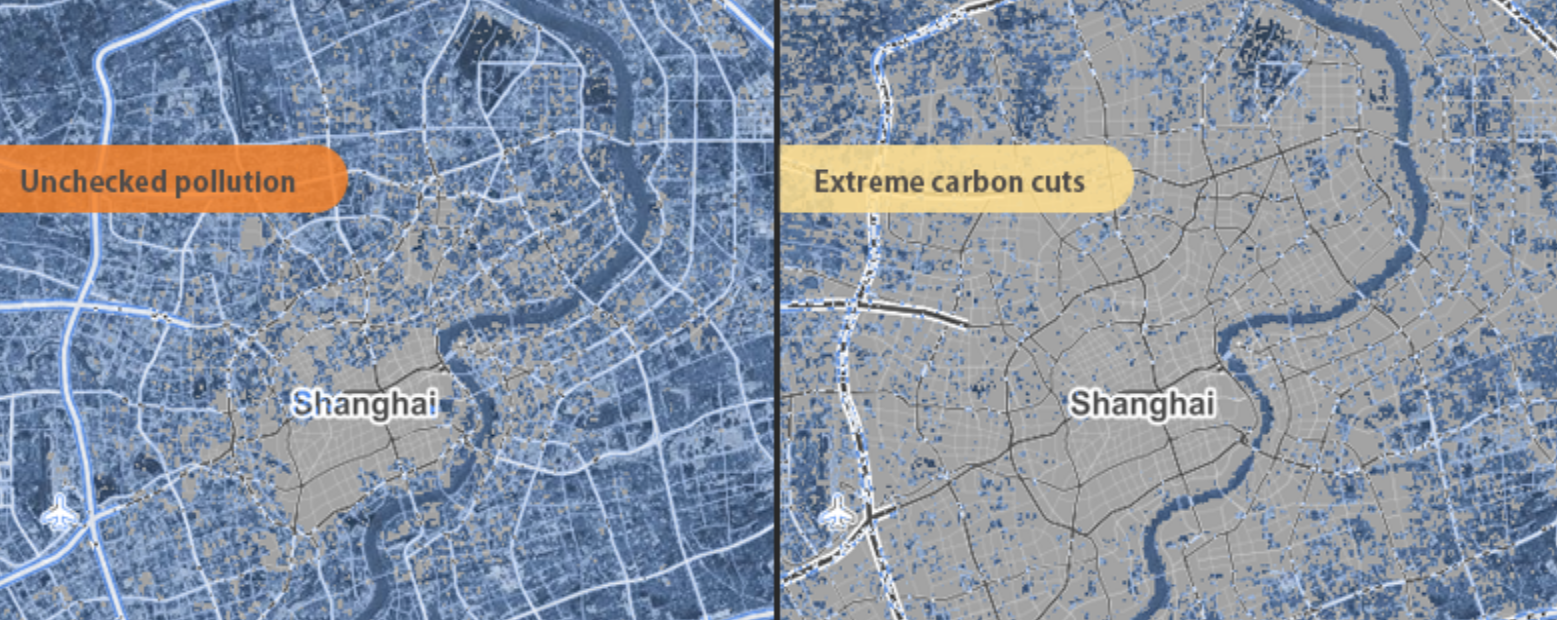
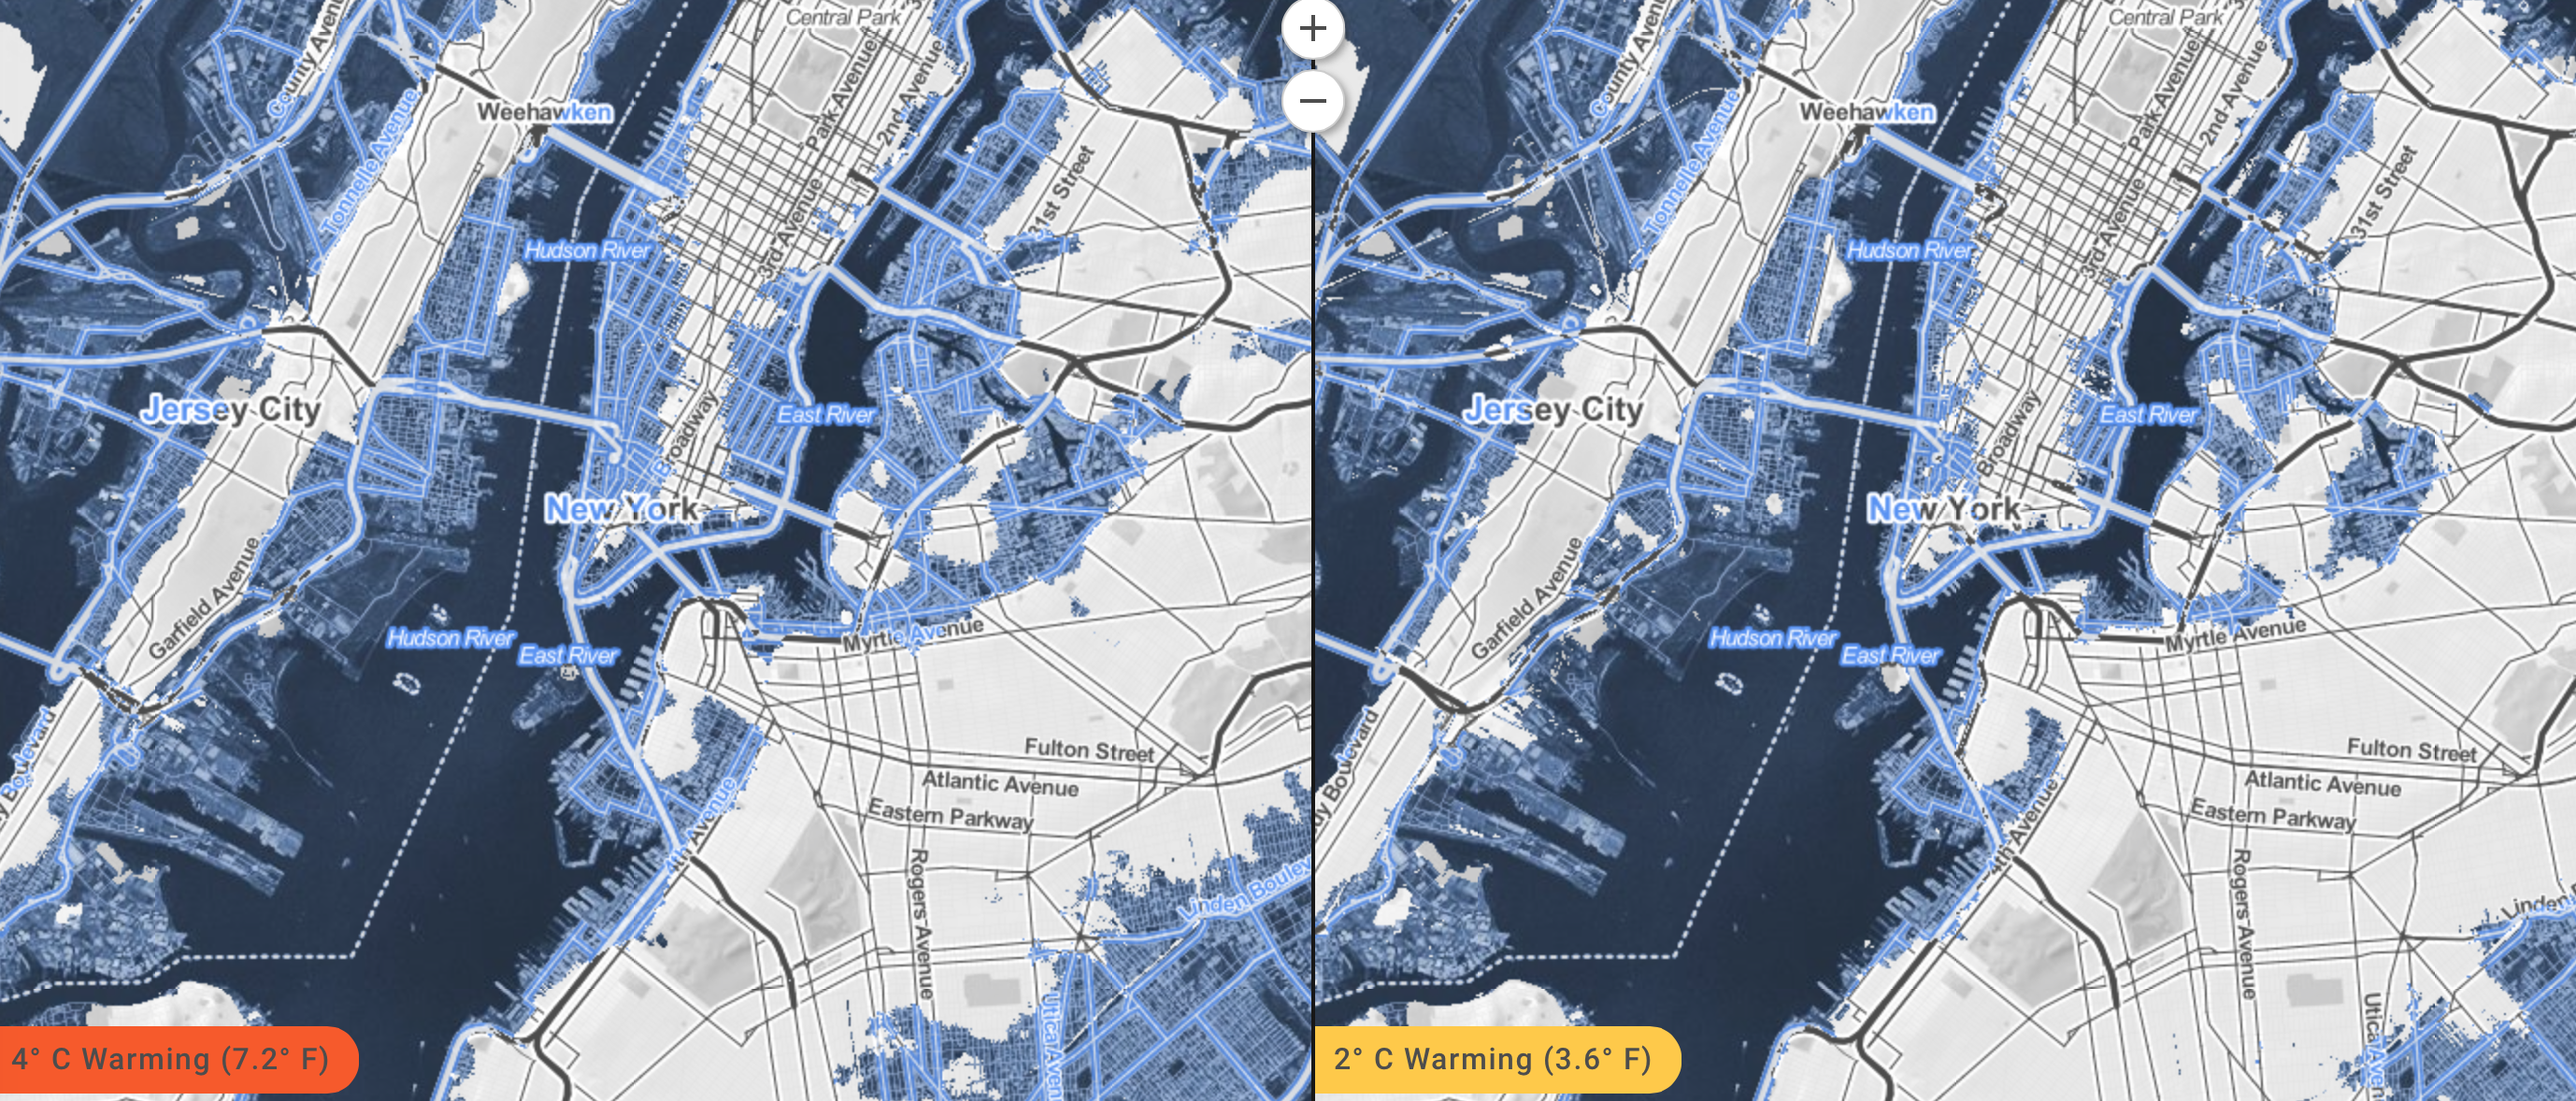
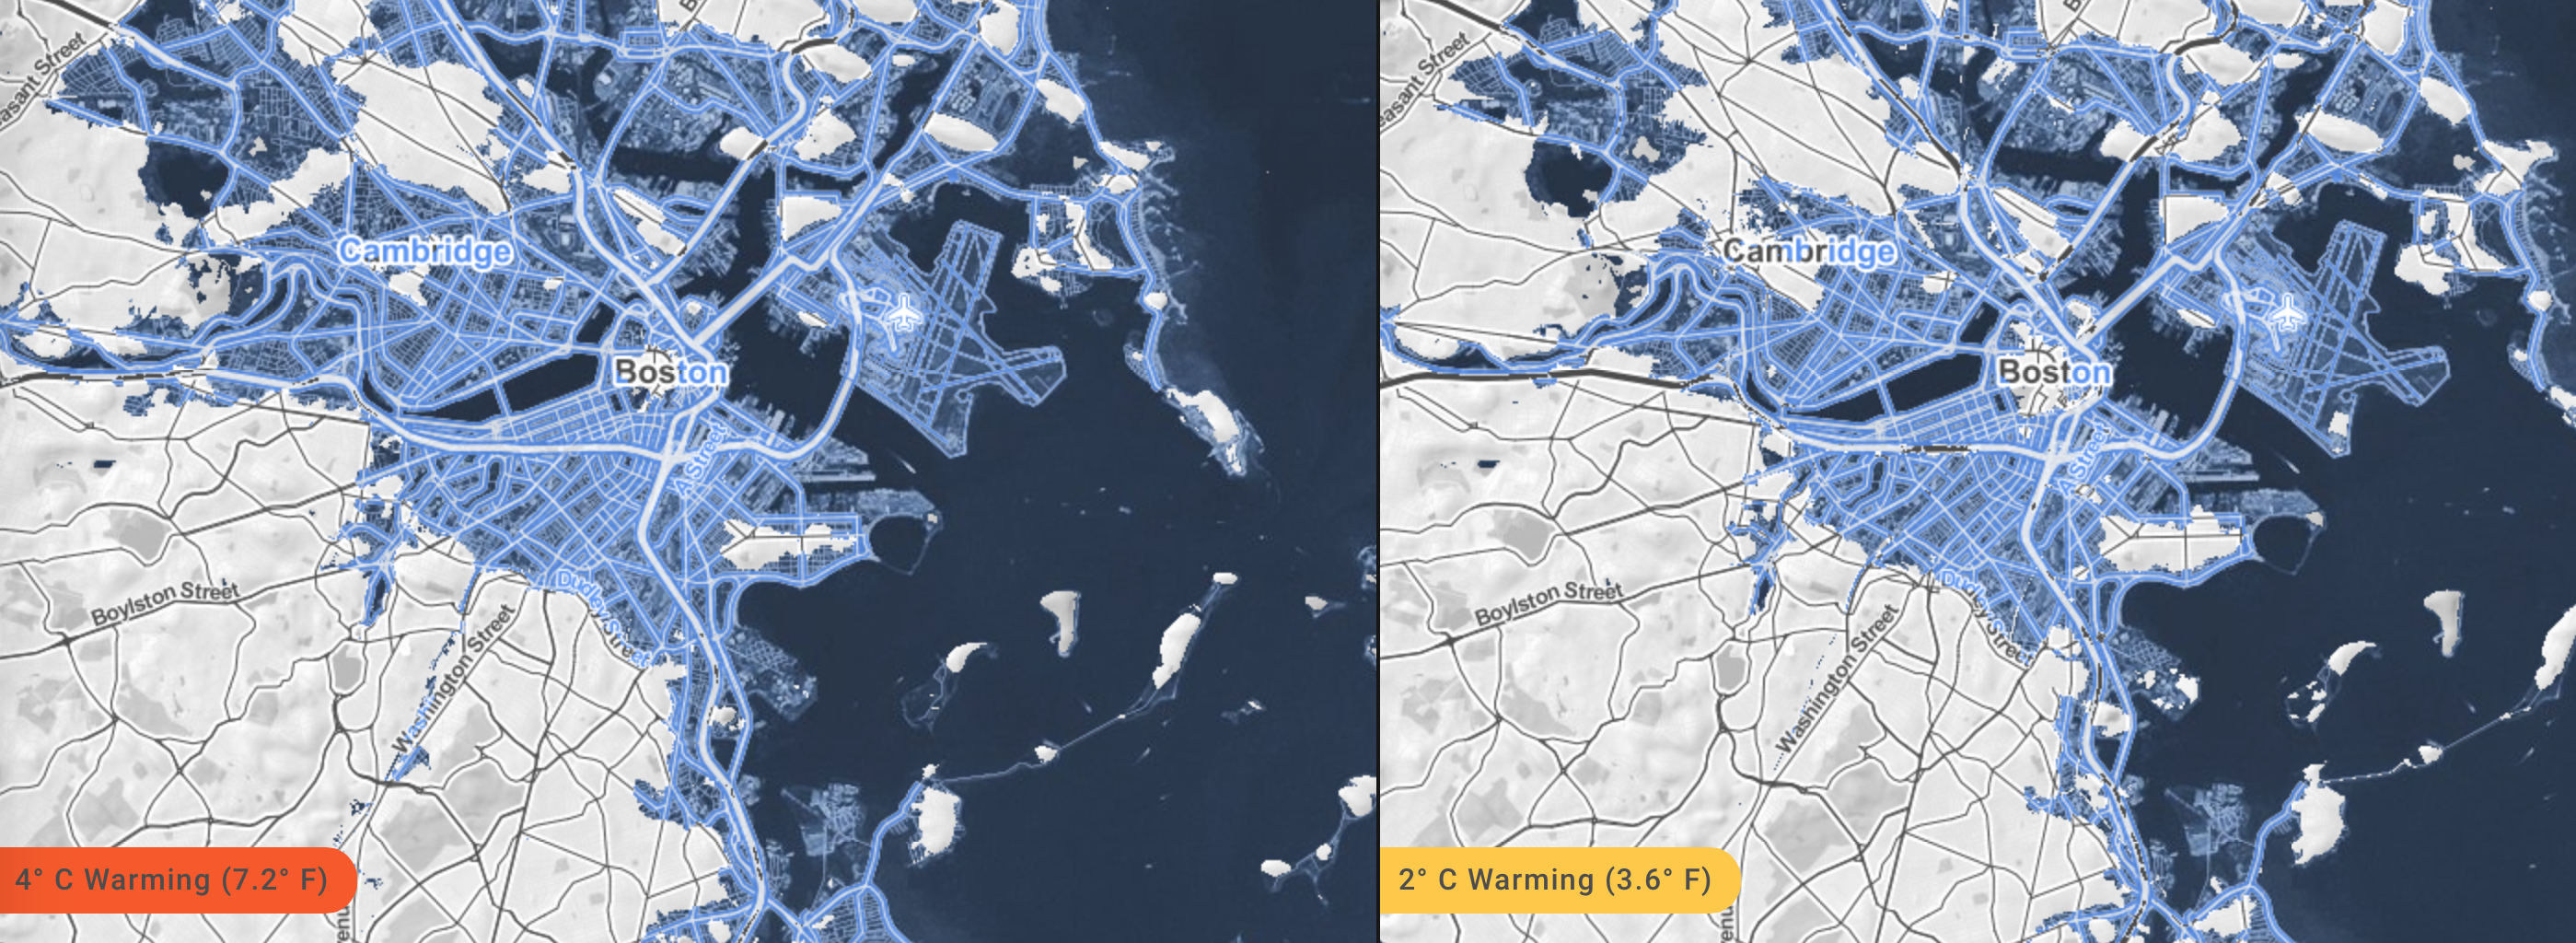
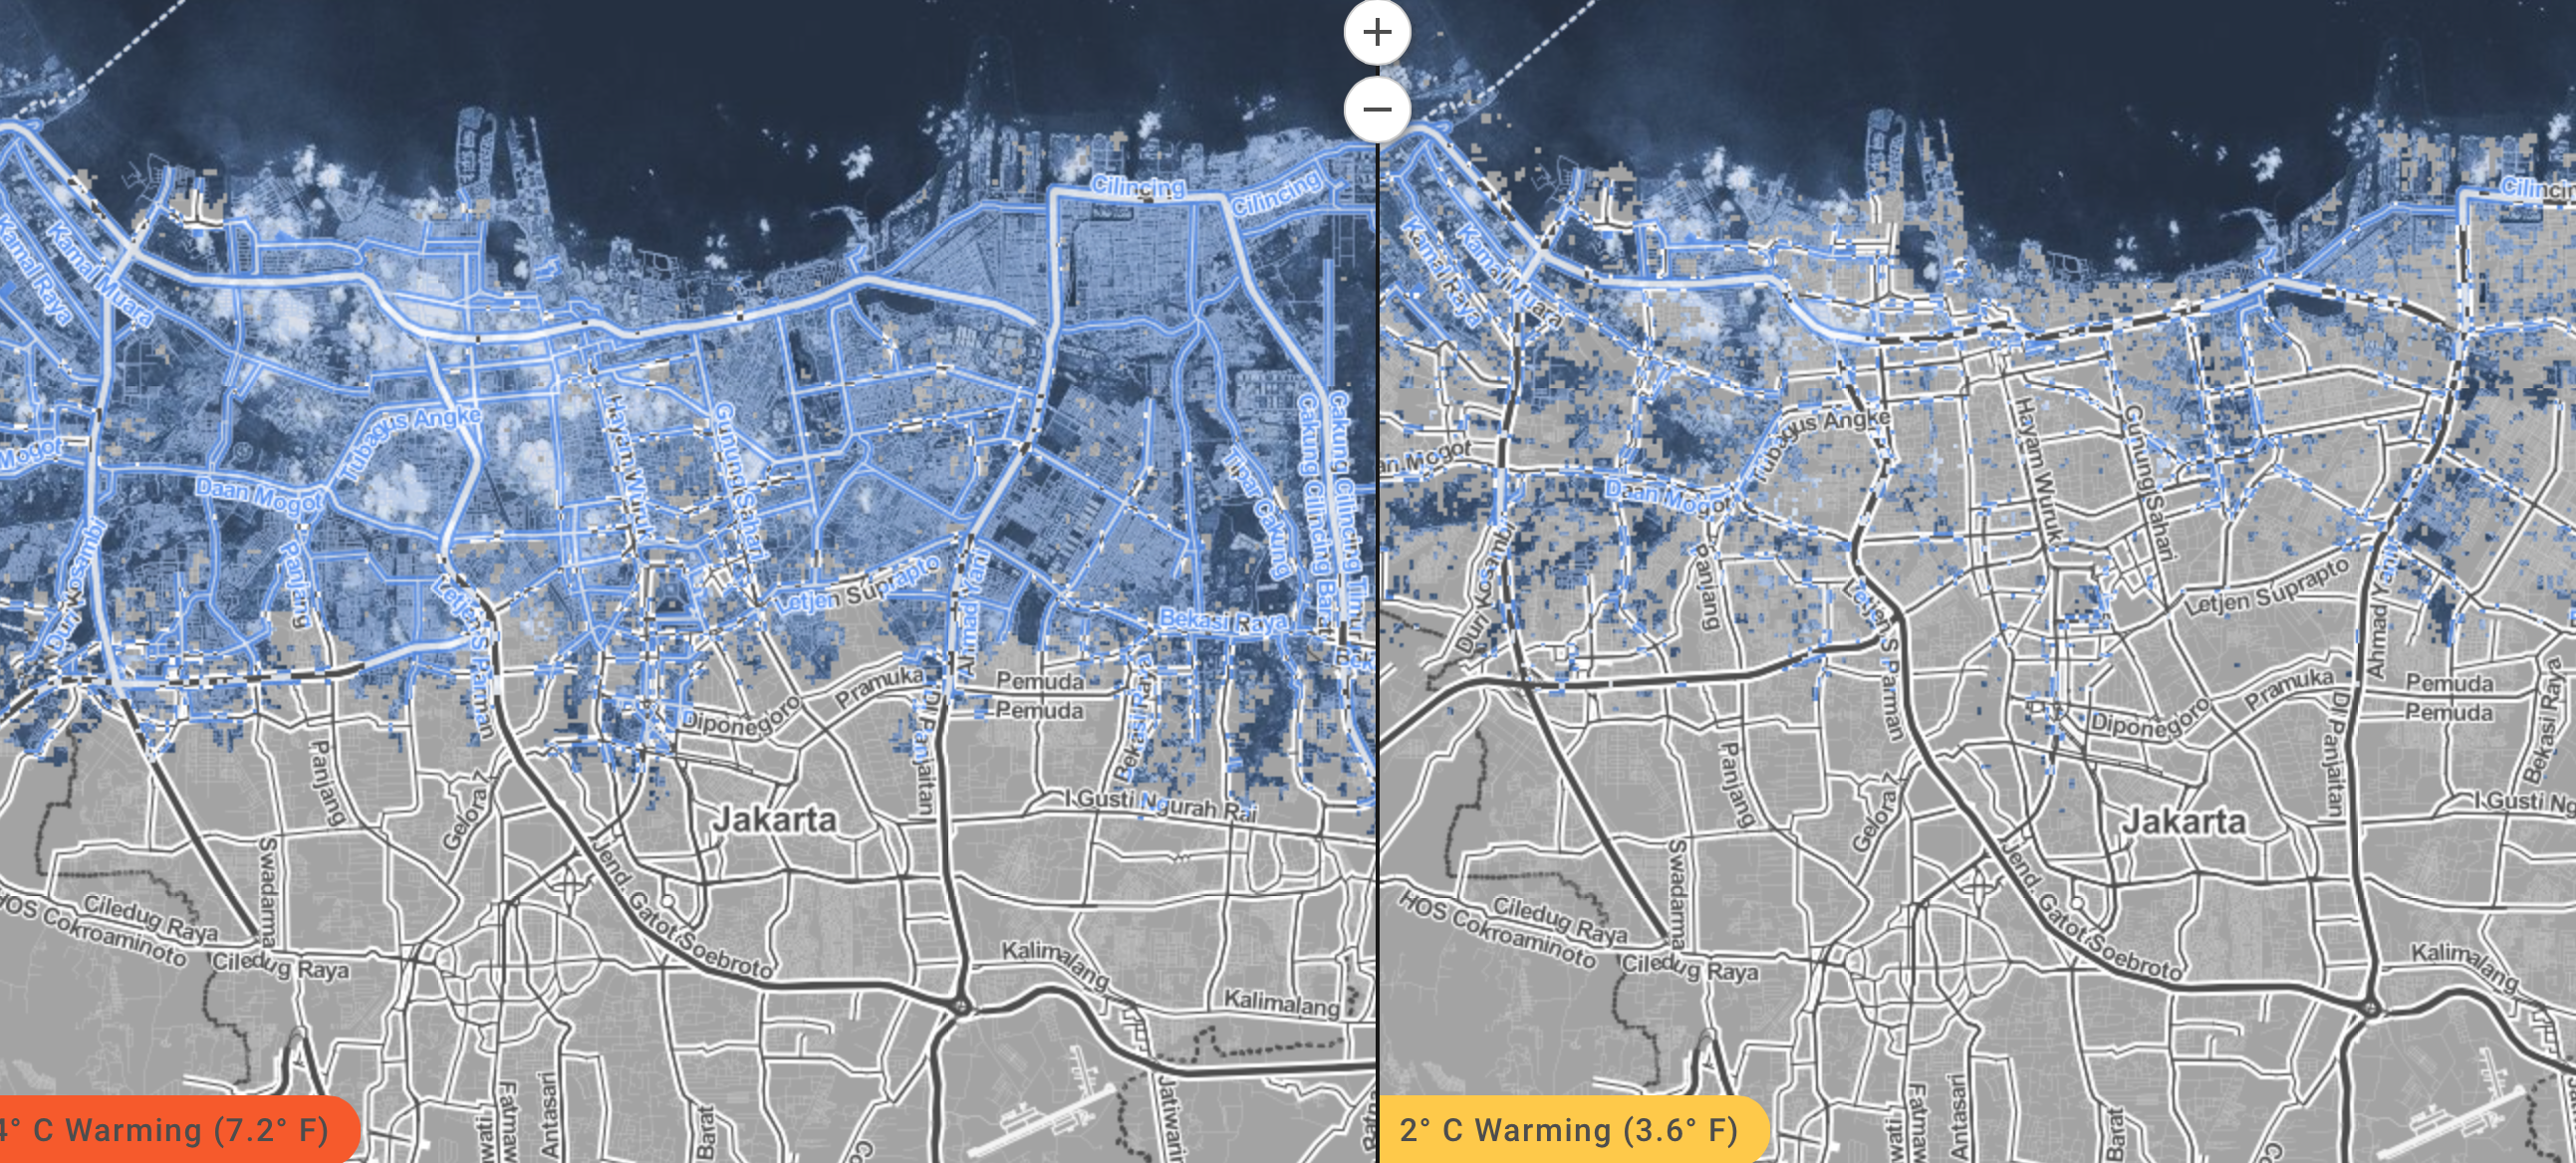
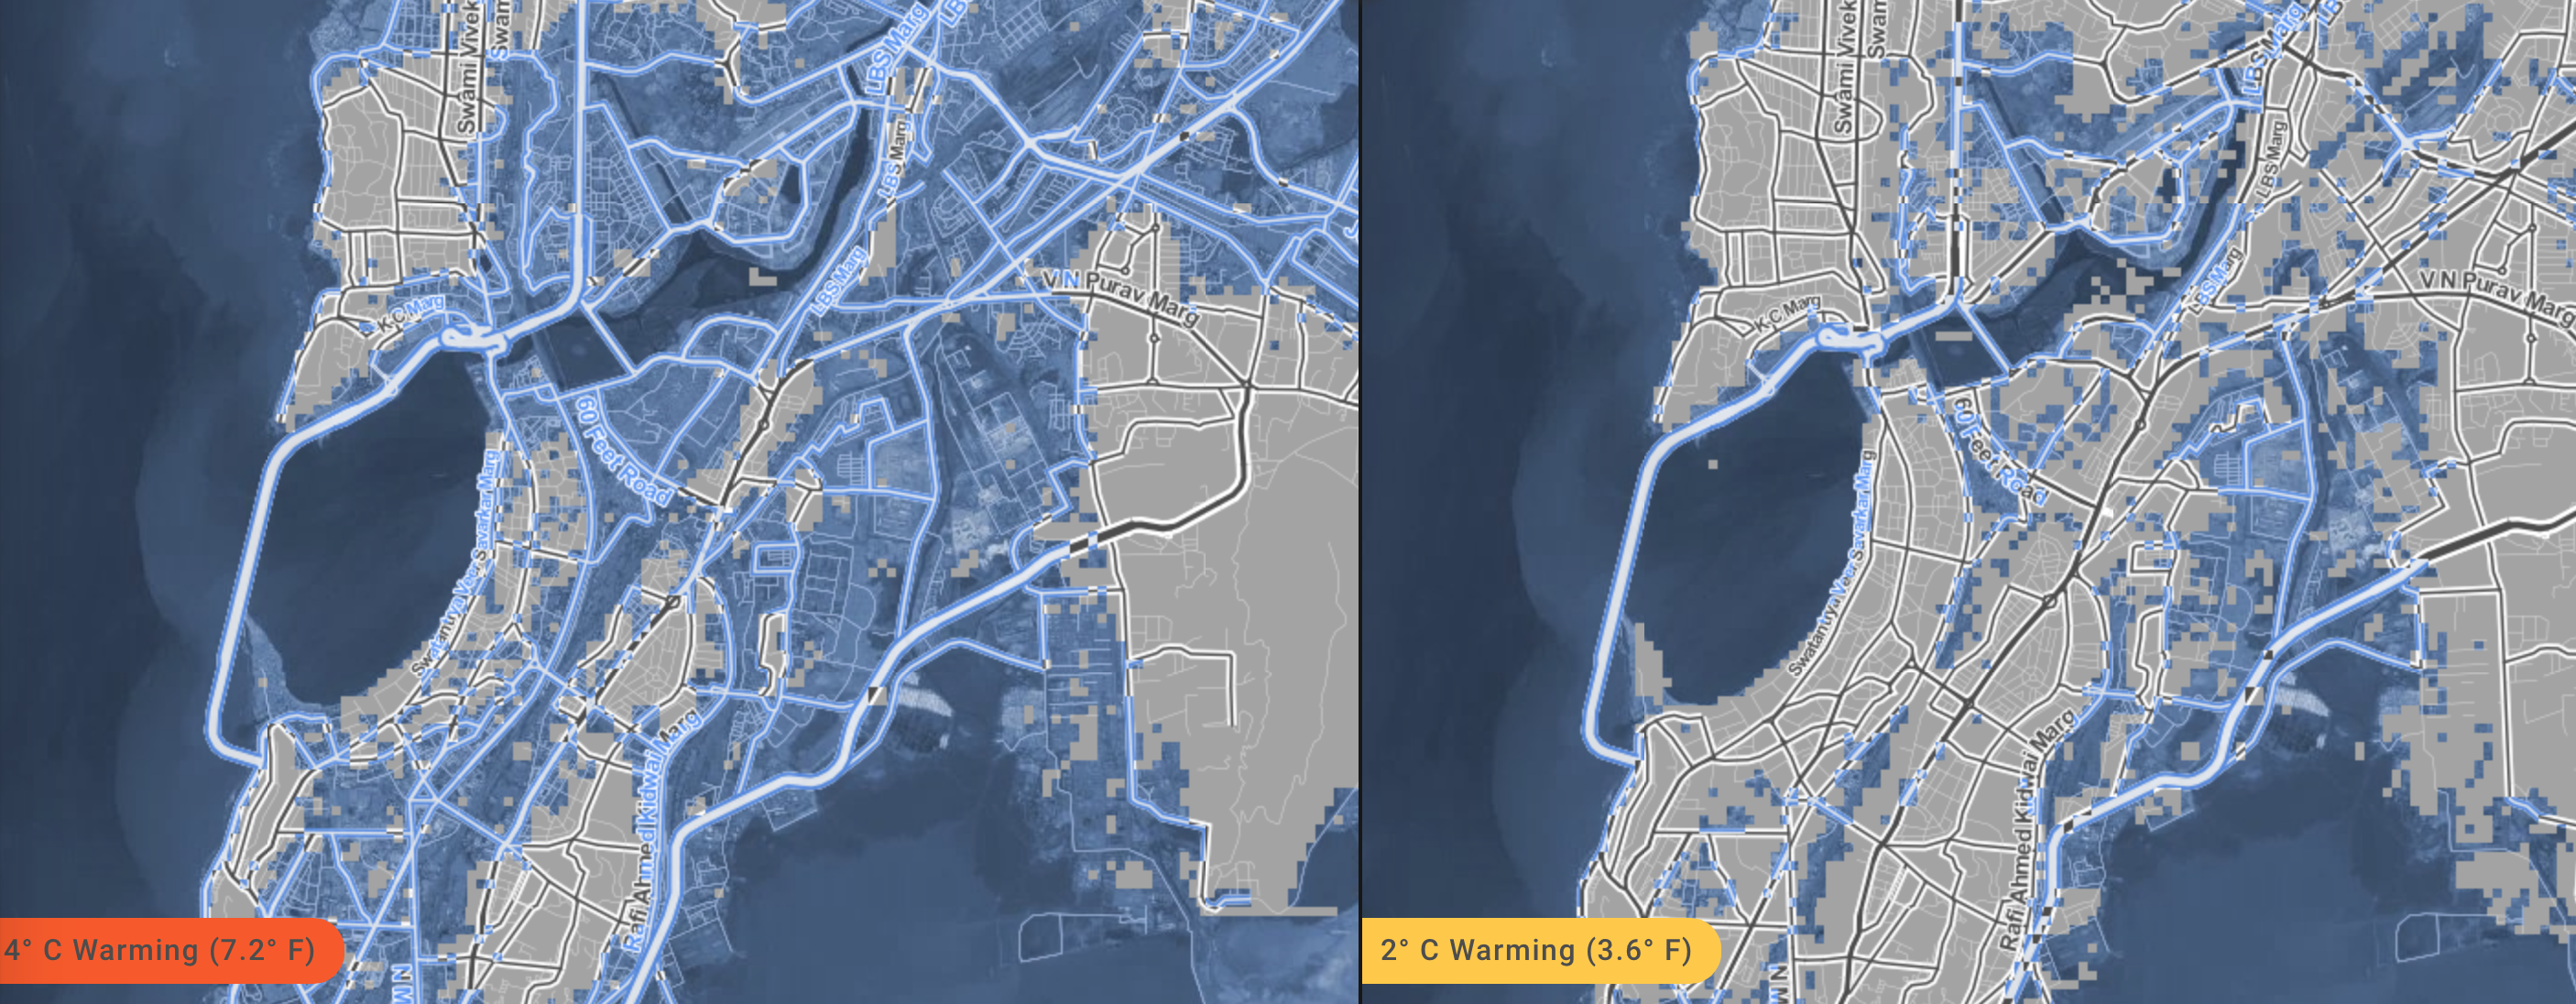
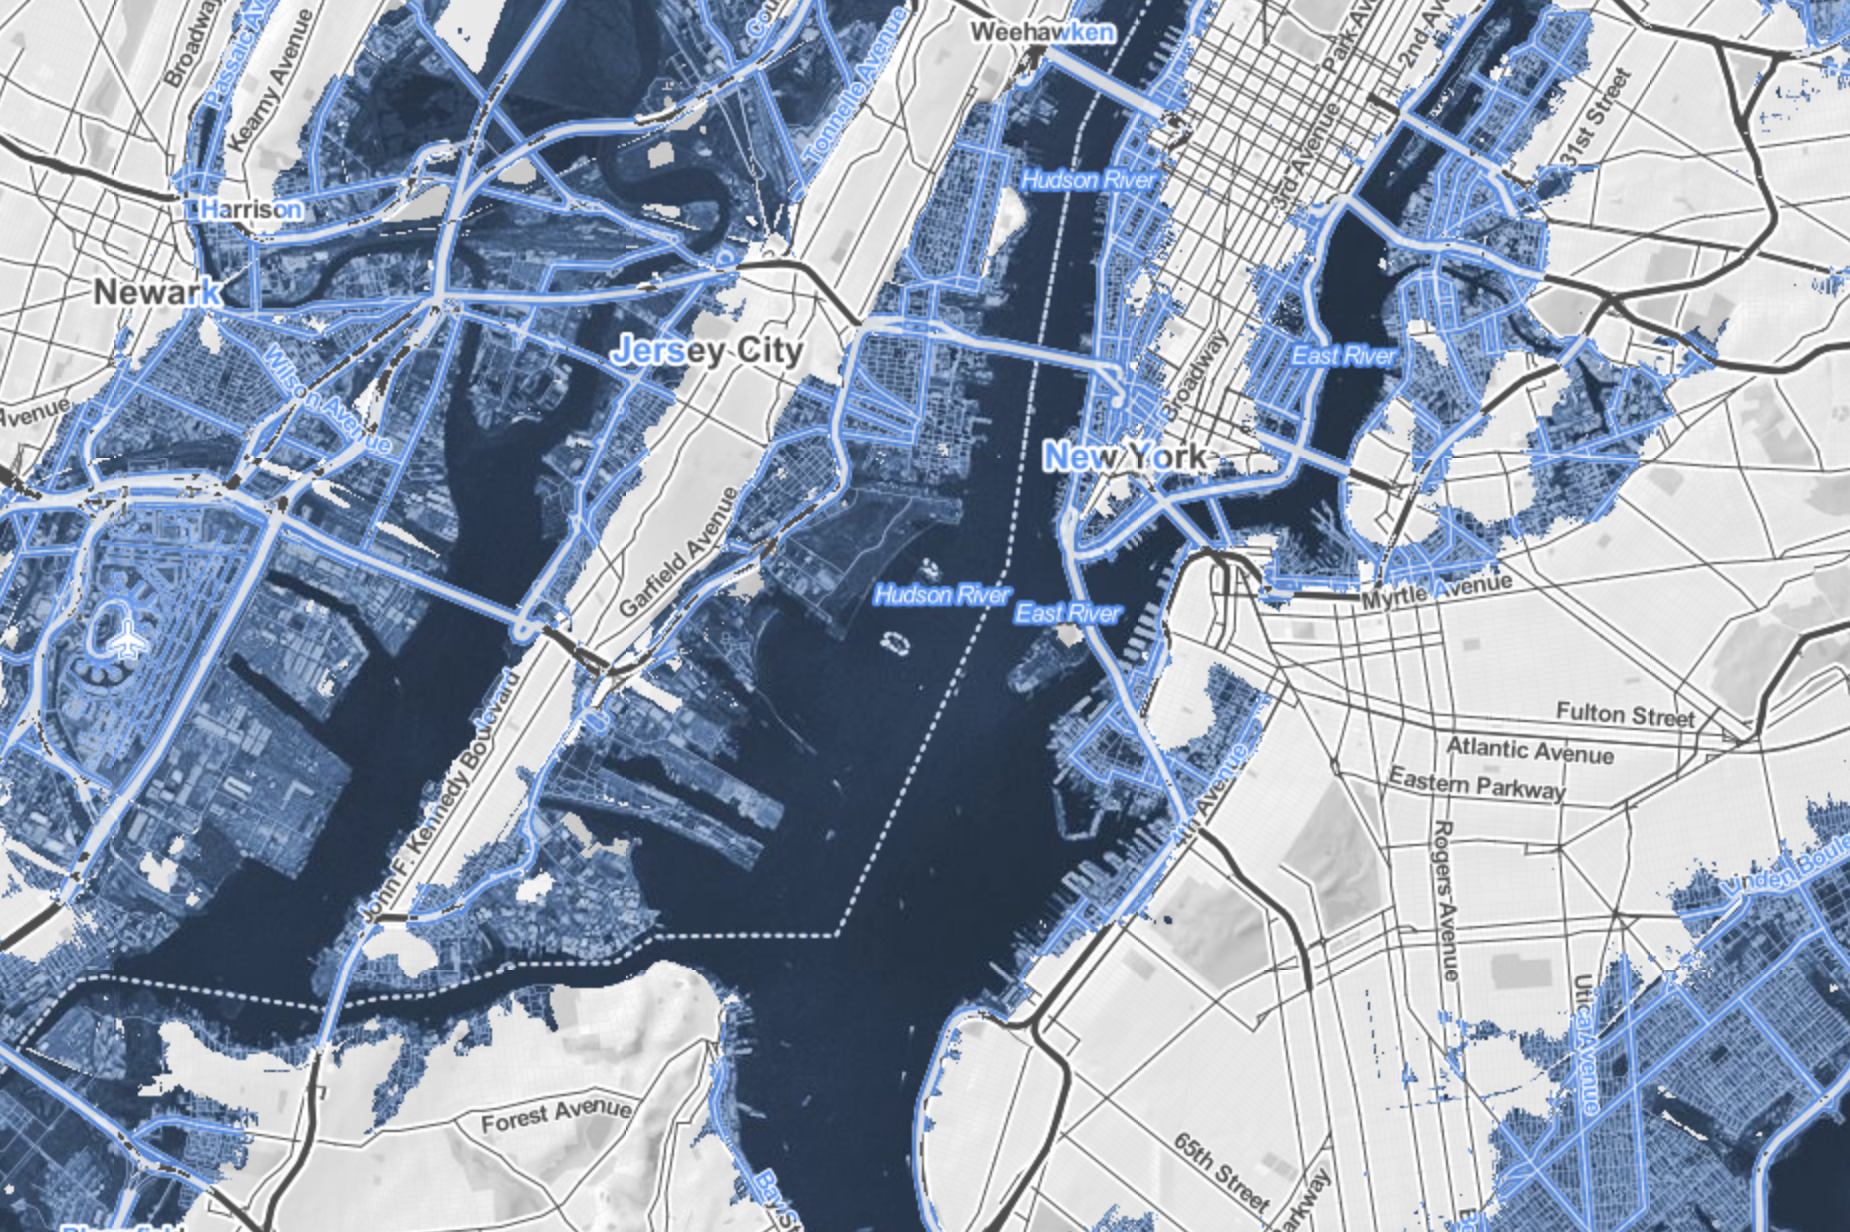
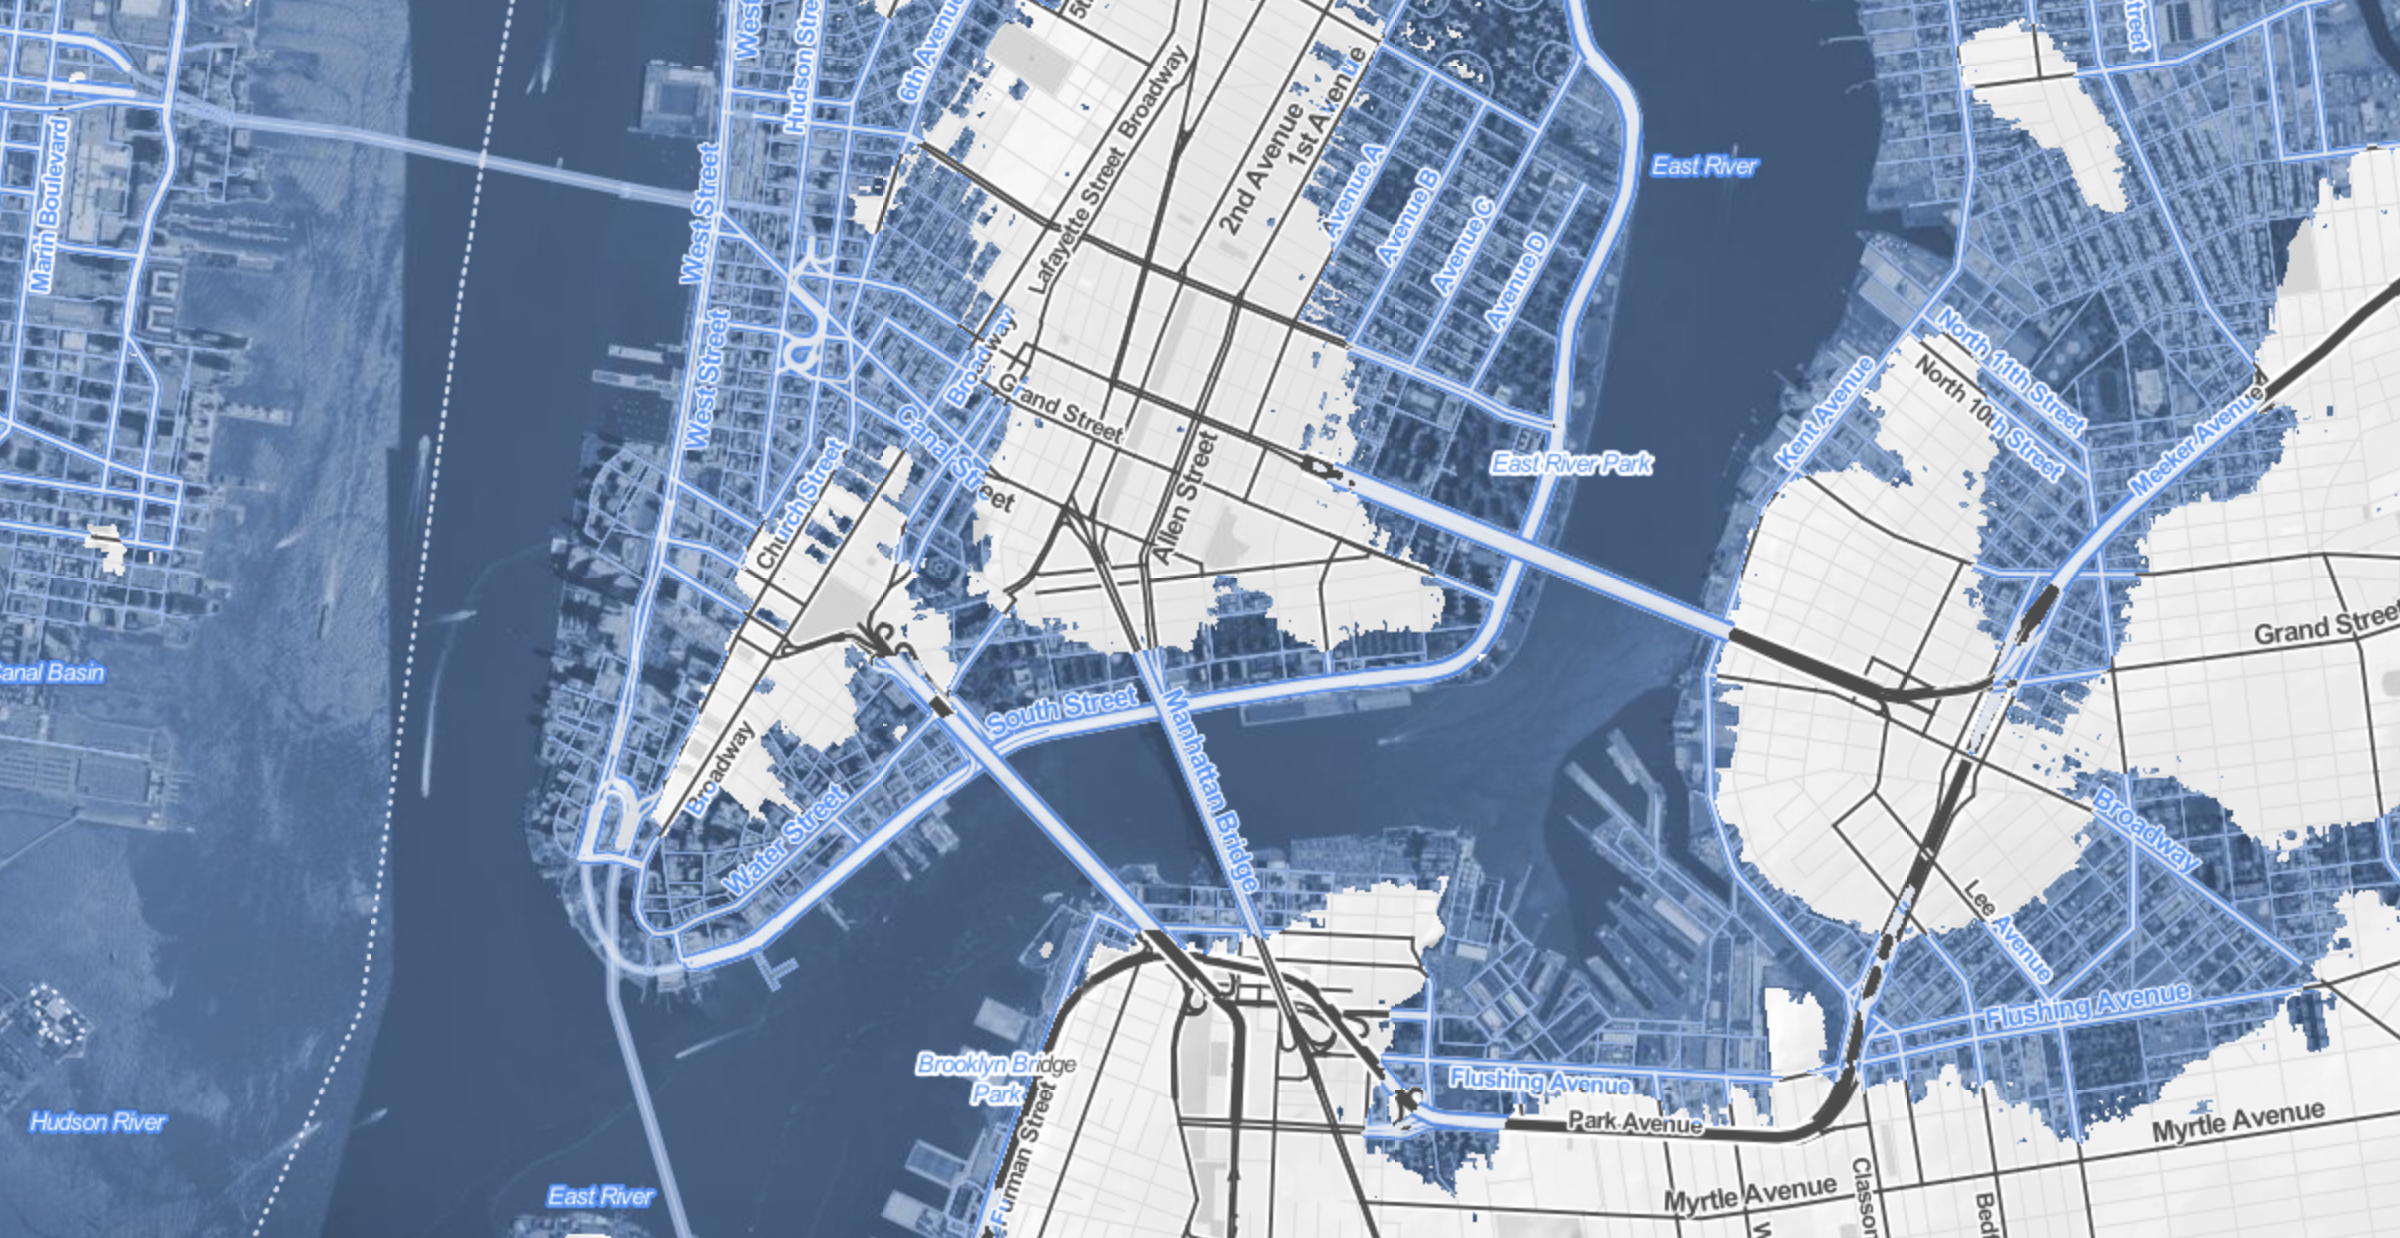
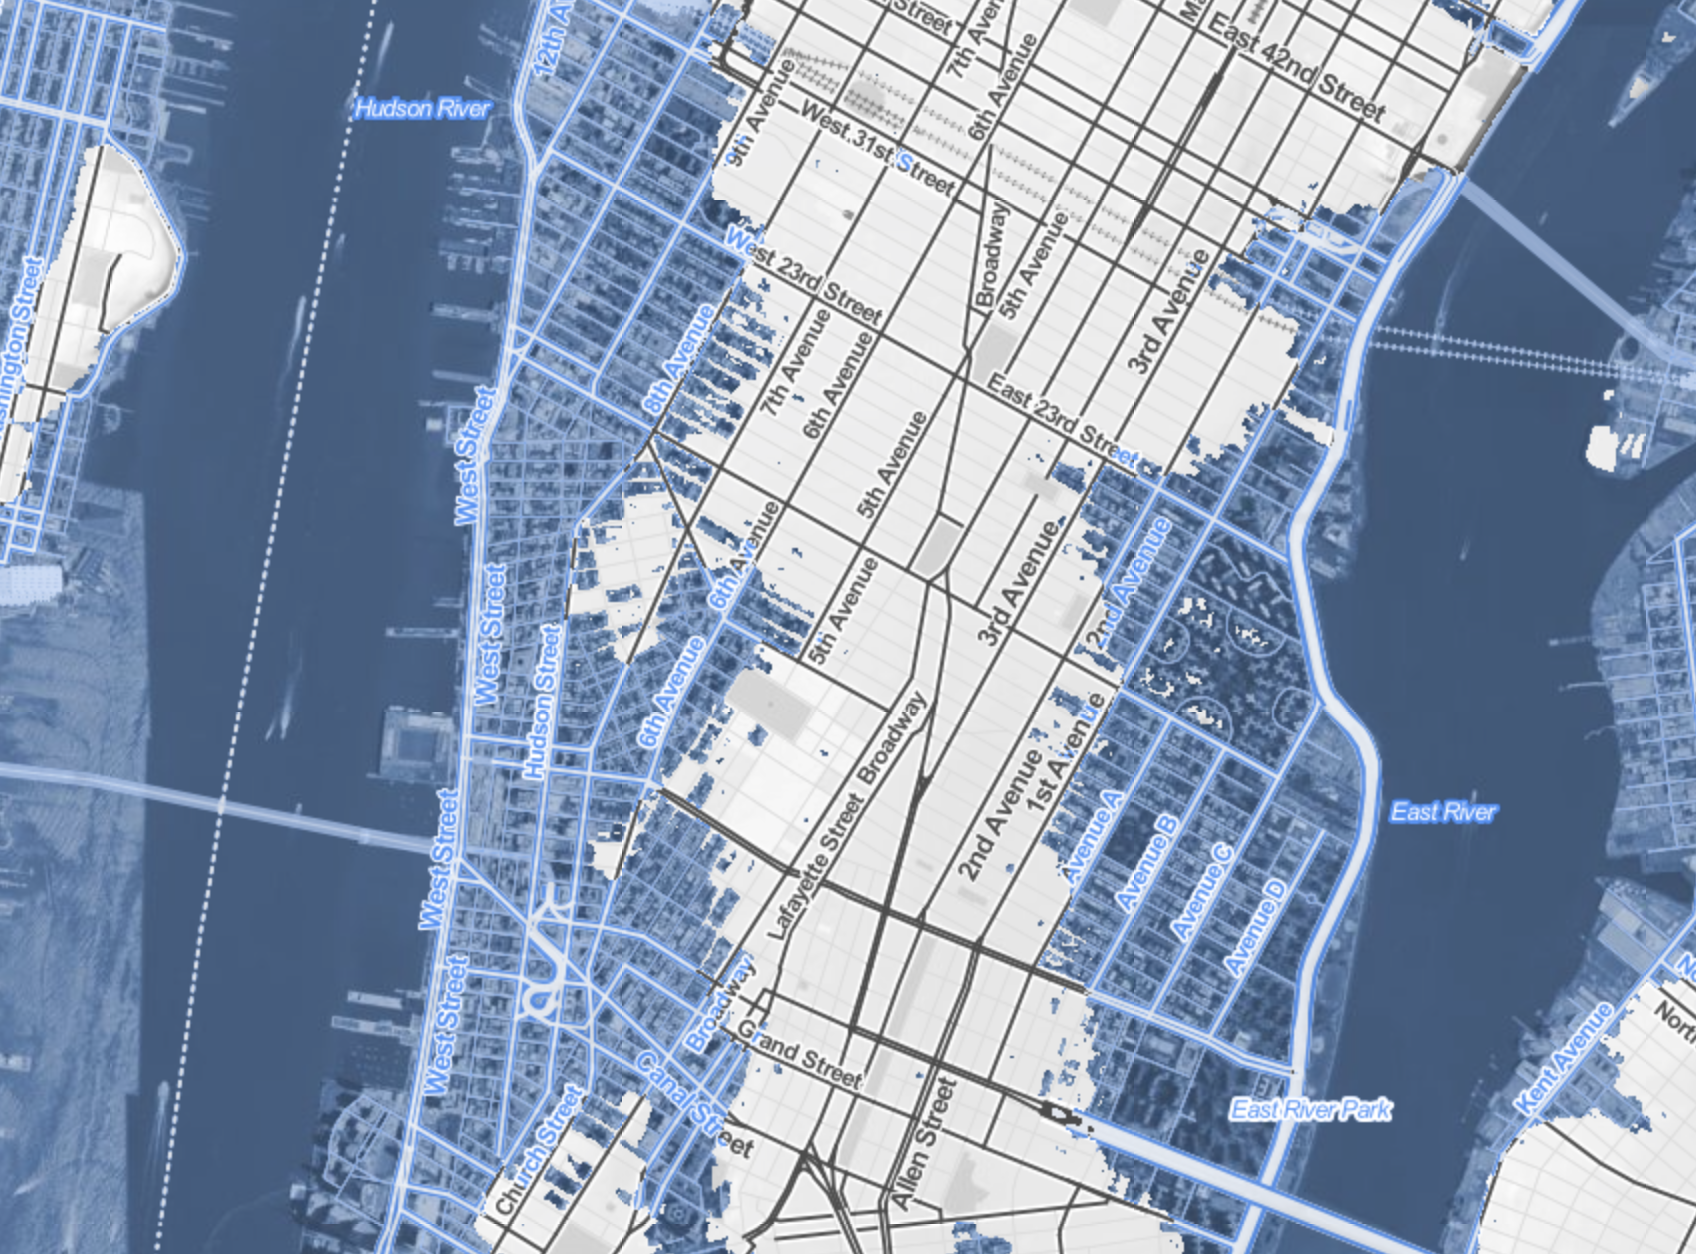
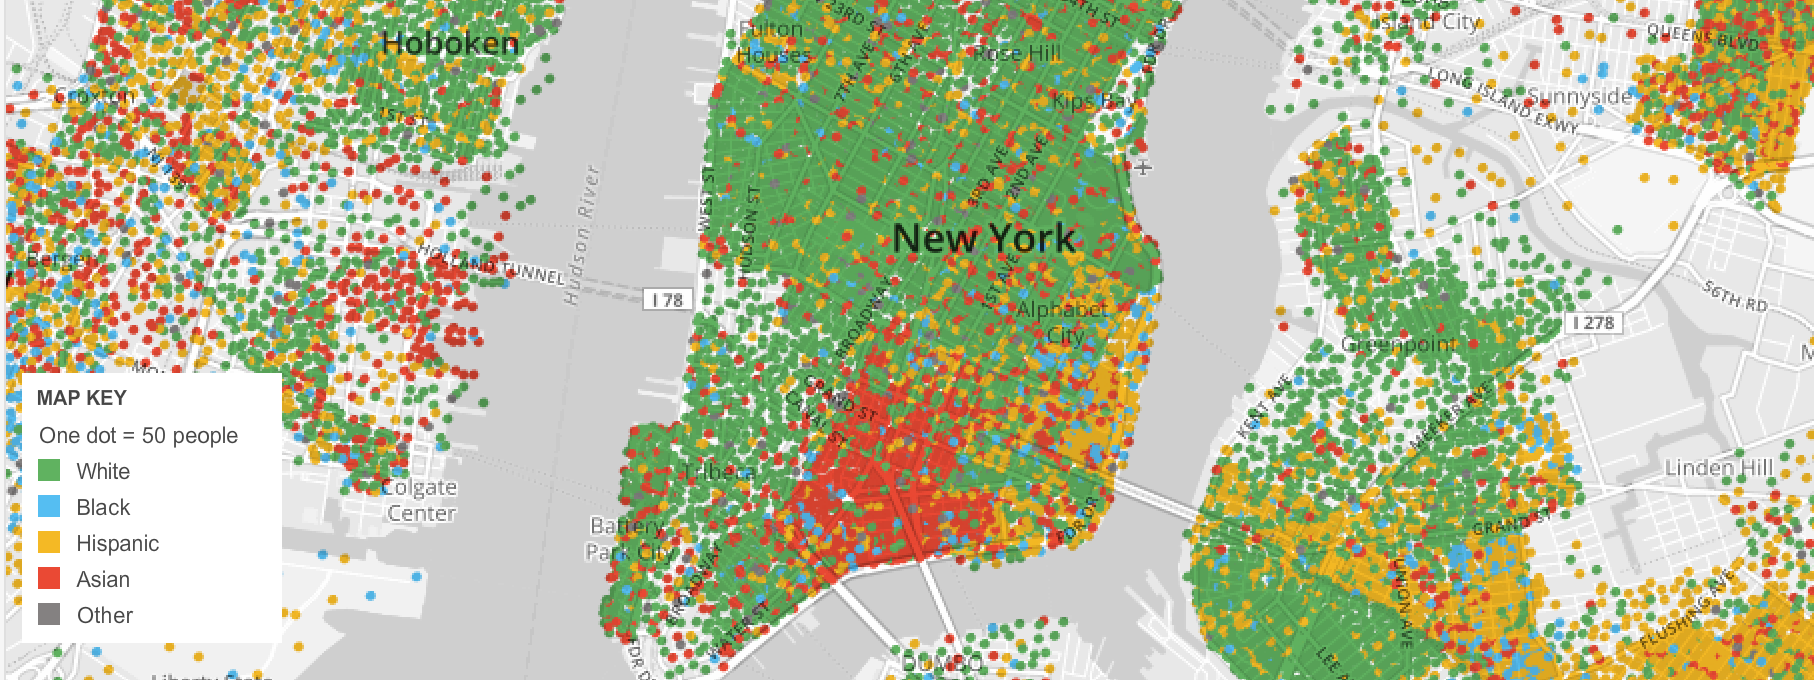
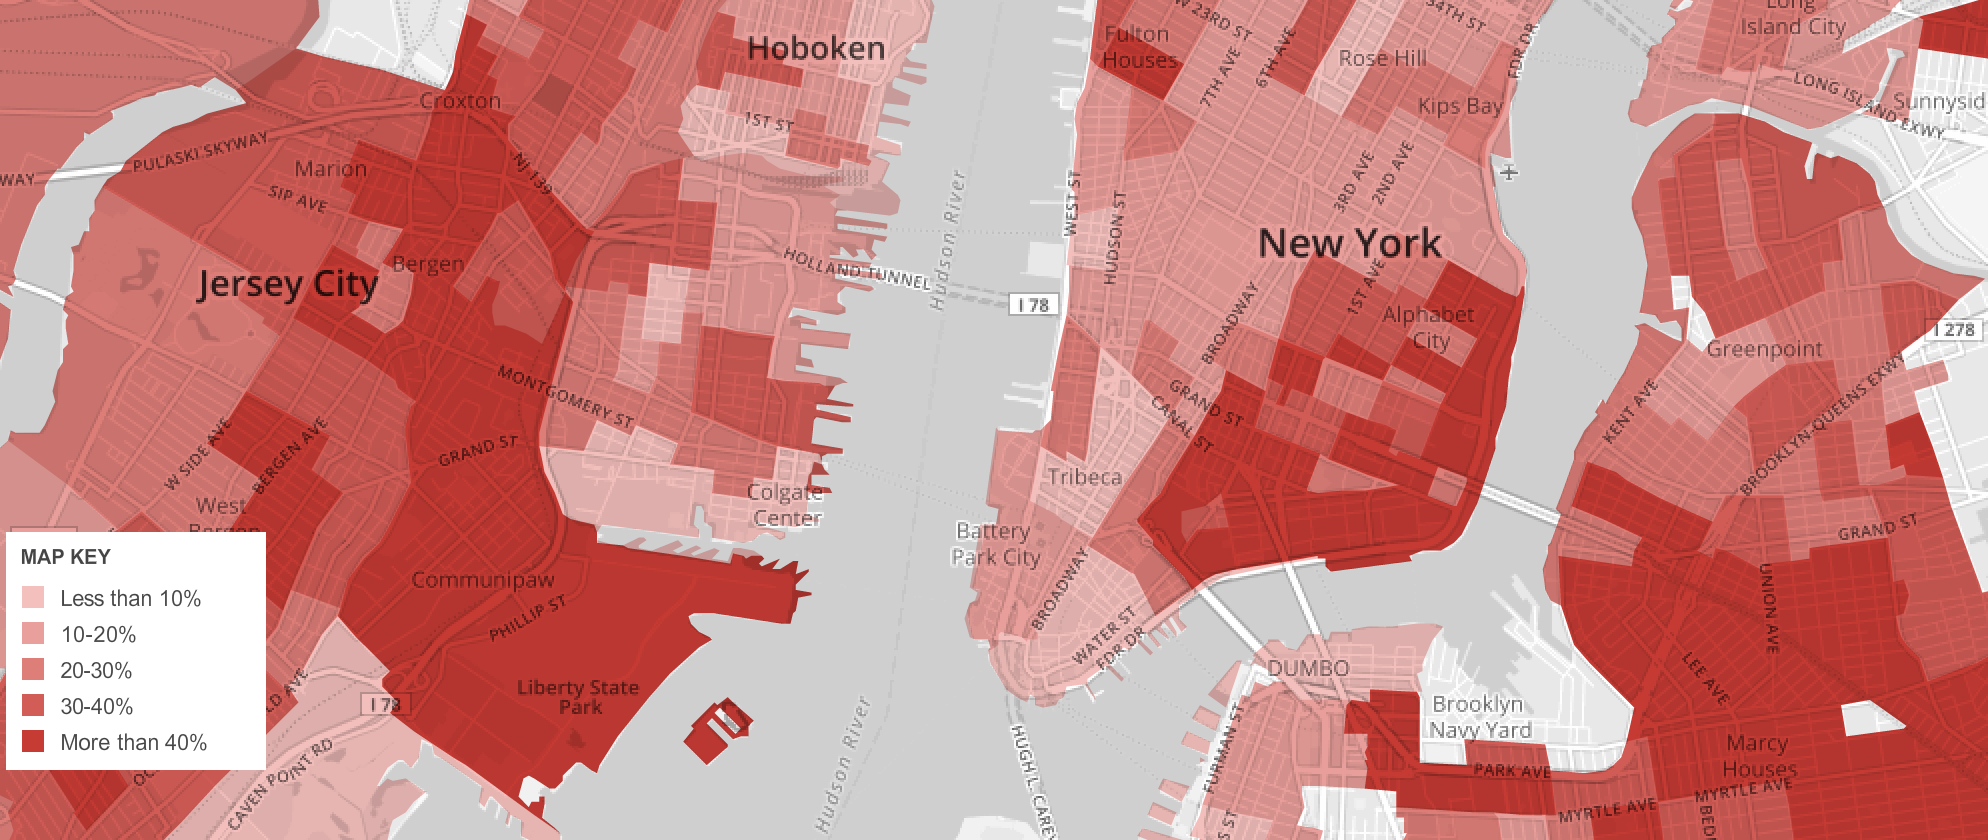 American Community Survey (2010)/New York Times
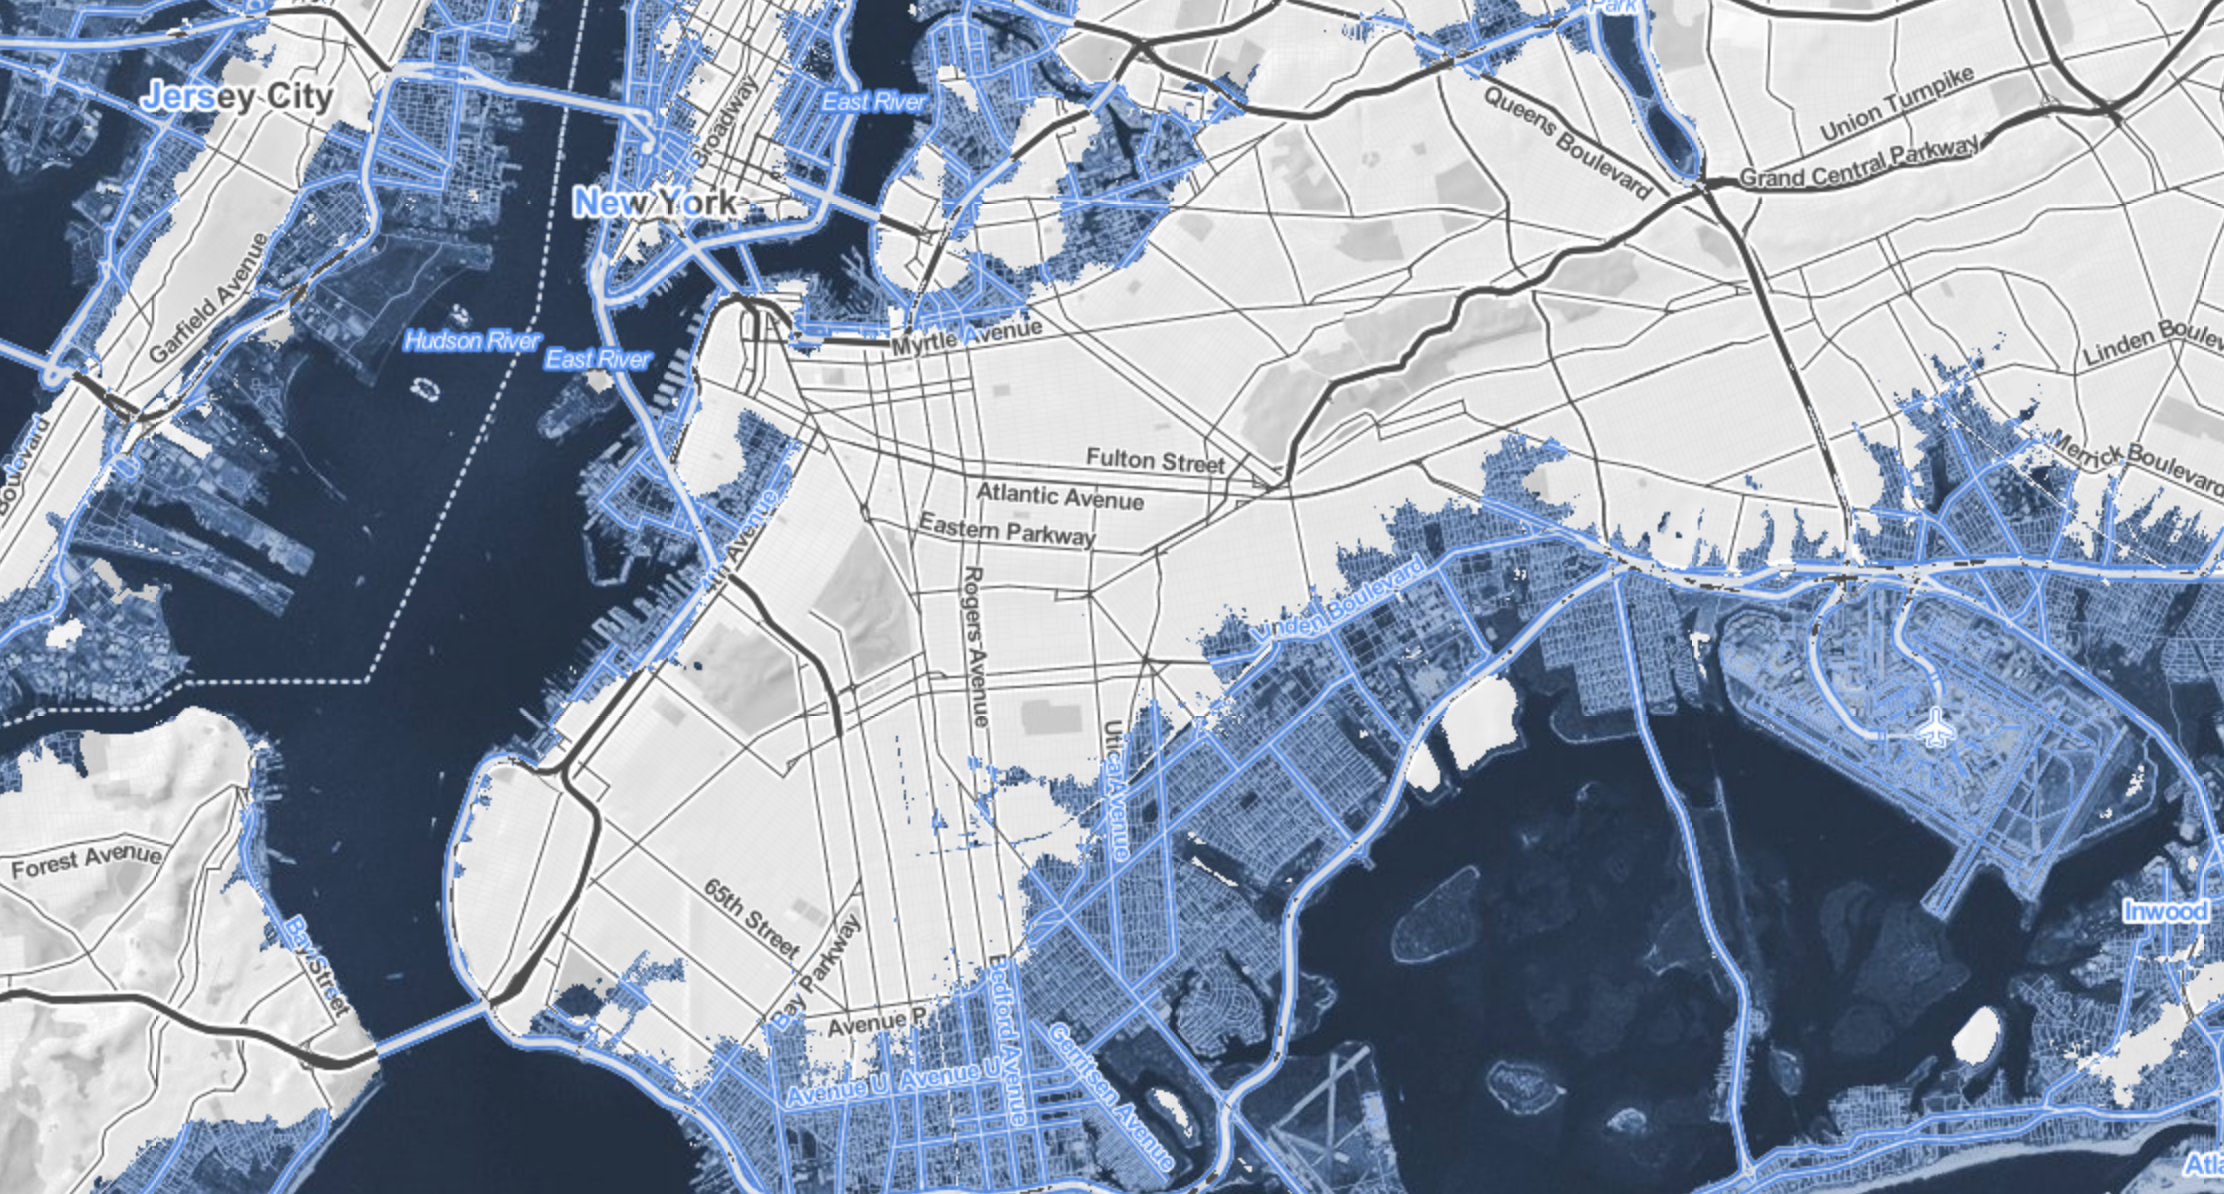
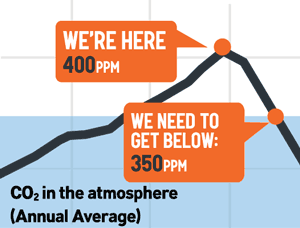
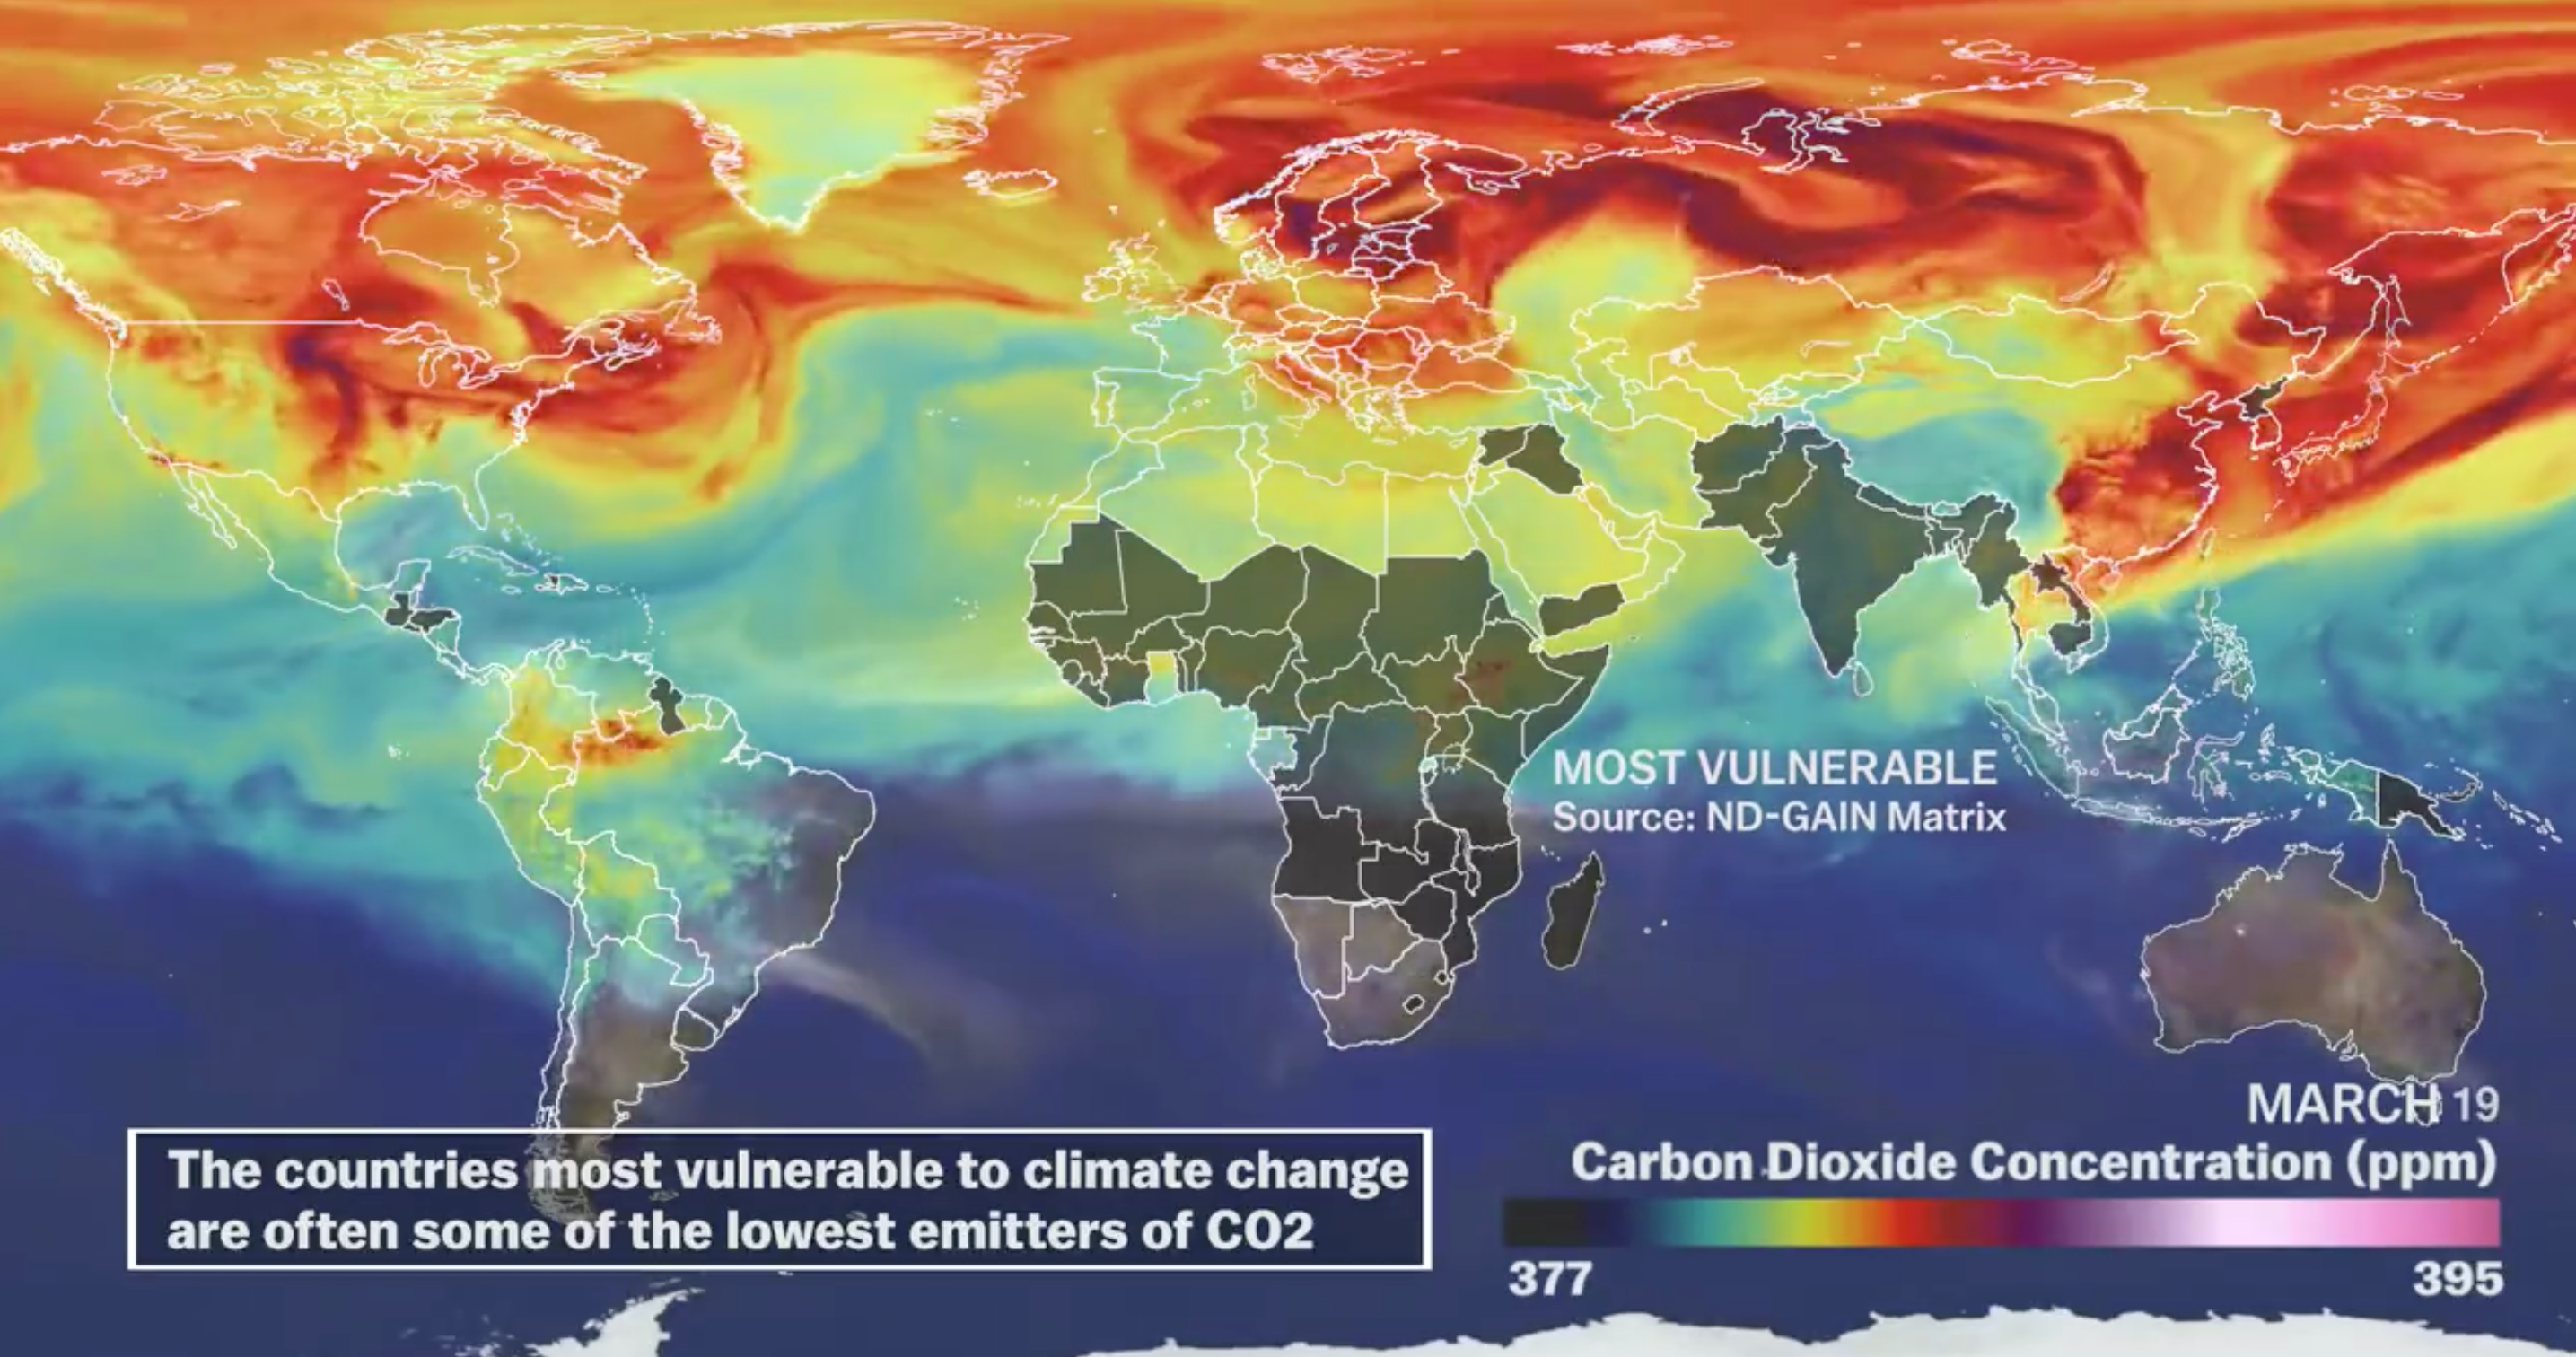
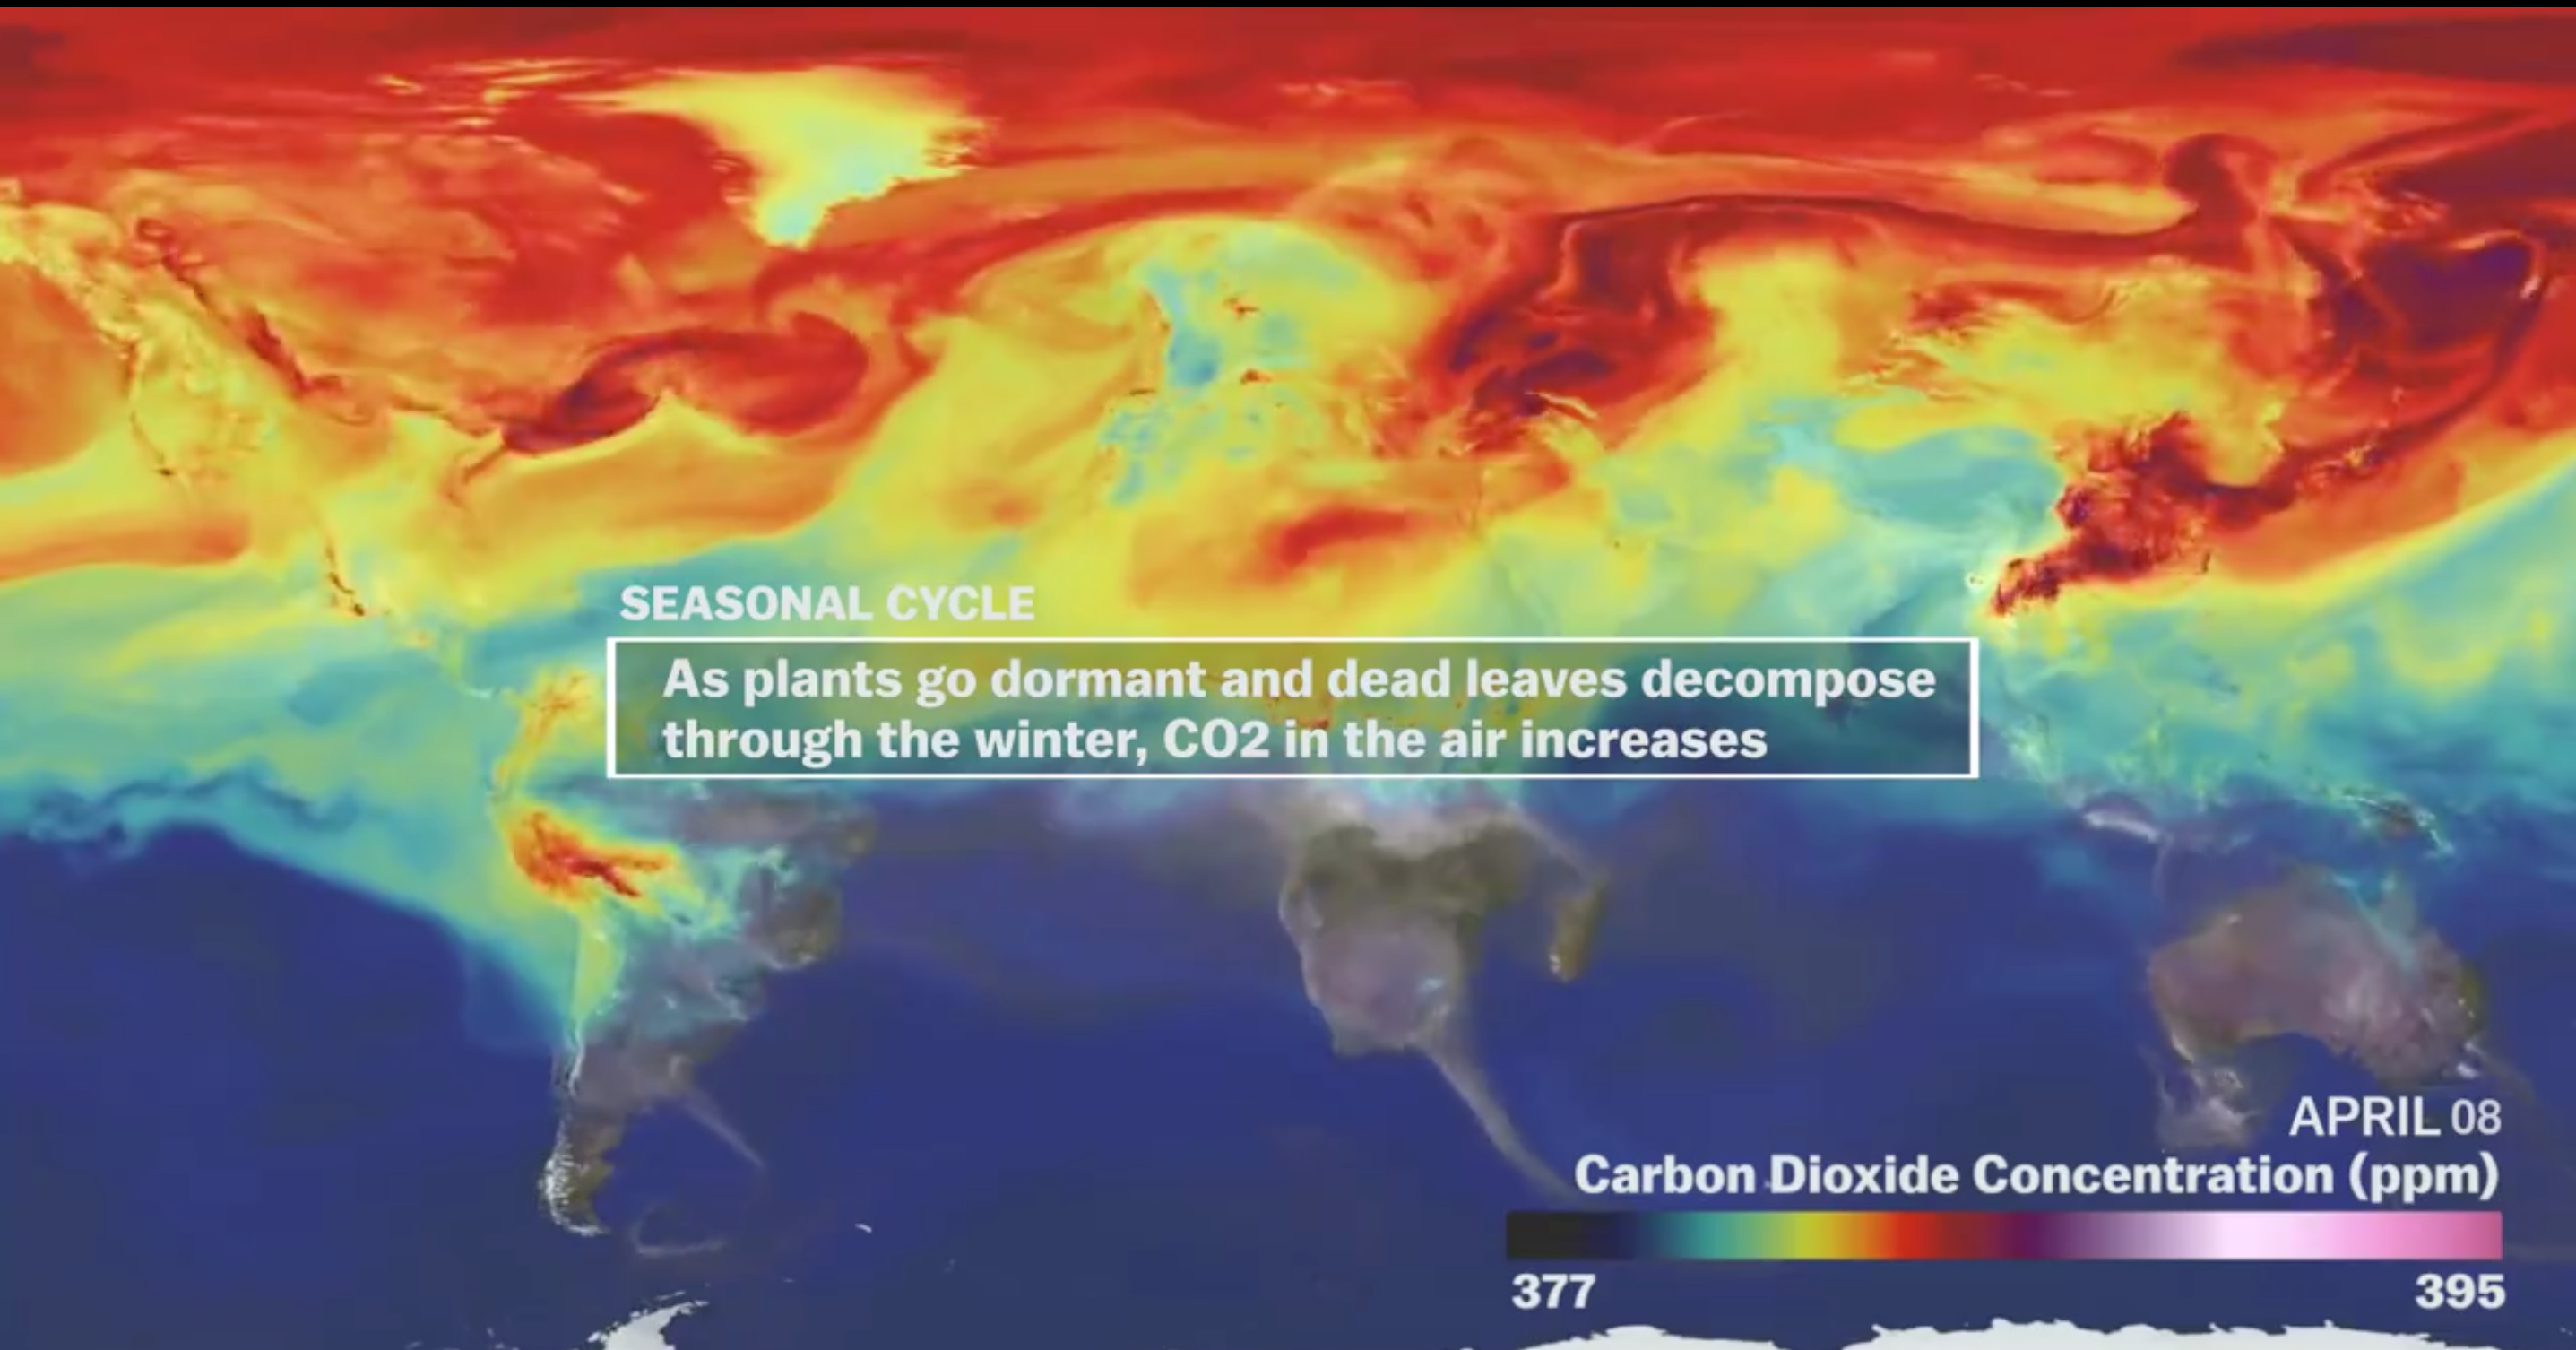
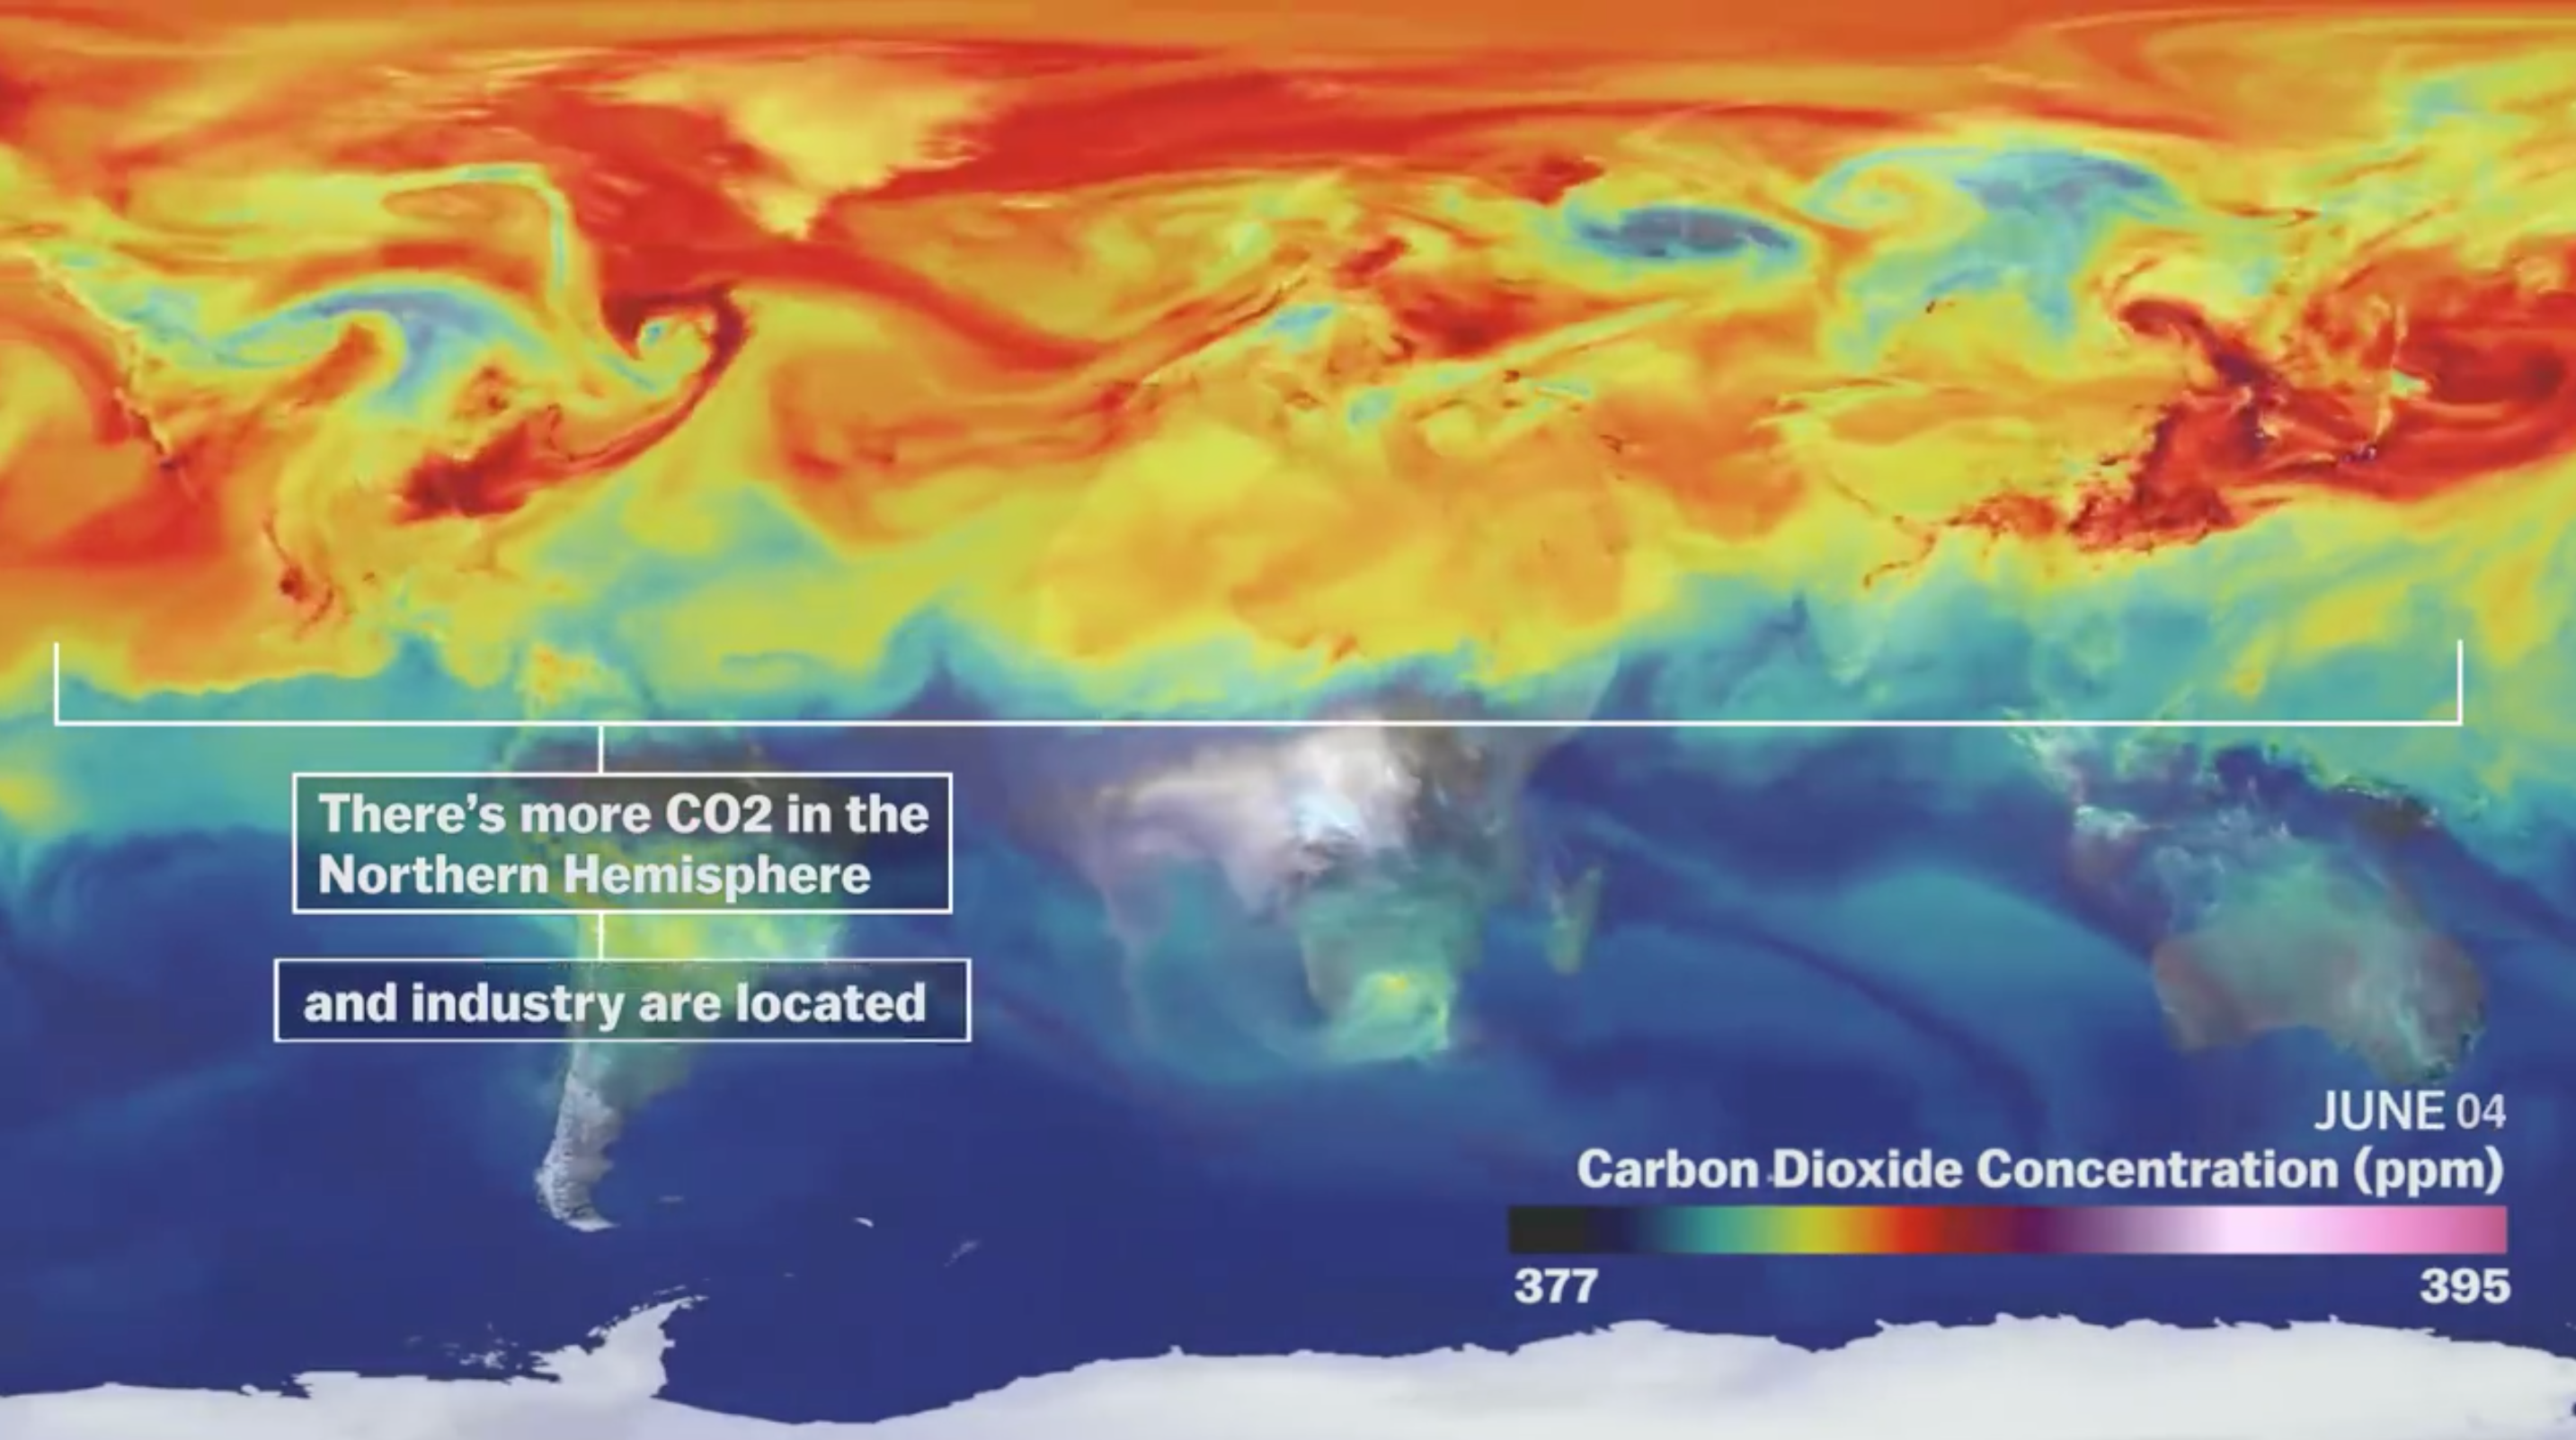 Vox– A visual tour of the world’s CO2 emissions
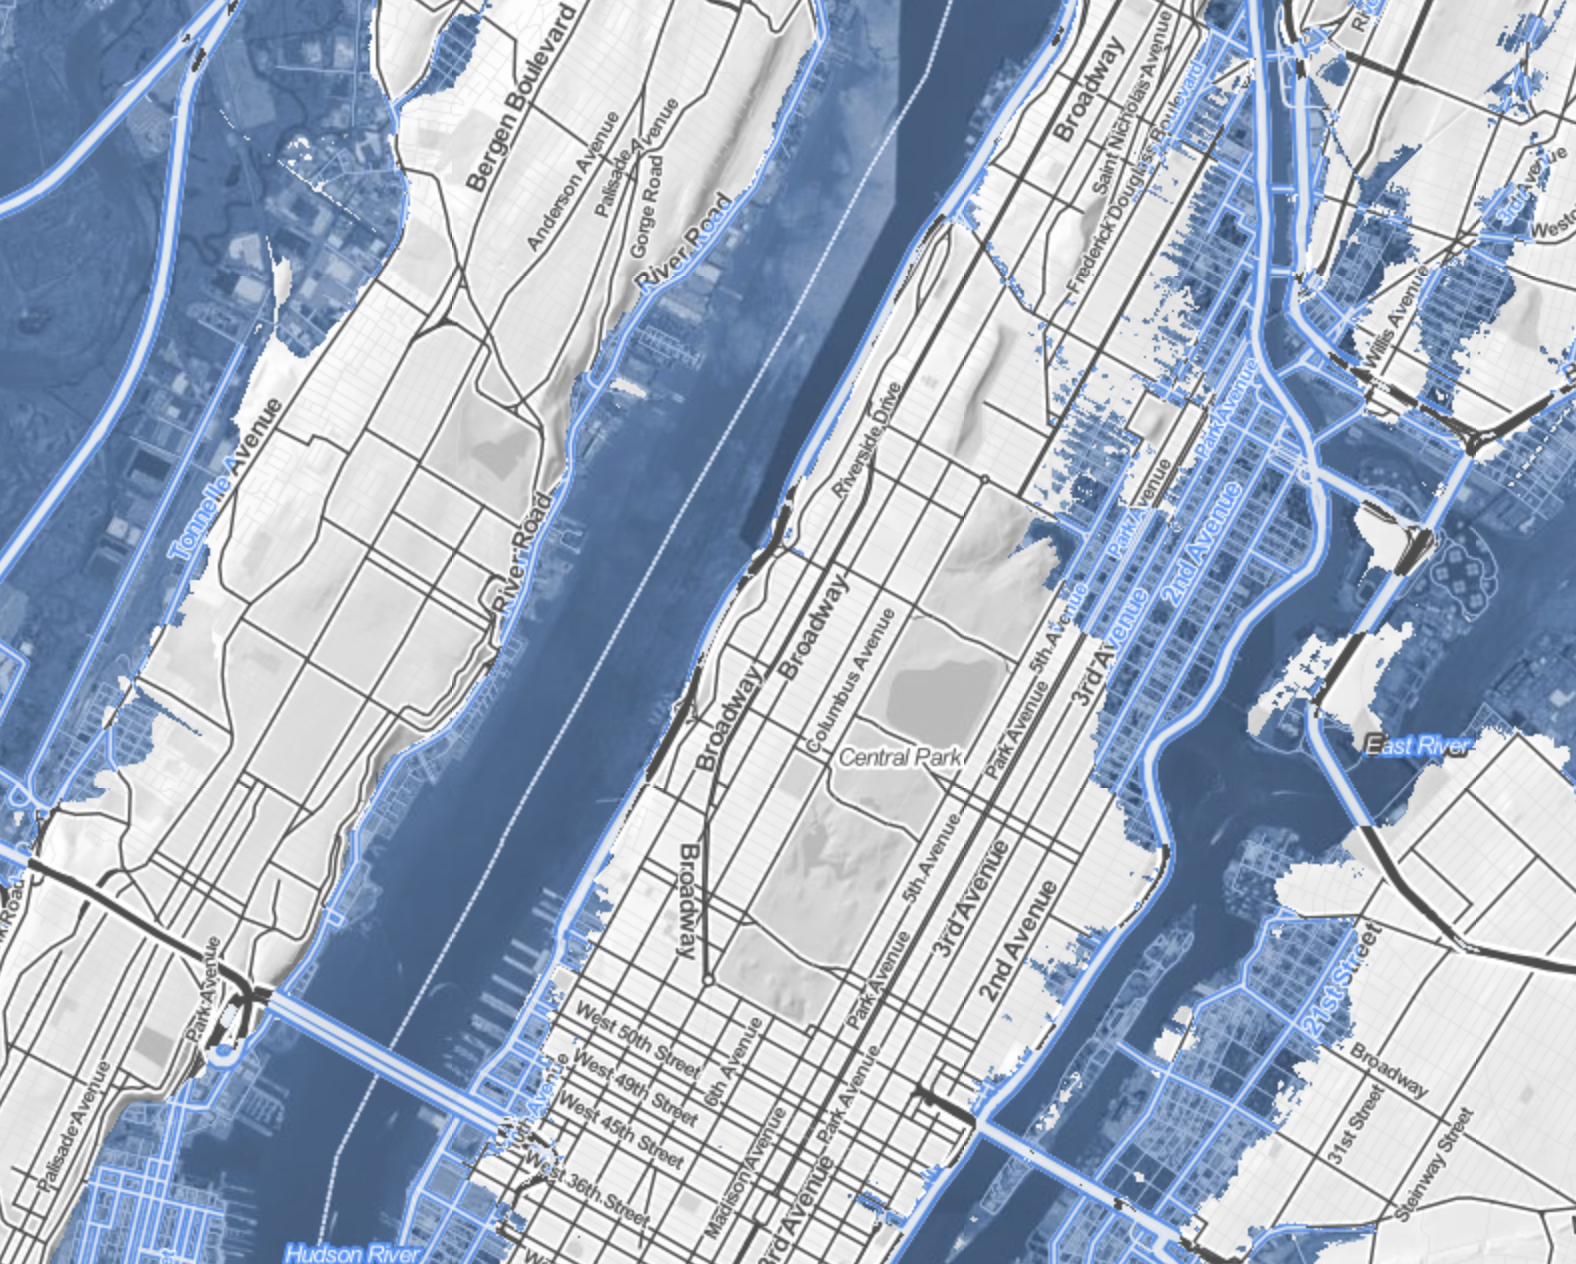
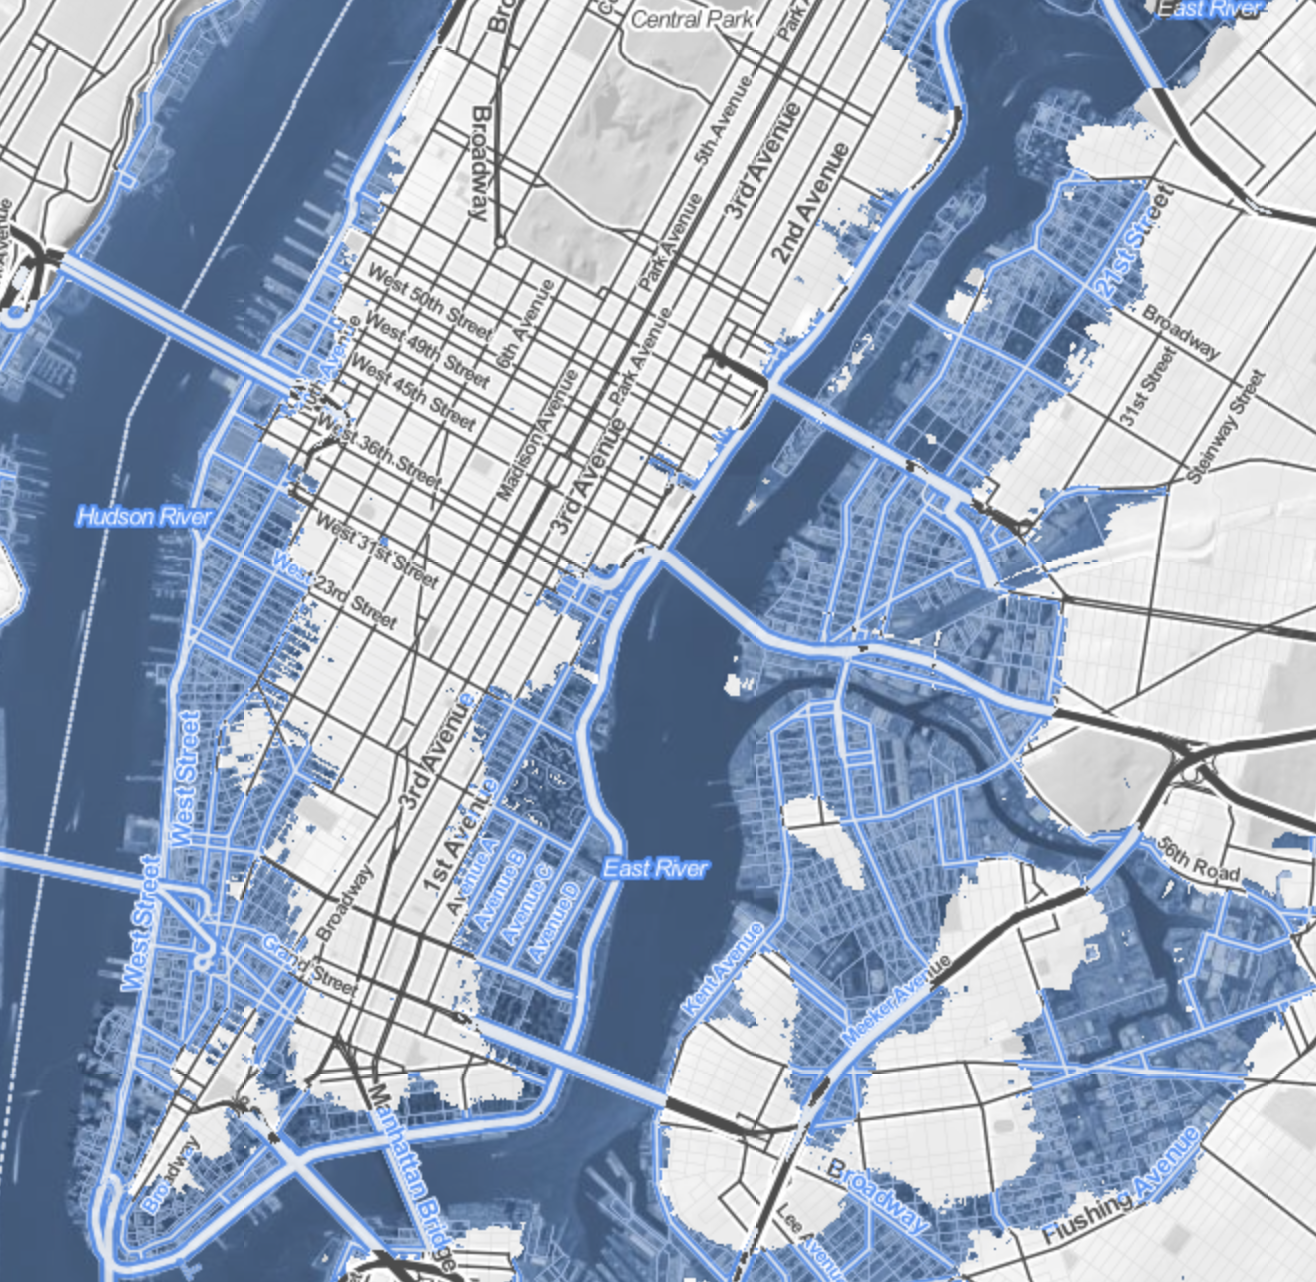
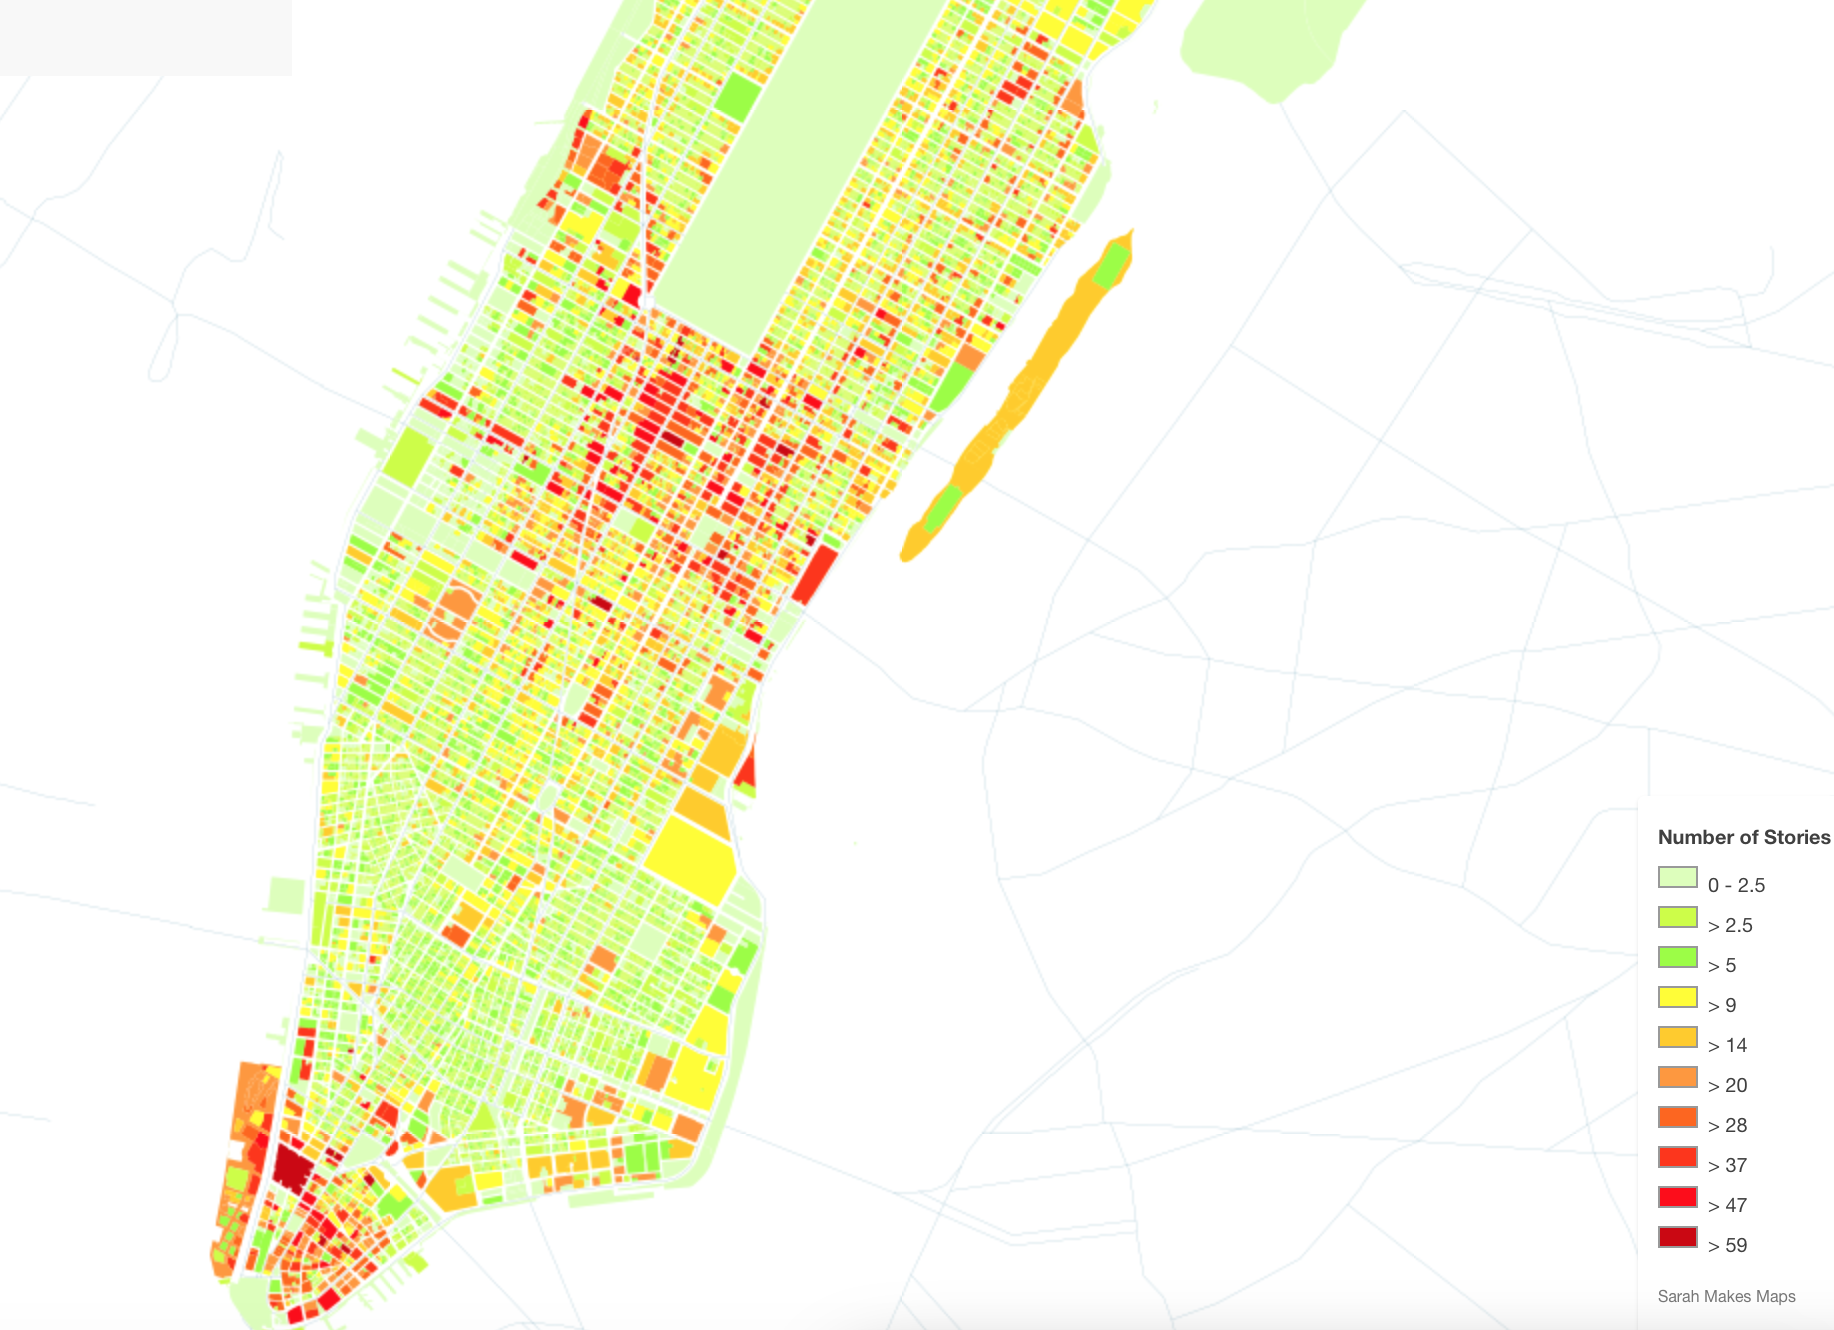
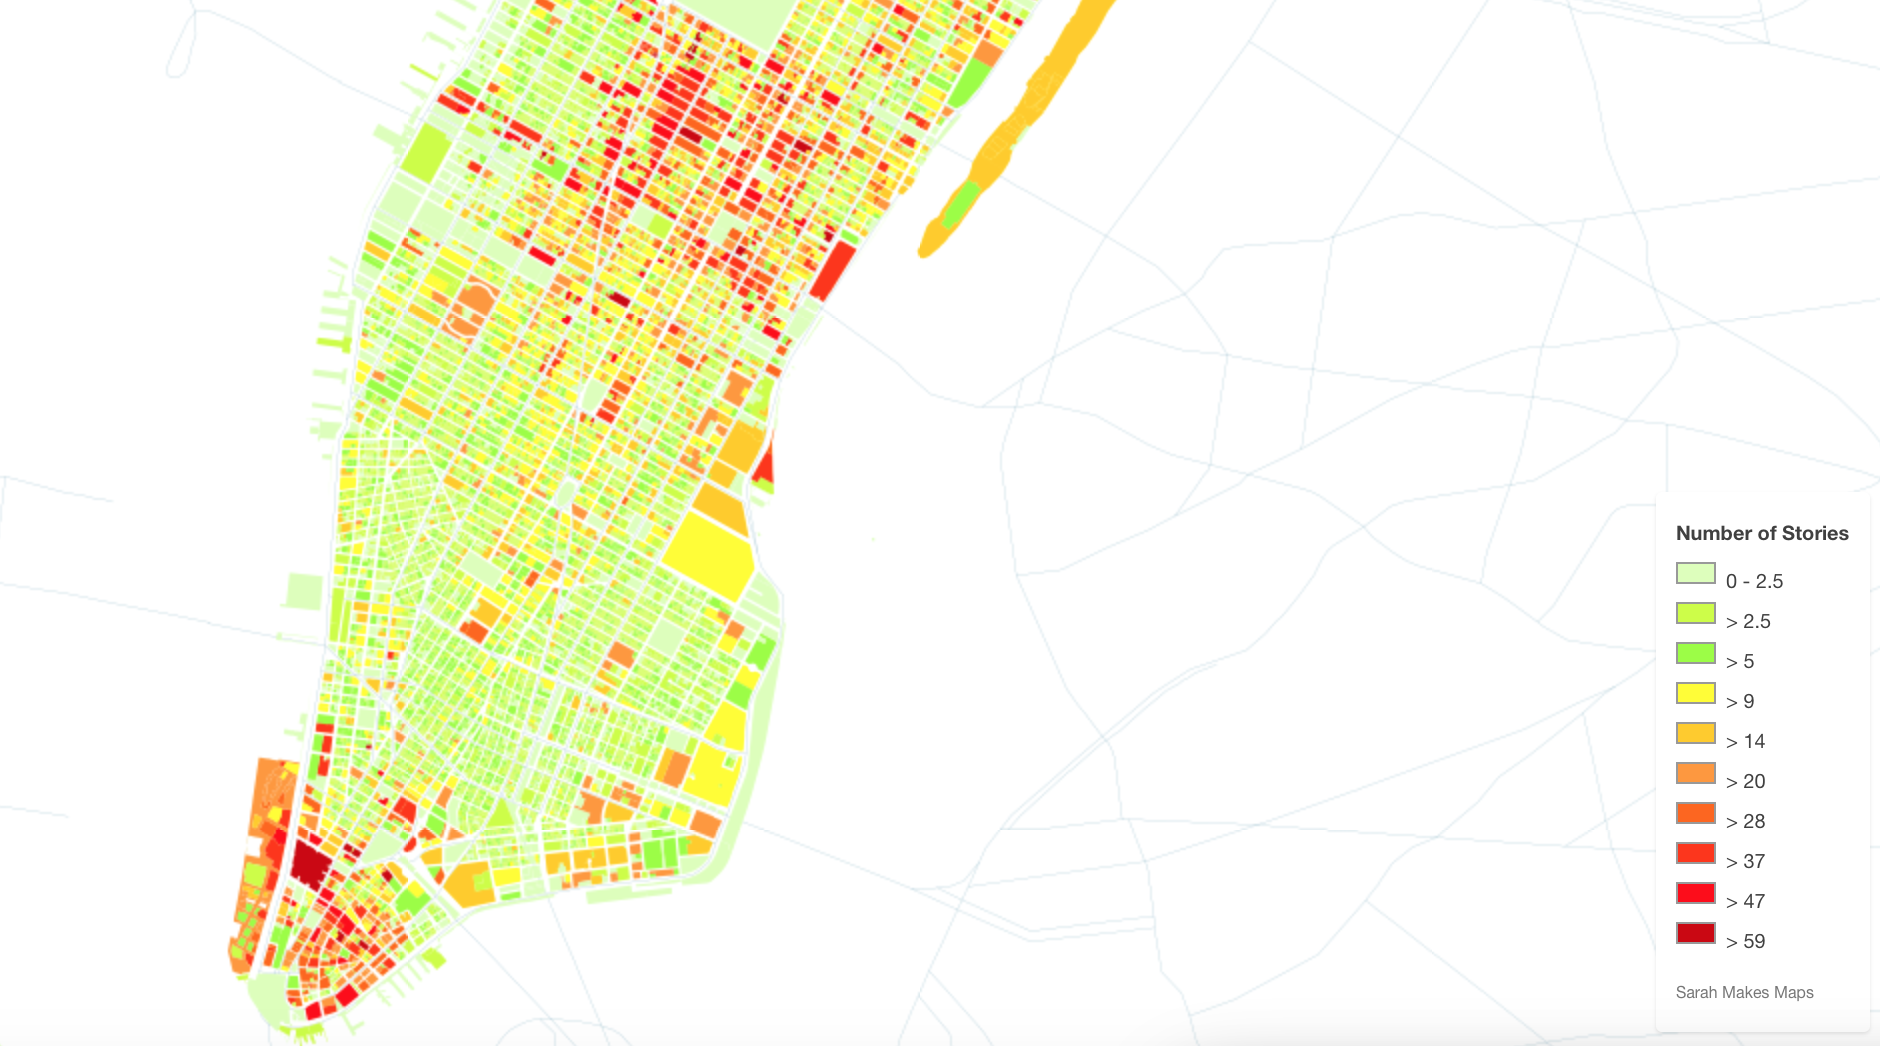
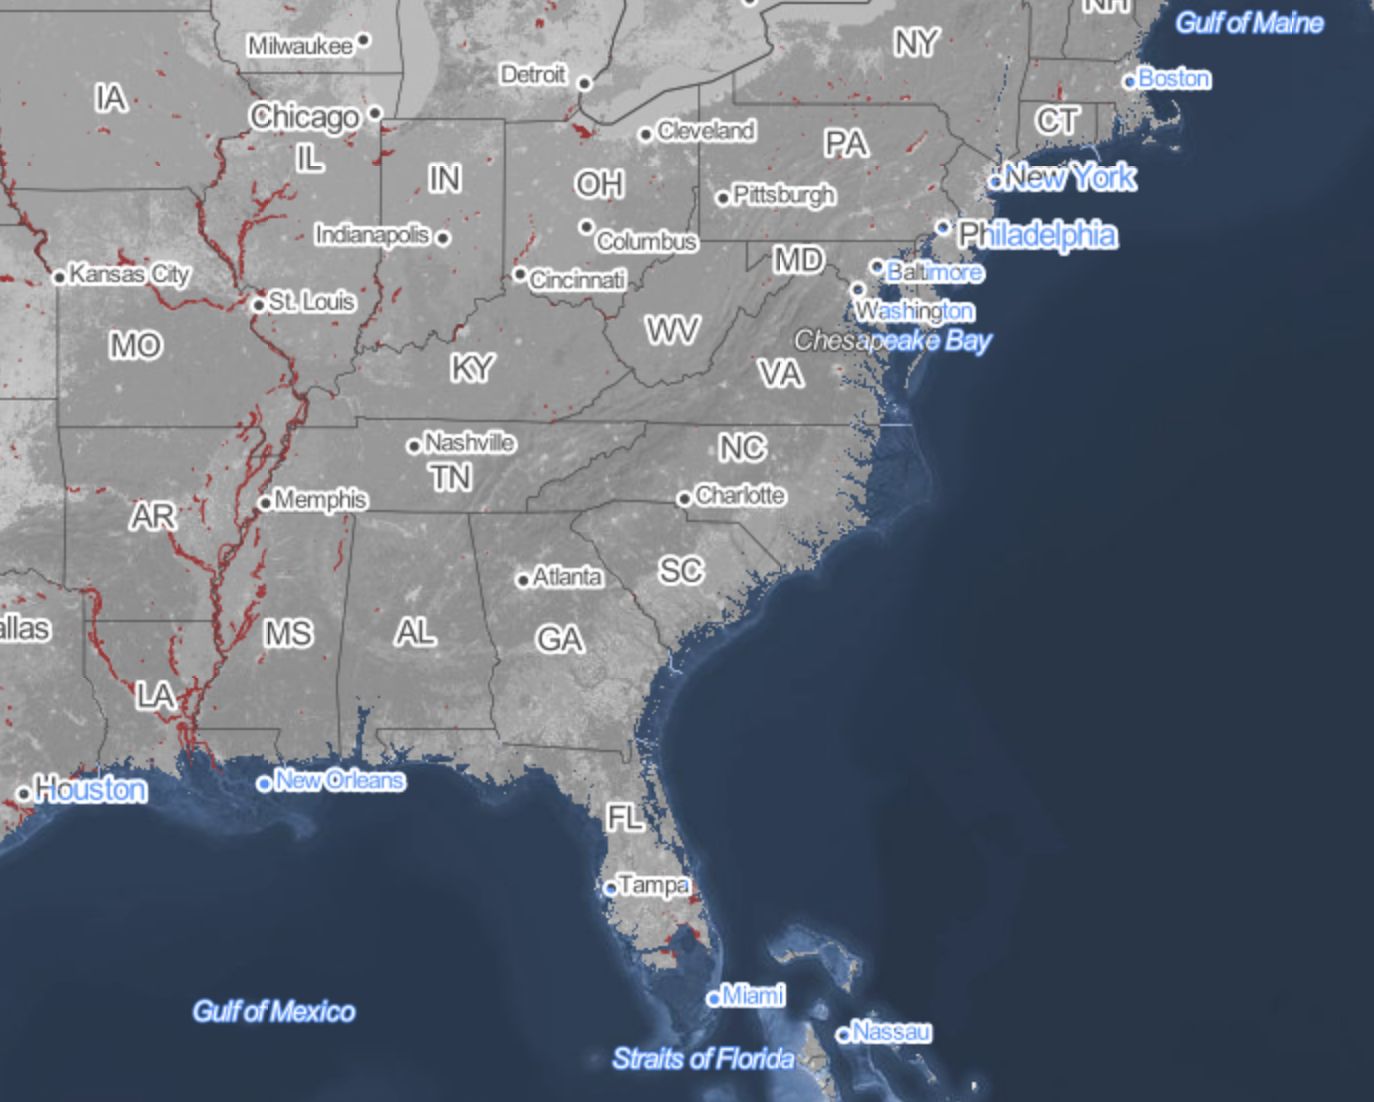 Surging Seas: sea level rise after 2 degrees centigrade warming
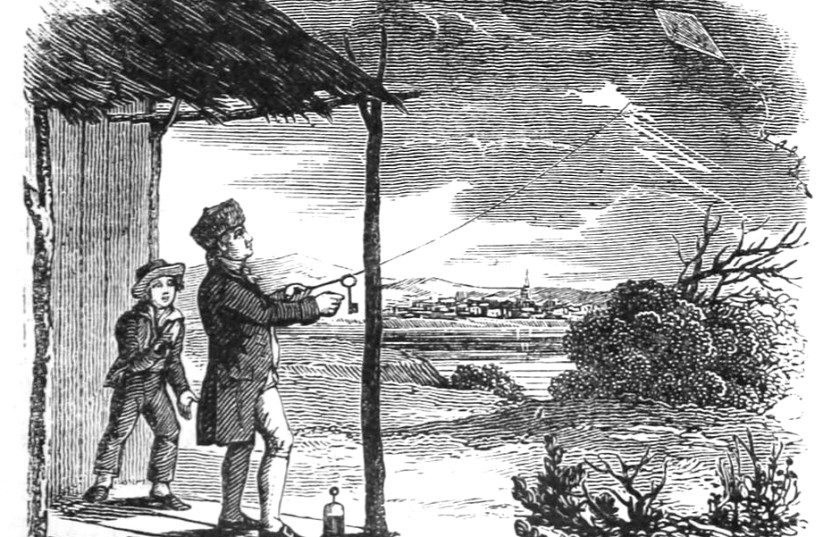

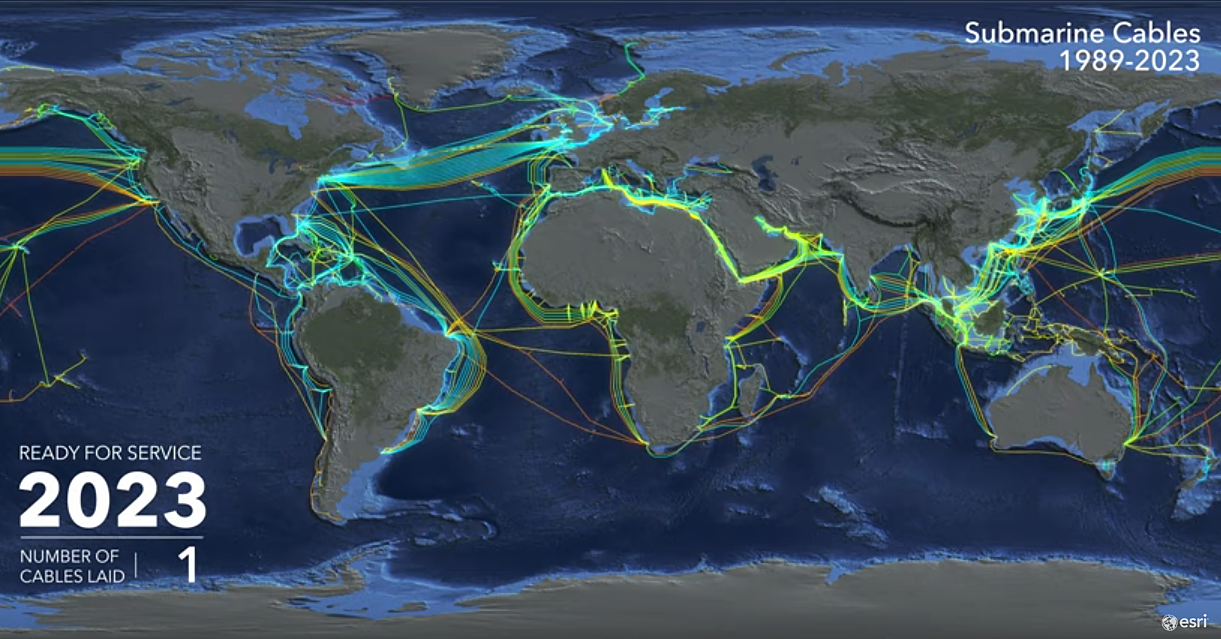


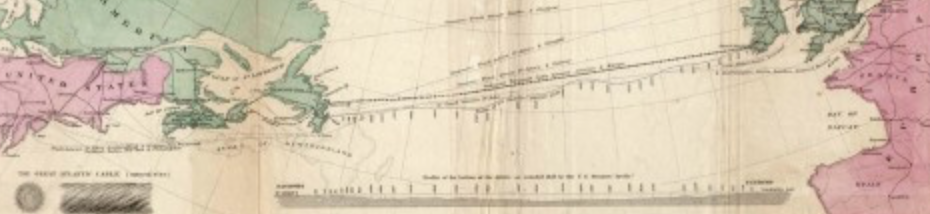
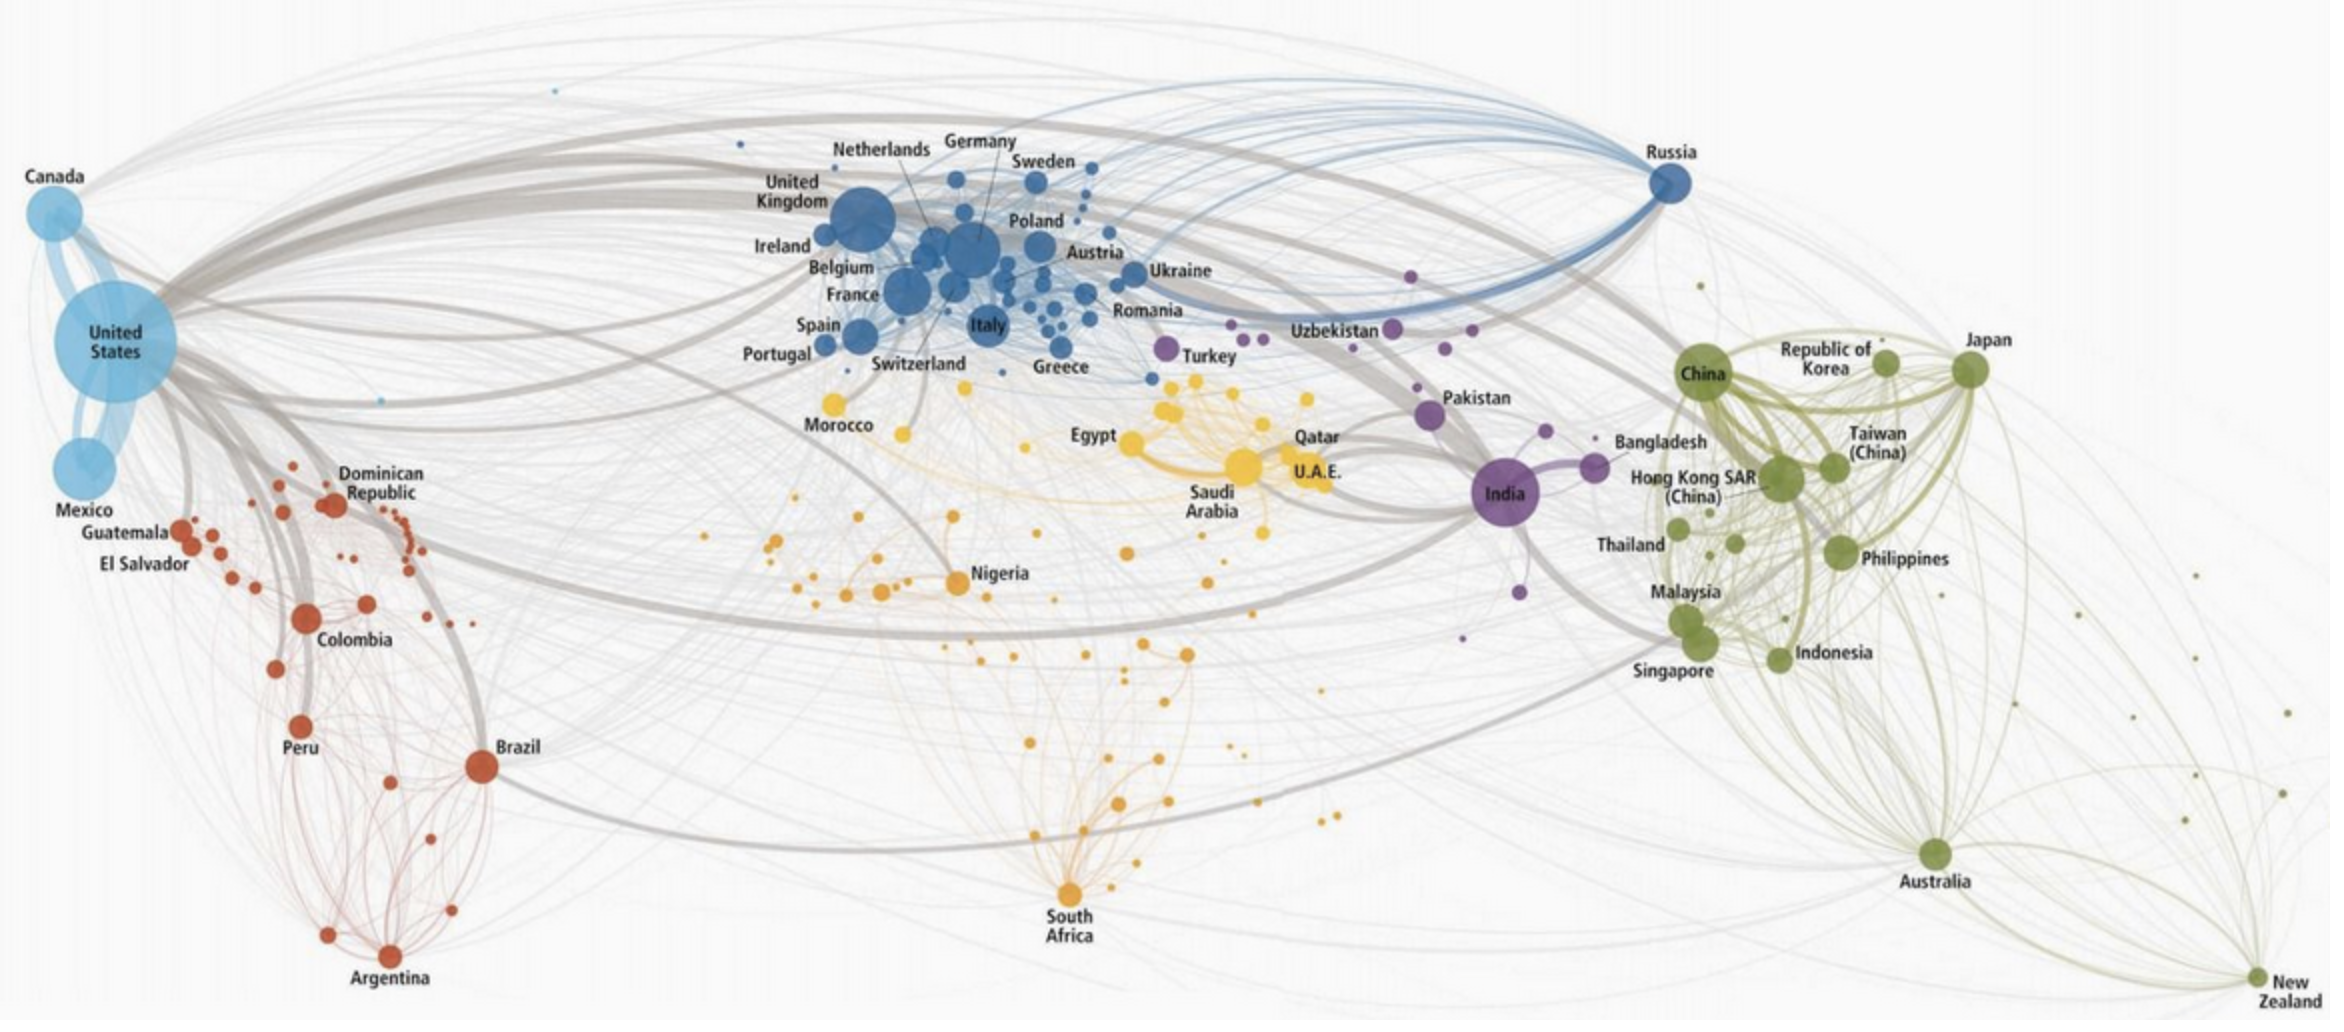
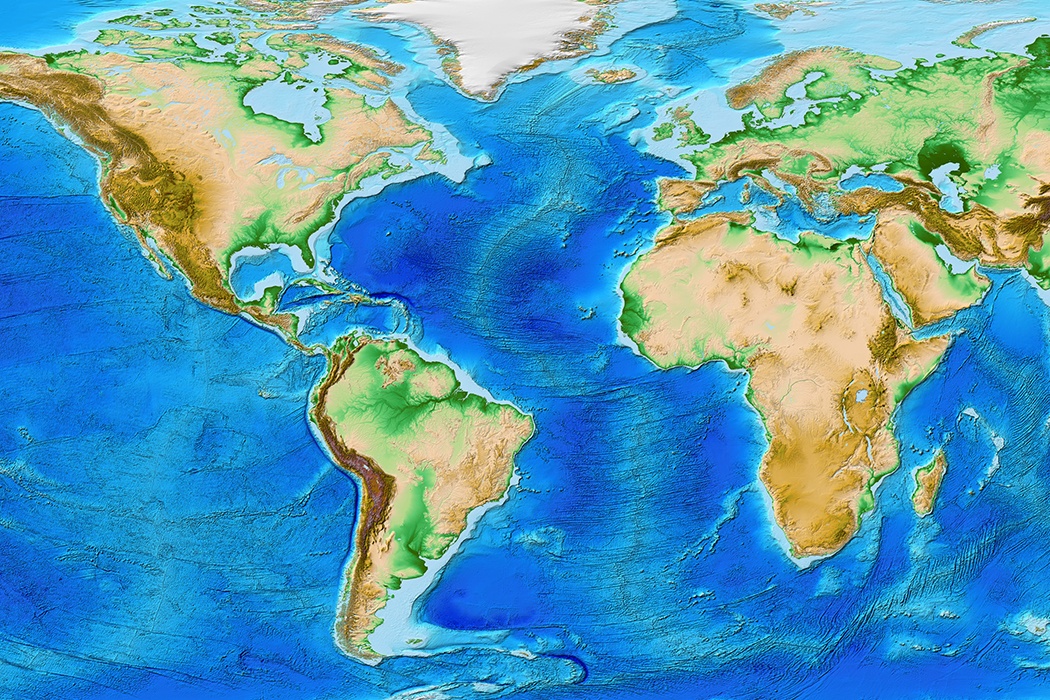
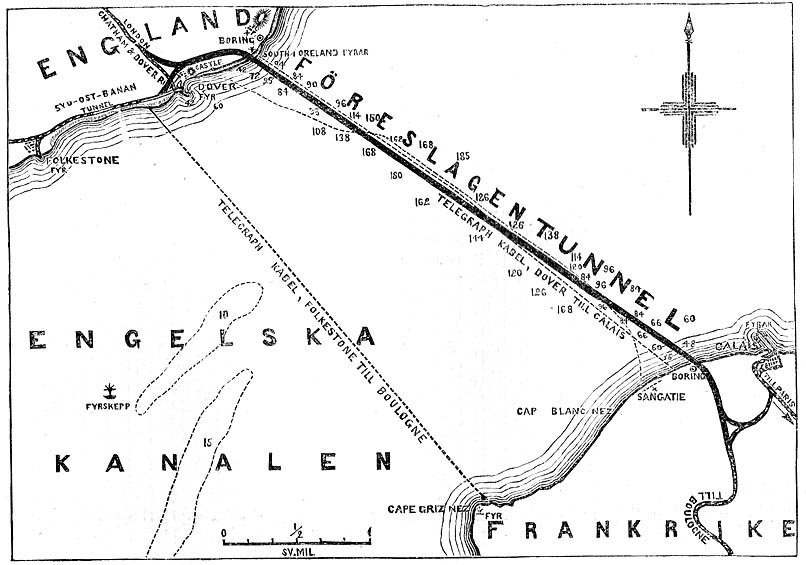
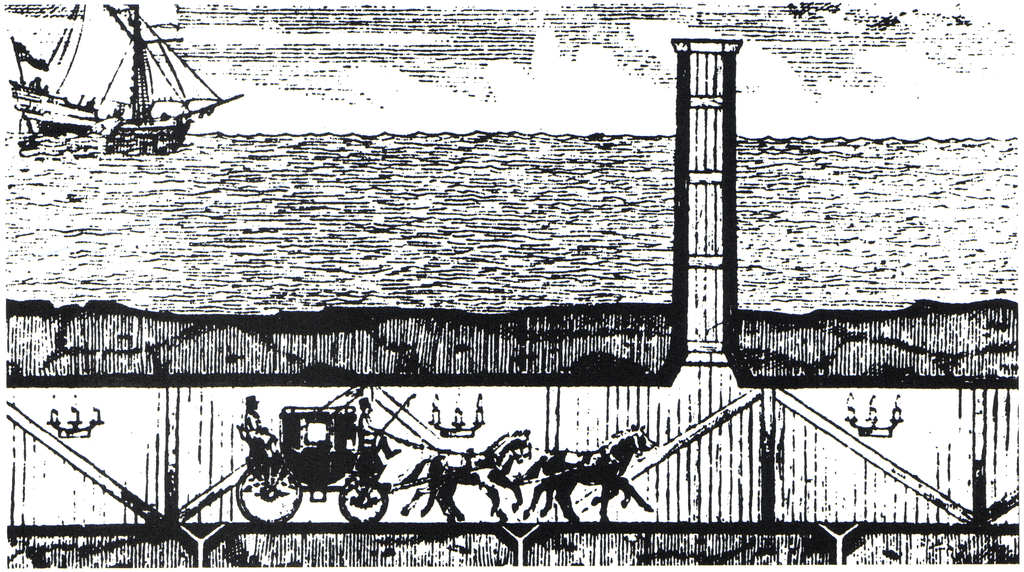
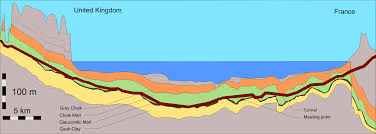
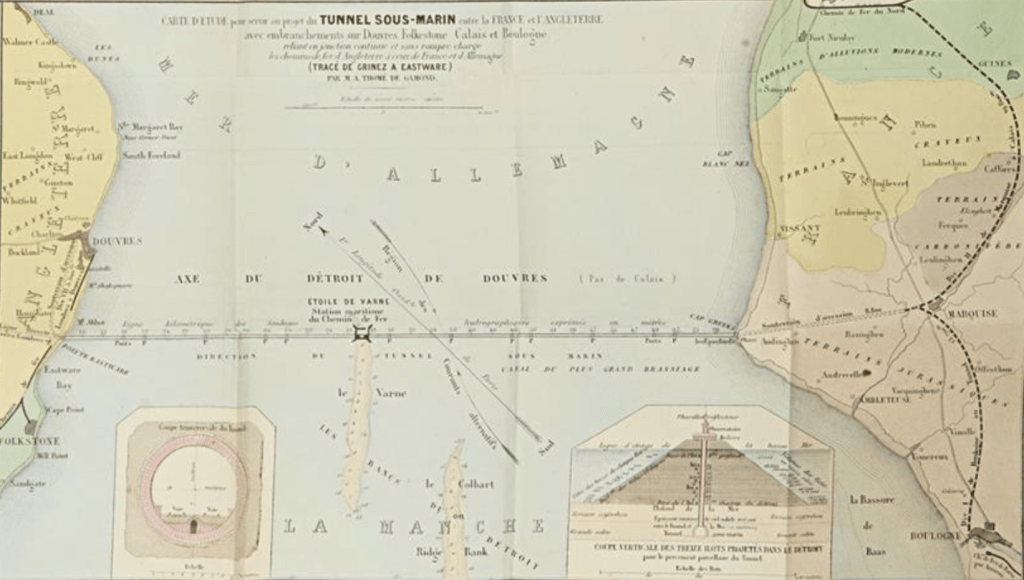
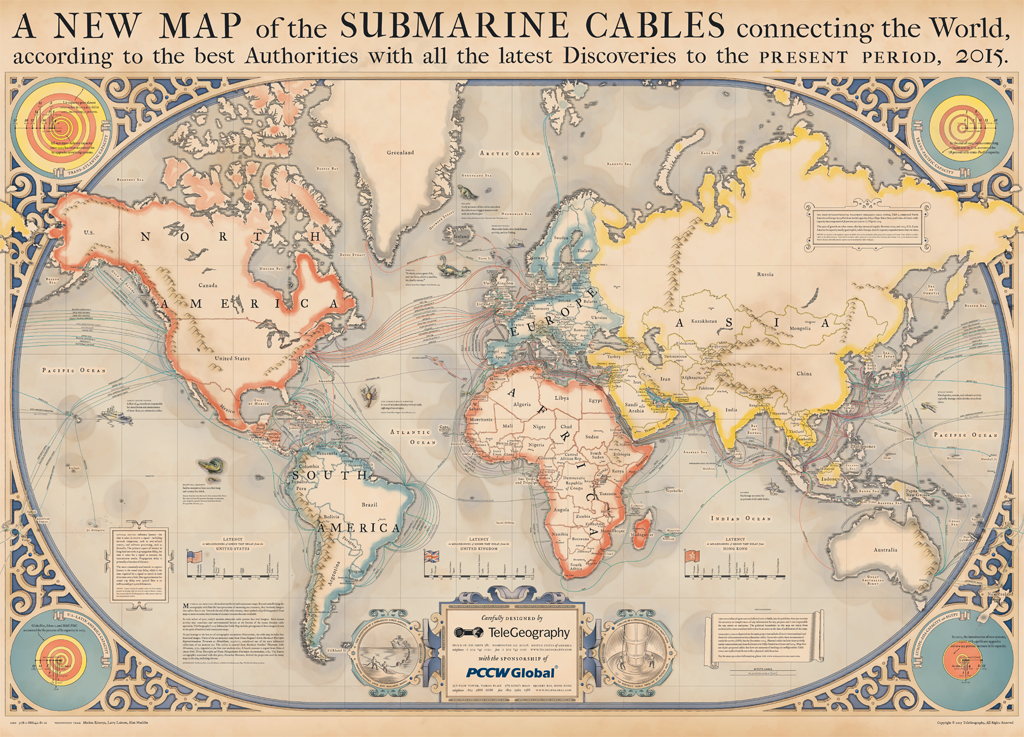

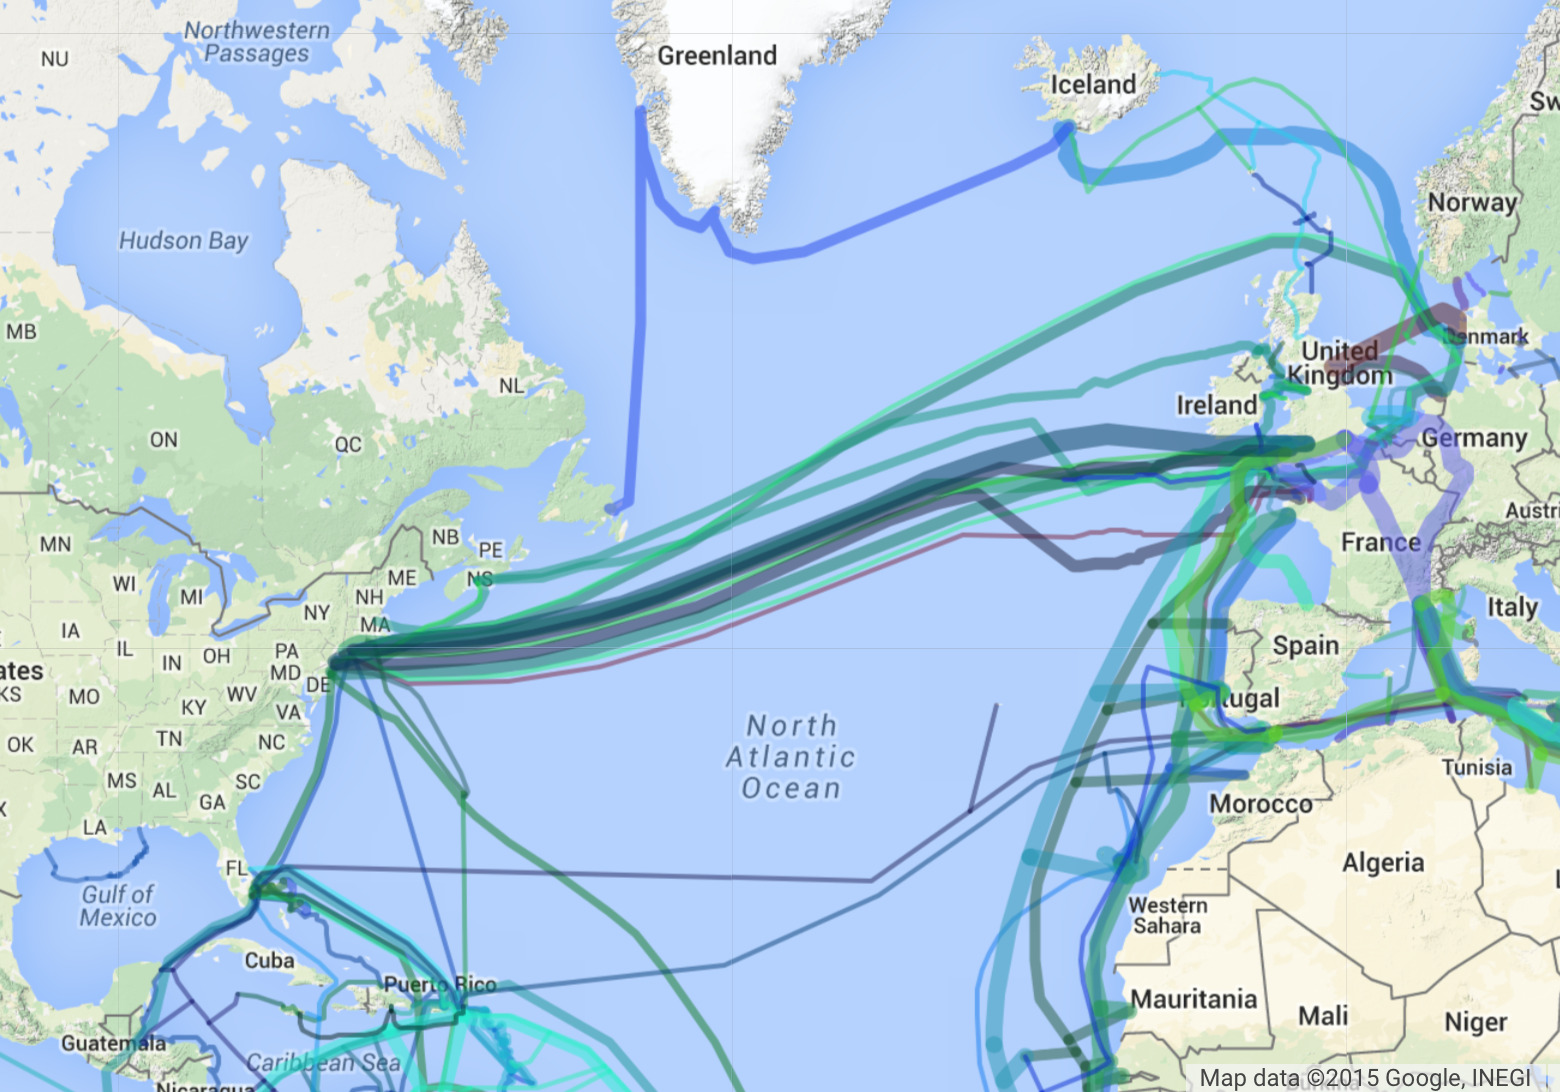

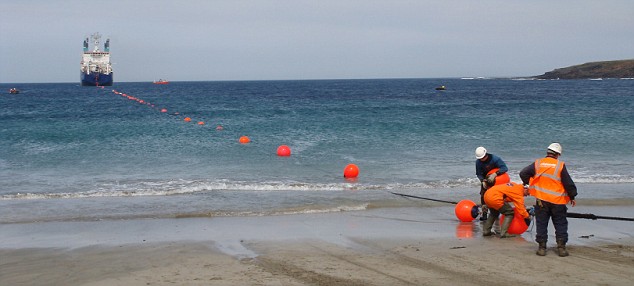
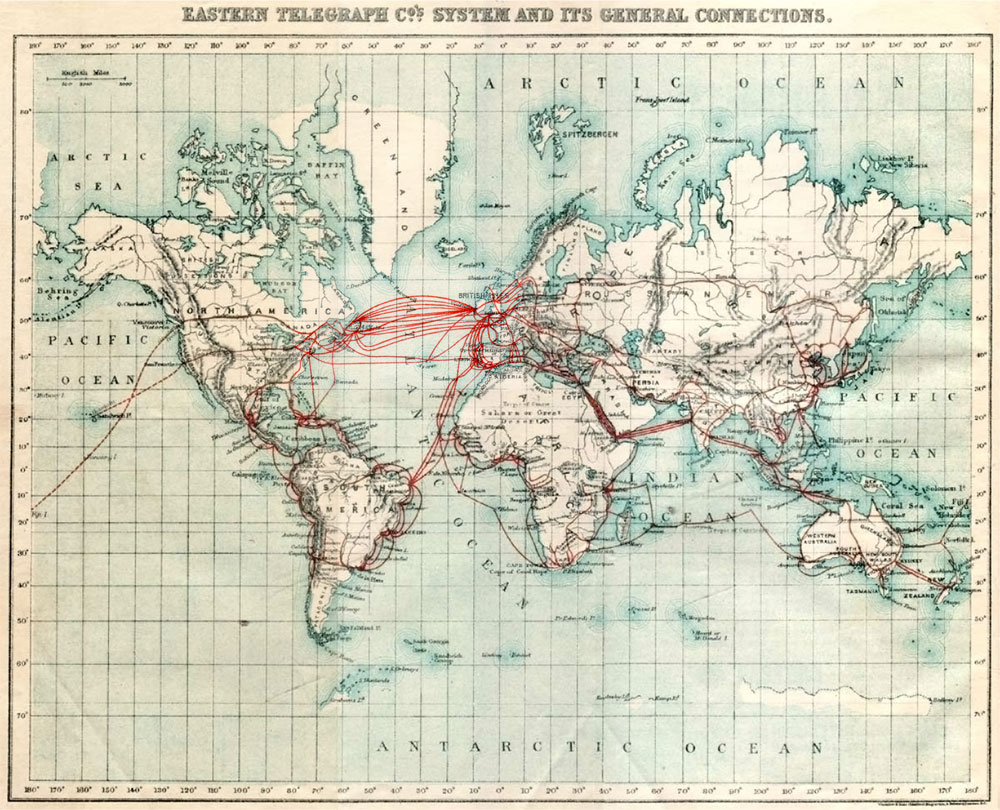
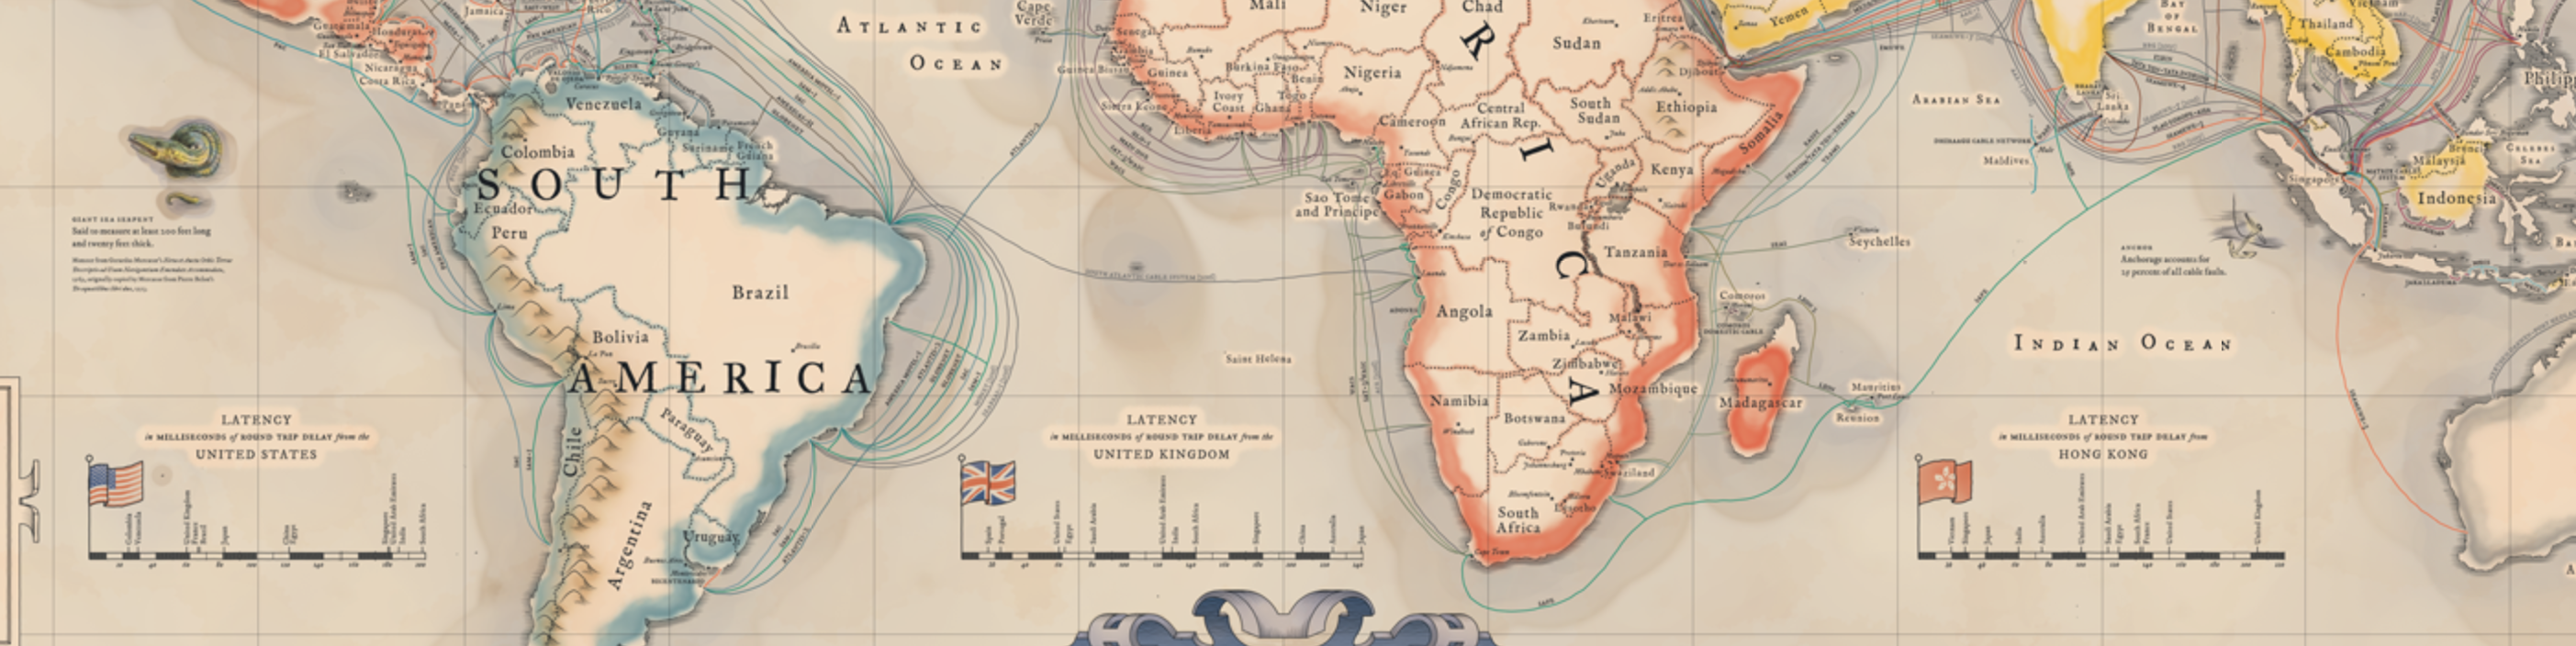
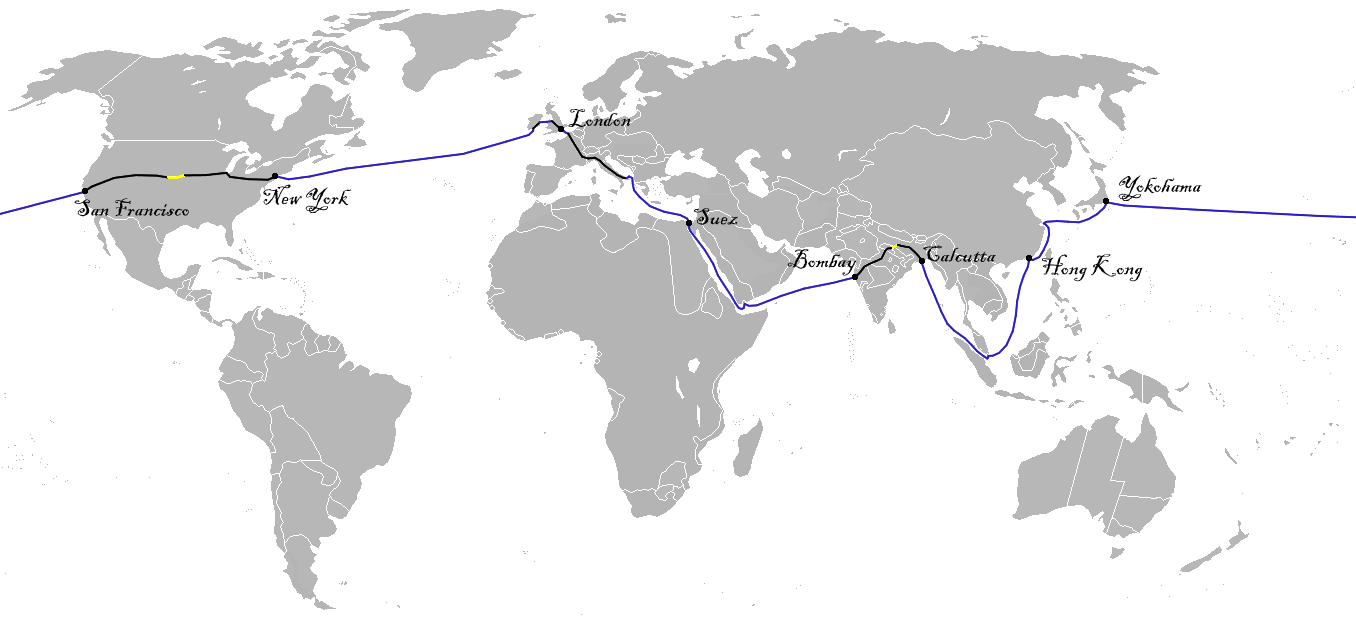
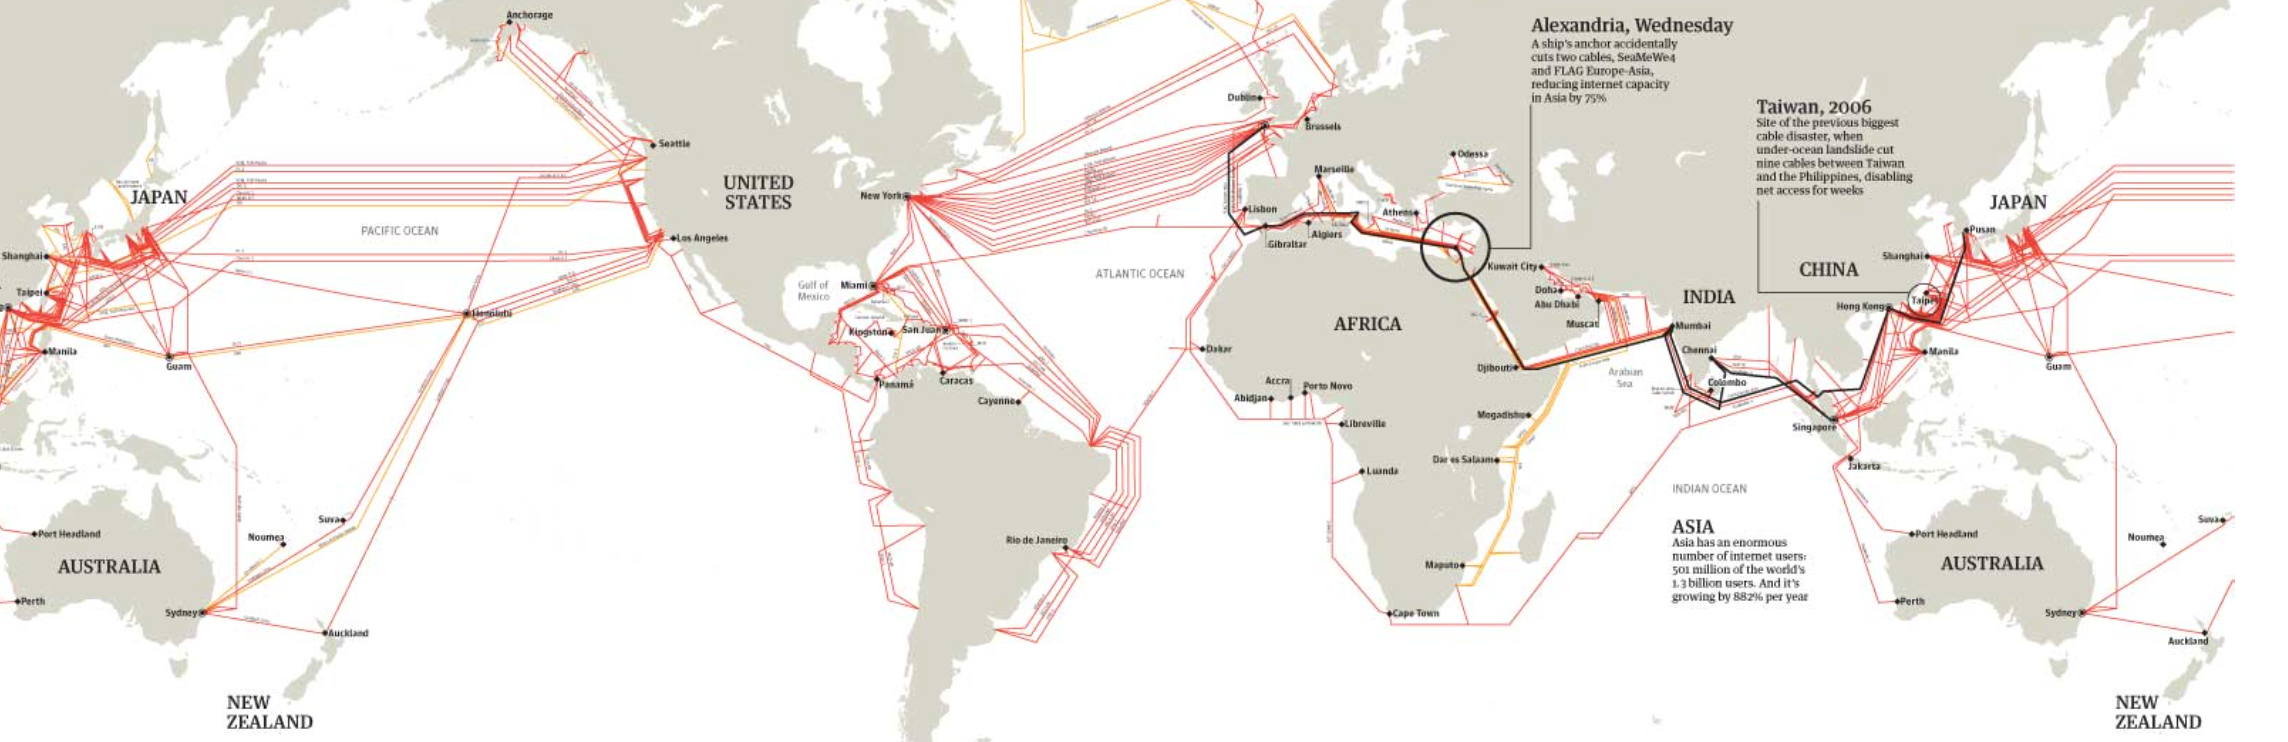
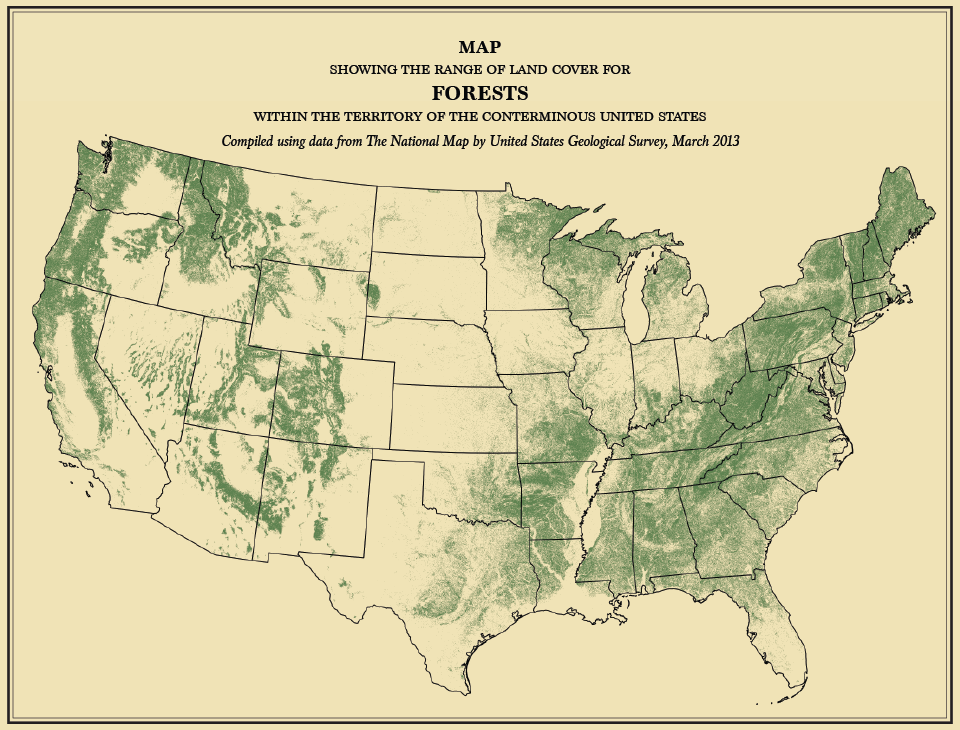


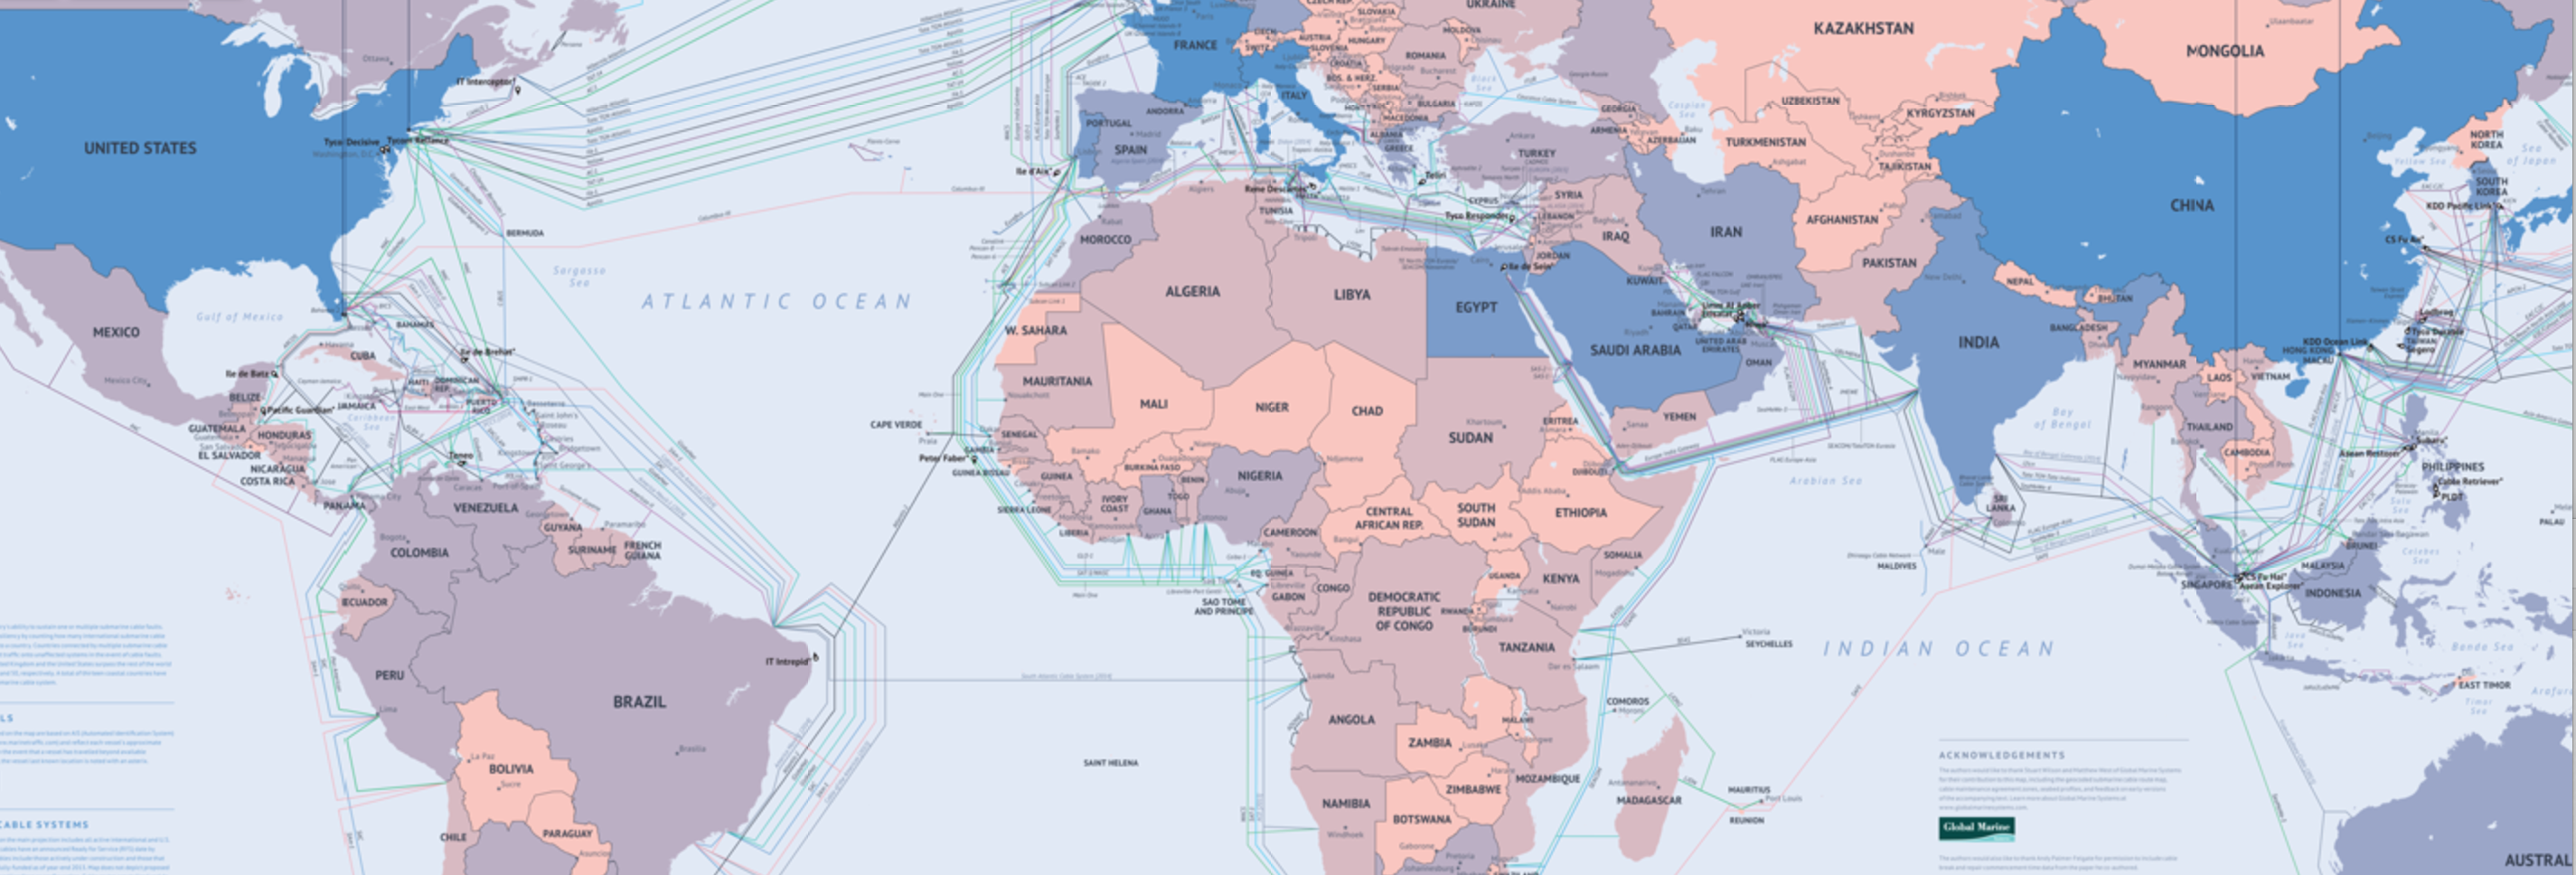
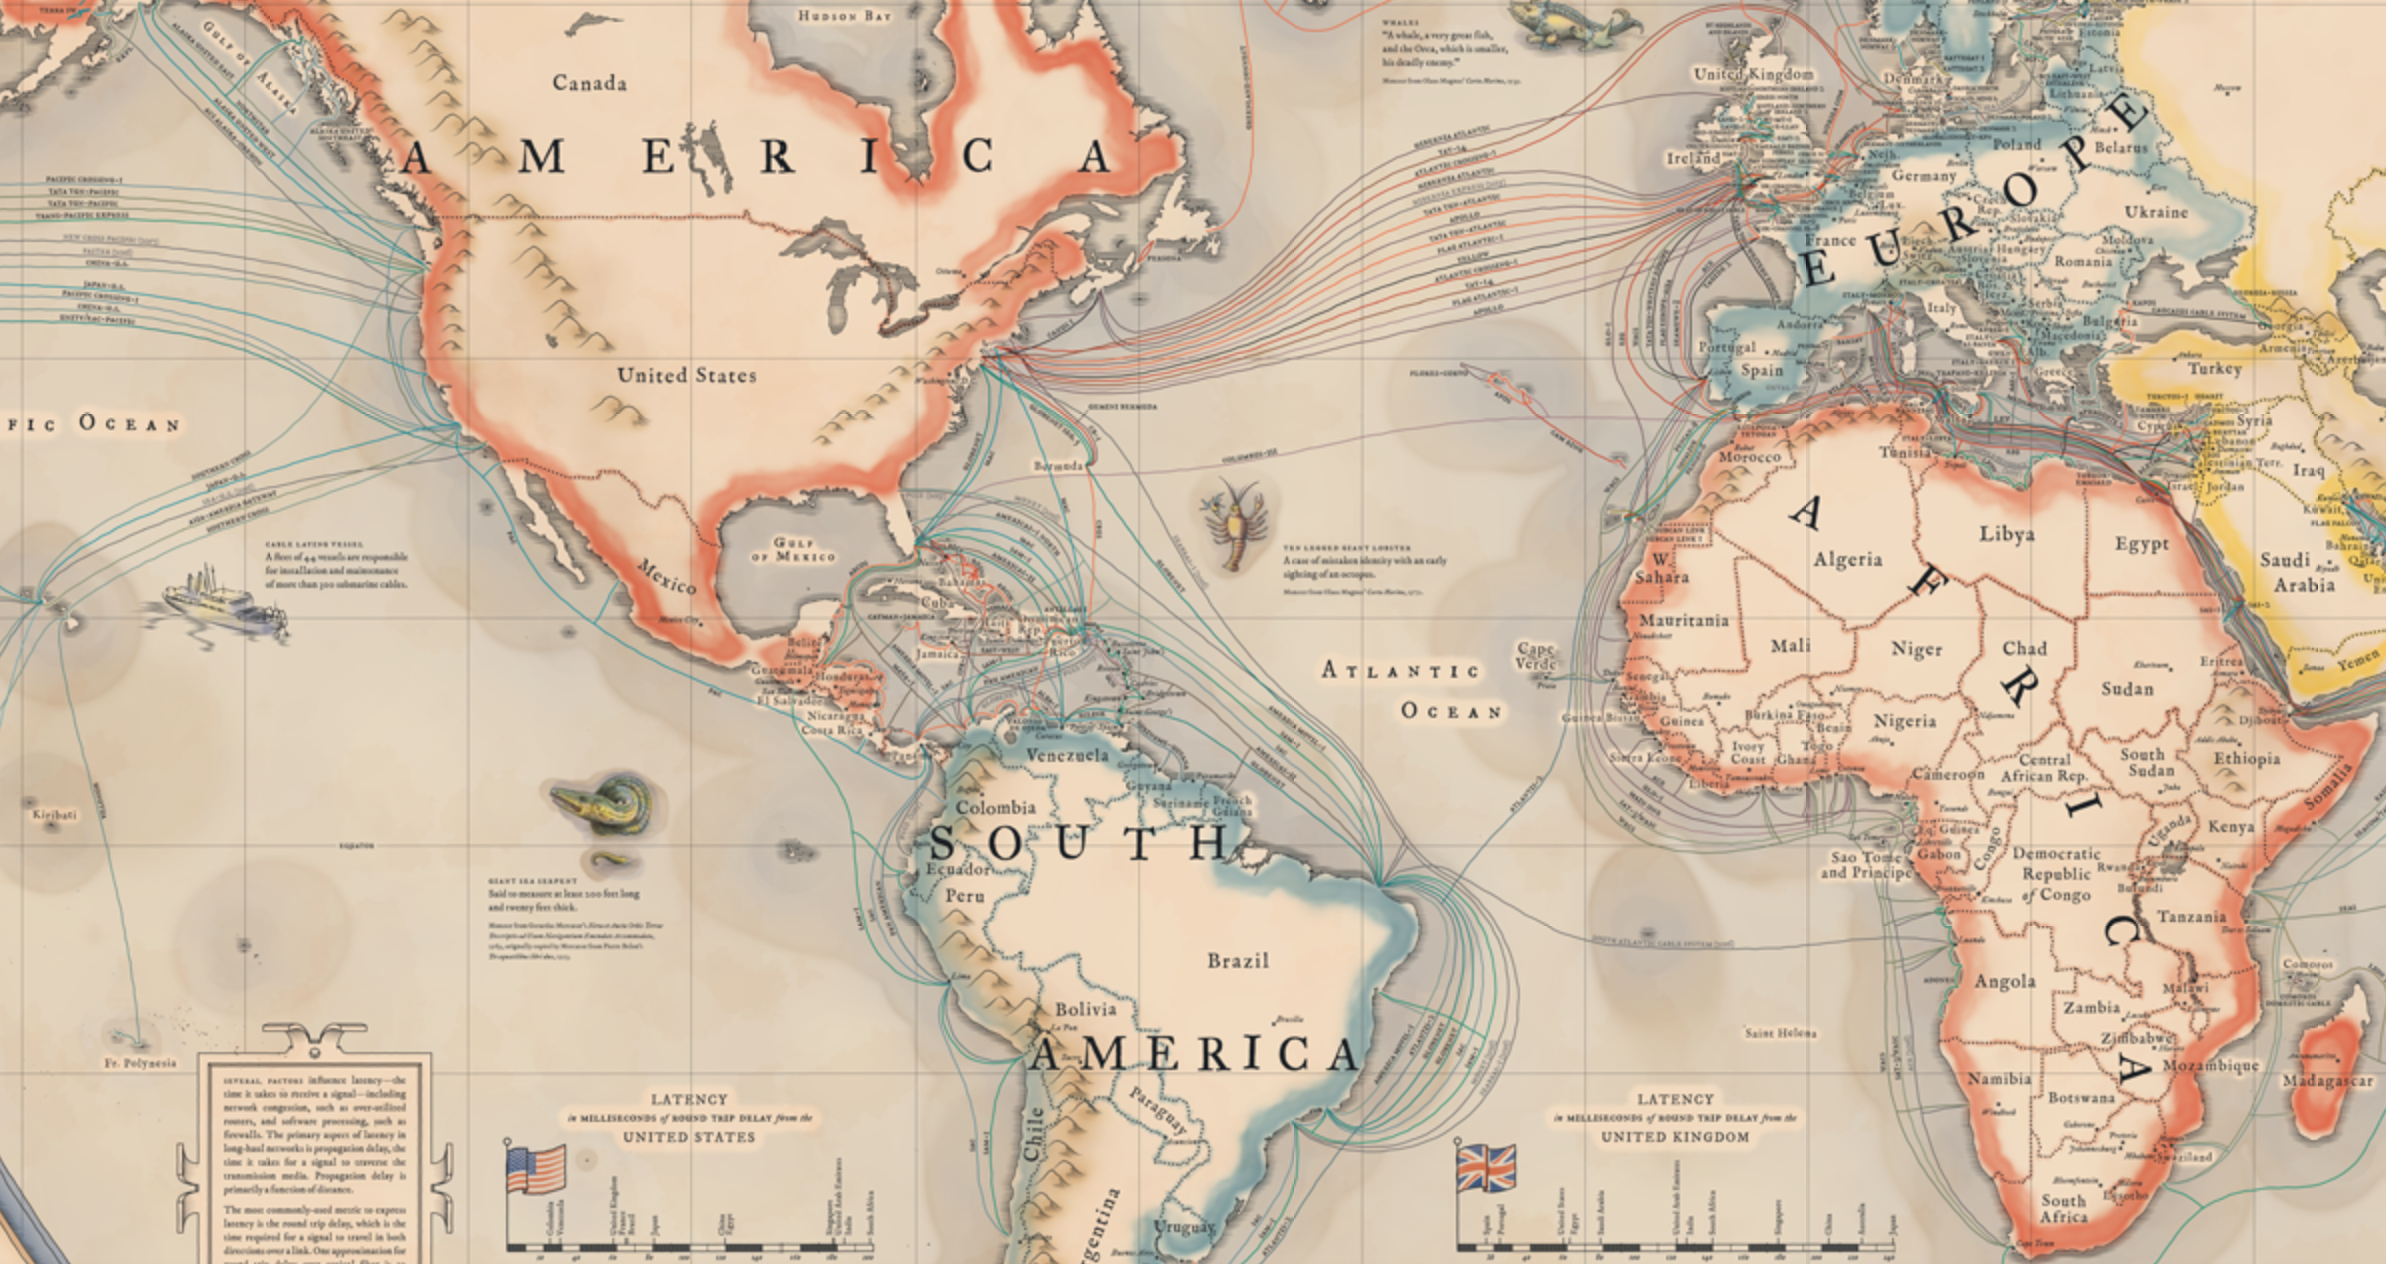
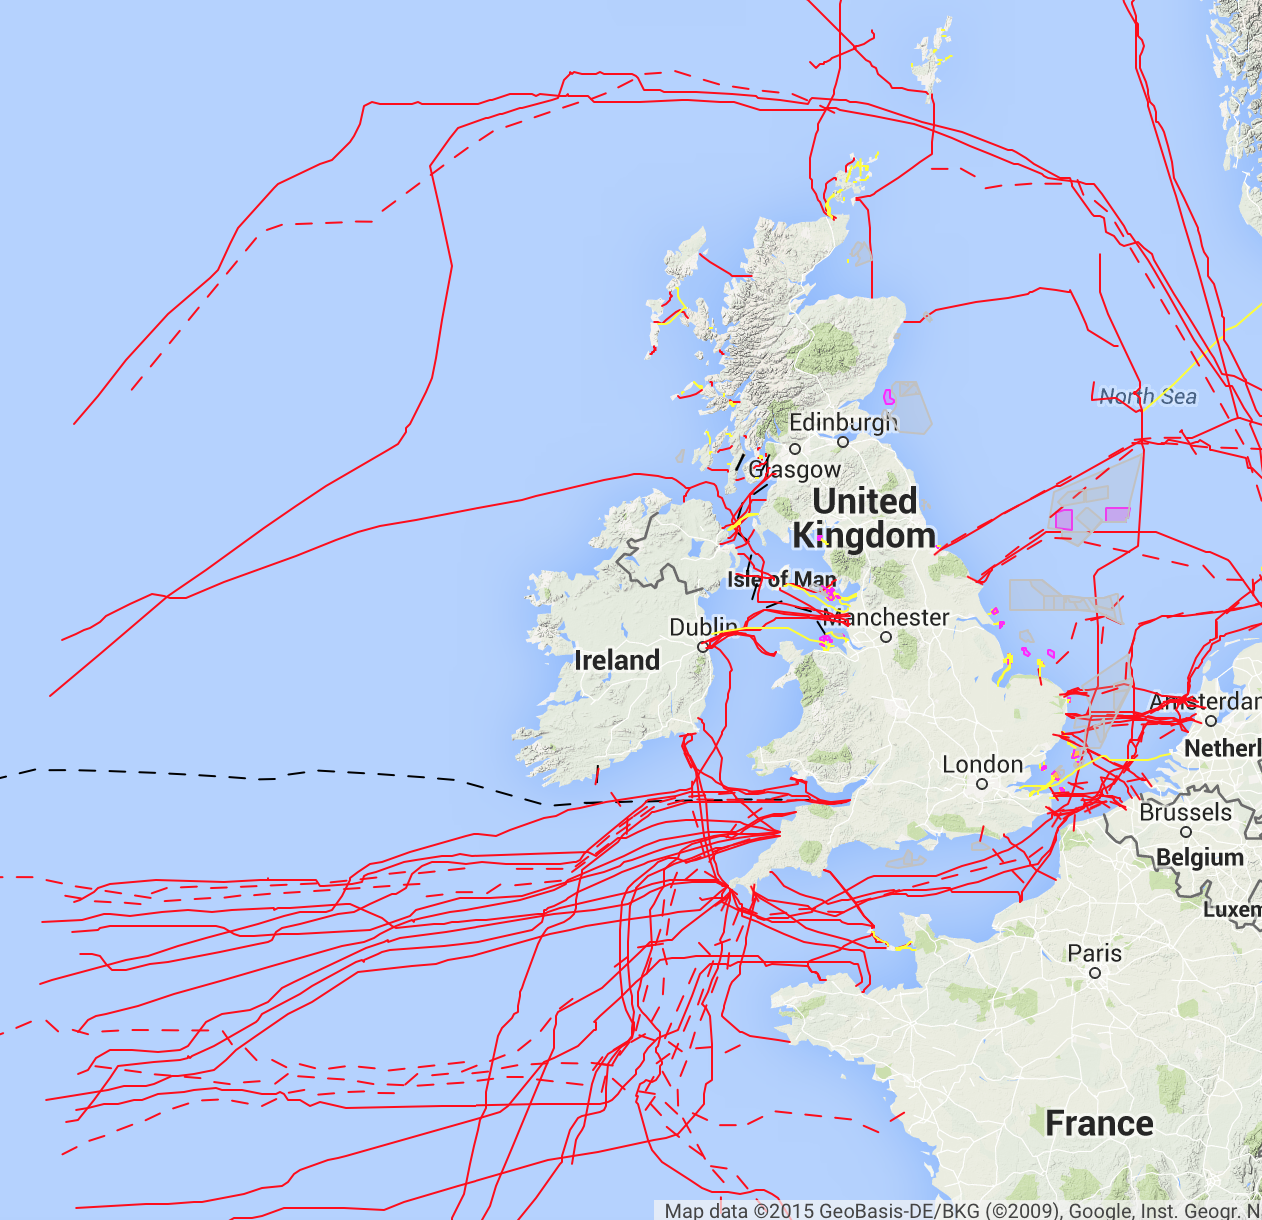
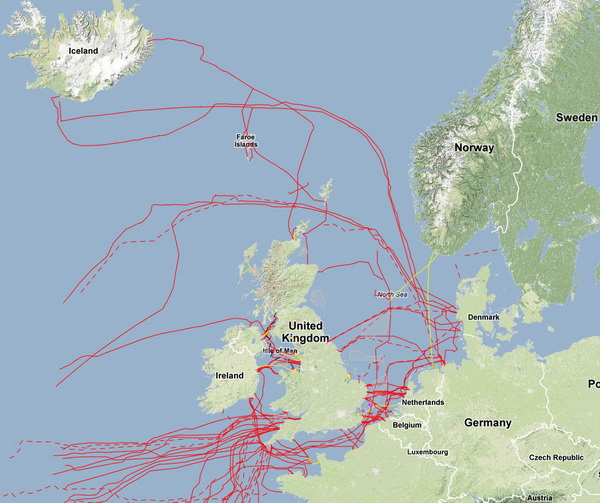

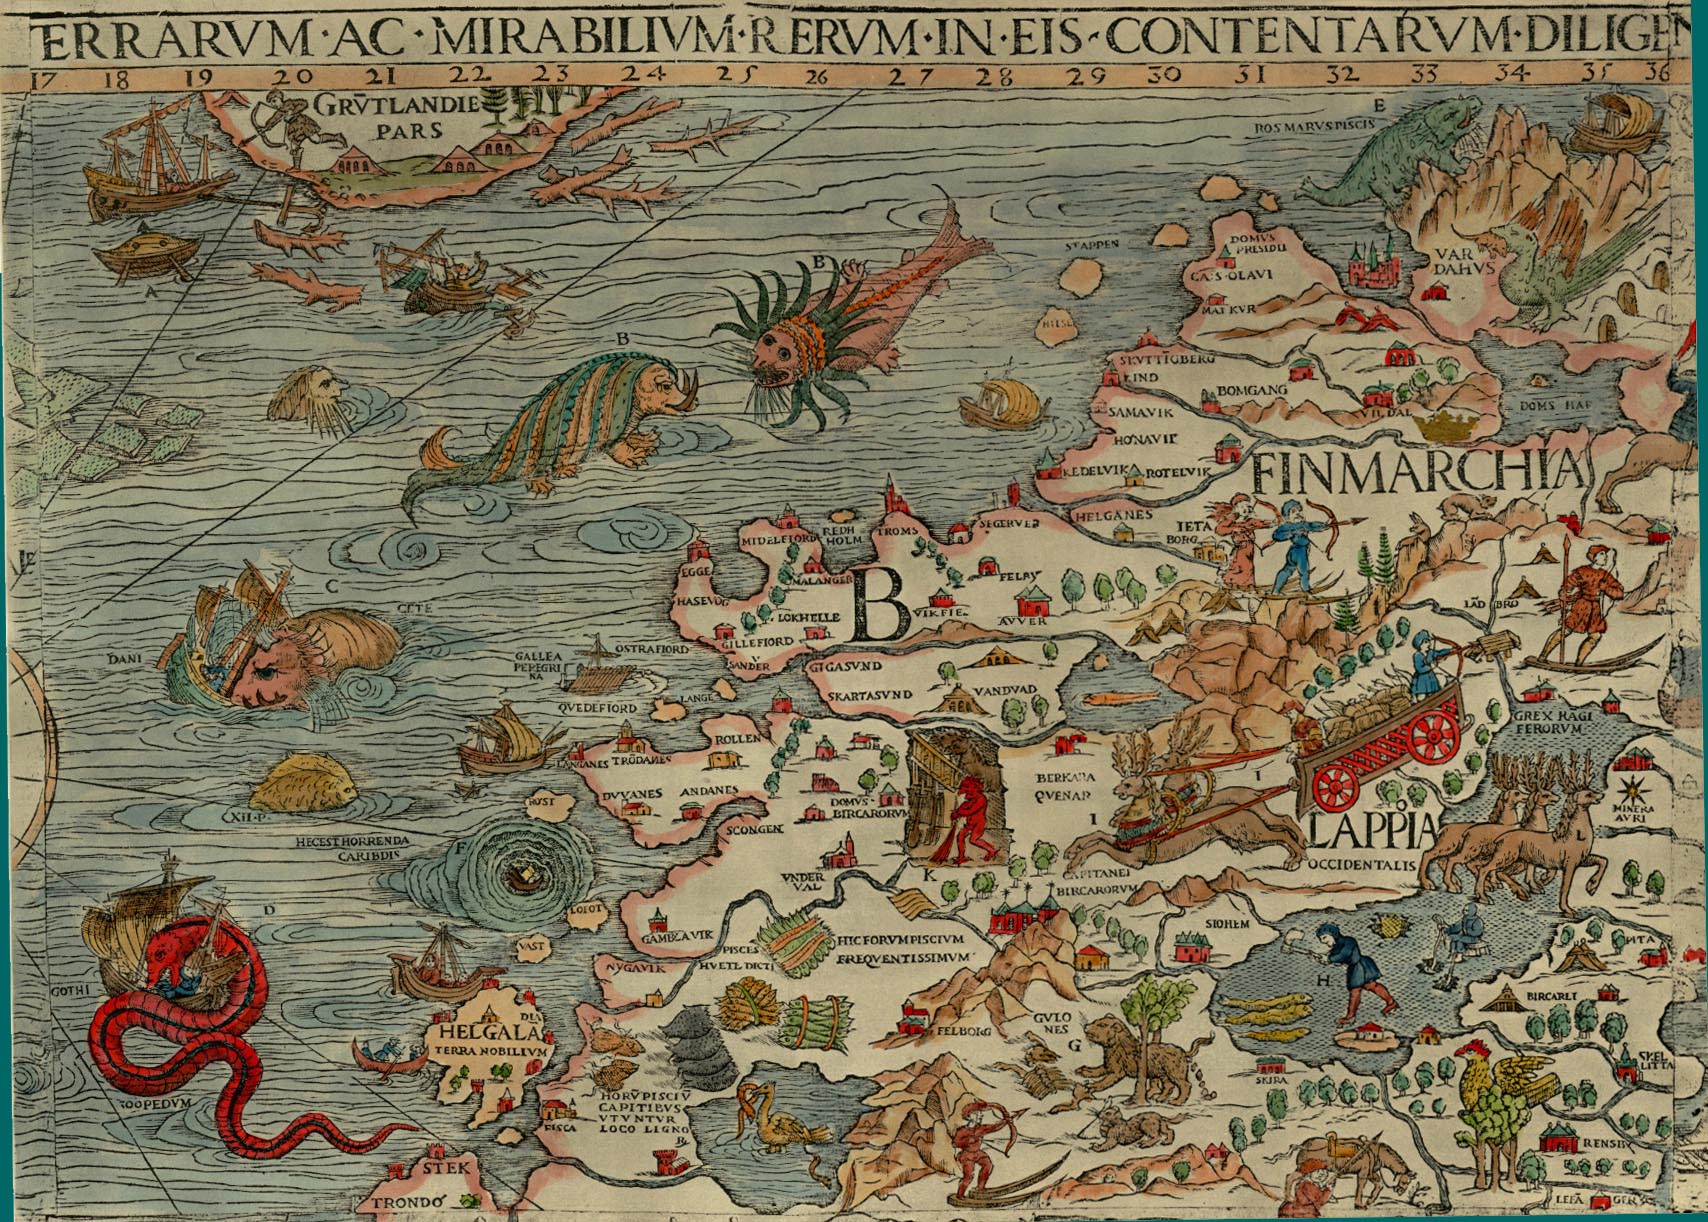


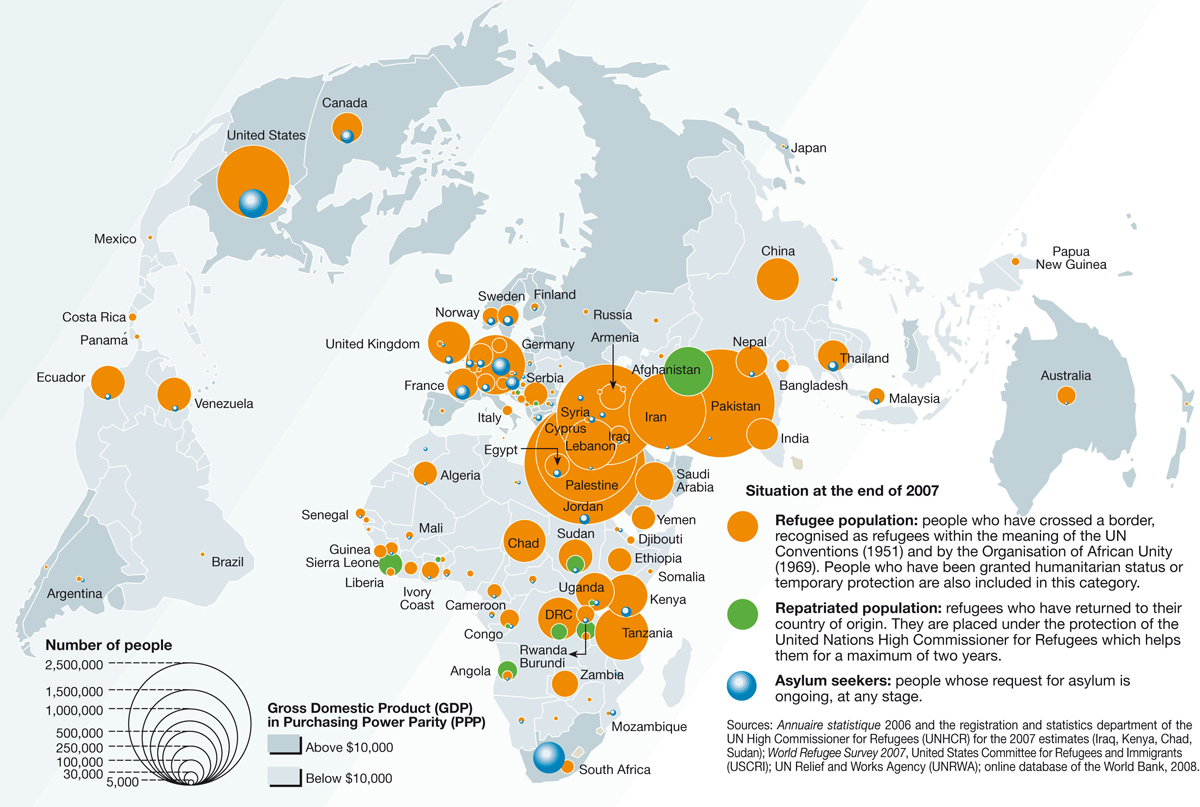
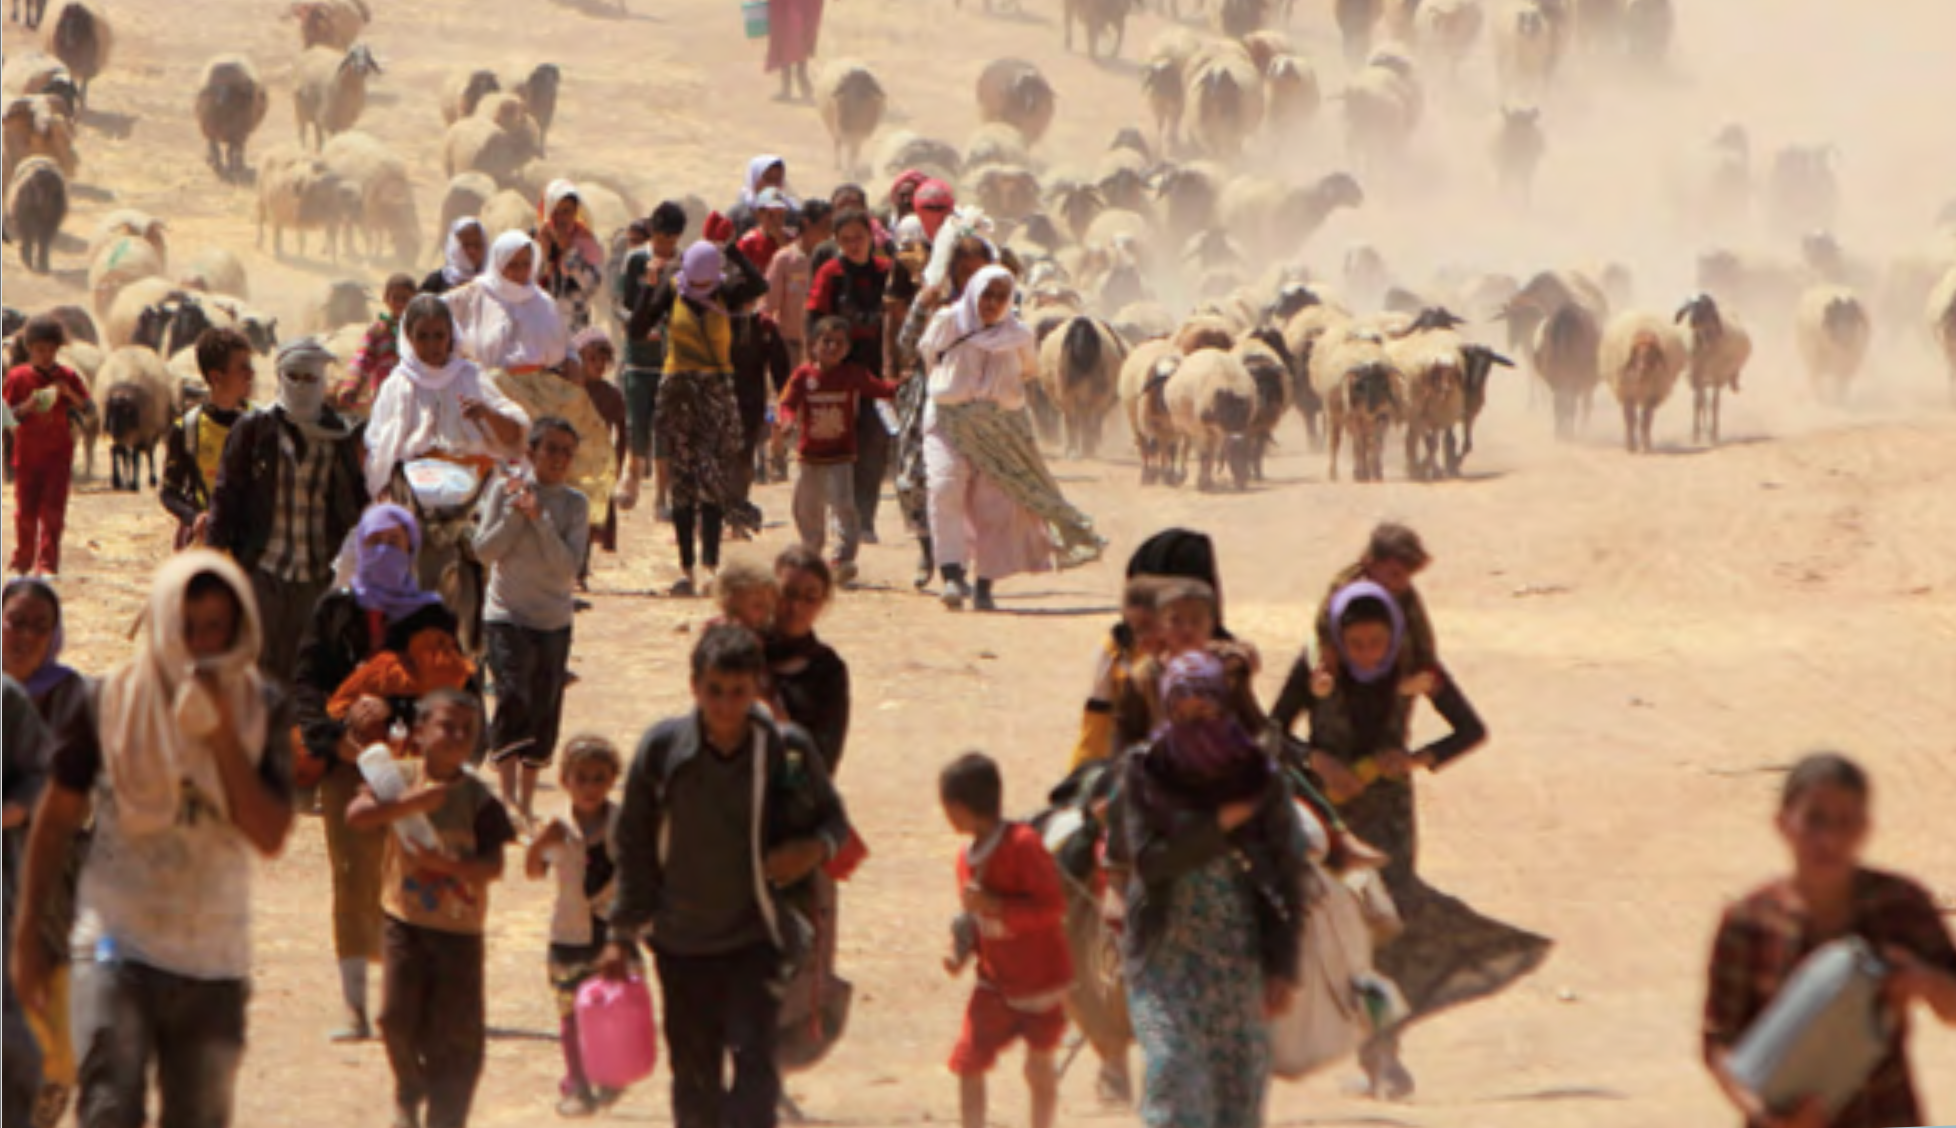
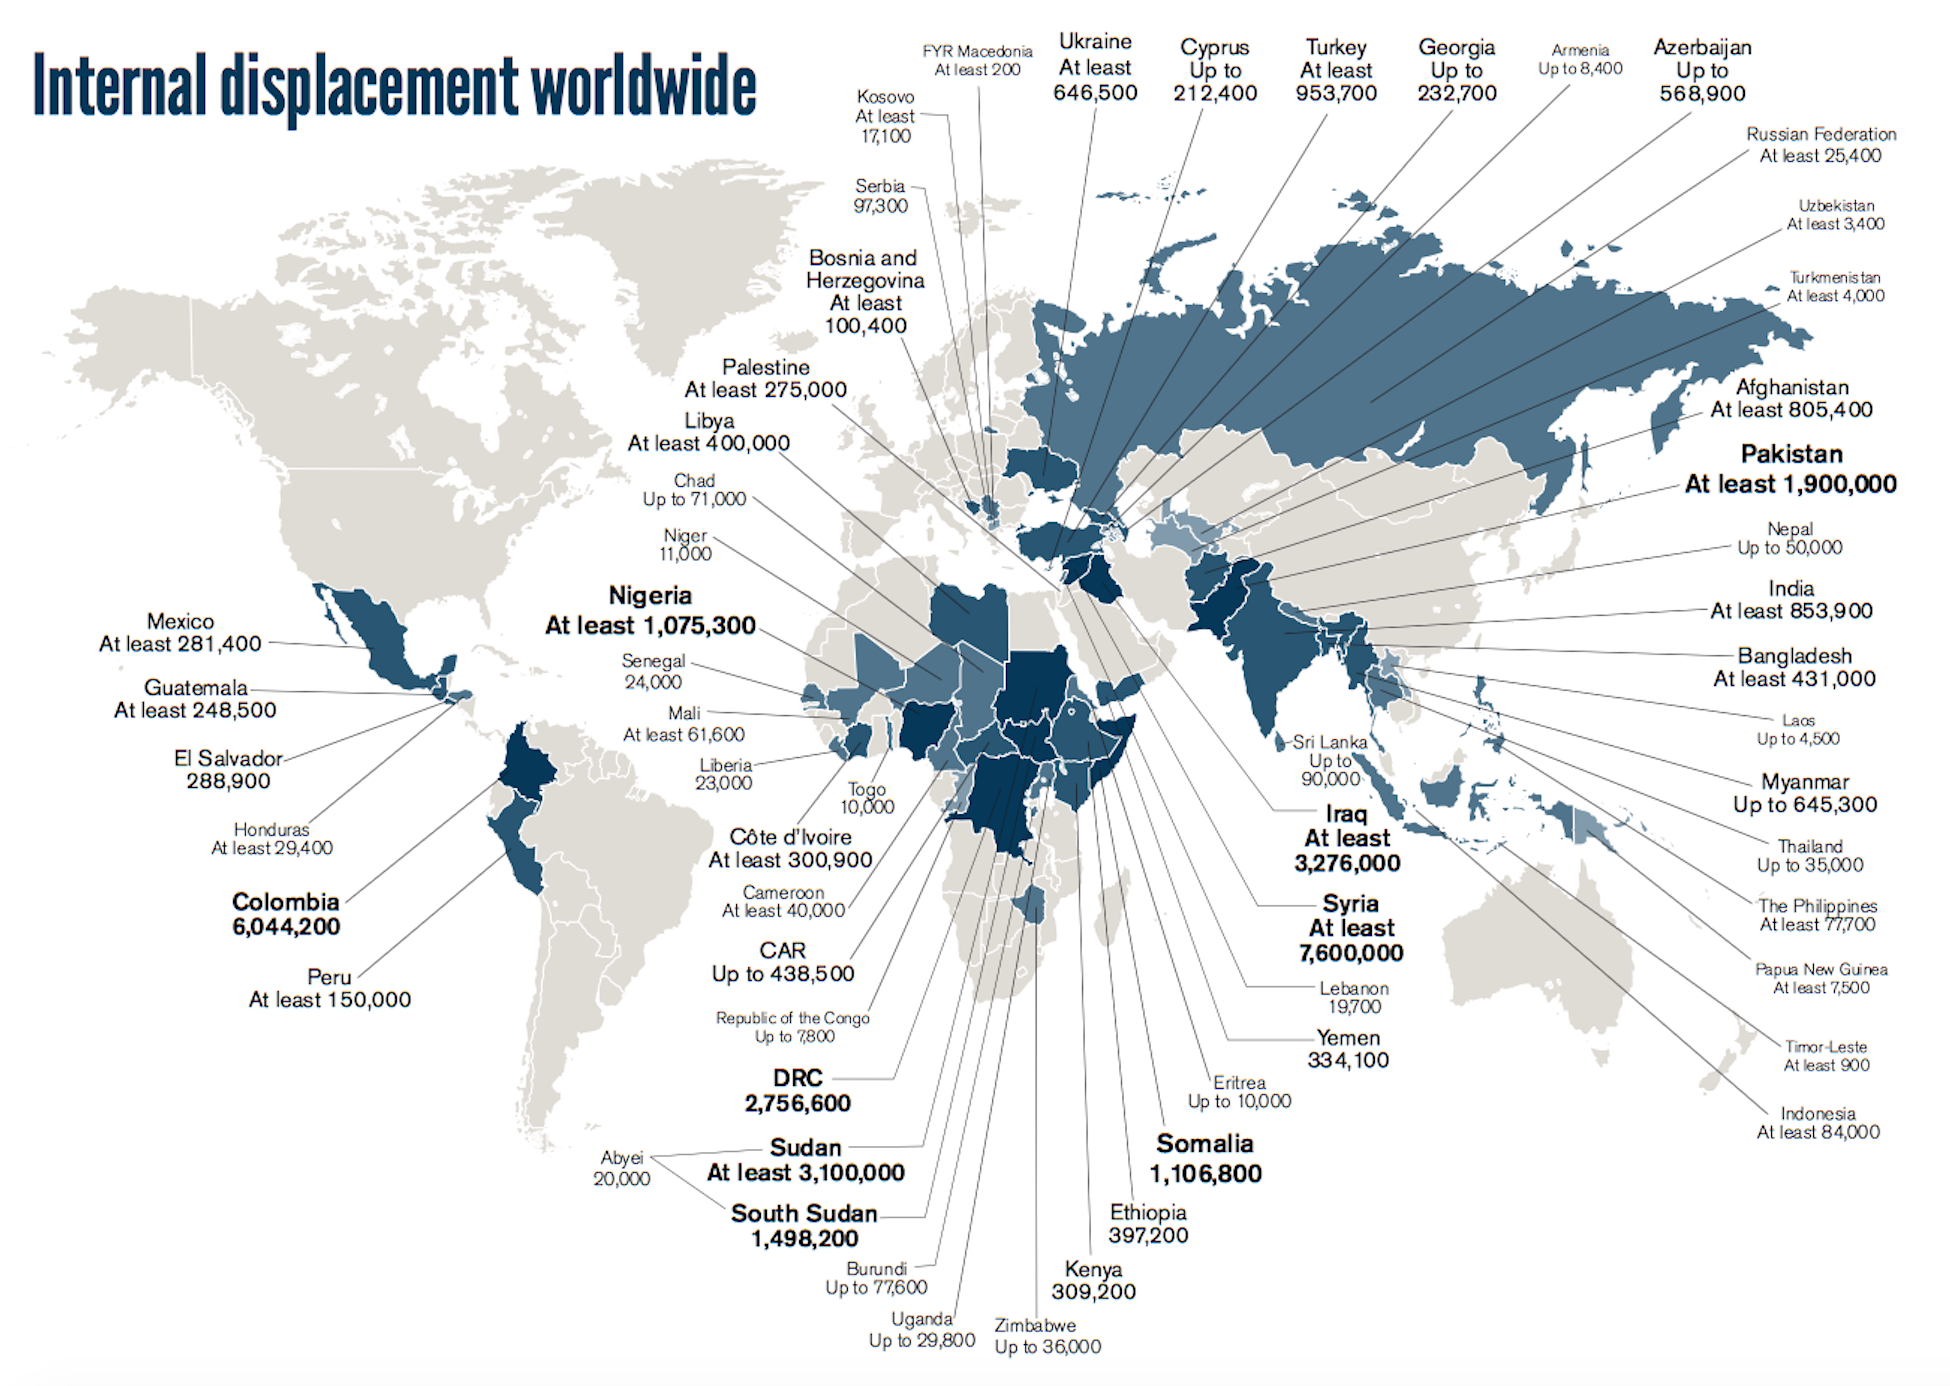

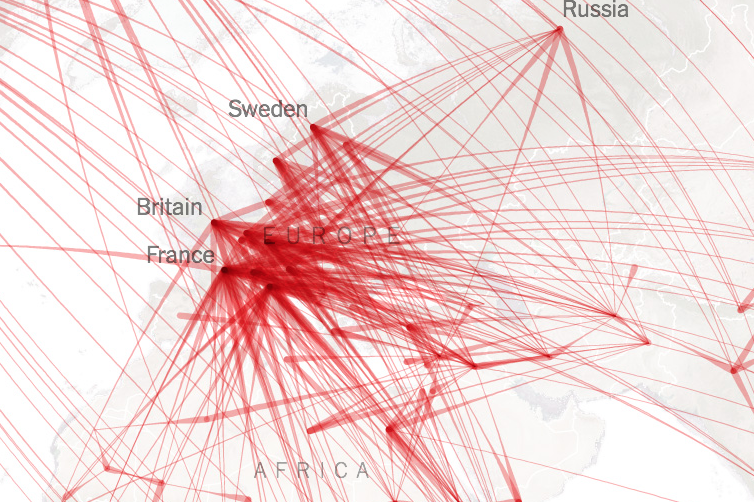
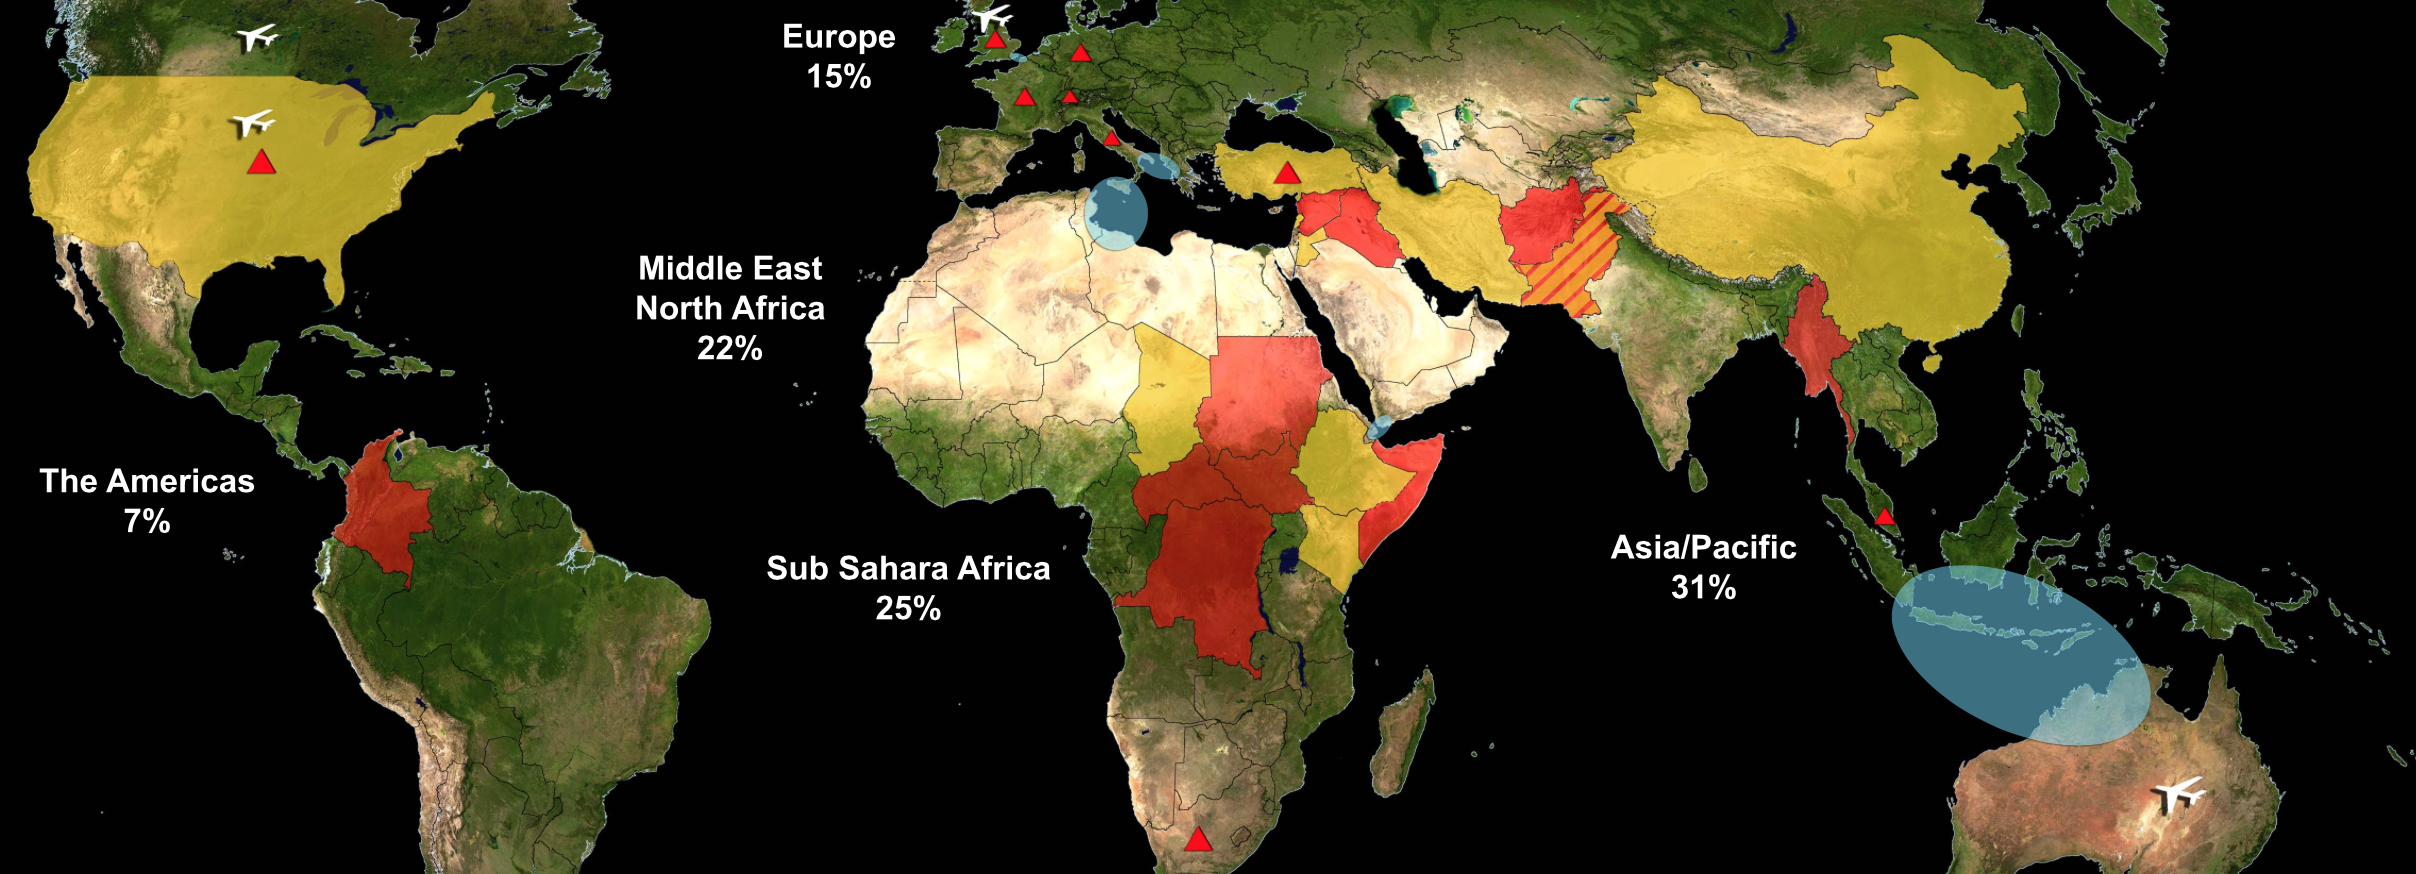
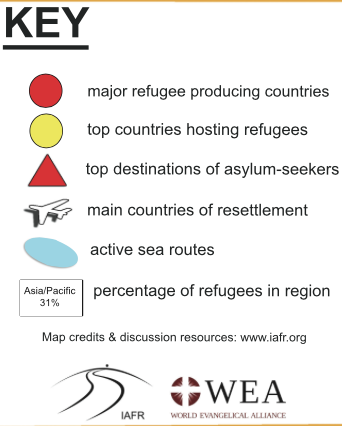
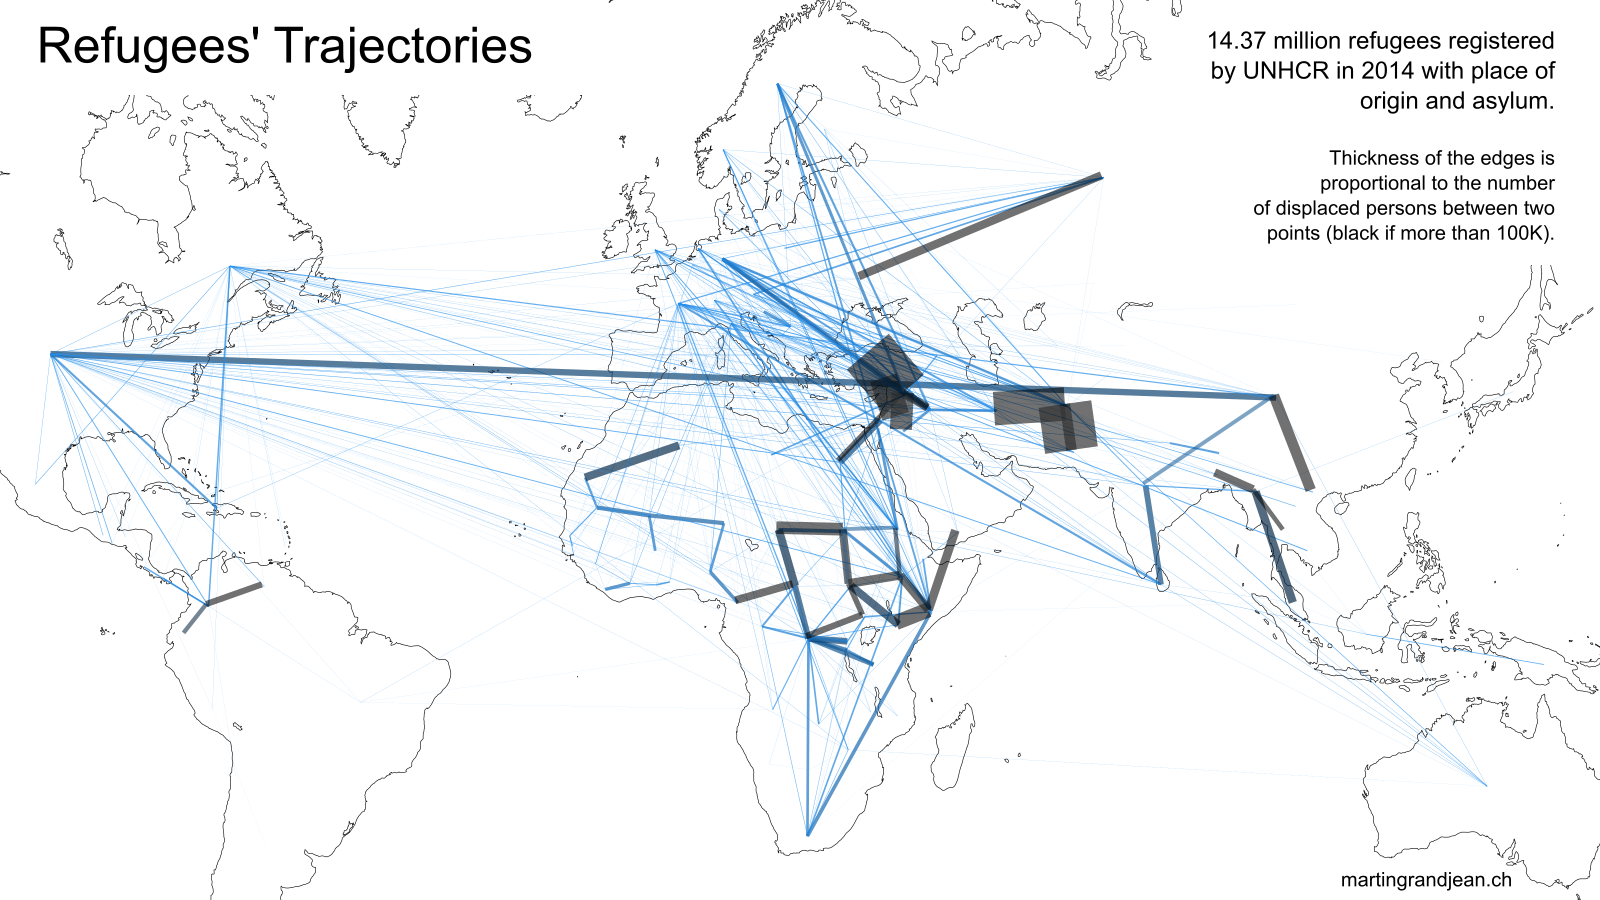
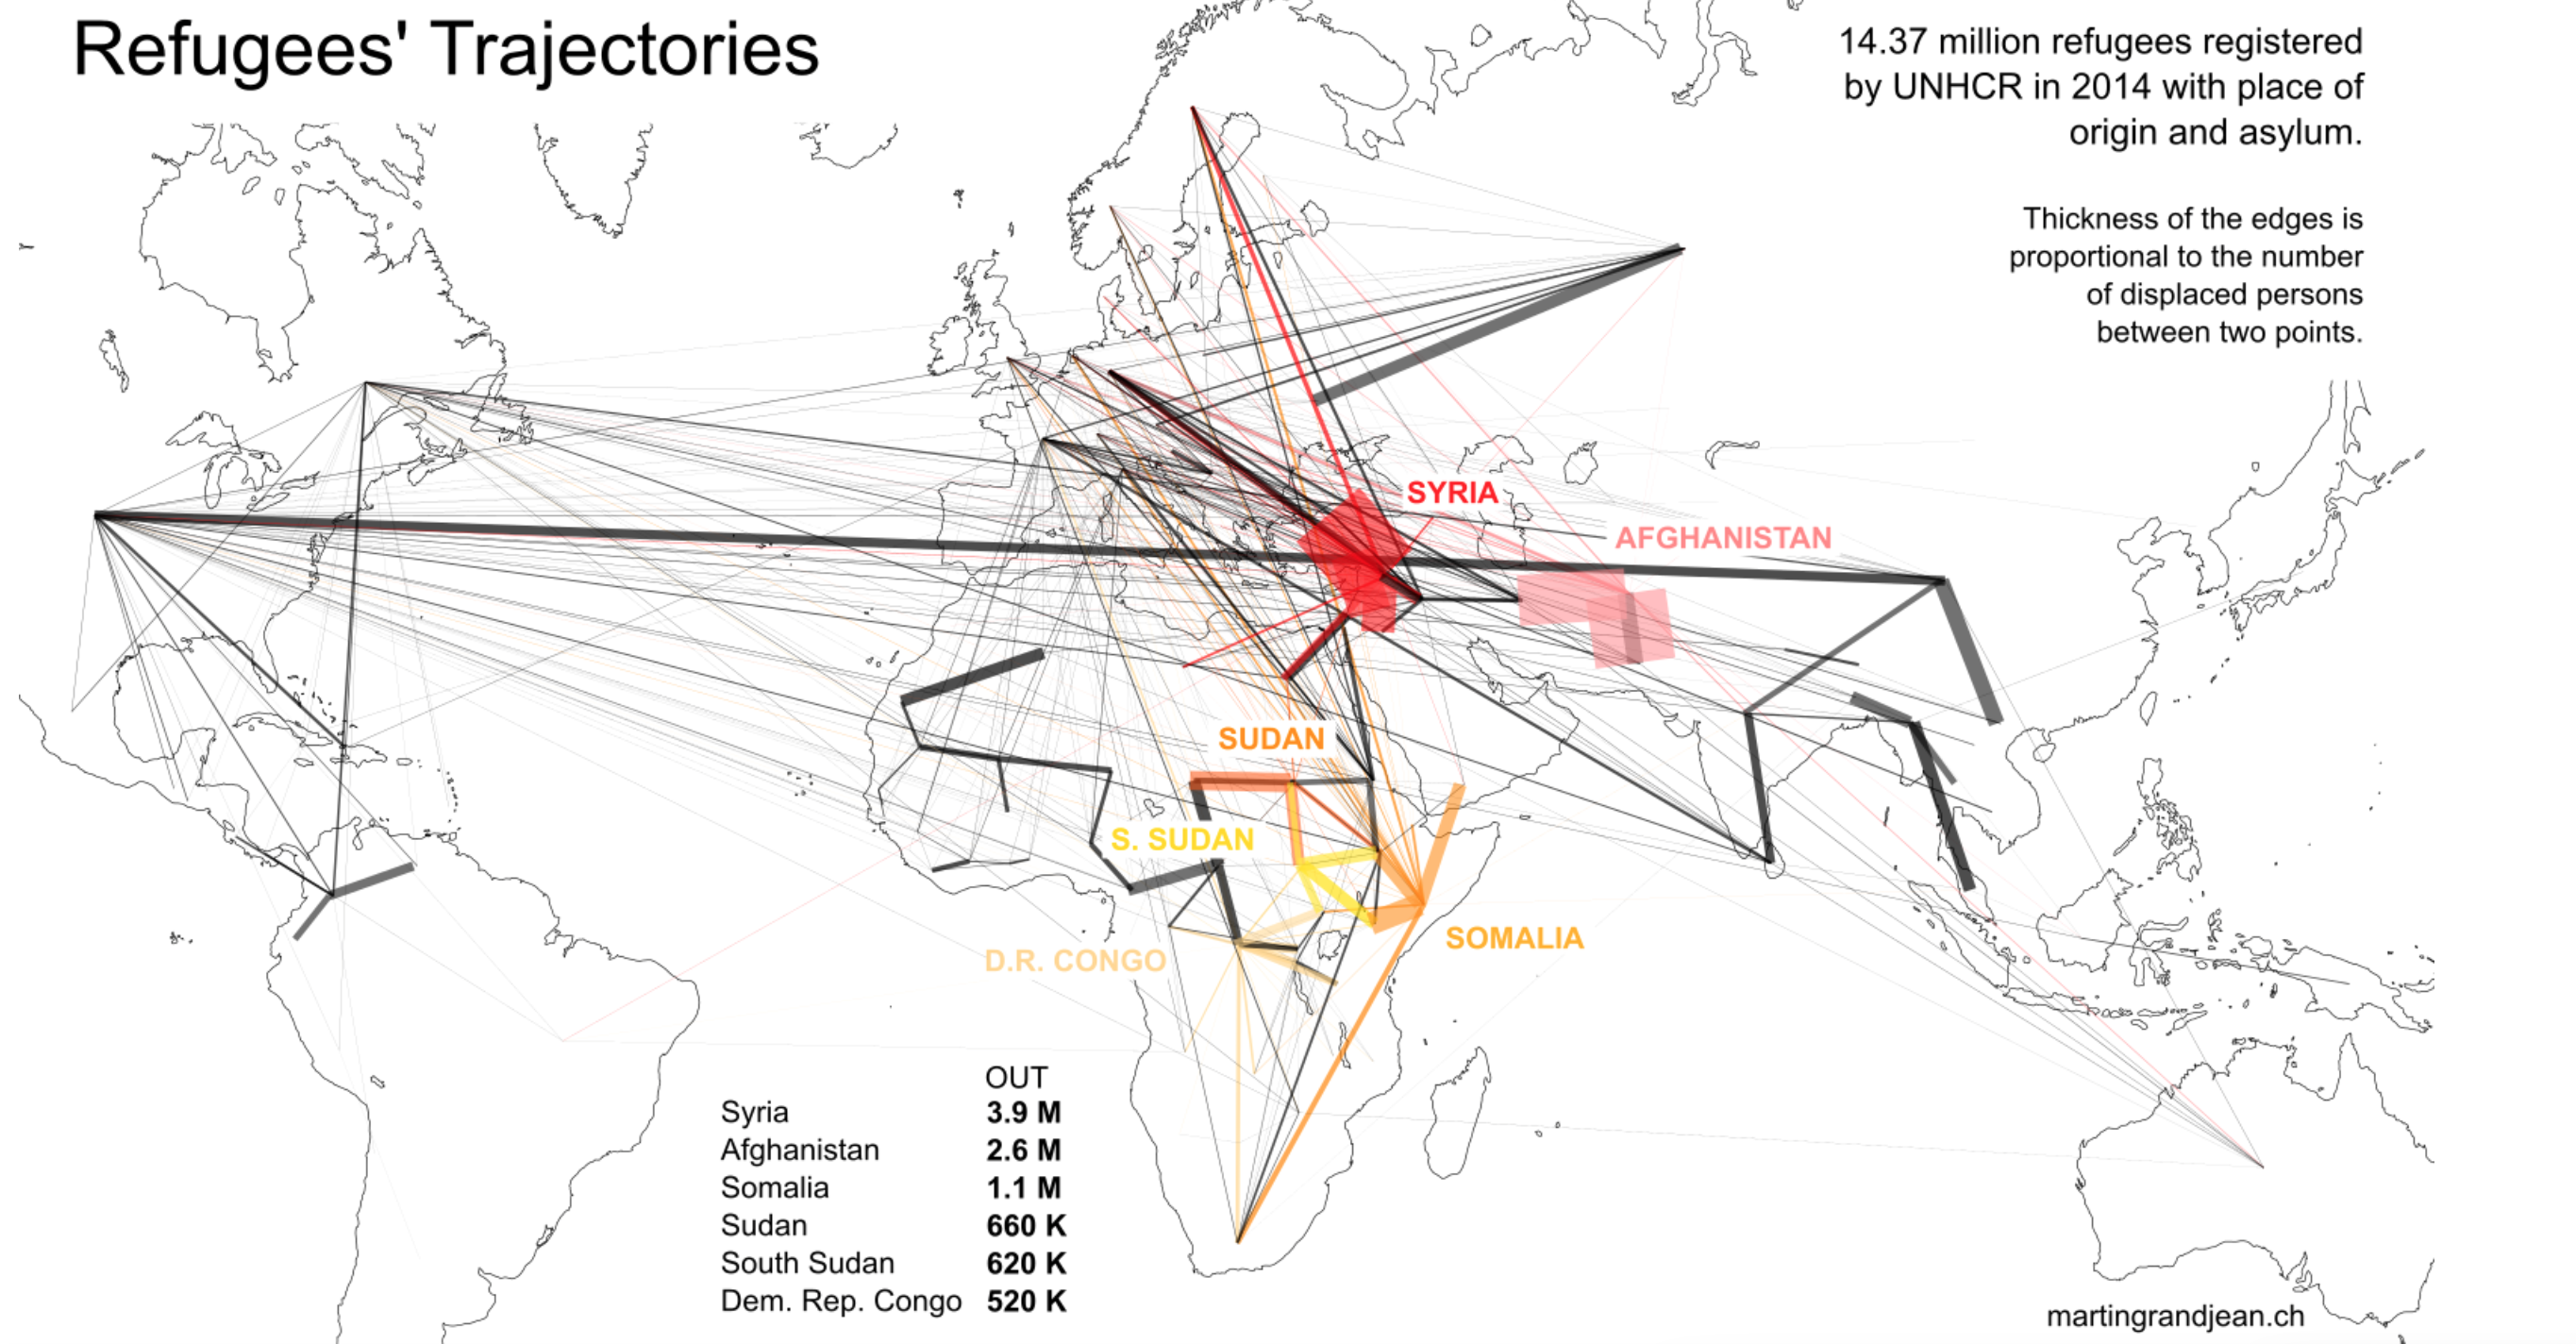
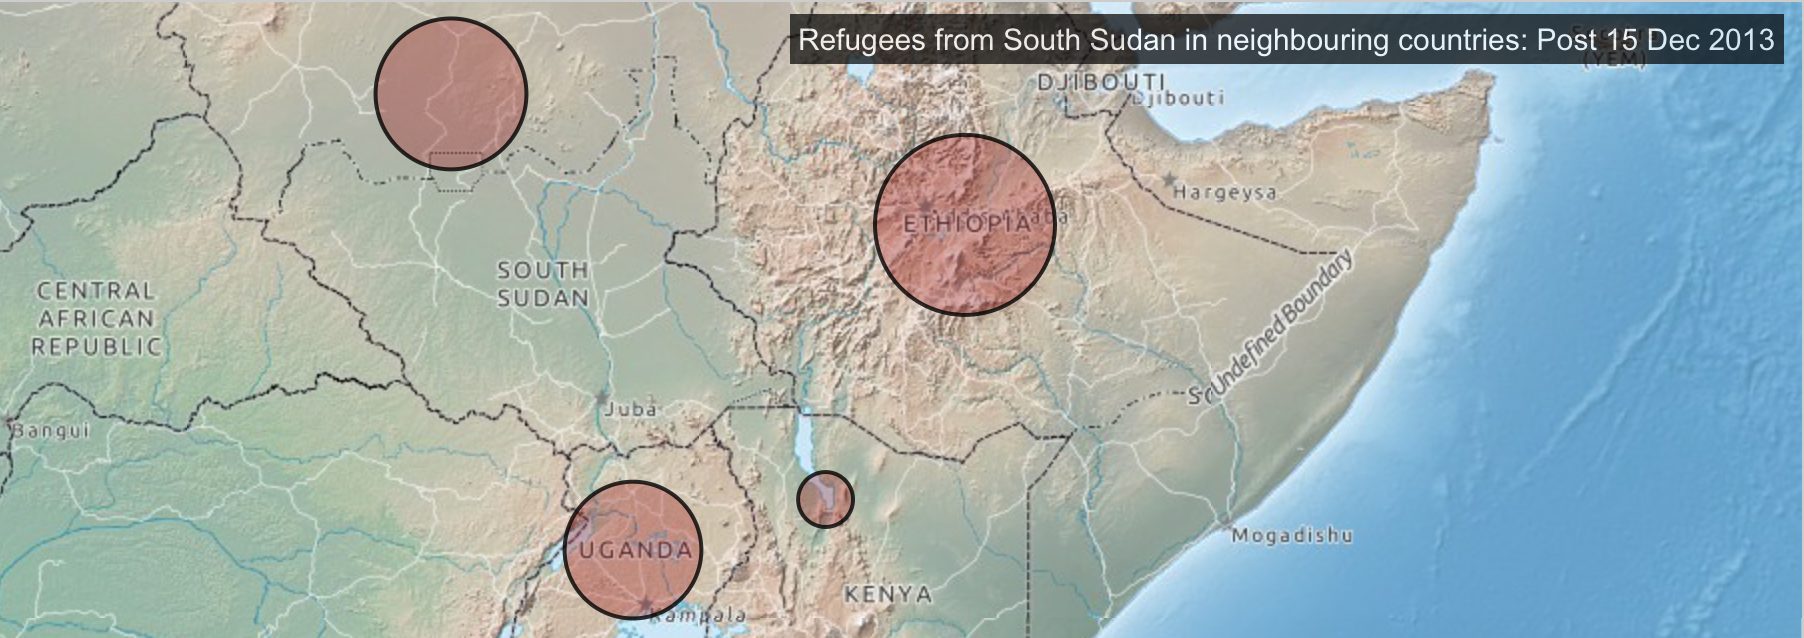
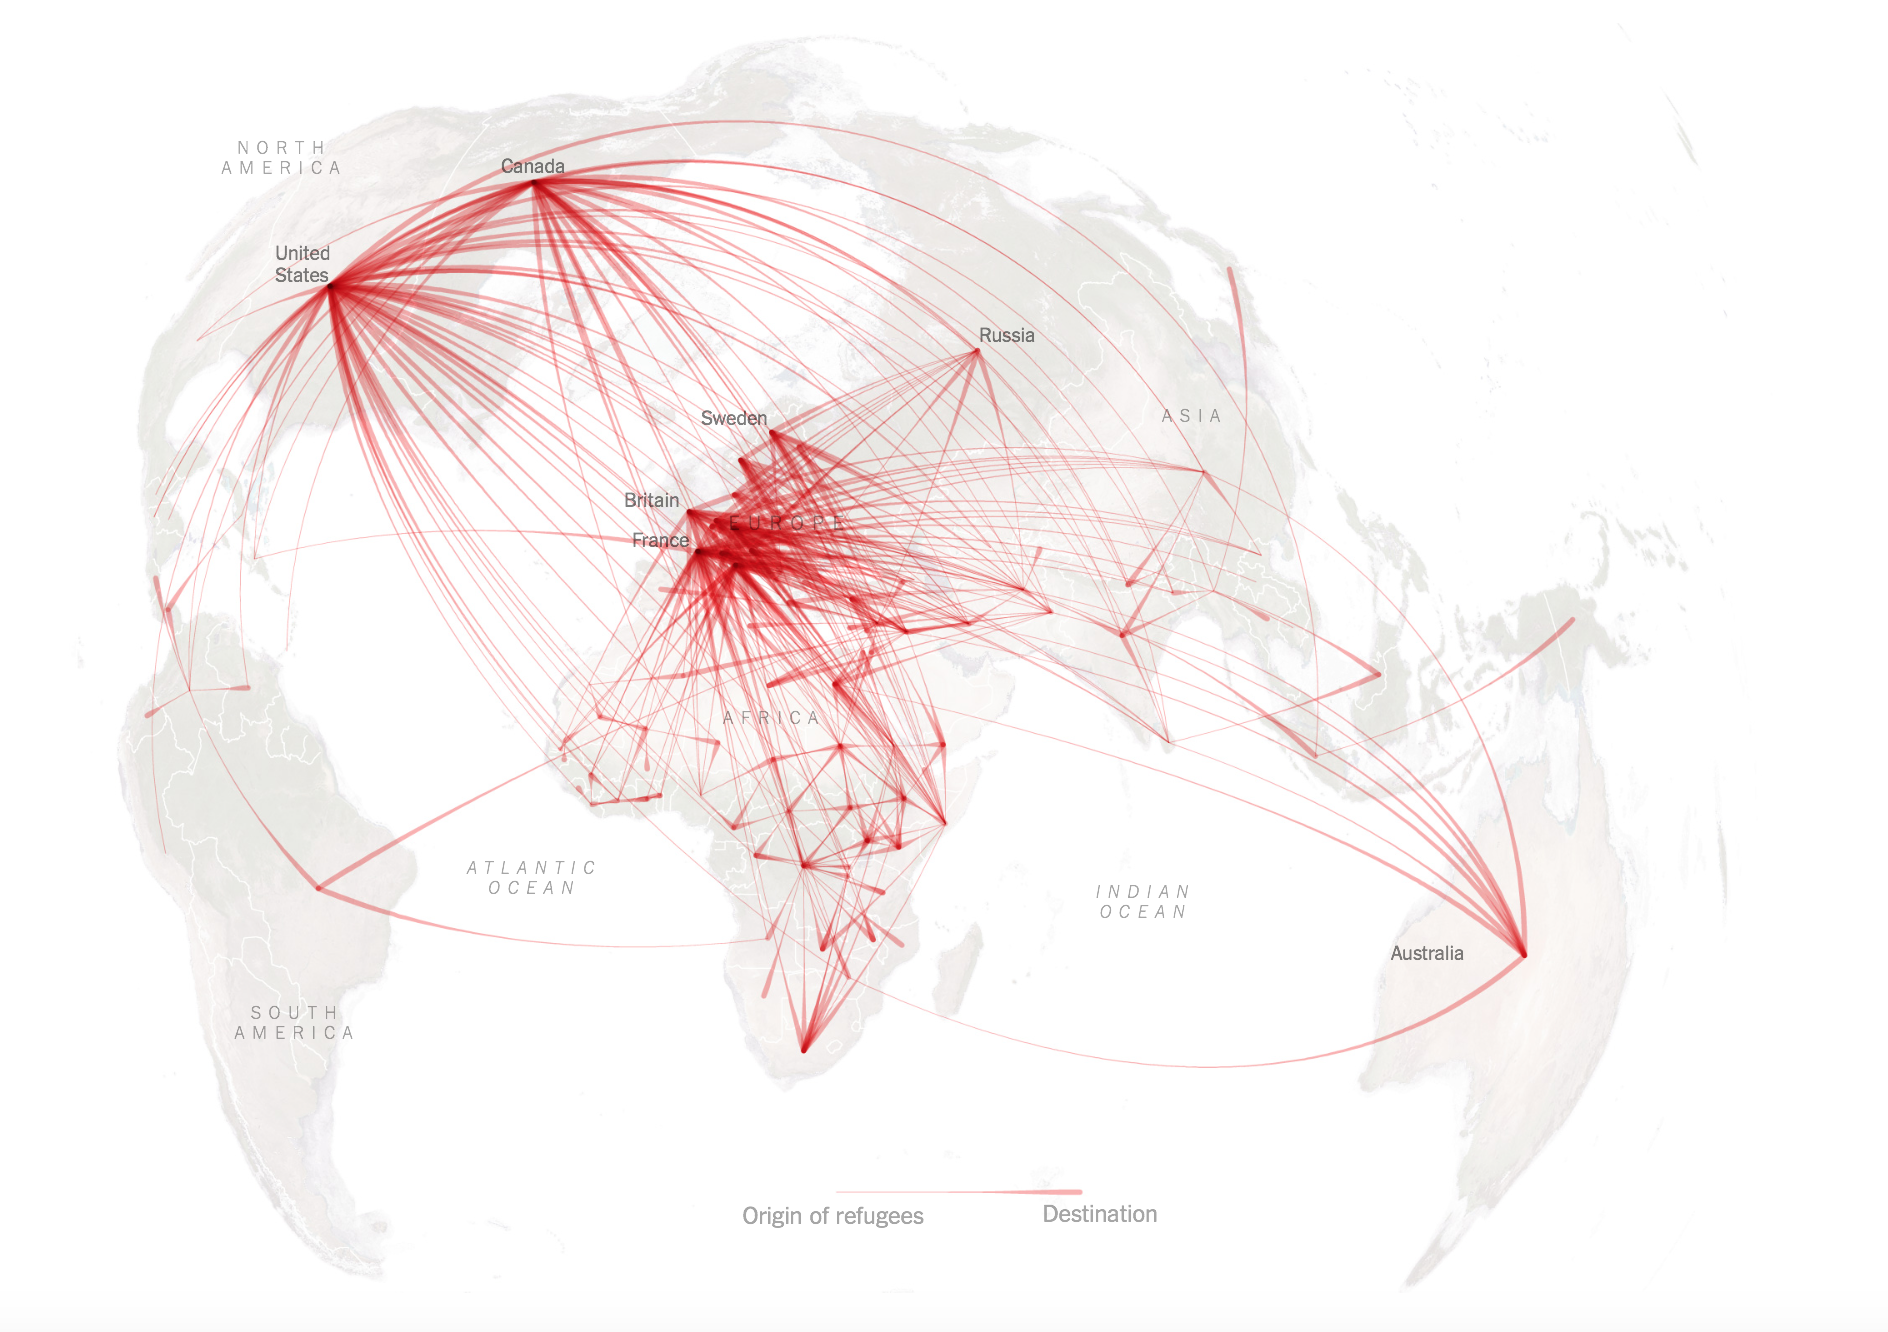
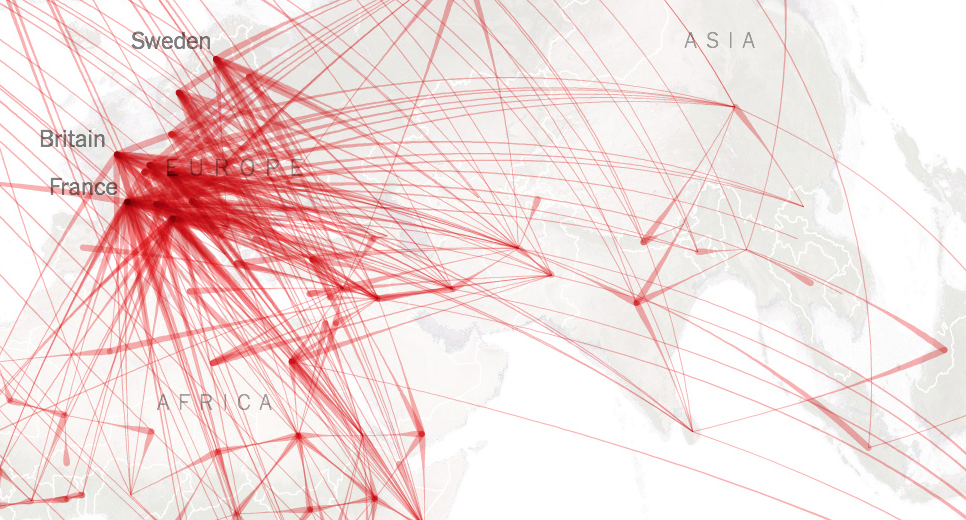
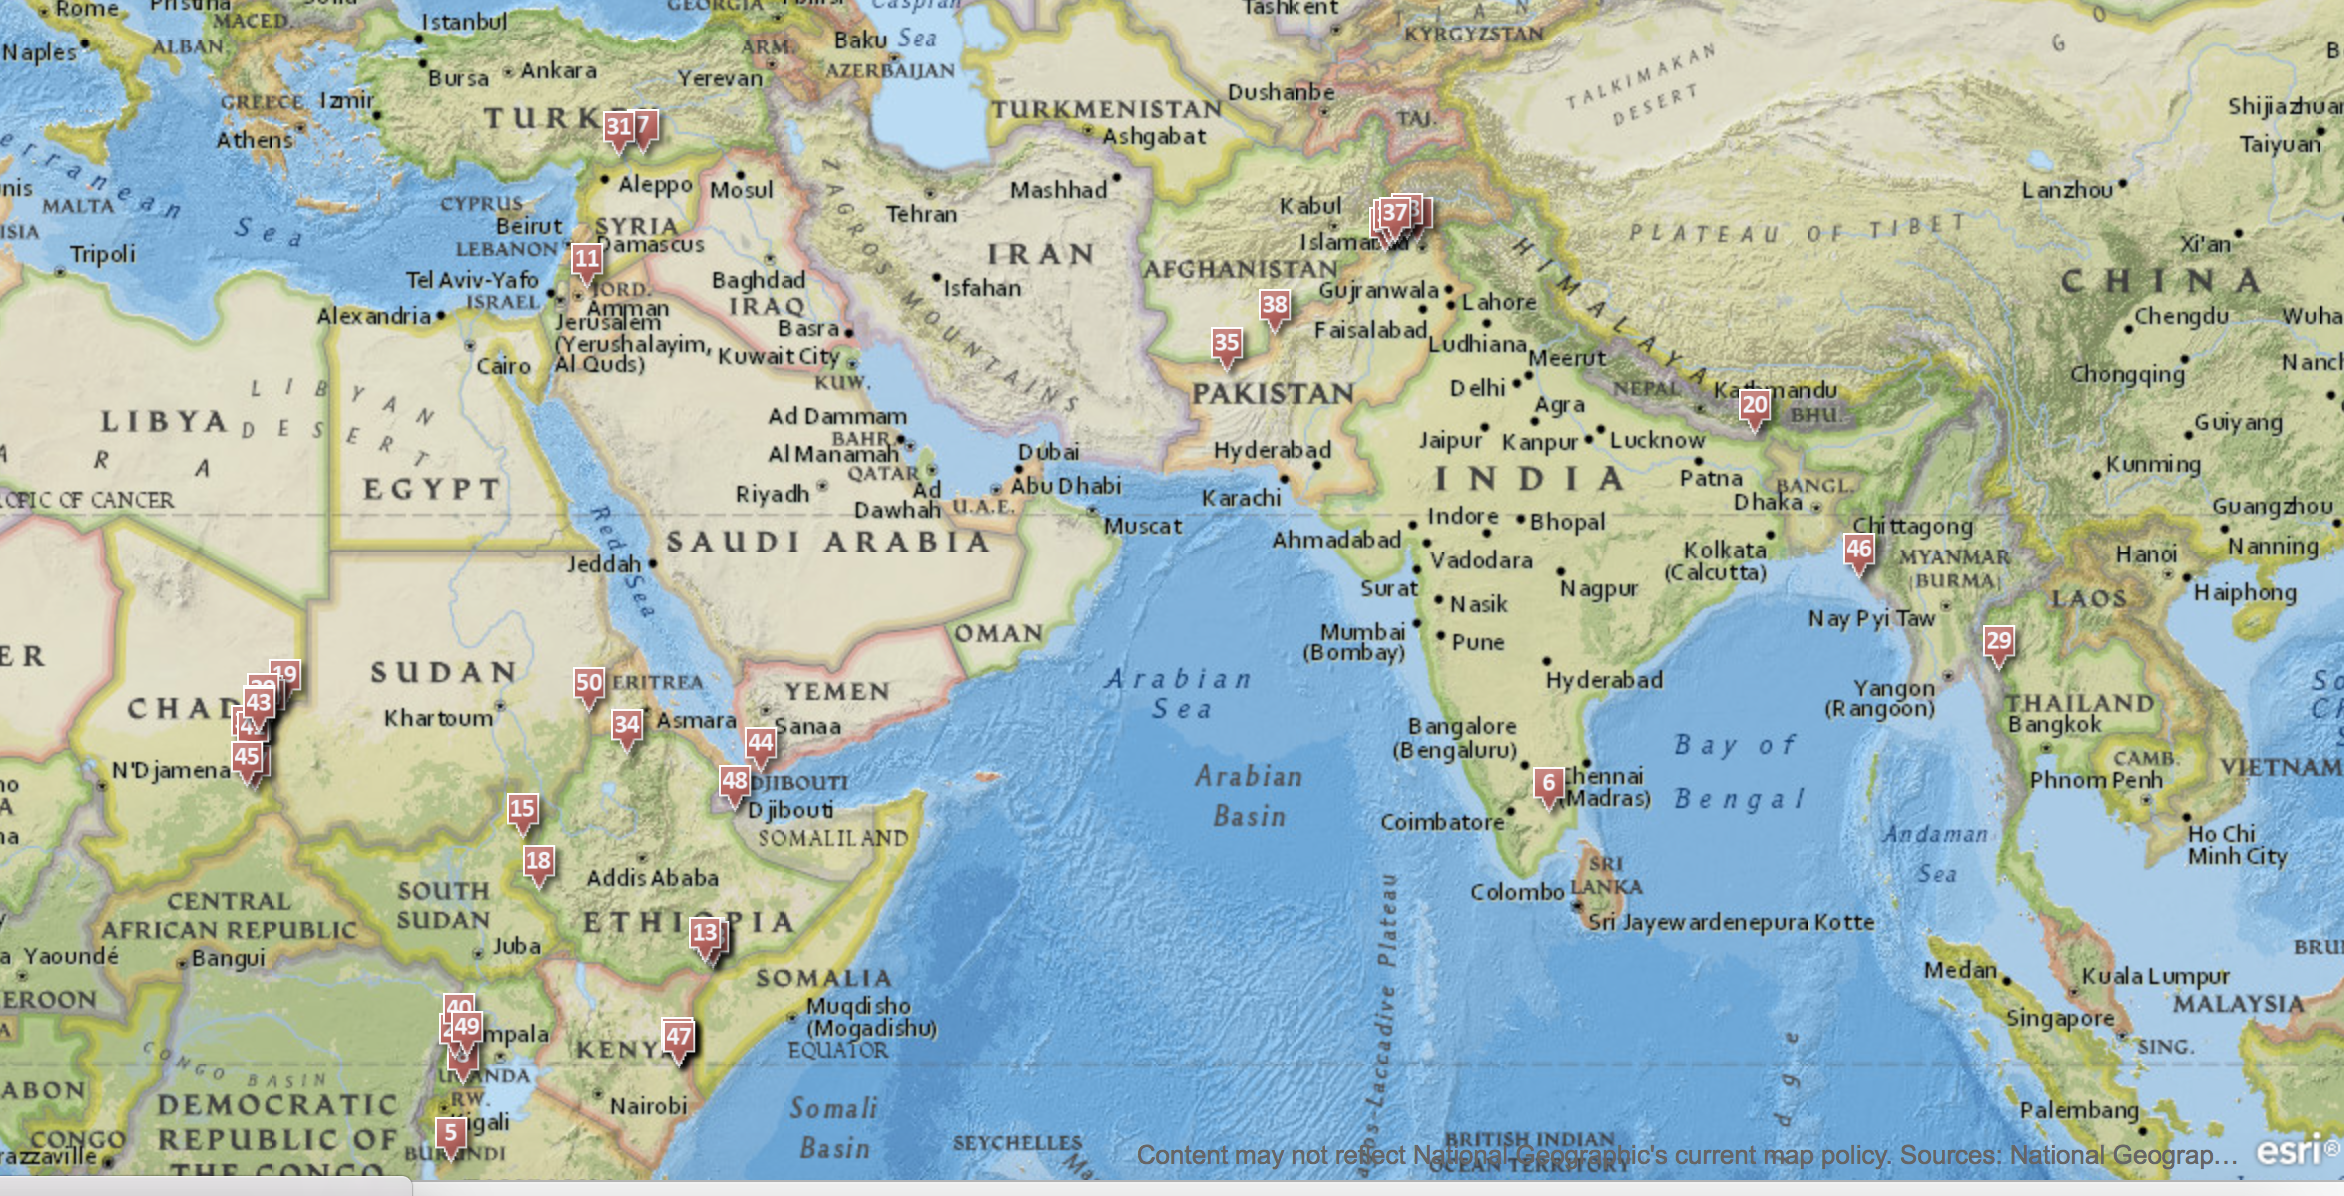
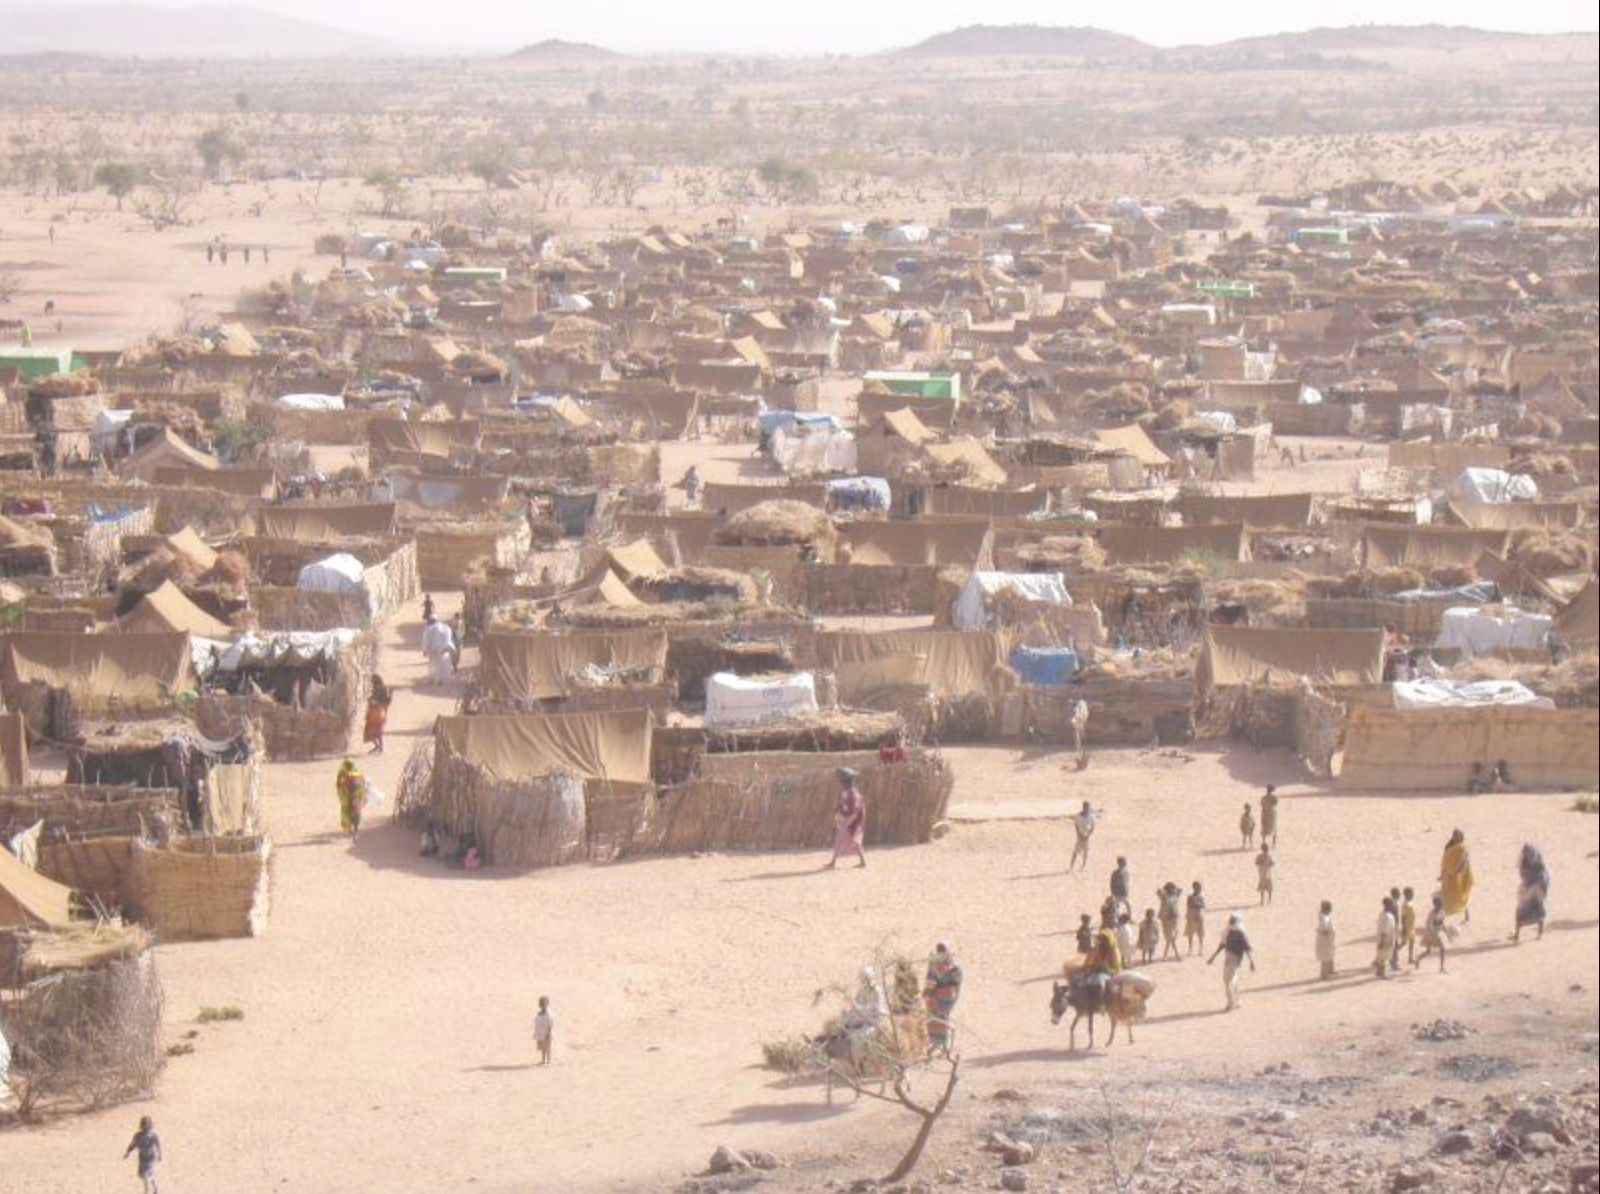
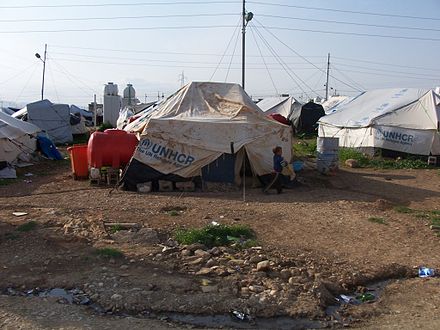
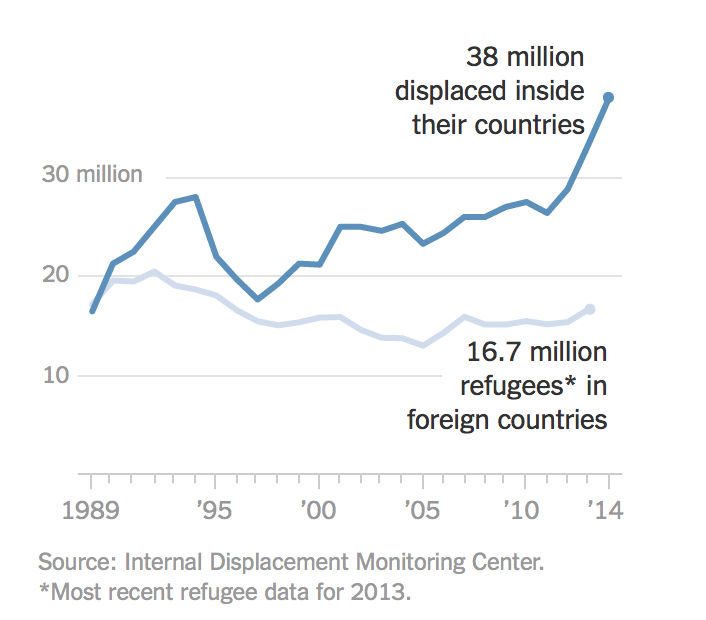
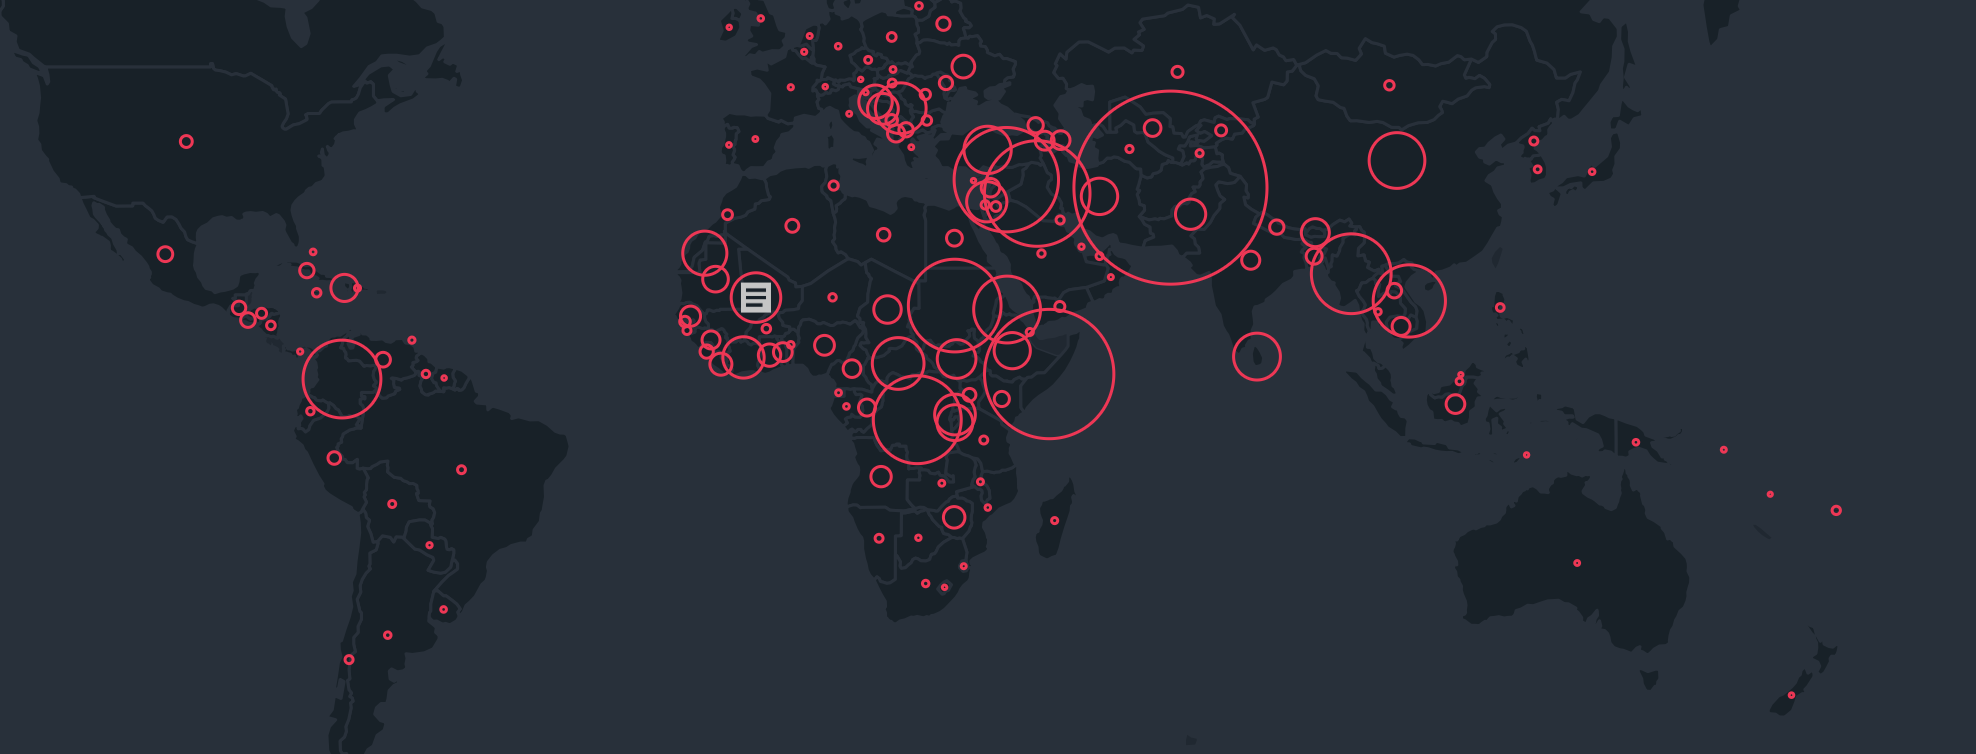
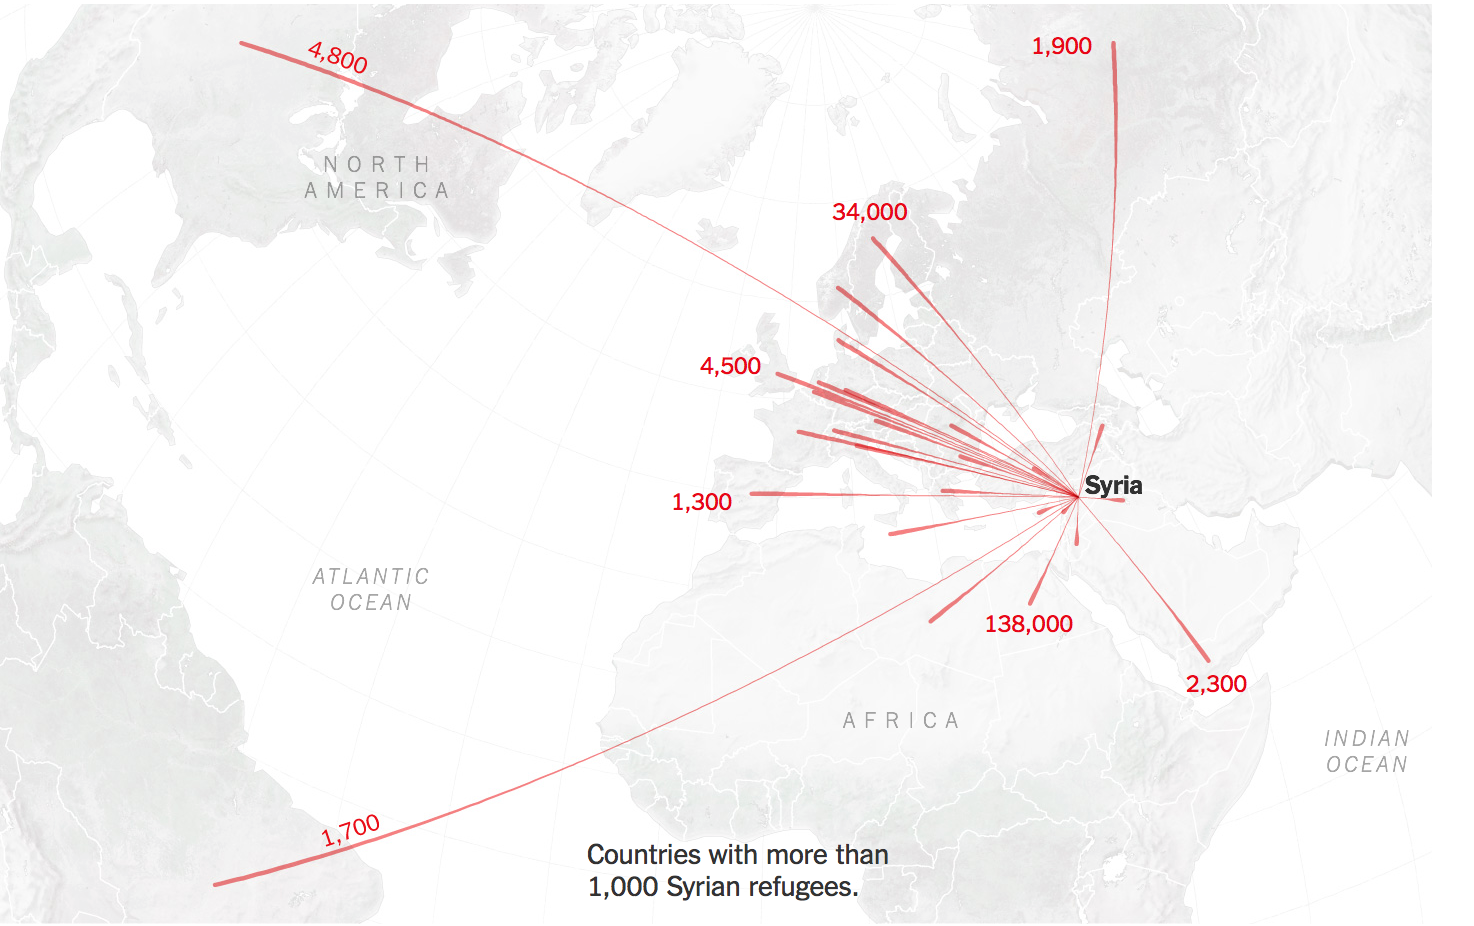
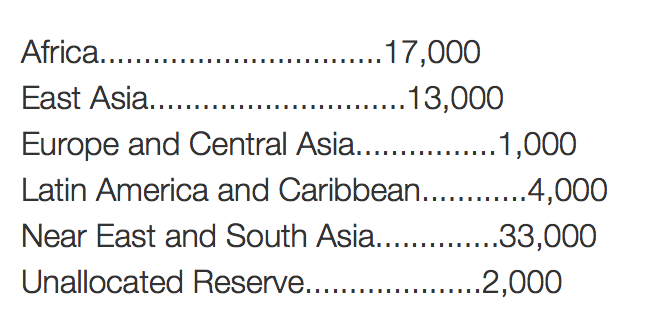
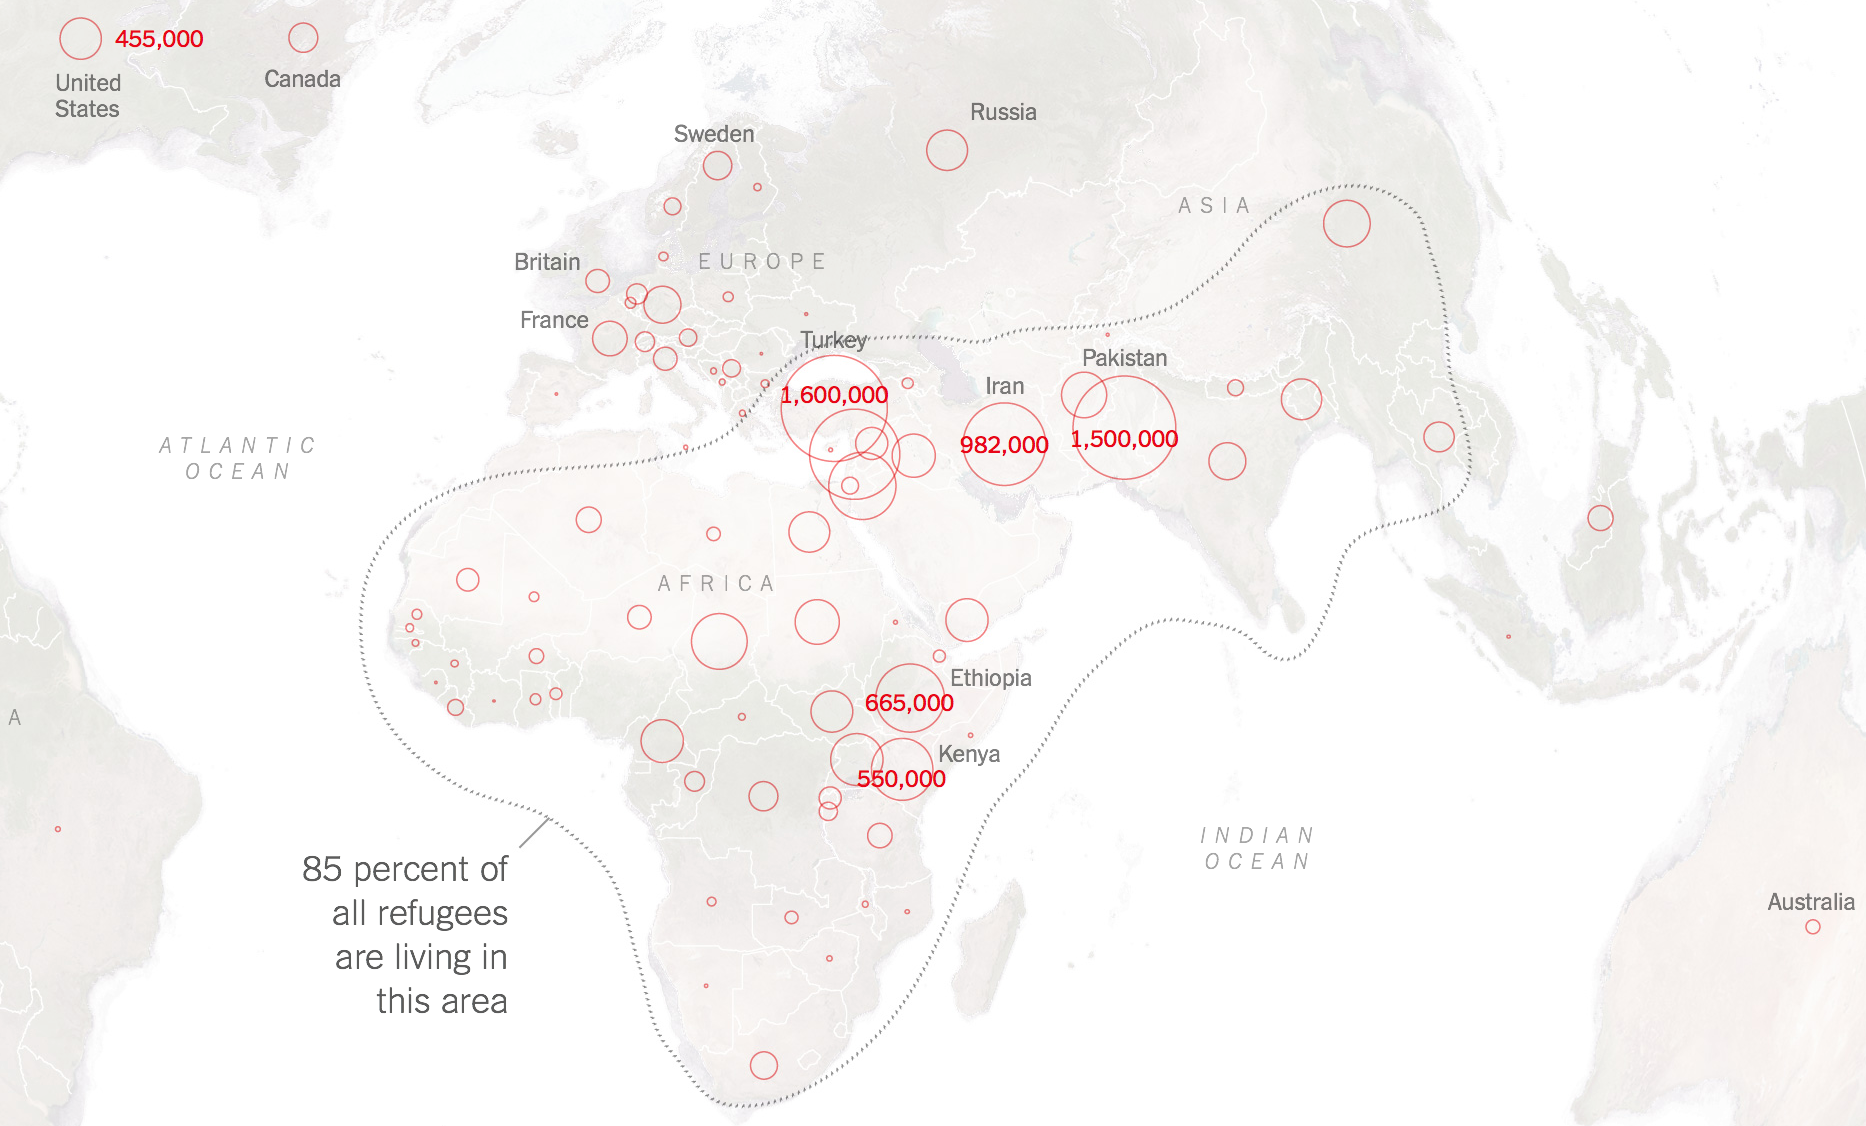
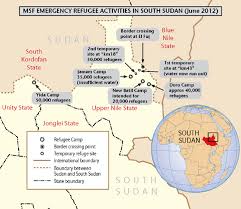
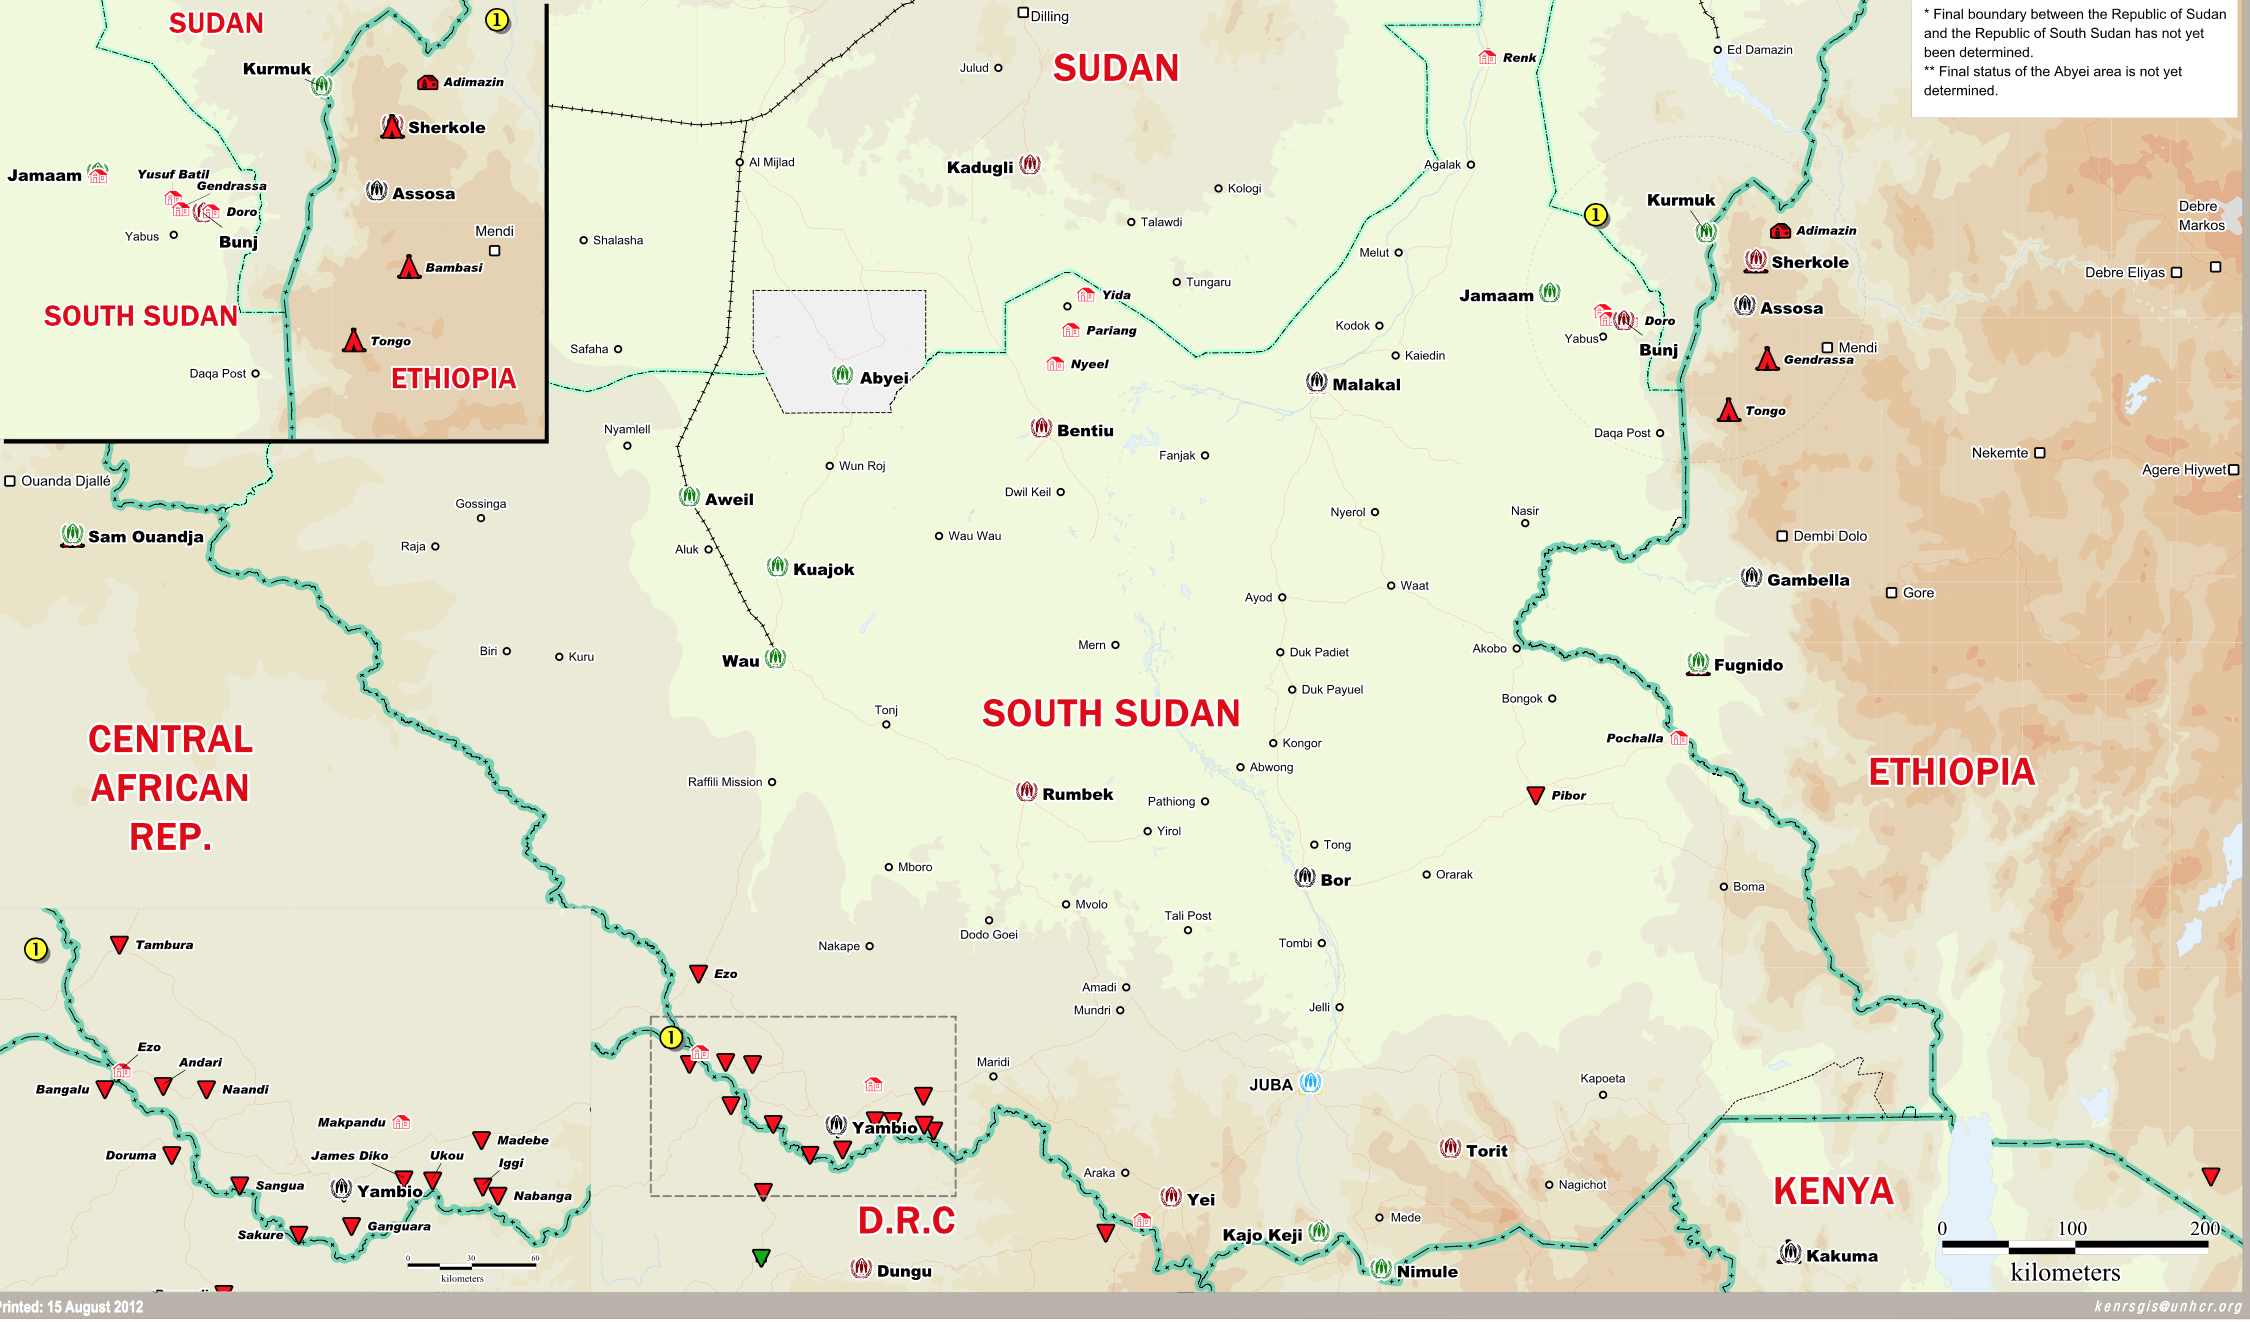
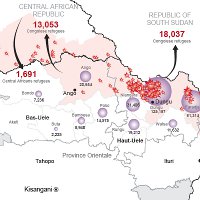
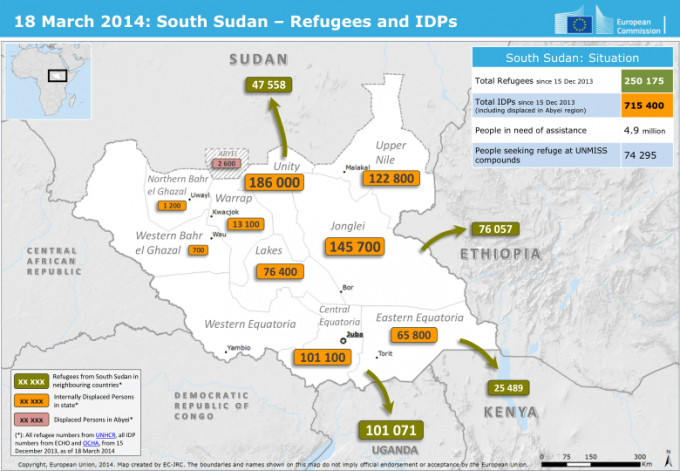
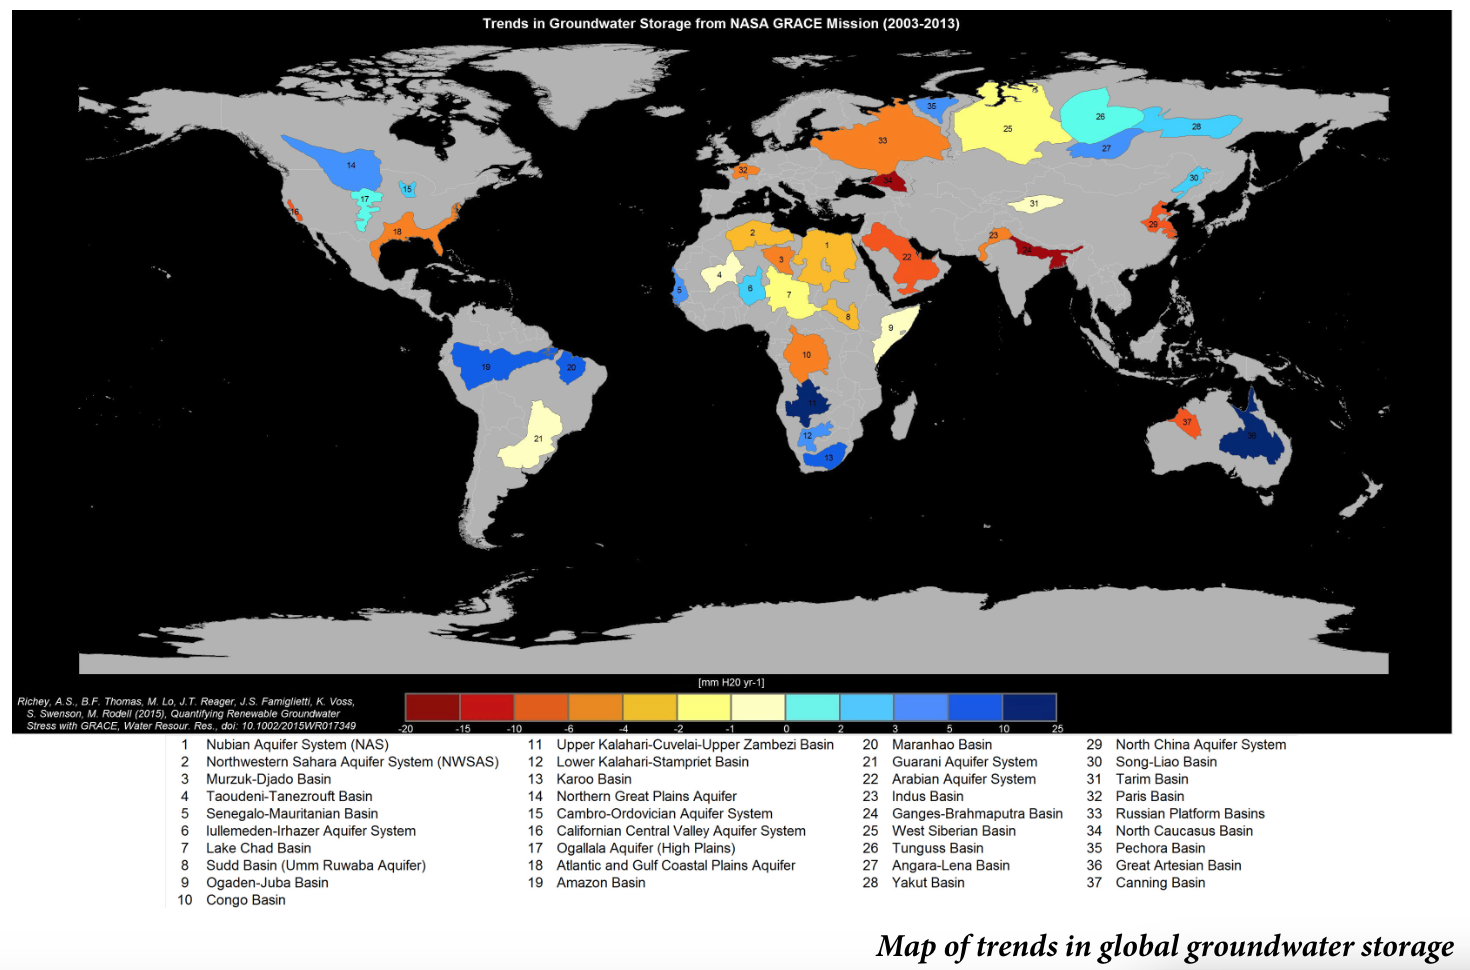

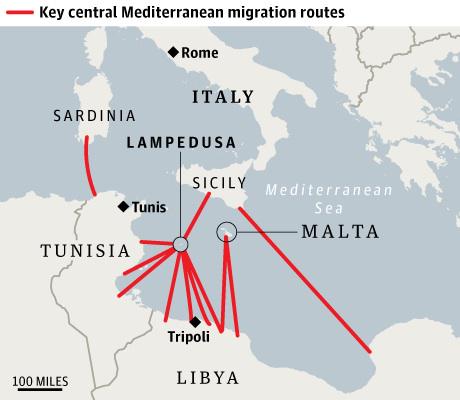

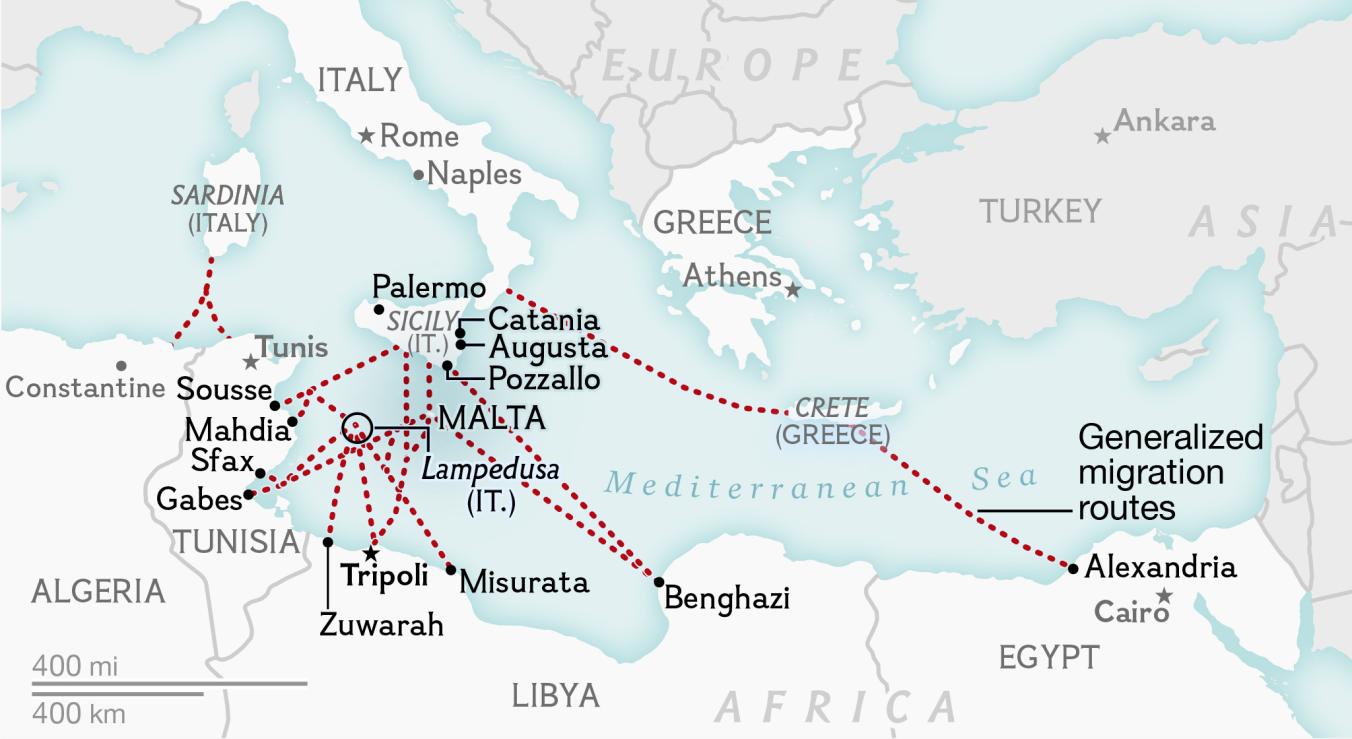
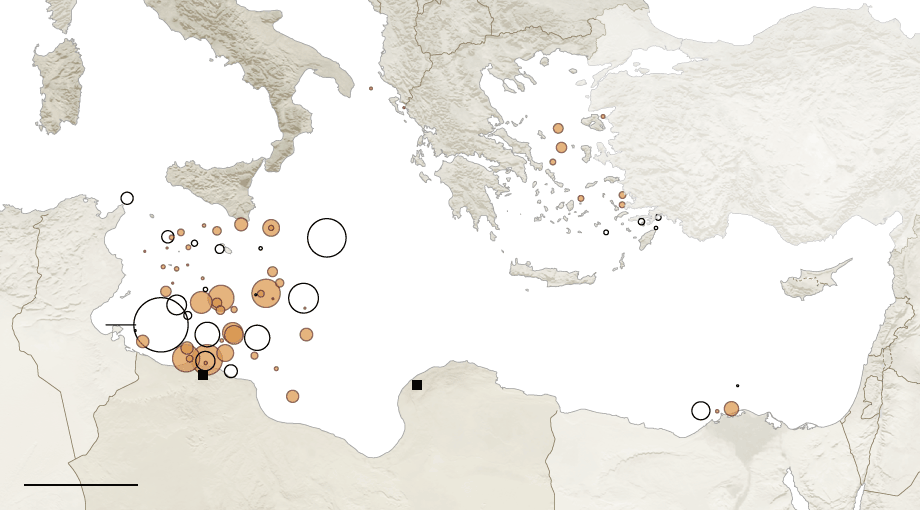
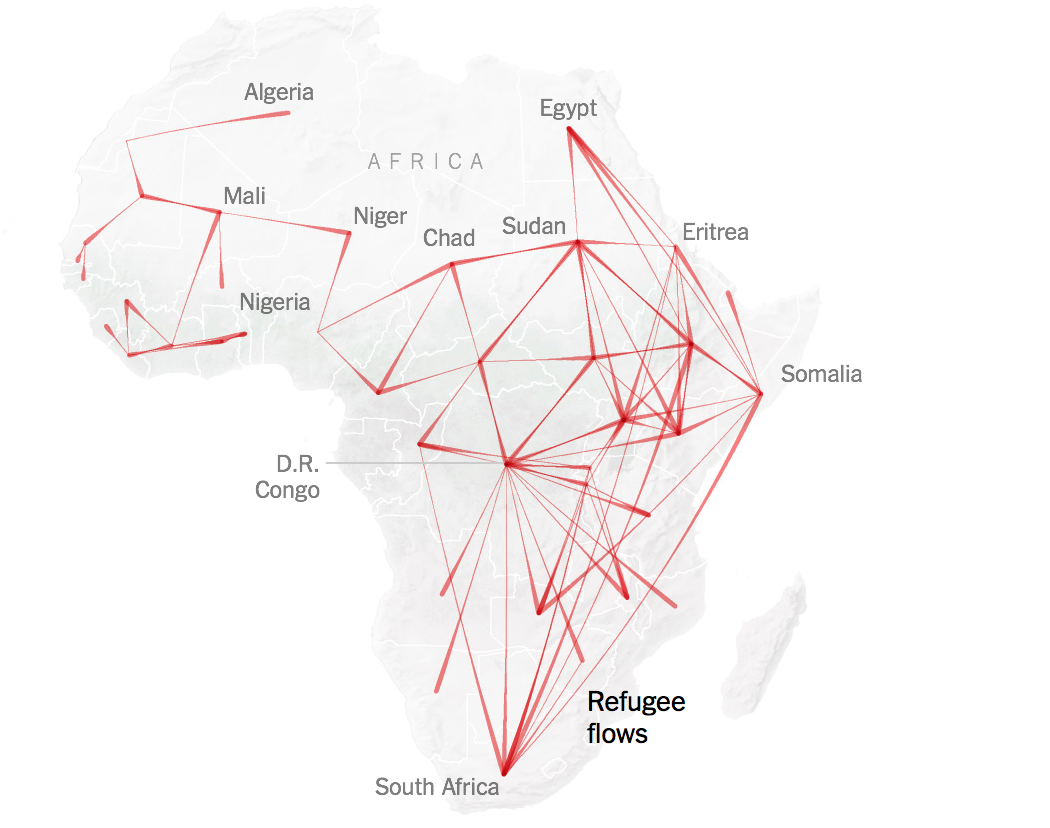


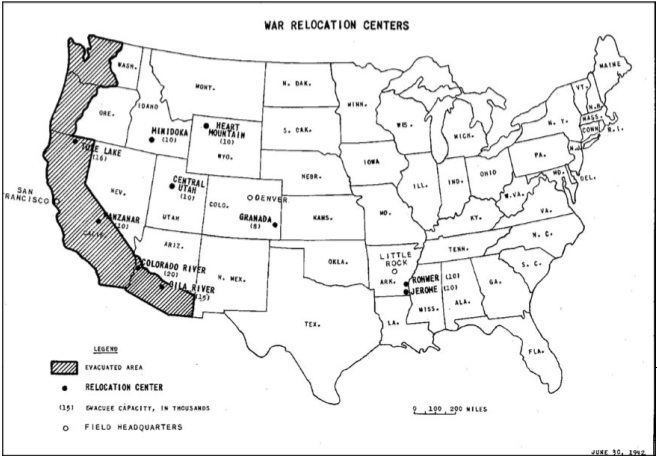


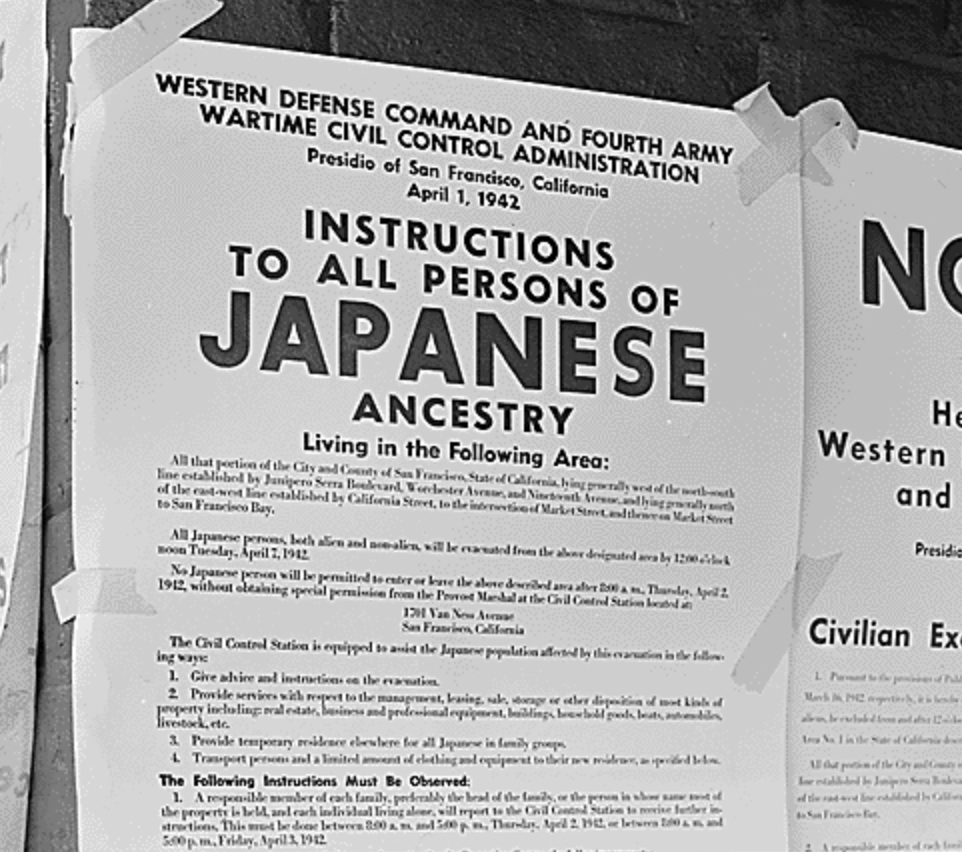
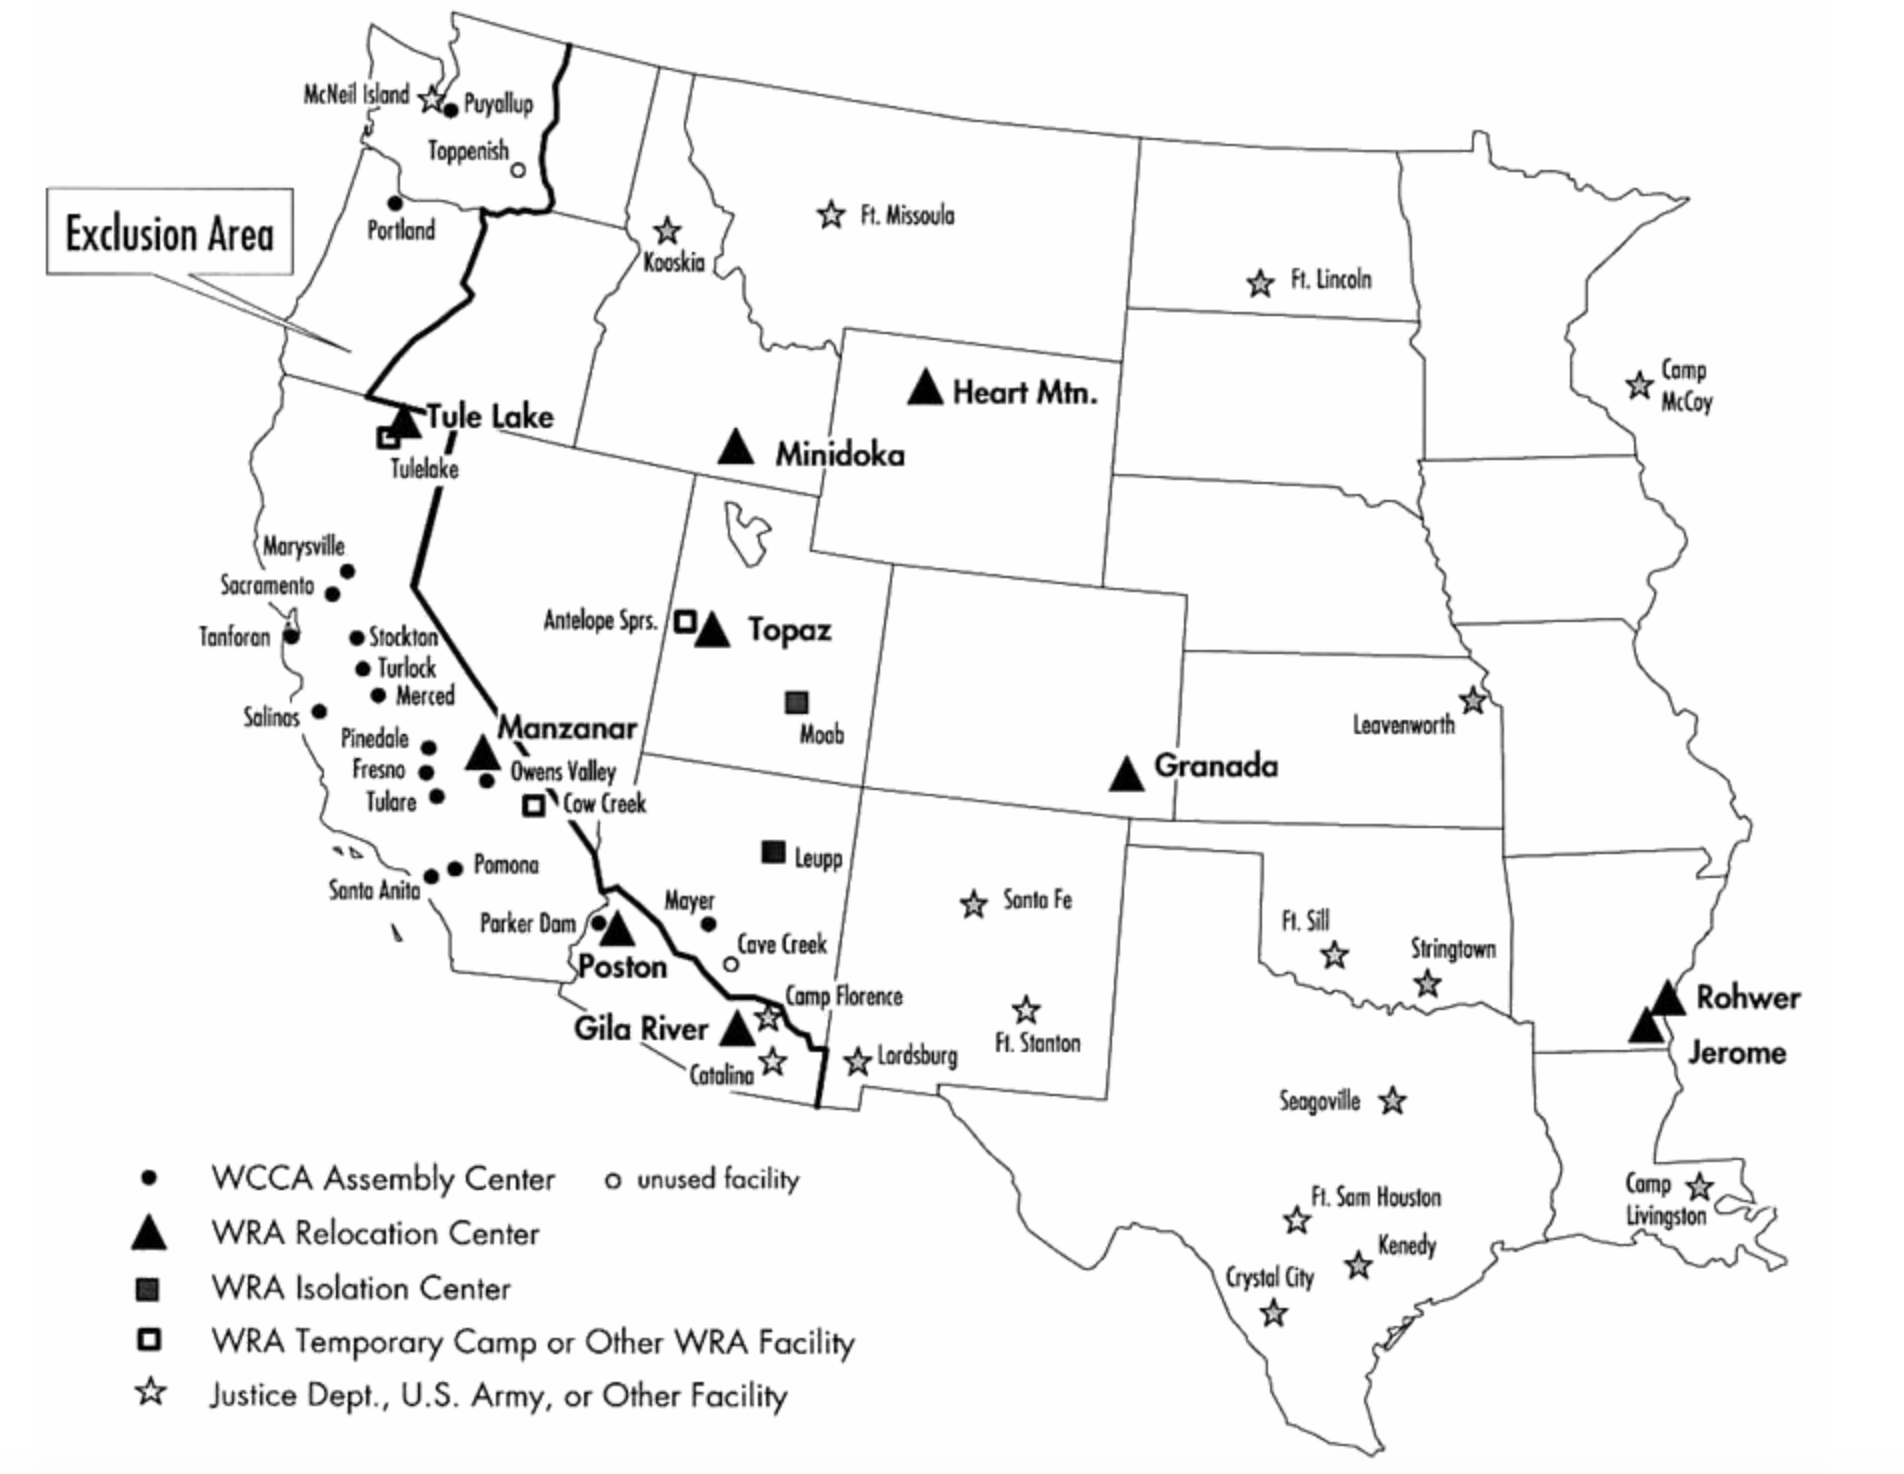

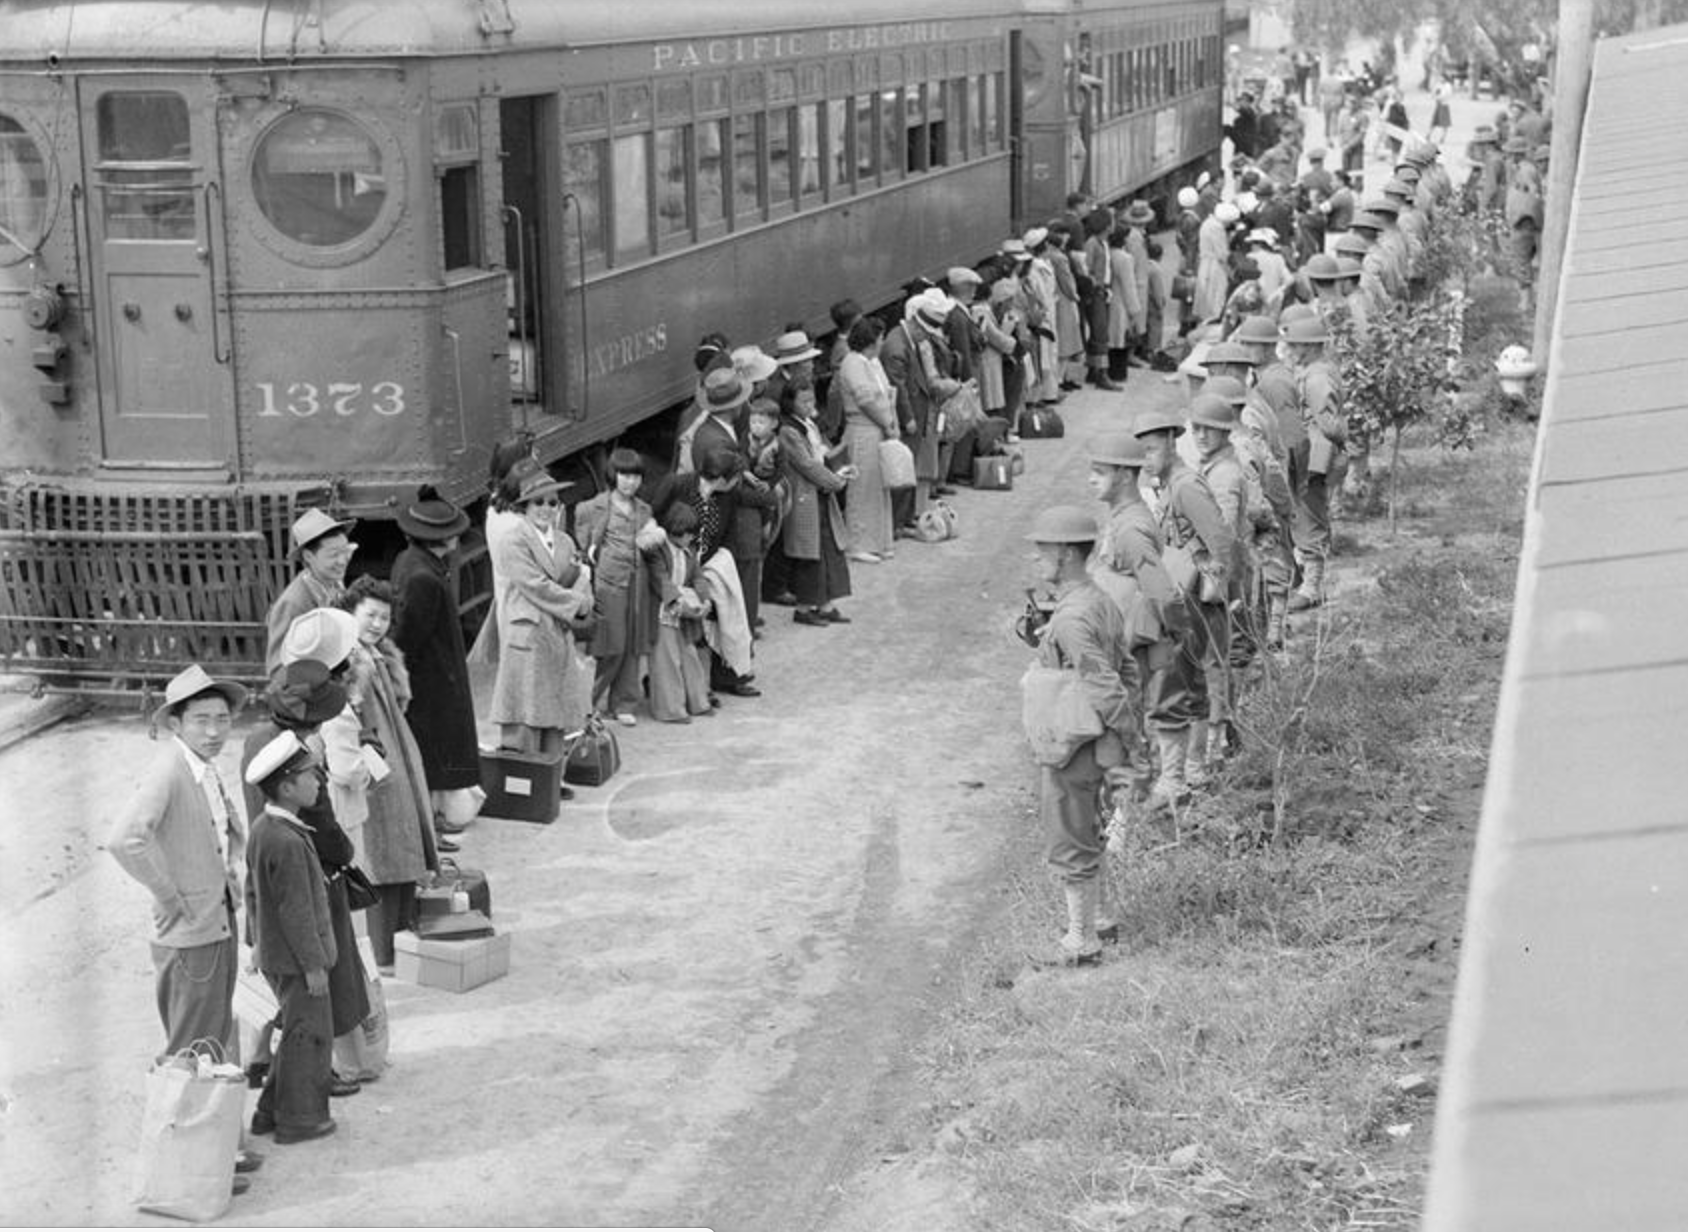
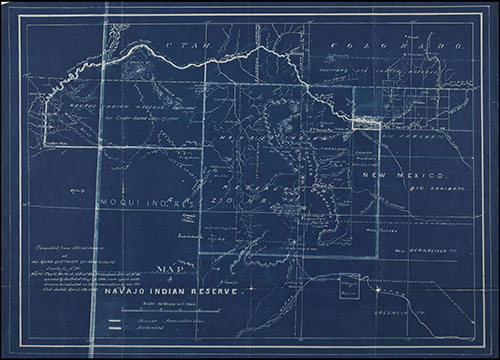
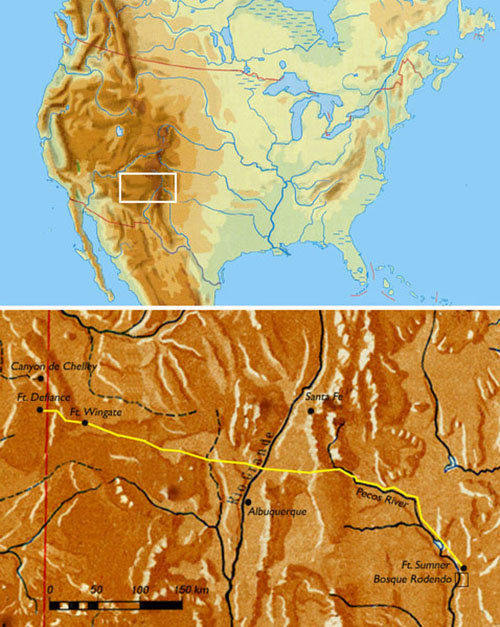
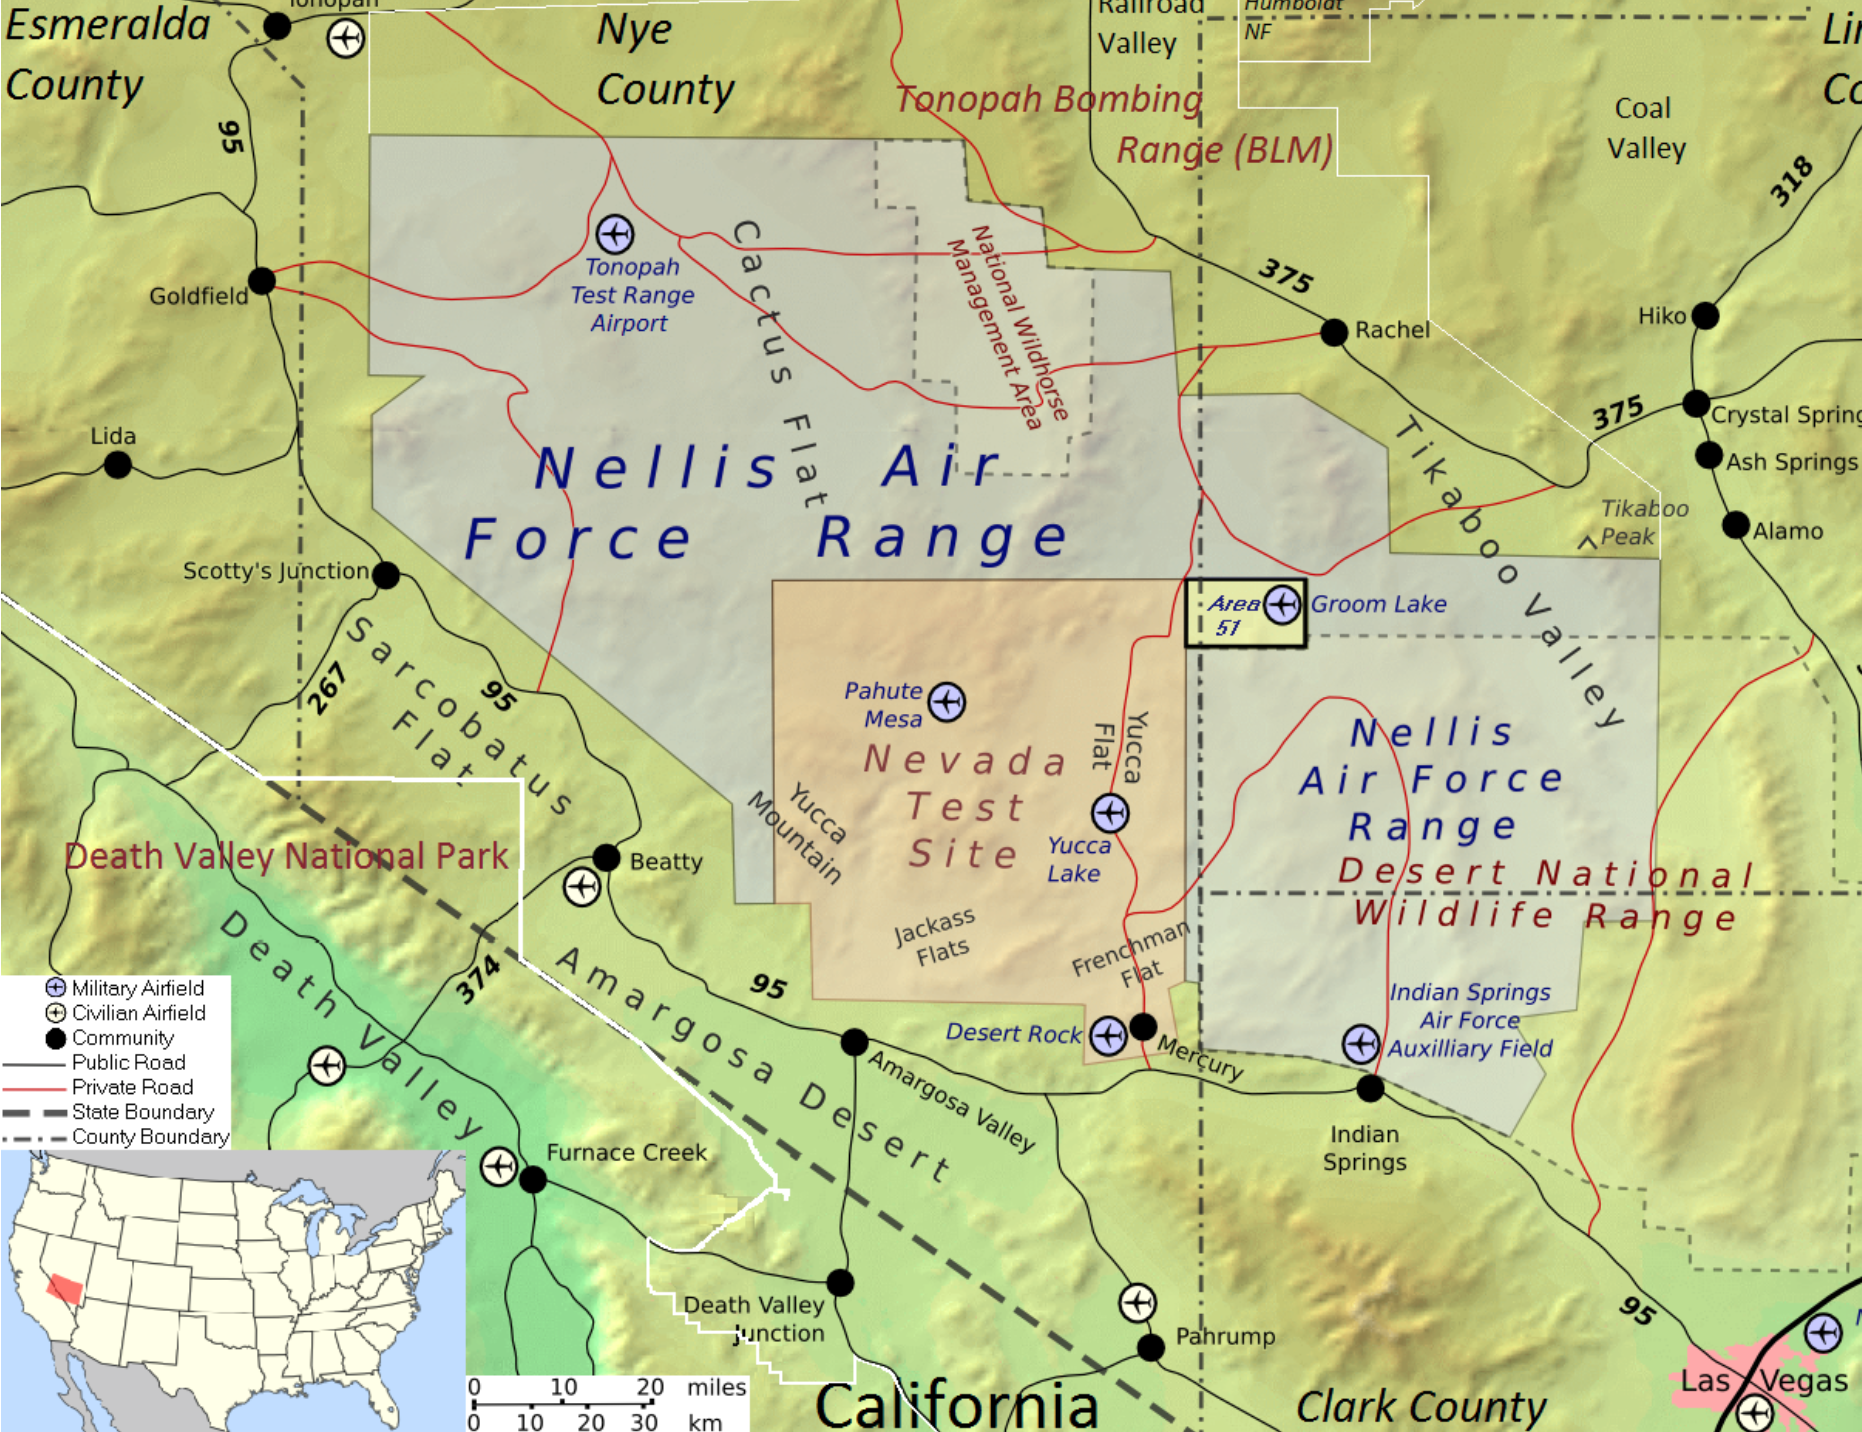
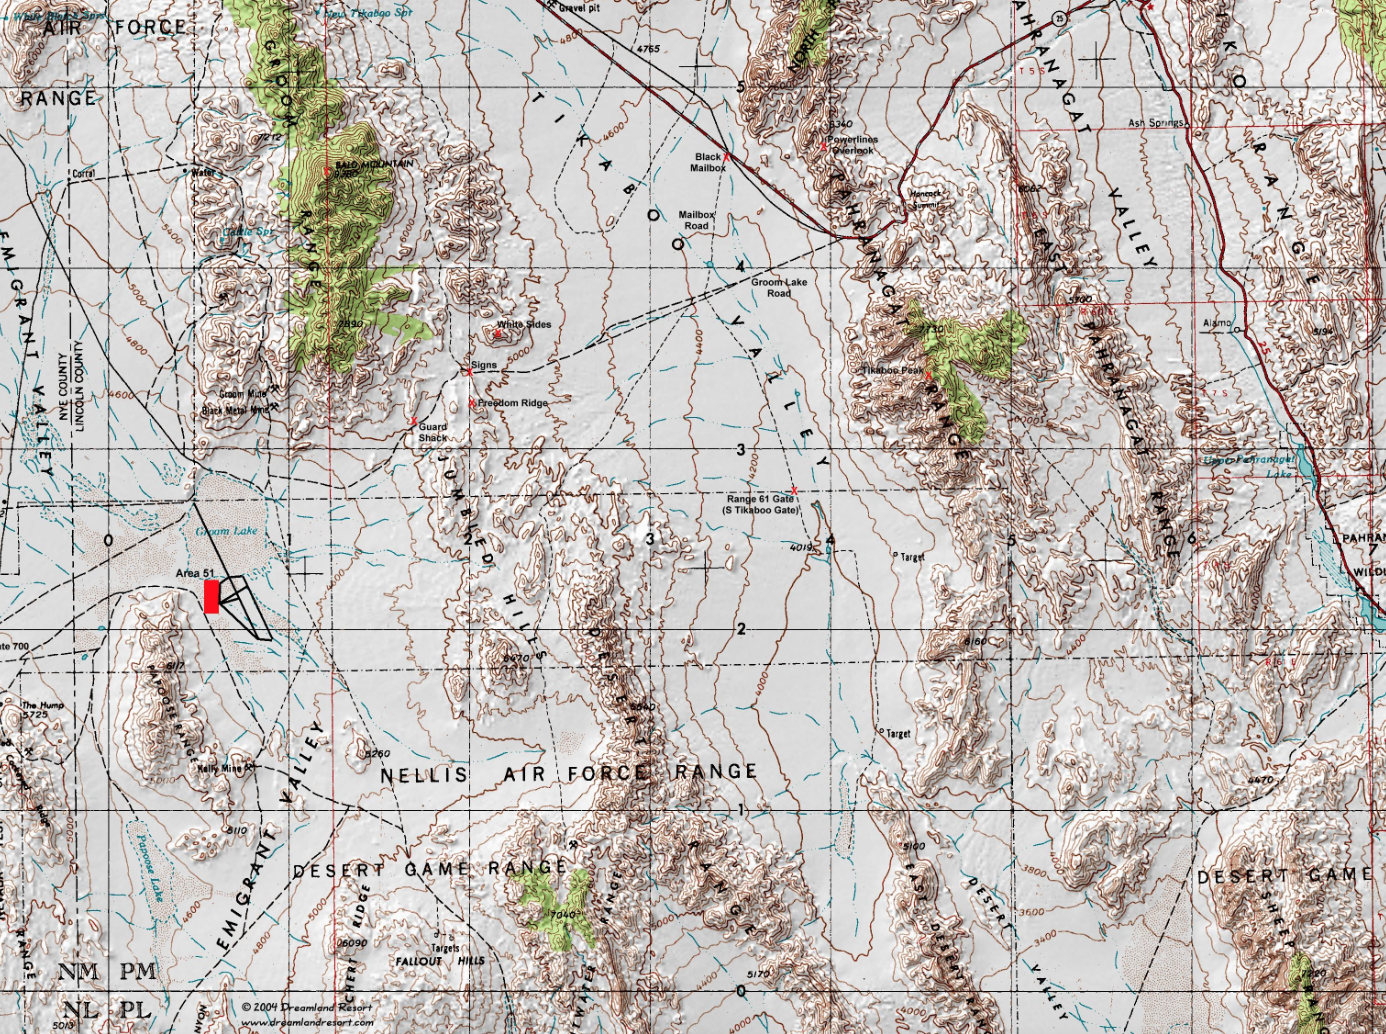


 Maher Al Mounes/Agence France-Presse/Getty Images, March 27, 2016


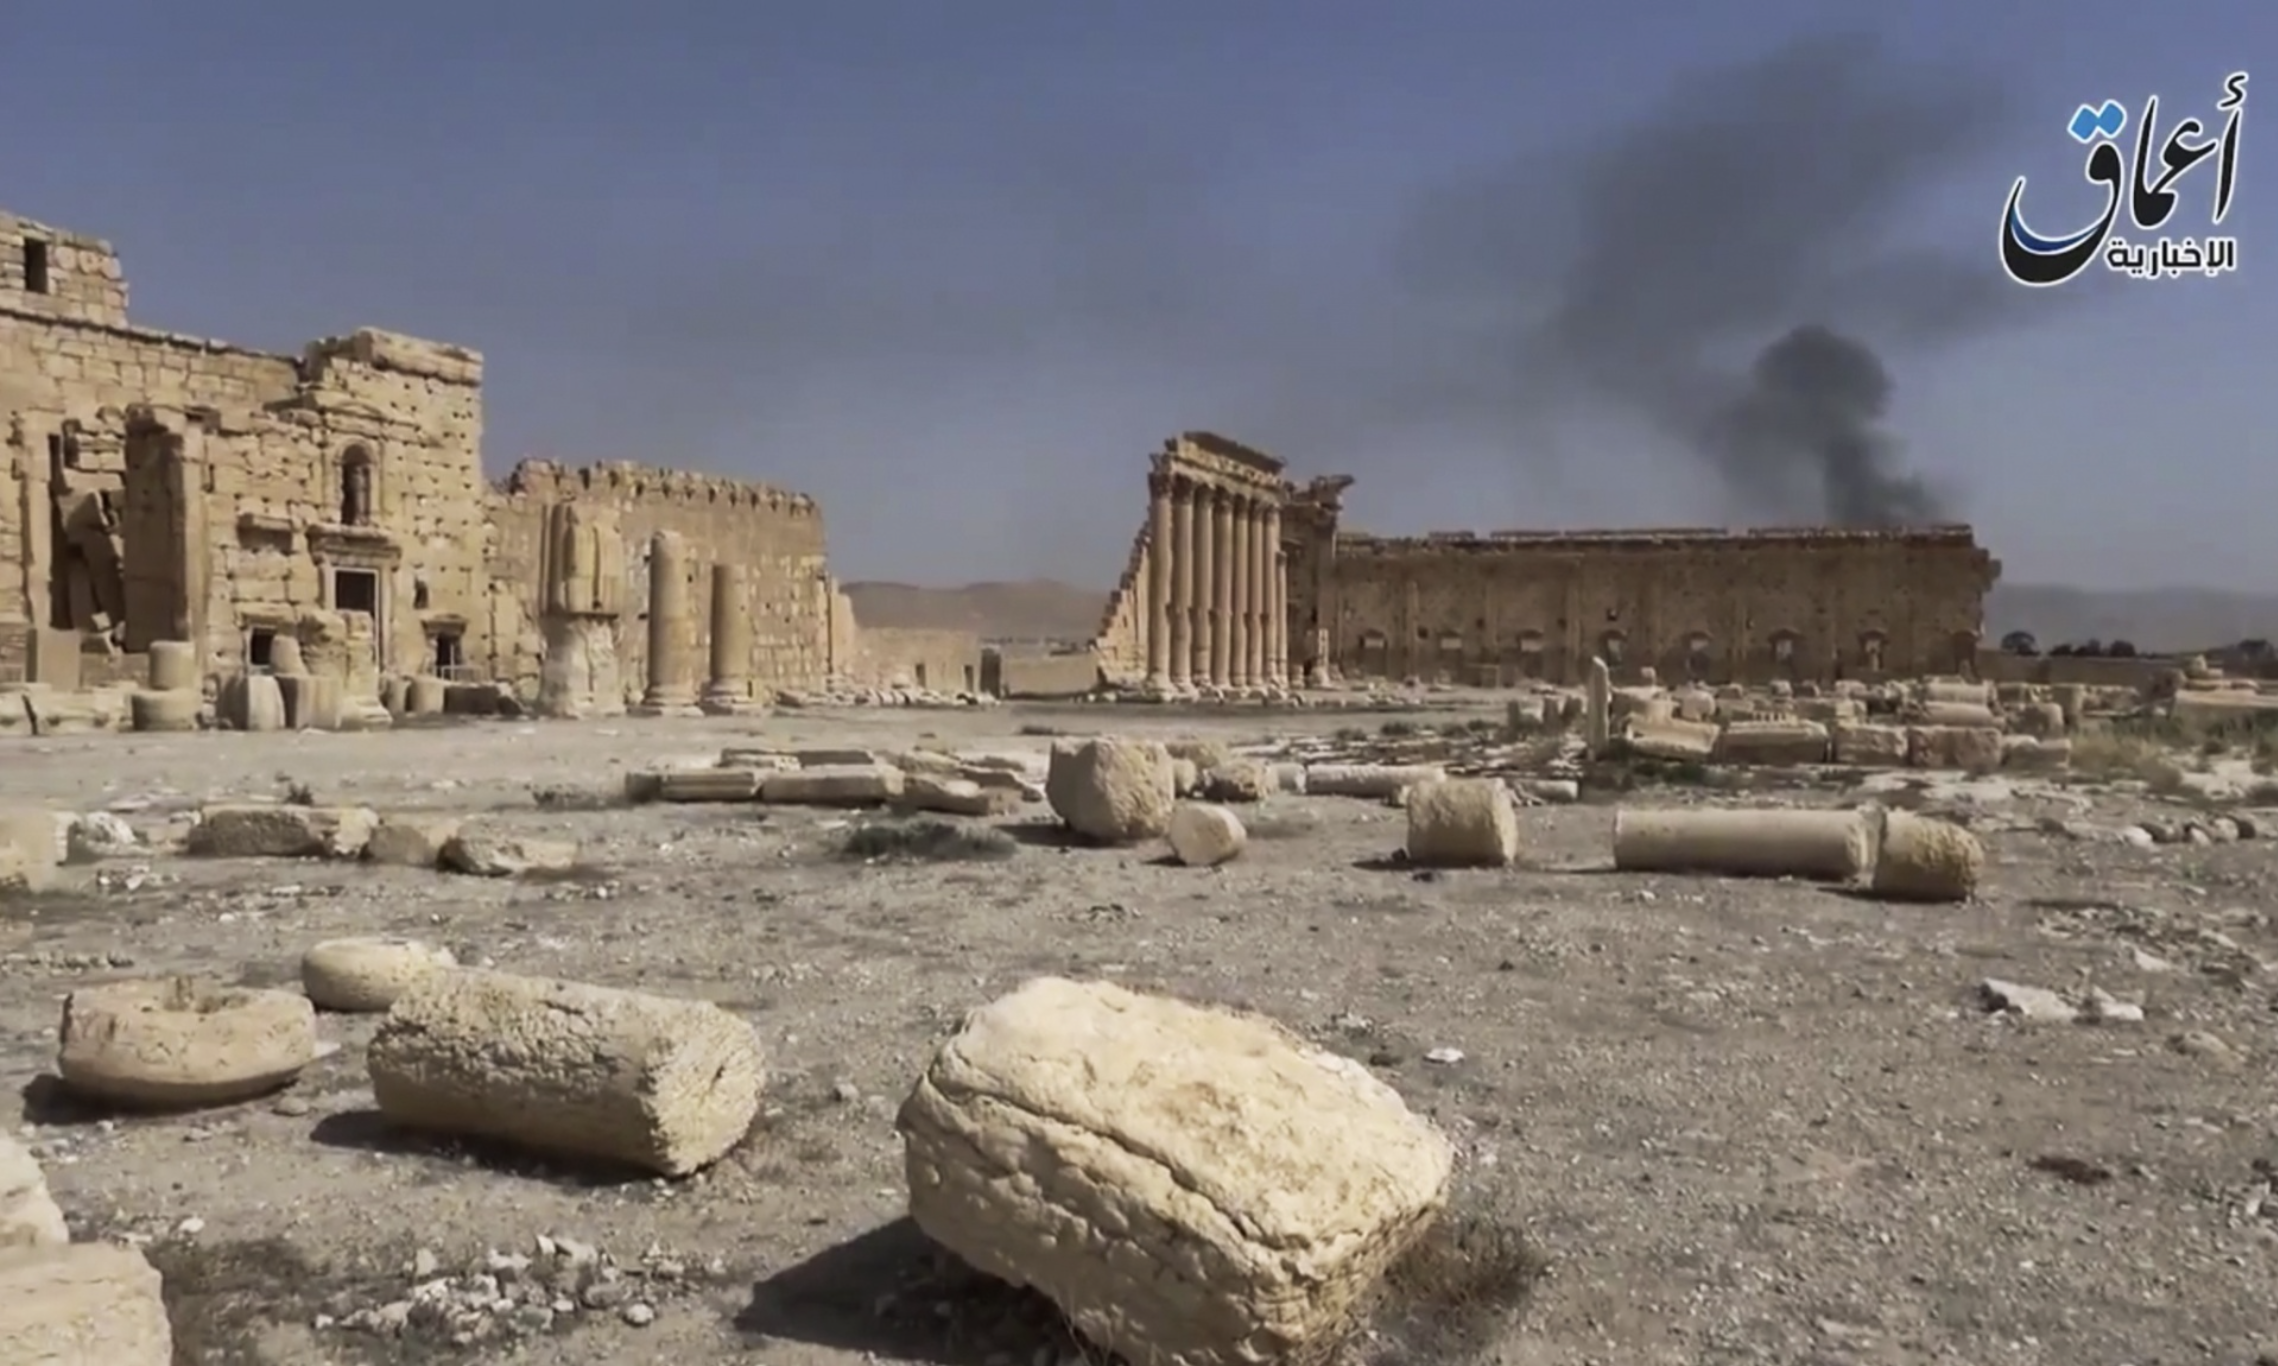

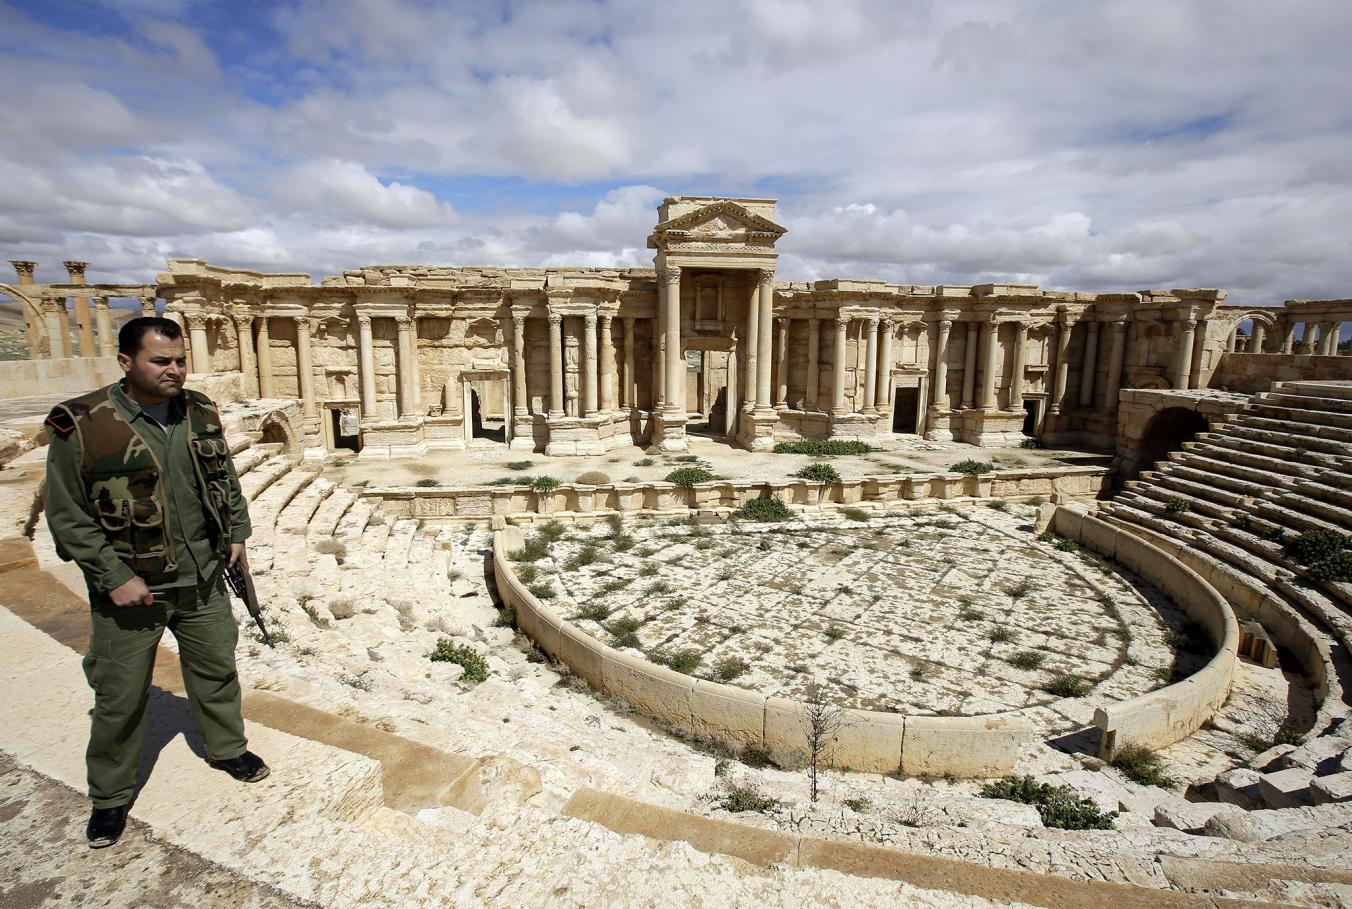


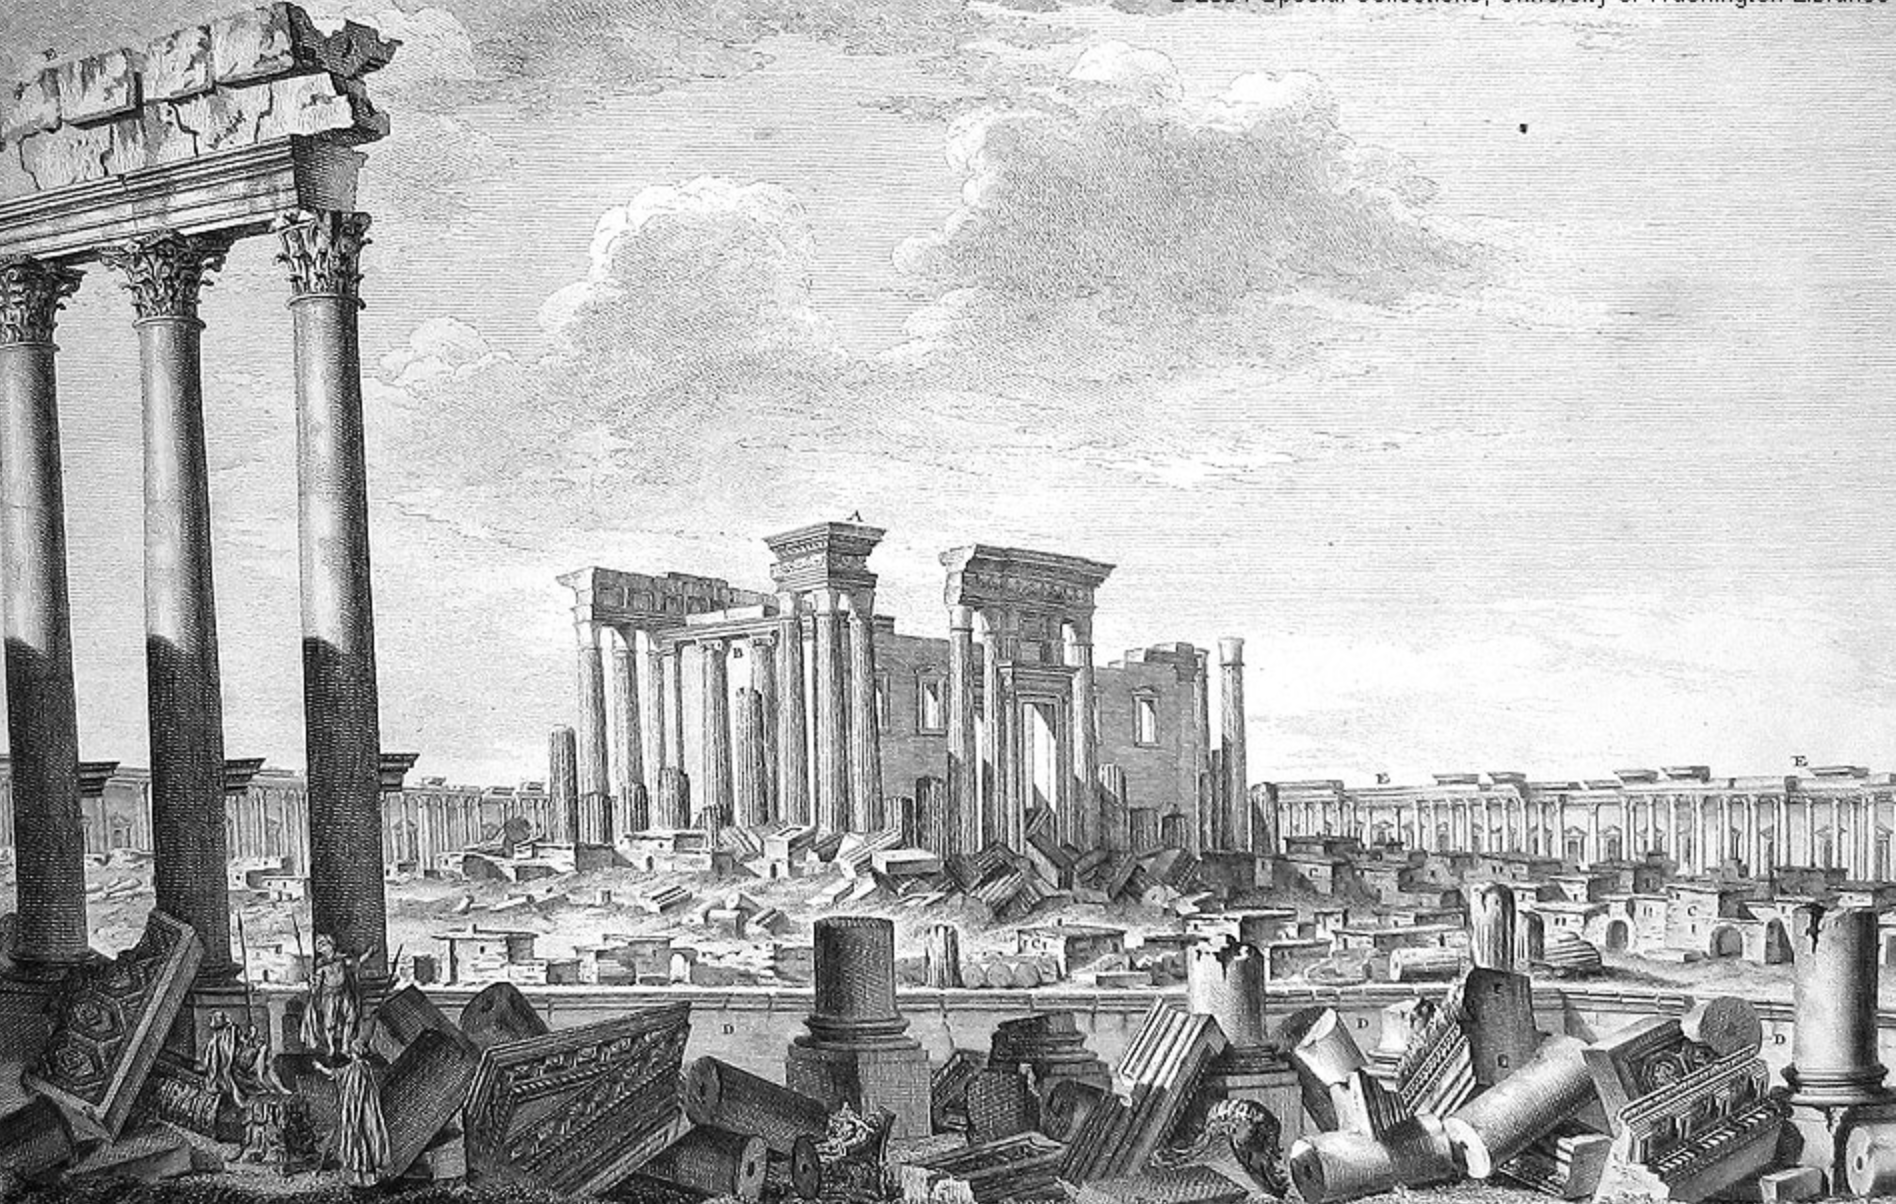

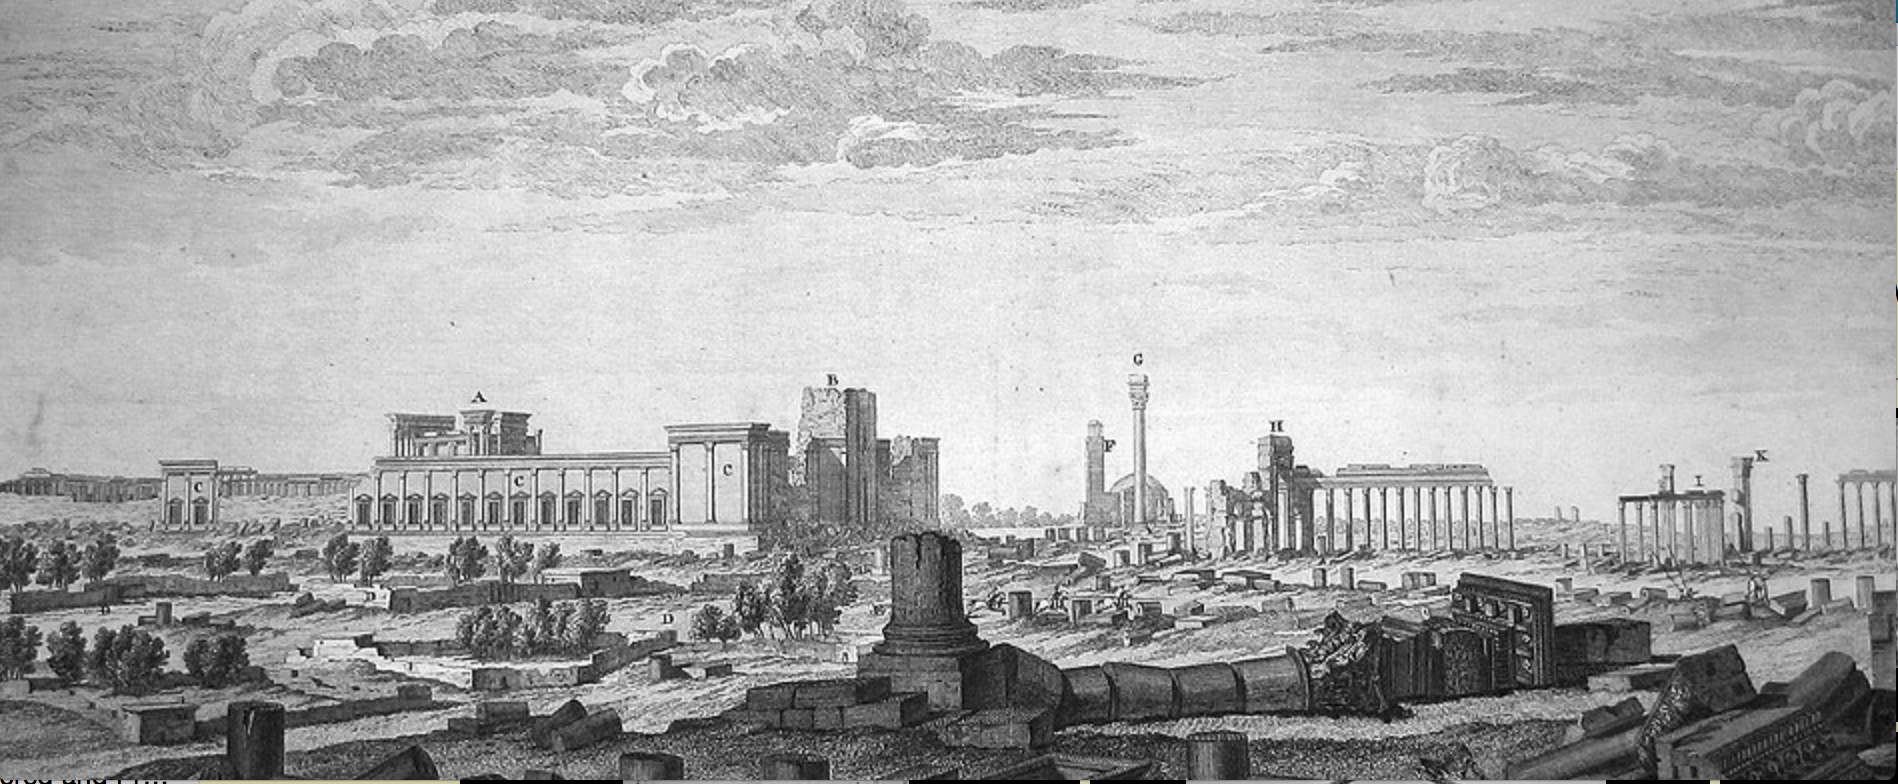


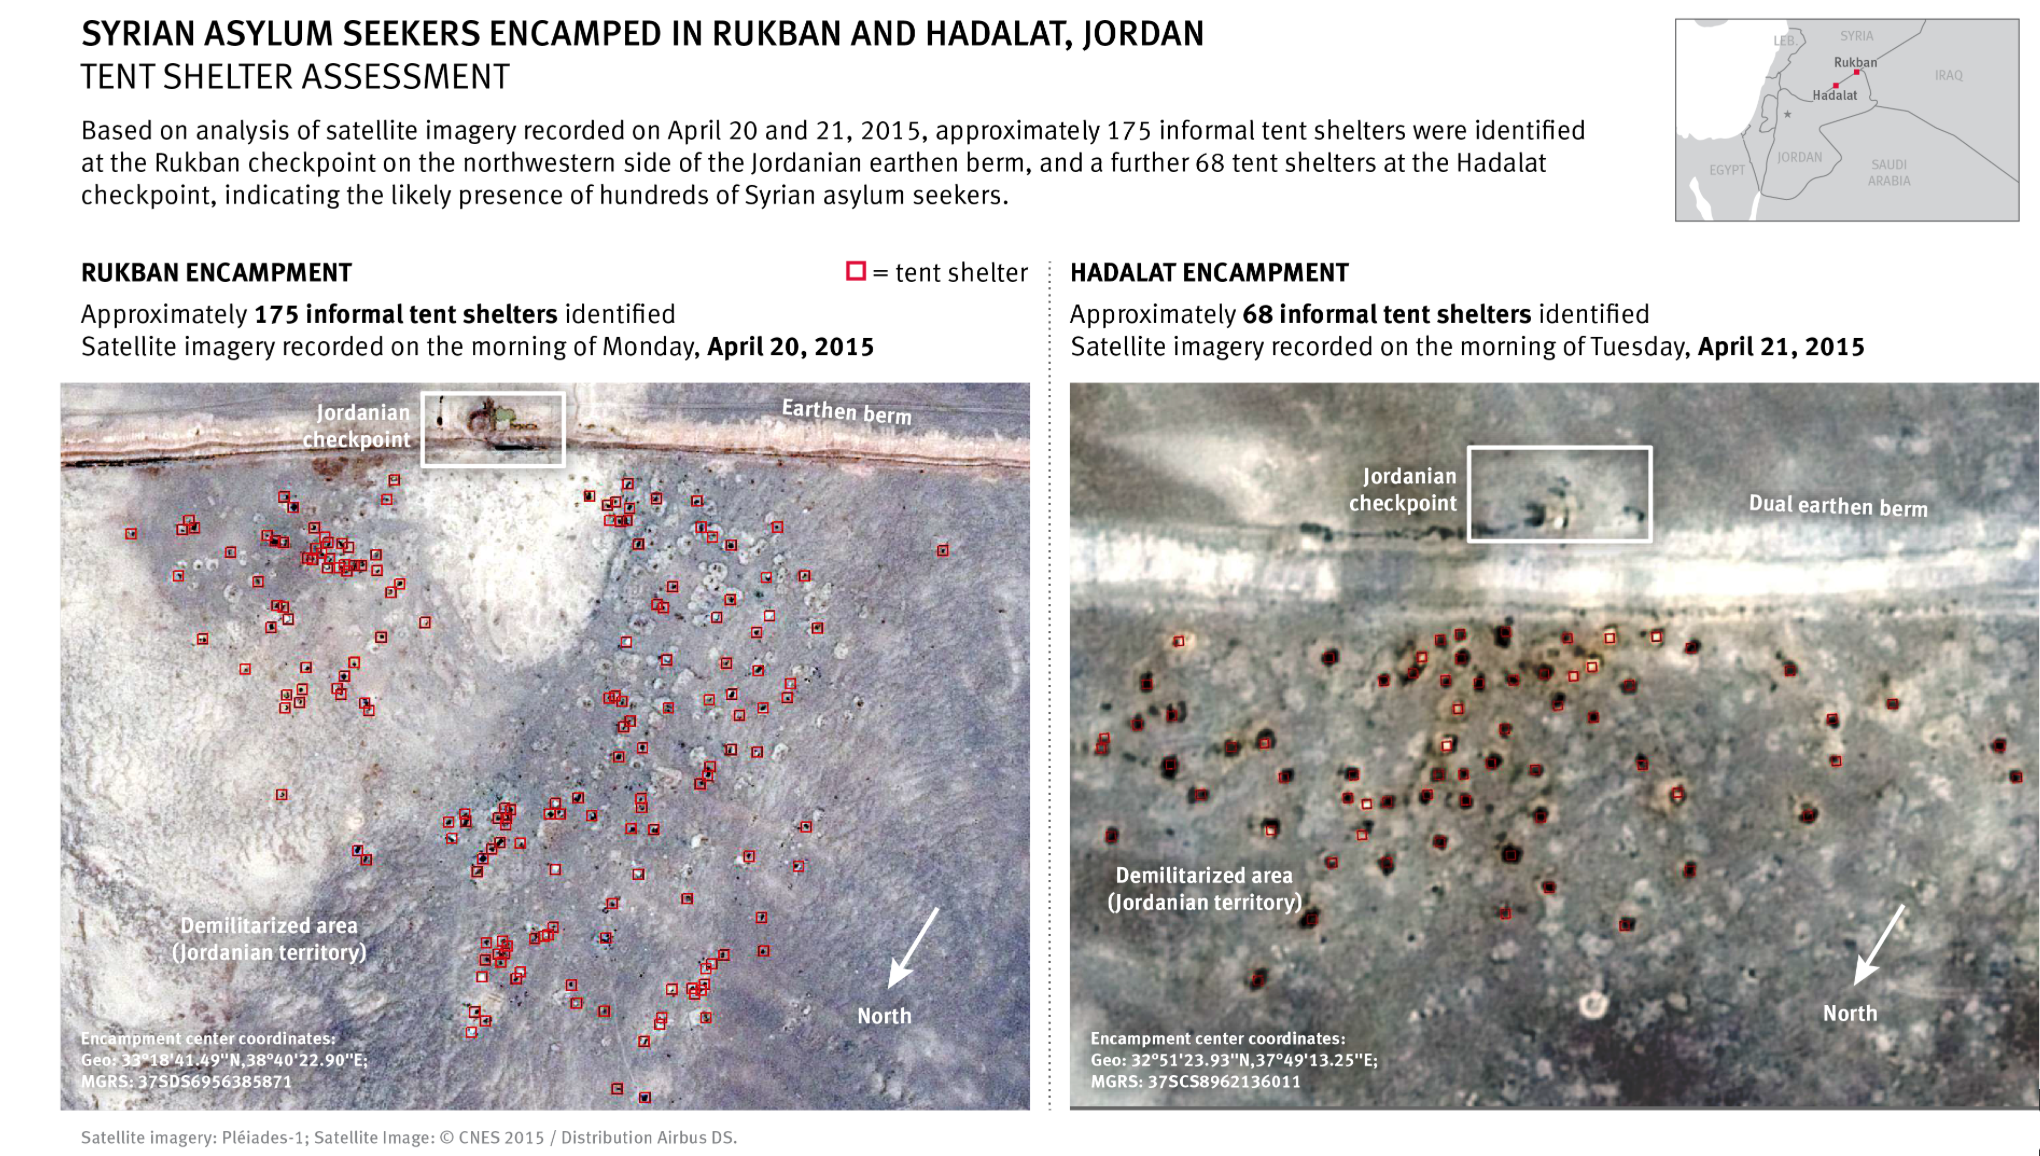

