Tag Archives: American inequalities

Distance Learning, Disrupted Learning & Social Eruptions

On a morning walk, my mind turning to Dr. Anthony Fauci’s injunction to exercise, I daily move between the many signs posted outside houses in my neighborhood congratulating graduates of the Berkeley CA public high school my daughter attends or Oakland’s School of the Arts and Tech, ending among million dollar homes sporting yard signs congratulating graduates of elite private schools. This is America, and not uncommon. The path I take traces yawning shifting divides of public schooling across America in the most blasé of ways. The uneven distribution of different schools barely conceals the deep divisions between schools and families seems to widen in terrifying ways as the coronavirus pandemic continues to ravage the nation. While we are shocked to learn that Donald Trump delayed informing the nation about coronavirus not to panicked markets, the lack of school policies stood only to magnify existing fracture lines: for the failure to provide any overarching vision left school districts with the football as decision makers they are unequipped to assess of learning requirements in remote settings of learning, and to bear the weight of difficulties in shaping remote learning programs without training.

Ill-equipped boards are asked to struggle in high pressure situations with finding ways of engaging students increasingly removed from one another or instructional settings. Increasingly, states are offering regional guidelines, but the absence of a national policy may rupture public trust with the very schools on which the nation most depends, now treated as swimming in a laissez-faire sea without guidesposts in an already disrupted educational setting, raising questions of graduations, requirements, baselines of school performance, or even study habits and the value of coursework and requirements for diplomas or graduation, as the educational market long an unqualified good in America stands to erode.

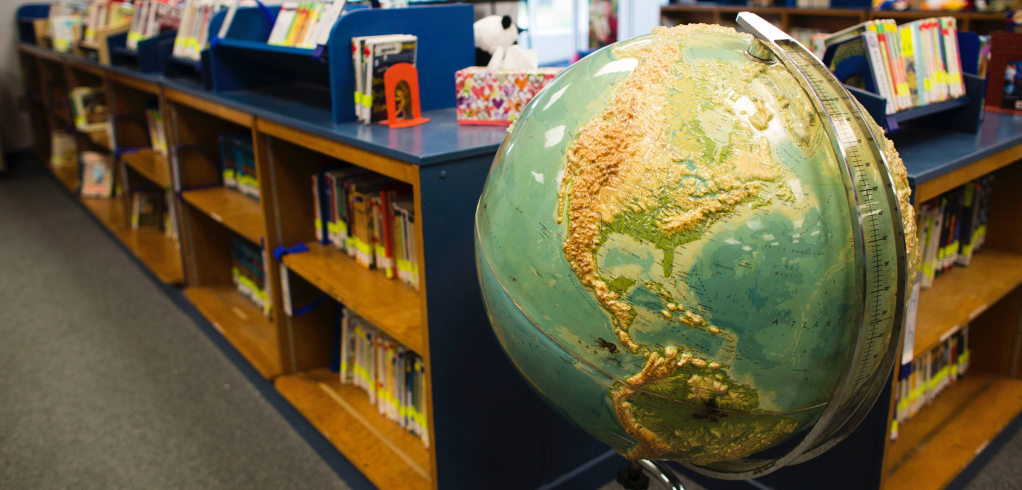
But if this might have been an opportunity for collective response, we have no evidence of any preparation to supplement what school networks offer, as if those who can afford the private tutors, off-site education, and private educational services are alone provided with continuing education, as other scramble to make up the gaps school closures create. Unprepared with a broader educational strategy in the midsized of a global pandemic, we have all in essence “left the library” of schools, pausing education or switching the nation onto a disembodied experience, that makes the old physical globes of schoolroom study seem emblems of a far less complicated past, when global topographies lay undisturbed beside books in cozy nooks, waiting, as it were, for new fingers to turn it with curiosity, while more and more schools are compelled to remain on the remote learning platforms to which they gradually shifted en masse over the month of March, 2020.

U.S. News & World Report/Bret Zeigler
Confirmed COVID-19 Cases, March 2020

The status of education–and of school closures and now school reopening–became a sort of political football. Despite the readiness of a switch to remote learning and online platforms of education, school closures echoed a cartography of abandonment, in unforgivable ways: if closures were born of necessity, and disorientation before the pandemic’s spread. And the levels of insecurity that have been fostered in the desire for mitigation may remind us that the problem of COVID-19 has been a crisis of public education, as much as a lack of frontline workers’ protective equipment–PPE–or adequate testing.

To be sure, the many functions that schools now provide across the social spectrum of the United States–meeting nutritive needs; offering social and emotional support and providing models outside the family for structuring time; minimal levels of health services–go far beyond being quantified by educational standards: by a magic trick of tests and quantification, government may have reduced education to metrics that erased their value as sites of community from the Bush administration, and led them to be sacrificed with deeper costs than many have registered. Without metric to tally schools’ dividends to students and communities, we omit the crucial educational role of instructing about coronavirus comportments–from regular hand washing to social distancing to mask-wearing, to bridge some of the enduring divides that have endured in the nation, with coastal “elites” donning masks more than the “heartland” of an expansive non-urbanized midwest.

Mapbox from Dynata Data/Upshot, New York Times July 17, 2020 (link to interactive map)

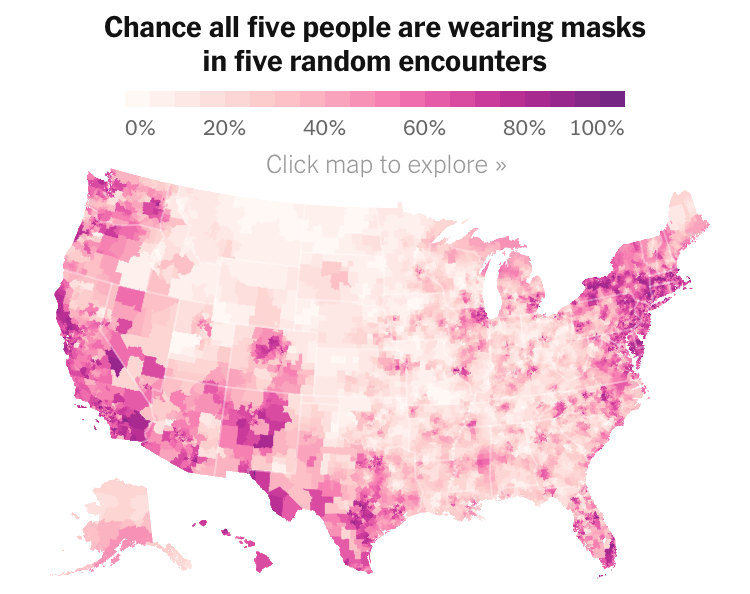
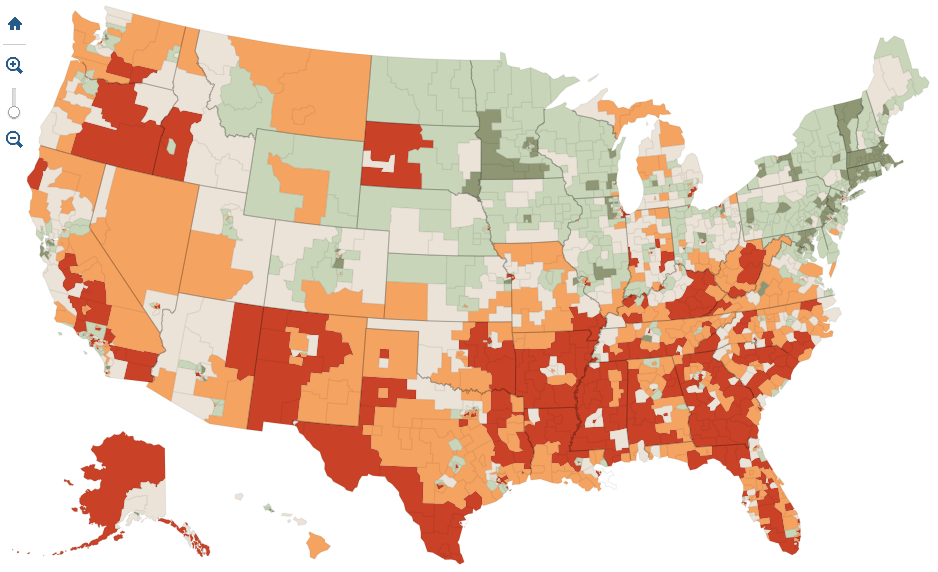
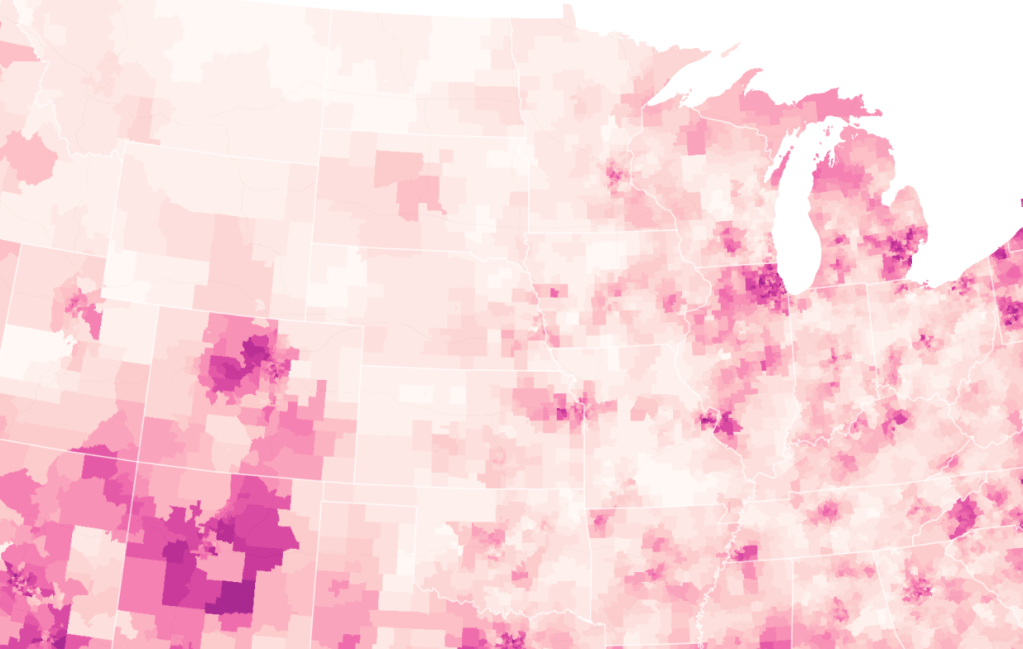
Is not the deep and tragic failure to not “educate” the nation to mask-wearing, sustained since the first cases of the coronavirus reached our shores, suggested the only the initial hot-spots where infections ravaged communities in the New York tristate area, Seattle, the Imperial Valley and coastal California, and central Texas are sites of mask-wearing, with Chicago, Detroit, Denver, the southwestern border and coastal southern Florida and Tallahassee. Only a fifth of the time or less were all five people who might meet at a large part of the nation likely to be wearing protective masks.

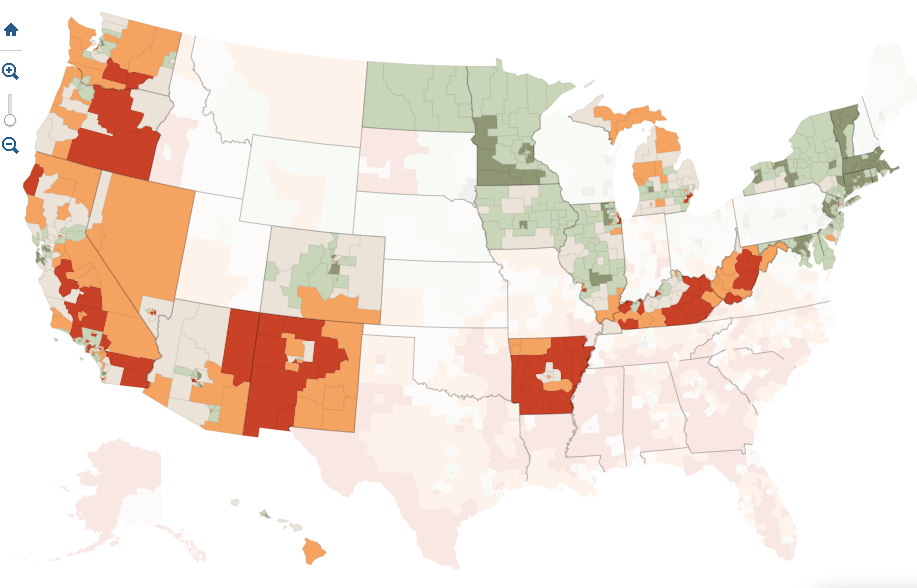
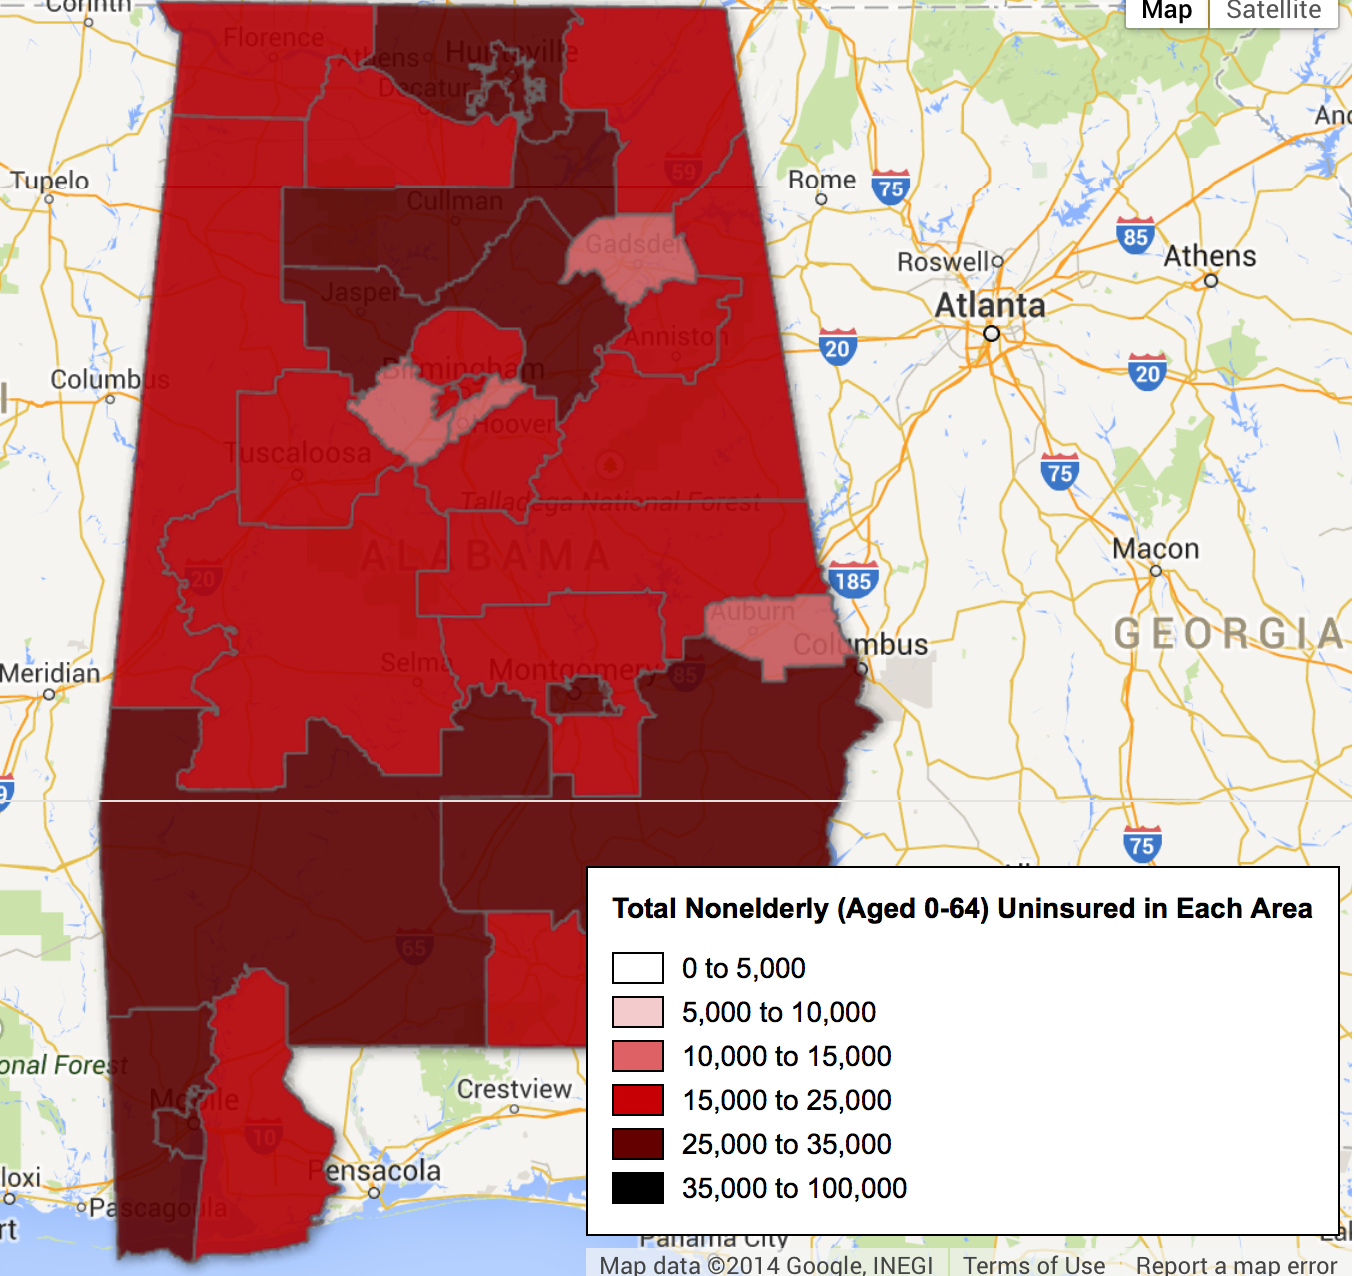
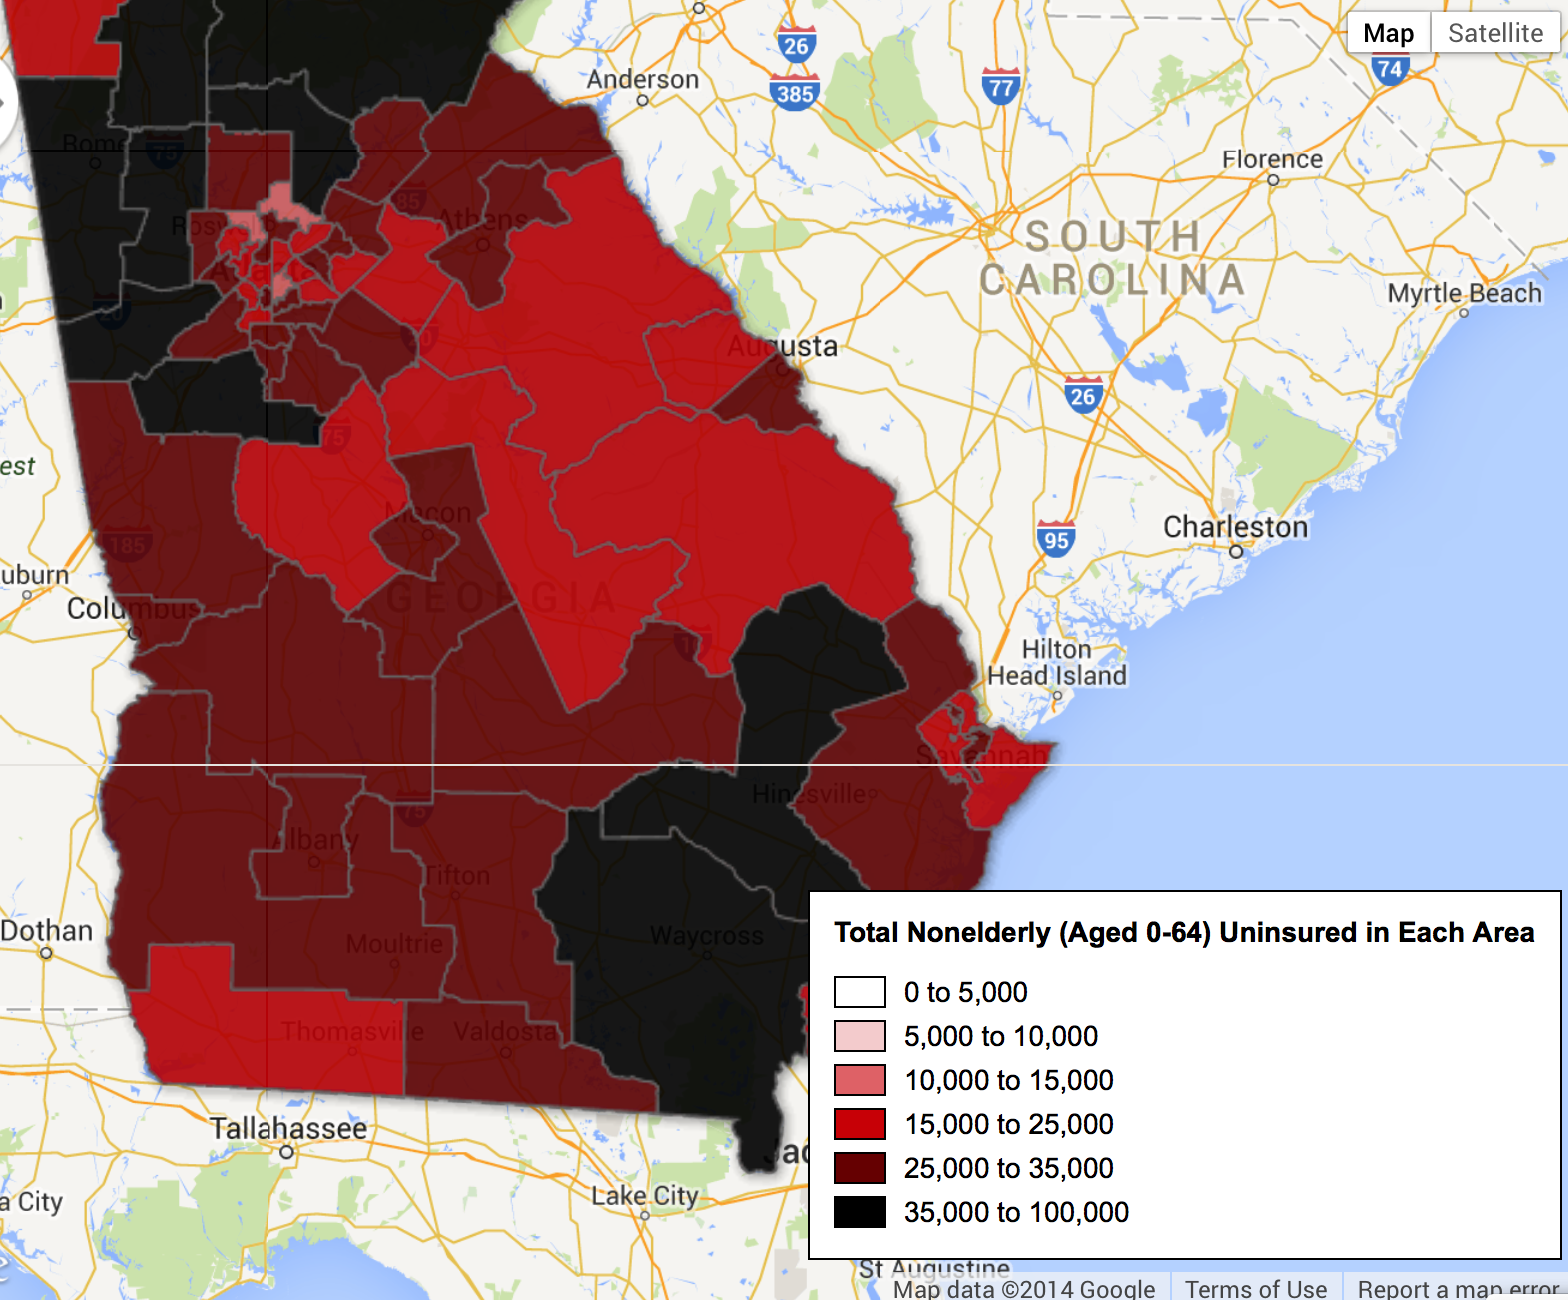
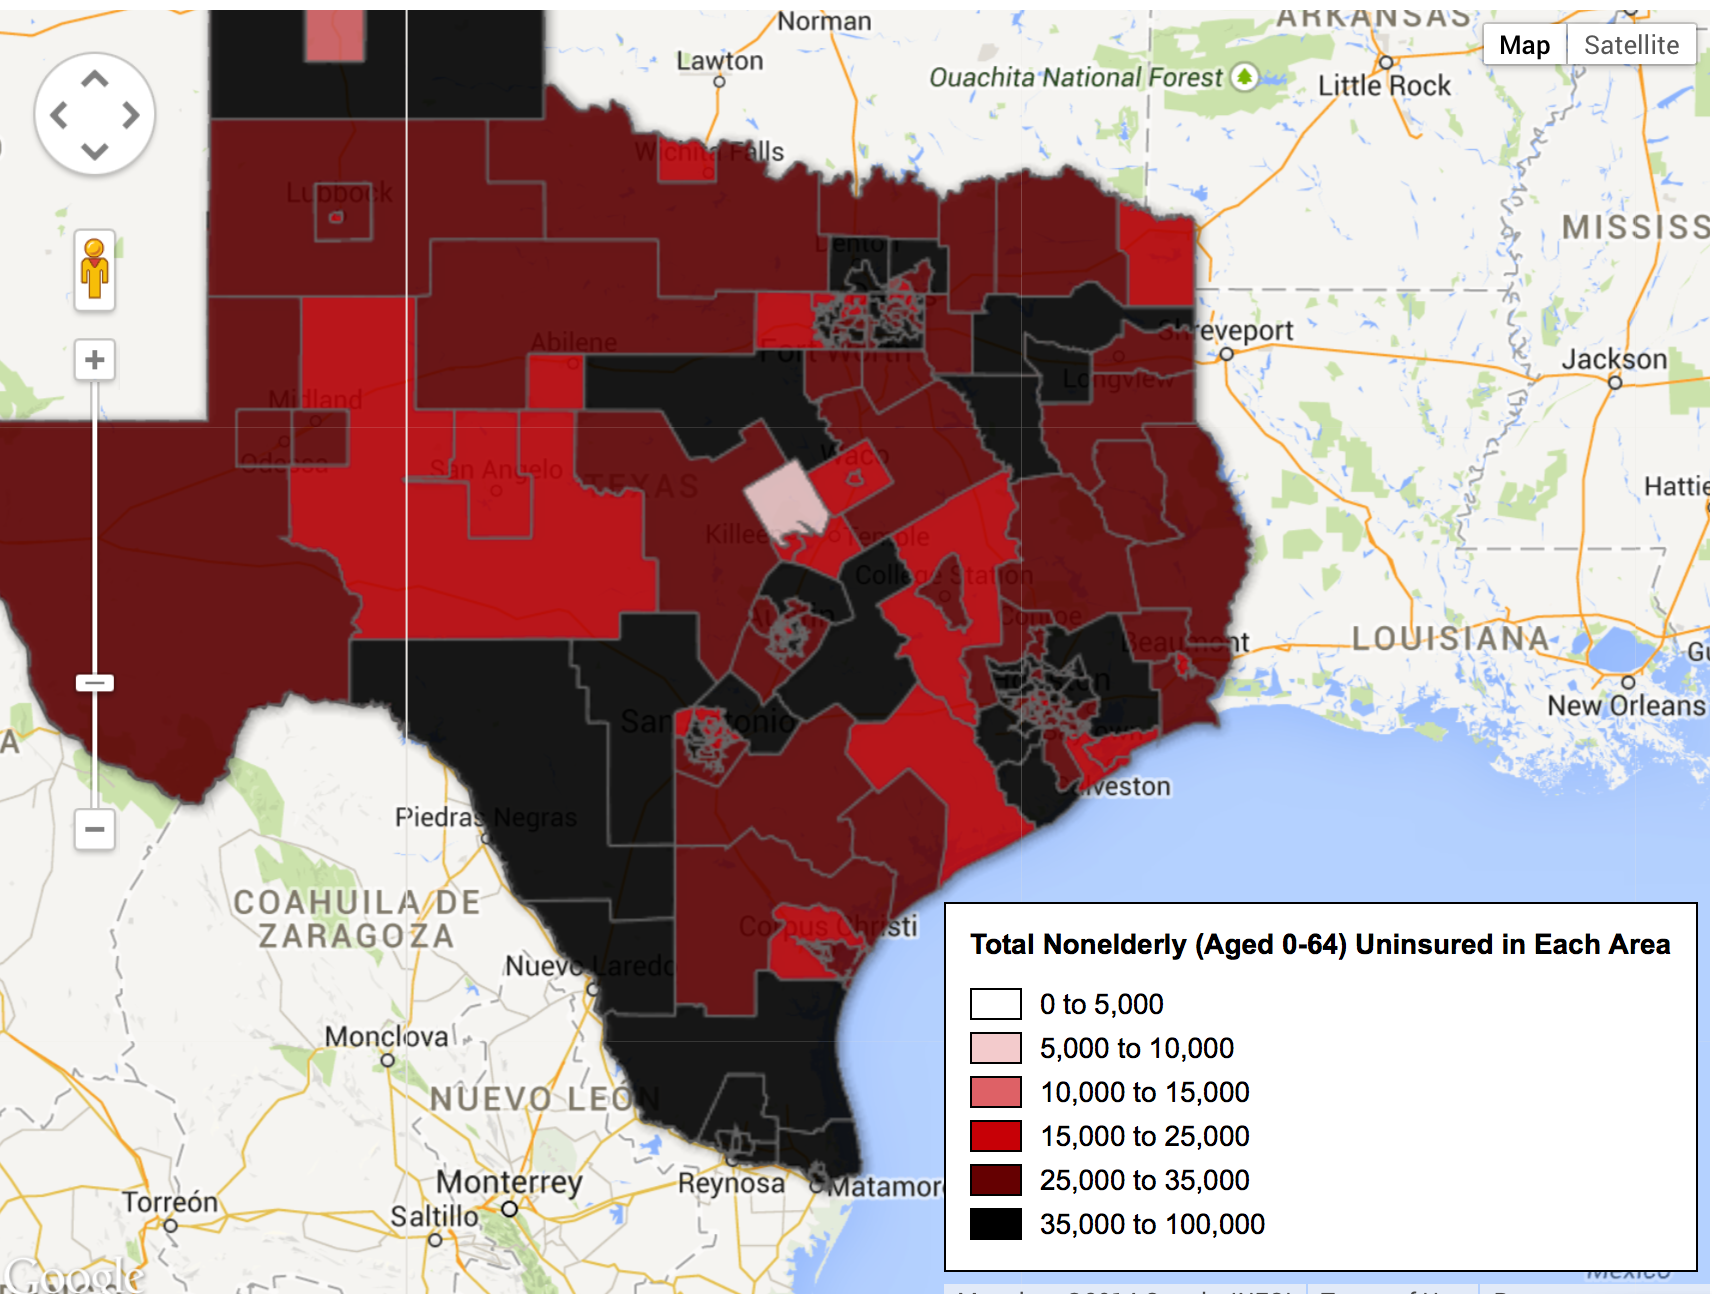
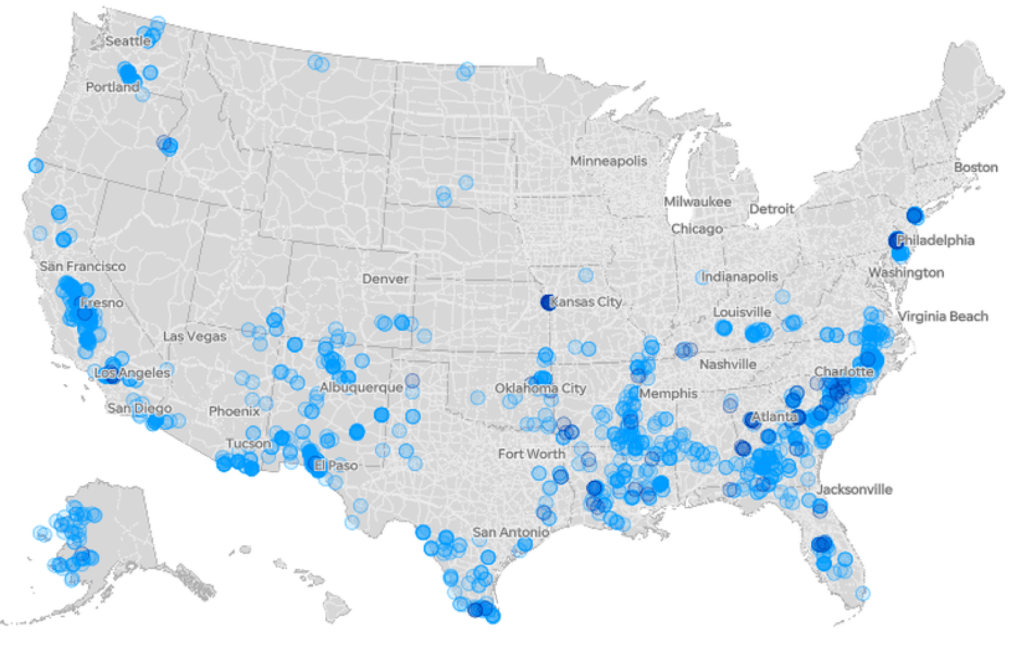
Why is such a paucity of mask-wearing continuing save an absence of public health education? There is a predictable if terrifying congruence with areas that were themselves, by the proxy of underserved medical communities Mitchell Thornson mapped, also by a Mapbox distribution of commute-based health centers, rather than by counties, to suggest the sites most vulnerable to disasters such as viral infections: even if the promise of a complete count of infections recedes, the inhabitants of some 300 counties underserved by federal health services suggests fault lines of future sites of vulnerability, that may accentuate with continued school closures.

Mitchell Thorson, clinics in counties medically underserved and vulnerable to disasters. featured in USA Today, March 31, 2020

These steep inequalities of health care suggested a very broad difference in those able to weather and sustain COVID-19, to which the Trump administration seemed blind. School closures created insecurities for American families was perhaps not different from globally, but they lacked any support network: social support had withdrawn to schools in the United States more than other nations. The lack of any narrative of the sudden closures, and interruption of human contact and resources that followed, were deeply disorienting. And the lack of oversight from a government that one expected, perhaps with little grounds, to provide a sense of purpose and oversight in an unprecedented health crisis was, unbelievably, punted to the states, and from the states to local school boards, utterly unprepared to cope or plan–as admittedly, even are many medical specialists and health professionals–with the scale of a pandemic.

It seemed like a charade of government effectiveness; Secretary DeVos shifted from leniency, lack of coordination, to steadfastness concealing unprecedented circumstances. And the recent possibility that private schools and sites of instruction will be allowed to open their doors, while poorly funded public schools serving adjoining communities, if sometimes distinct demographics: whereas public schools that serve up to 90% of American children–just short of 51 million (50.8) by federal projections–open for restricted hours if at all, private schools possess the needed funding for on-staff epidemiologists, thermal scanners, and additional teachers–as well as often enjoying more space.

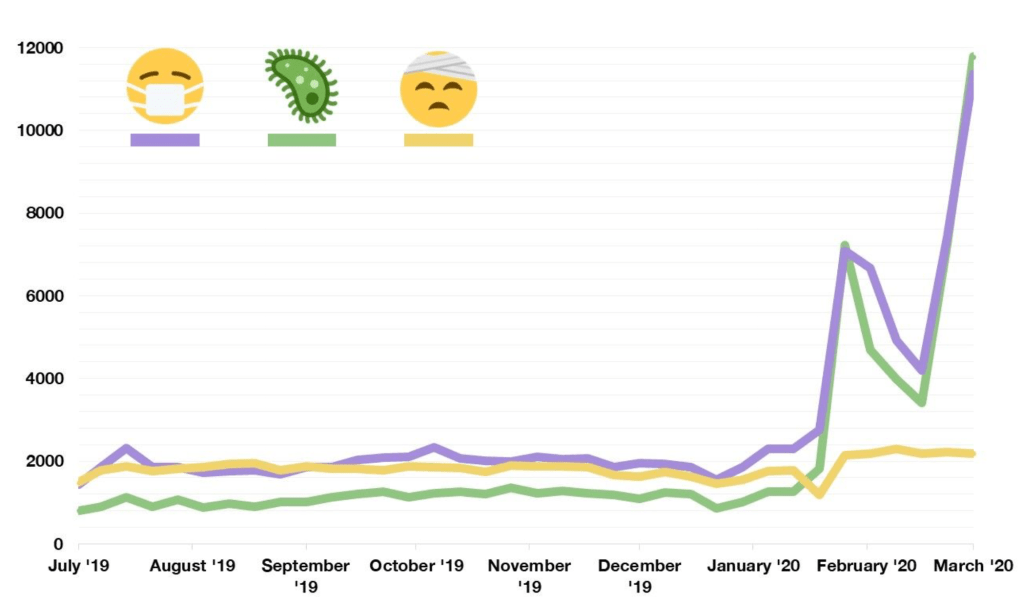
The Emoji Icon Index tells at that on Instagram, the story of a skyrocketing use of the  😷 emoji from early March, as the. Face-with-Medical-Mask rose in use in parallel to the icon of the virus, but a plan for schools, quickly shuttered in China, was not imagined, as wishful thinking prevailed.

While our nation is prepared to react to the novel coronavirus by high-level cabinet meetings to bail out airlines after summoning executives or the bail out of banks, school are evidently far lower down the list. If Donald Trump prioritized cabinet-level meetings on bailing out the airline industries to ensure the Dept. of Treasury provided passenger airlines $25 billion, cargo haulers $4 billion, airports $10 billion and airline contractors $3 billion as industry lobbyists demanded to recognize a 95% reduction of passengers in response to the epidemic, saw meeting with executives to work out that deal worth the time of health officers and coronavirus response team–

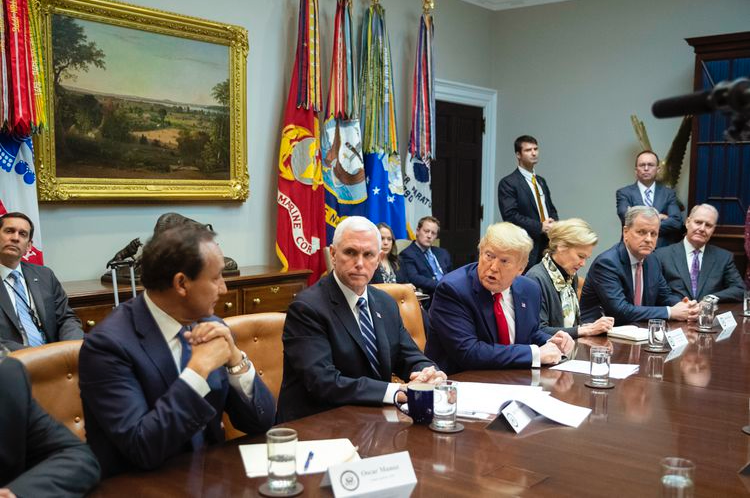
–while he saw no similar body of school executives with whom he might meet in one room around a glistening desk with nametags, mugs of coffee and glasses of water. A past President of the P.T.A. of an Alameda CA public elementary school was familiar with reduced funding of California’s public schools since rollbacks on property taxes, smarted at the clear contrast of inability to prioritize public schooling as part of our national infrastructure. Is it not most probable that the very corporate structure of the airline industry provides a more familiar set of faces to interact earning high incomes, unlike the leaders of the dispersed structure of public schools, or community voices, that Trump is so much more apt to dismiss and neglect?

Or is it that the nation is ready to sacrifice the public schools that are less likely to have the funding, save in wealthier districts in Durham, NC or Charlottesville, VA, echoing lines of a deep class divide? Not only were private schools prepared to devote attention and benefited from technological resources to transition to online platforms in the Spring, but are able to use larger buildings and reduced class sizes to benefit the children who attend them, while the aging ventilations systems of older buildings of public schools lie on the other side of a technological divide that plagues the nation.

To be sure, there are deep discrepancies–informing the Mapbox Upshot map, of which one might be rightly suspicious given the potentially unsound sampling practices based on the interviews conducted by Dynata, both in the United States and globally,  based on 250,000 survey responses between July 2 and July 14; the surveys administered by a firm boasting to provide businesses with a sense of global trends of consumption able to reorient businesses and advertisers to “re-opening,” but while showing vast expanses with relatively lower incidence of a group of five wearing masks–

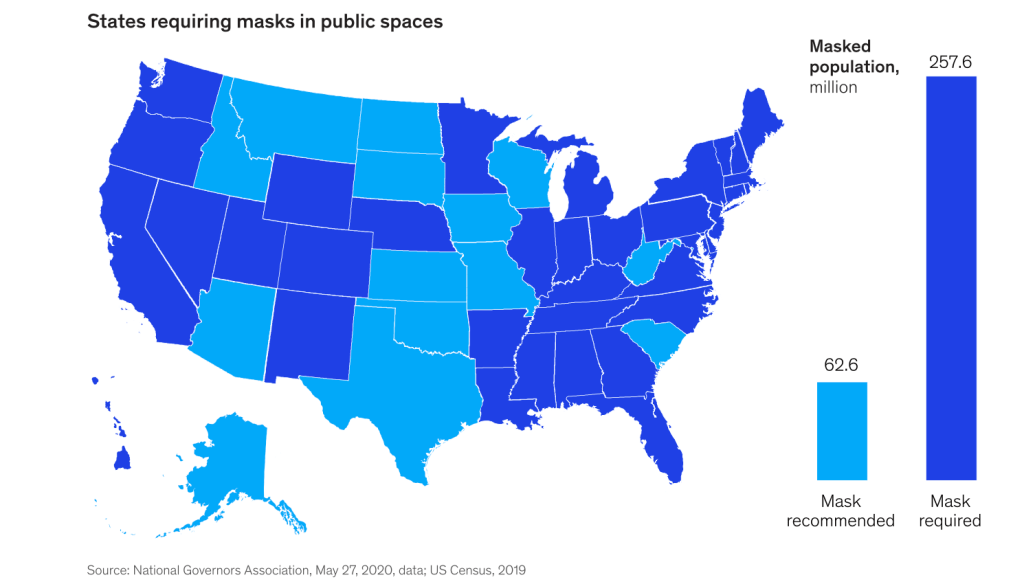
–fails to acknowledge a rift among state governors who recommend masks, rather than require mask-wearing–or the considerable role that mayors have consistently played in advocating mask-wearing, if they often appear over-ruled by governors who have been filling the absence of federal policy: the looses of “recommendations” in Iowa, Wisconsin, Missouri, and Oklahoma, Kansas and the Nebraskas meant that only in some cities, where mayors had advised protective measures, was mask-wearing adopted, creating a terrifying prospect for the pandemic’s future.

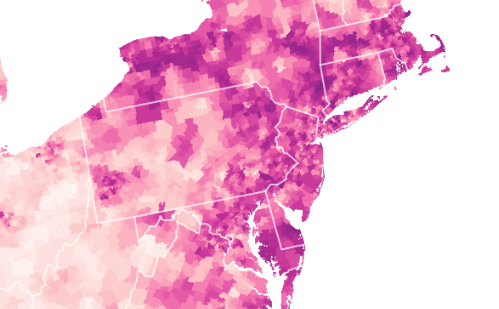
When Fauci addressed the question of health disparities between race, he reminded the nation stoically that “we are not going to solve the issues of health disparities this month or next month . . . but what we can do now, today,” the voice of reason was probably far less reasonable for many, who had already tuned out, before he described the need for social distancing that was, in fact, a privilege for many. The mottled nature of northeastern communities the Dynata found in its interviews suggested an uneven terrain of mask-wearing policies, even in the Tristate Area, dictated by individual choice–and underscoring the lack of regional or federal policies.

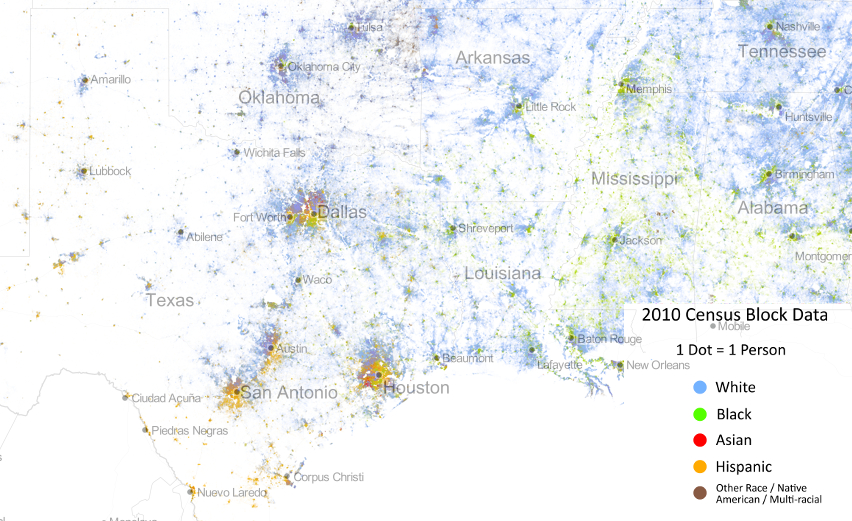
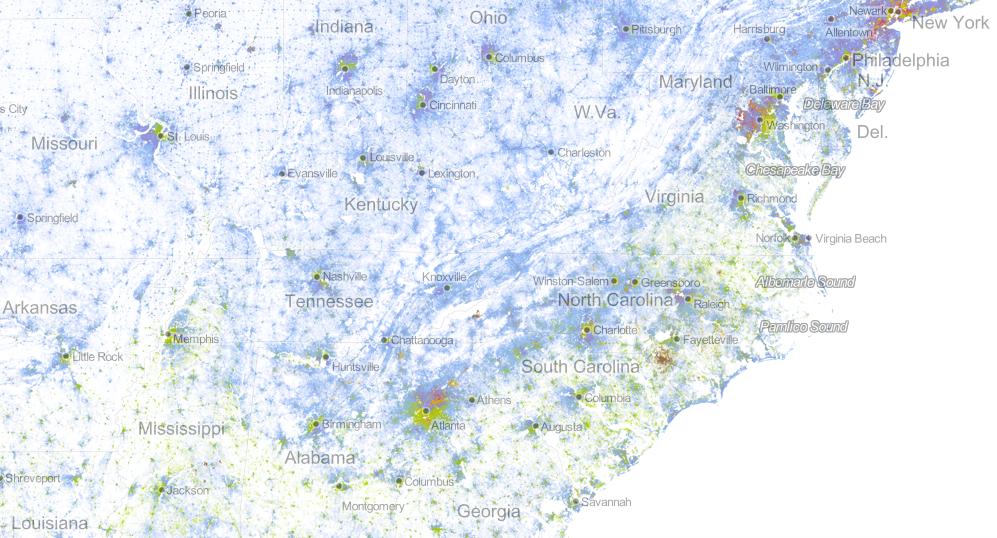
The social topography of crowding, of second homes and of gardens or access to parks that was revealed in the Bay Area made us think in practical terms to egregious inequities that were perpetuated by sustained lack of investment to resolve pronounced racial disparities in health came as COVID-19–and the uneven landscape revealed as the coronavirus tore through communities where it was contracted in the United States. The revelation of inequalities was striking, as it suggested how communities experienced it quite differently, and the question of access to education–and access to remote education–cut across social divides in profoundly different ways.

The almost purposeful pronounced lack of master narrative in confronting COVID-19 was long apparent. President Trump, grasping for authority as a true authoritarian playbook, argued the situation demands force, as his removed son-in-law, the dauphin Jared Kushner, spun 60,000 deaths from COVID-19 as a “great success story,” as if to challenge the nation’s personal narratives with a monolithic storyline of a disconnect from communities which were ravaged by hospitalizations. In claiming his father-in-law created a “pathway to safely open up this great country,” Kushner radiated overconfidence as he painted a future as rosy as the marble atrium of Trump Tower, even when the figures didn’t add up. It was akin to Trump’s 1993 proclamation, after huddling with bankruptcy lawyers to obtain new lines of credit, having had “the most successful year I’ve had in business!”–he reprised in a compulsive act of boosterism over the next decade, and continues to rely upon in the pandemic.

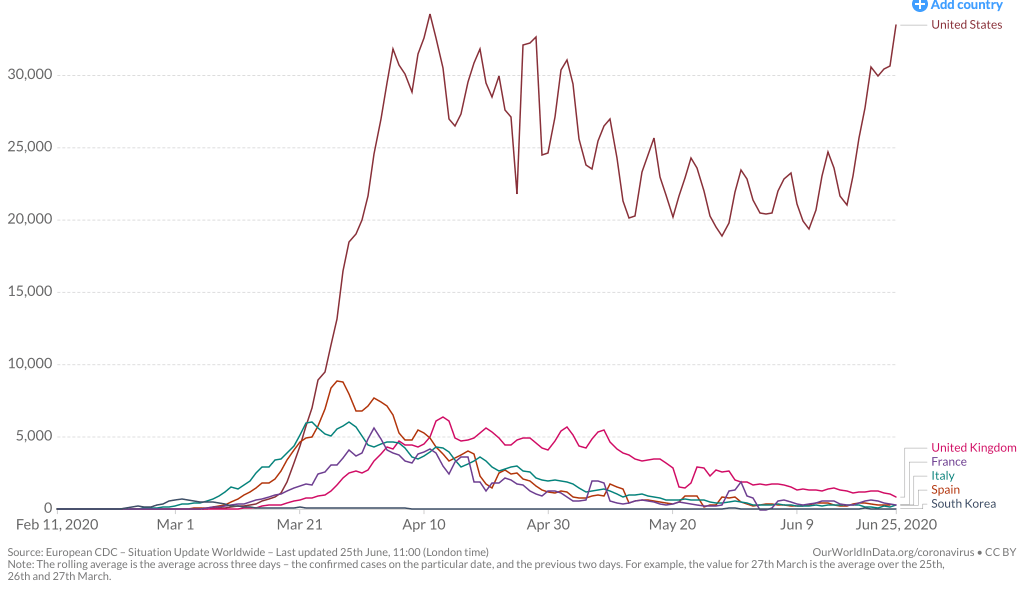
The dauphin Jared had not only used a spilt infinitive, but a split reality, a divergence destined to make the Presidential Election about COVID-19, whose malevolence is hard not to say: as the growth of rates of infection by the novel coronavirus most rapidly grew in the United States, claims Trump was doing “things right” with coronavirus testing plummeting to 30% percent, over twenty-five million unemployed and further furloughs coming, and one million infected by the coronavirus and 60,000 dead in a month, hardly fit narratives that suggest “great success,” even as the rates of infection from the coronavirus may have by mid-March grown greater in the United States than any place in the world, as escalating infection rates would continue to elevate the United States far beyond other nations. The manifestation of symptoms of COVID-19 grew two weeks after contracted, and by late March through late June, they had risen above all other nations.

Yet no clear plan for school closures had emerged on a national level in the United States, and denial at the danger of the infection’s growth dominated. Vice President Pence adopted similar talking points, in a few months, taking it upon himself to bestow premature congratulations that “we slowed the spread, we flattened the curve, we saved lives,” in a mismatch evident to any map in news media, but to the actuality on the ground.

Continue reading

Leave a comment

Filed under Coronavirus, COVID-19, education policies, remote learning, school closures

Mapping the Expanse of our Health Care Debacle

Has racism reared its ugly head in the debate over healthcare?  Dr. Atul Gawande likened attempts of conservatives to reject health care exchanges as “advice that no responsible parent would ever give to a child.”  For it seems a deeply obstructionist tactic that recalls in so many senses the resistance to integrating schools after Brown v. Board of Education under the misnomer “freedom of choice.”  Gawande noted with real disbelief that courts had to intervene to prevent such retroactive obstructions, much as the Voting Rights Act had been designed to allow courts to intervene in obstructions of the right to vote in similar regions.  While Gawande was not alone in finding that the mantra “defund Obamacare” tsponsored by “almost exclusively white members”  elected to represent “bright red districts” to be fueled by racist hatred or be a cover for deeply racist fears, or be a cover for the sense that poorer parts of the society should not be covered by the wealthier, or by the middle class–and a deep dissatisfaction of the apparent redistribution of wealth that this created, as if this constituted an unwanted interference of the government in individual choice.

Not only do we live in a landscape of quite jarring disproportions of health-care and access to health providers, but of deeply disturbing shifts in life expectancies, that undoubtedly are influenced by a truly terrifyingly inequality in access to health care–which may offer the sort of data visualization from which to begin debate on health care.

C_YmGVQXkAE4L8j

Inequalities in Life Expectancy among US Counties, 1980 to 2010/Dwyer-Lindgren, Bertozzi-Villa, Stubbs, et al./FiveThirtyEight

Filtered by a color ramp that less sharply conveys sharp ruptures, the inequities between in life expectancy among individual counties suggests some quite sharp differences that are apparent in the landscape whose populations we may have decided that we’re less interested in working to ensure of up to a decade:

YEars diff Life Exp.pngFiveThirtyEight

The sharper and perhaps more surprising decline of women’s life expectancy during the decade between 1997 and 2007–the first time of such widespread setbacks in longevity in recent memory–betrays a shockingly similar concentration throughout Oklahoma and Kentucky and West Virginia, as well as Nevada, that mirrors the discontinuity in life expectancy nation-wide to the above snapshot, in ways that might suggest a health crisis, and may well mirror the doubling of those classified as obese between 1980 and 2010–and something as simple as widespread dietary change, as well as habits like smoking, contributing to high blood pressure and obesity in an almost national epidemic.  The dismay with which Dr. Christopher Murray, direction of the Institute for Health Metrics and Evaluation at the University of Washington, noted in 2011 that “there are just lots of places where things are getting worse” seems echoed in the infographics above and below, where the sharp discrepancies of an unexpected decline in health and life expectancy mirrors the increasing inequality and economic divide in America, in ways that seem to distinguish the United States, according to the chair of a 2011 National Academies panel on life expectancies, unlike other countries, that effectively pegs health care to income levels.  The decline of life expectancies in Appalachia and the Deep South is not, perhaps, surprising, but speaks to a bizarre division of the nation, especially as many welathier coastal areas in California and the Northeast, as well as Florida, have seen a rise in life expectancy of both women and men.

Life expectandy for women 1987-2007.png

The absence of similar geographic disparities in life expectancy on a very local if not granular level is absent from Great Britain, Canada and Japan, but suggests the growing demographics of inequity that threaten to be only reinforced by the absence of a comprehensive plan for national health care.  It is a terrifying truth that the majority of poor uninsured reside in 114 of 3,000 counties in the nation, of which 52–just under half–have actually adopted or imposed increasing obstacles to access to adequate national health care for their residents as an unwanted federal intervention.

Such discrepancies are not new, and are readily visible in the US Census, a precious record of national discrepancies and continuities that is now increasingly important to determine the allocation of public resources.  But they were strikingly similar in 2012, in ways deserving to send a shock through the nation because of the inequities it exposed:

Life.jpgKelly Johnston, University of Virginia Library  Scholars’ Lab (2011)


The historical decline in life expectancies particularly among rural America–a region that even when adjusted for race shows a huge historical divide that demands drilling down very deeply, as it cannot be reduced to a single cause.


LifeExpectancyMapsThe New York Times


Given the extent of these painful discrepancies, it is telling that almost half of the counties with uninsured populations lie in states that have not accepted the expansion of health care under the Affordable Care Act:  from Texas to South Carolina, state legislatures have created obstacles to its adoption or implementation, rejecting funds needed to expand Medicaid programs–as have twenty-five states–or even to sponsor health exchanges in their states to make programs available as options for health insurance through the Affordable Care Act.  Both such runarounds do disservice to their populations, as are the attempts of other states to limit the possibilities of access to health-care “navigators” who assist people with enrolling at local health-care centers:  states have independently set up obstacles mandating criminal background checks, fees, exams, or additional course work to sabotage folks from selecting health insurance, and in so doing perversely perpetuate the gaping pockets of inequalities in the current status quo which a map divided by the percentage of populations receiving Supplemental Nutrition Assistance Programs (SNAP)–one important indexed of the uninsured–reveals.

SNAP map

The divides within the southern states of America, where a consistently large proportion of the numbers of uninsured reside, suggests something link a deep valley deeply entrenched within the national landscape but rarely appreciated or explicitly mapped.  When Sabrina Tavernise and Robet Gebeloff examined the results by mapping the refusal to accept an expansion of insurance or even Medicaid against census numbers of poor and uninsured in The New York Times; the coincidence between lack of insurance with refusals of government funds for health care was so frightening that it merited a follow-up editorial on the injustice of blocking health reform–asking how we can accept placing at risk the most vulnerable in our society, including uninsured single mothers, children living below the poverty line, and uninsured low-wage earners, according to data also coming from the Kaiser Foundation.

The interactive four-color map used estimates provided by the 2011 Census Bureau‘s  American Community Survey to reveal how the twenty-six states refusing federal funds (through Medicaid or assistance to buy policies) are also distinguished by terrifyingly high levels of poor or uninsured:

% Uninsured in States Saying No

legend- Poor and Uninsured Americans

As the Times noted, this includes all the Deep South save Arkansas.  The twenty-six states, whose governors or legislatures have intentionally hampered the implementation of the Affordable Care Act, have seceded from federal health care reform, by taking advantage of the Supreme Court’s decision that the expansion of health reform was optional, and not able to be federally mandated.

It scarily mirrors the states whose populations of uninsured exceed 8% of their total populations, or where suffering from poverty and inadequate heath care is most intense:

8% poor and uninsured

legend- Poor and Uninsured Americans

To be sure, much of the arguments against the ACA are rooted in the fear that the act will be a nail in the coffin of the United States as we know it and lead to an insurmountable increase of national debt:  but the paranoiac fear that its perpetration is so short-sighted that it is intended to prevent a return to smaller government has deeper roots.

The depth of local opposition to the ACA follows a deeply disturbing map of national disparities.  Indeed, the refusal to implement the law reflects disturbing ties to the sort of census data on large numbers of African American populations, if one compares the distribution of this refusal to the one-to-one mapping of our population provided in the “Racial Dot Map” designed by the statistical demographer Dustin Cable, who used data of racial populations across national census blocks as measured in the 2010 Census to provide a “snapshot” of the national population.  The map assigns each inhabitant a single dot, colored by a collapsed category of racial self-identification.  Mapping the same data on racial classification alone, using a more simplified classification of racial identity than the census itself, reveals an eery echo of deep segregation among those regions rebuffing the plan for national health care:
SouthWest Dot Map with Names

The disturbing nature of this coincidence, while not measuring to poverty or to low wage earnings, reveal a scary image of the very regions that are ready to spurn federal assistance for the uninsured members of their populations.

Indeed, a focus on the Deep South in Cable’s map, here presented with place-names to render it more legible, reminds us of the relatively clear boundaries in many of these regions among areas which are populated by “whites” or by “Blacks” and “Hispanics”, and a focus on the Deep South reveals the striking nature of the lack of integration in counties that single-mindedly stubbornly refused to expand health care.
Dot Map in the South

There are, to be sure, serious criticisms that can be leveled against the categories retained by the census or instantiated within Cable’s map.  But the  esthetically appealing rendering of census data in the Racial Dot Map reveals some deep divides in our nation’s fabric which may well lie at the heart of the refusal of accepting a mandate for health insurance, even though the refusal is regularly framed as an issue of states’ rights or resistance to federally imposed exchanges of health care.

Indeed, even when stripped of place-names, the distributions that the demographer Cable extracted from the data in 2010 Census blocks creates something of a graphic counter-prompt to the assertion of states’ rights that justifies for such recalcitrant and obstructionist refusing to expand health care:

SouthWest Racial Dot

Although the Racial Dot Map is not an exact tool, and randomly redistributes an average of individual color points within census blocks, we might compare the gross level of integration, which only generalize racial characteristics of a population, to urban areas on the Eastern seaboard:

Eastern Seabord and MD Dot Map

While gross data, and hardly refined as an image of how we live, the contrast with the clearly segregated boundaries of isolated cities suggest a topography of not only racial, but social distancing, and one in which one might imagine anger directed toward the devotion of federal monies to those in need.

Of course, the story is not all bad–even if the crafty recalcitrance of these twenty-six states threatens to erode its ability to reach the most needy among us.  For the profiles of counties within states that have accepted the expansion of course contain uninsured who can be expected to benefit greatly from it–most notably in Arkansas, the one state in the Deep South to accept the ACA–and New Mexico, as well as the more rural areas of California’s central valley, rural Virginia, and the Northwest.

% poor and uninsured in state accepting expansion
legend- Poor and Uninsured Americans

The government shutdown from the start of the fiscal year has prevented many Americans from enrolling for health care online, as was long expected to be possible.  Many will, as a result, rely on filling out paper long forms when seeking to enroll in the program most suitable to them.  But the government shutdown may be a smokescreen meant to cover the obstructionism that the expansion of healthcare, as well as a tactic to delay its final implementation–both since the attention to shutdown has absorbed the 24 hour news cycle, and detracts attention from obstacles to the ACA’s effective implementation.  The shutdown seems to appeal not only as a stunt, but as a final line of resistance to providing universal health care, for a contingent convinced that it will be actually impossible to repeal “Obamacare” once it is enacted and goes into effect.

The mean-spirited nature of this obstructionism is revealed once one examines who will be hurt by a refusal to put the ACA into full effect.  Indeed, a  state-by-state examination of the distribution of non-elderly uninsured across the nation offers a somewhat terrifying profile of troughs of national inequities with which we have yet to contend.  Take, for example, the deep pockets of an absence of insurance among populations in South Carolina:

South Carolina

Or, even more scarily, perhaps, the deep trough in much of central Florida and the panhandle:

FLorida

While the entire state suggests a massive picture of uninsured, the central region is dominated by huge numbers of uninsured, which the governor stubbornly refuses federal insurance:

Central Florida

An even more grave disparity of access to health care is revealed in Alabama as a belt across its more rural areas:

Alabama's Belt

The divisions in Arkansas are almost a belt around Little Rock:

Arkansas

Or a dismaying divide within the rural areas of Georgia, where Atlanta seems something like an island of access to insurance only in its best neighborhoods, but swamp-like regions of uninsured spread out at its northwest and southeastern edges:

Georgia

And, in a particularly terrifyingly unethical mosaic, the disparities between rural and urban Texas appear particularly strikingly stark, and reveal a deeply historical artifact of income disparities and economic livelihoods across the state:

Texas

One could continue almost ad infinitum, covering the ground of the United States as if it were a map coextensive with the nation, but one doesn’t have to struggle much to grasp the depth of disparities and the dangerousness of perpetuating such deep divides in access to adequate health care.

When one speaks of two nations in America, divides between red states and blue states mask the depth of divisions between the uninsured and insured, and reveal the increasing difficulty of the blindness of one population to the other.  Discounting populations whose lack of adequate health insurance is, in essence, naturalized as part of the status quo may provide the clearest illustration of the persistence of racism in America.

2 Comments

Filed under data visualization, Deep South, national health plan, public health, Voting Rights Act