
2. The value of lockdowns echoed the Cold War narratives of underground shelters and weathering storms as if to encourage a notion of national combativeness. The national war of narratives continued in maps, as maps told different stories–and radically different histories–of a nation and its state of health, extending to the labelling of the anti-policing protests to domestic terrorism, in ways that seemed set to expend force on a domestic theater, but not for education or health care. Yet while the infection was in need of curtailing, children are only able to account for 2% of COVID-19 cases, and seem to transmit the disease far less than others–and are rarely hospitalized, as they are far younger; the continuation of schools in Australia and New Zealand suggest that children rarely pass on the infection to other kids or teachers, and the mechanics of transmission was perhaps poorly understood as the reaction to earlier fears of pandemics–from the age of SARS or H1N1, or H1N5, were rolled out, without attending to how SARS-CoV-2 was contracted or had spread. Most importantly, perhaps, keeping schools open was a basis for monitoring kids, and focussing their attention, as well as engaging their minds, in ways that the schools were struggling, in part as government had done little to encourage.
The sense of a war, often invoked by the Commander-in-Chief, in a disturbing analogy of patriotism, is deeply misguided–for this is a war in which the President seemed to invite the enemy to enter our shores, was being fought on the front lines among minorities in many areas of the country that were immediately compromised, with little way to process their divergent experiences, long before the distinct realities were presented in such crisp visualizations from CDC data. We felt, increasingly, Donald Trump hadn’t even been reading the President’s Daily Brief, in early January, when he was told of infection that had spread to over a thousand people in China, before an outbreak of a novel coronavirus was reported to the World Health Organization on January 3, or before China sequenced a draft genome of the virus a month after the first outbreak, on January 11, calm was radiated through June.
If data visualizations are in general not much help to illuminate the spread of the novel coronavirus, the need for orientation was the increasingly pressing story of COVID-19, which point-based maps poorly showed. For the sense of an absence of leadership was more apparent for some time: intense social distancing practices adopted as an efficient top-down if radical means to curtail transmission of the novel coronavirus in China, where sevenfold decreasing of social contacts successfully contained the coronavirus, had been rarely adopted in the United States. Distancing was a public health strategy successfully adopted in Italy, where Chinese experts had arrived, but stubborn refusal to adopt World Health Organization protocols or potential foreign help mapped onto a home-brewed failure to enact social distancing in the highly mobile population that had enabled infections to spread beyond the actual CDC tally in the United States; we moved through months with no sense of when testing would occur, or become widely available in areas of need: as health services are viewed as a good regulated by markets and providers, there was not even a clear sense of testing protocols or practices, as states were left to fend for their own private contractors, often residing out of state, and no clear abilities of a turnaround in tests or test kits were provided.
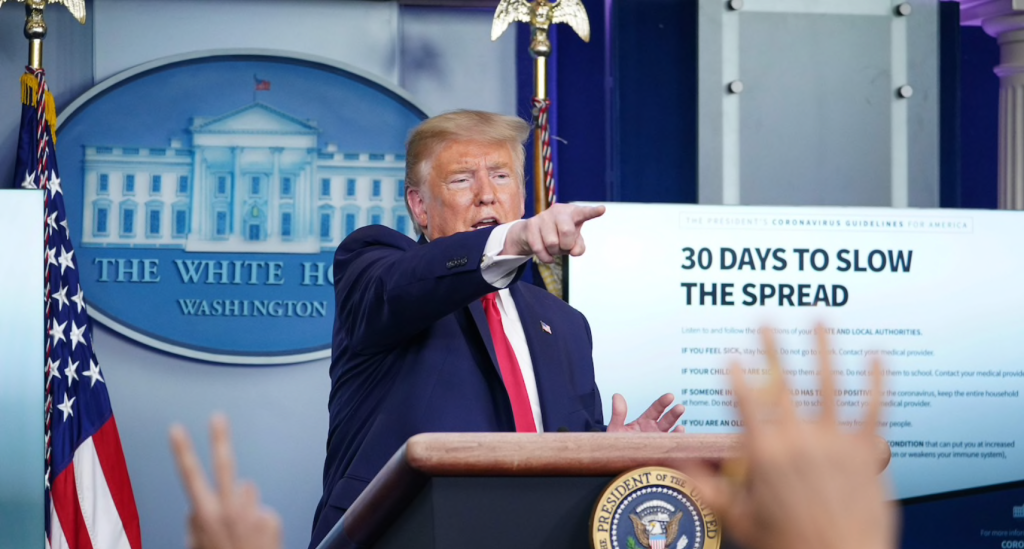
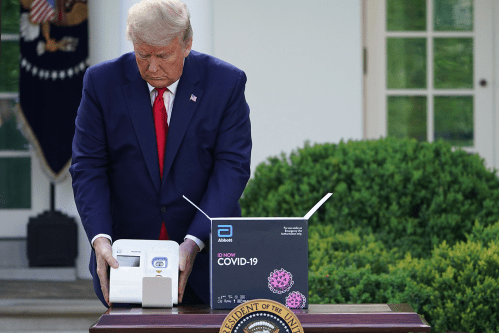
The lack of a national health care system, eroded in the previous thirty years, was betrayed in the lack of any ground game. President Trump revealed the hope of testing to the nation as if game show prizes in a Reality TV show, rather than a public health disaster–addressing the nation from a lectern with a detachment from governance of the situation on the ground, as if seeking to foment dissensus. The practices of testing widely that was suggested met disinterest from the President, lest “when you do more testing, you find more cases, and then they report our cases are through the roof,” as if it was disadvantageous–suggesting a lack of interest in creating consensus that has yet to be understood, revealing a strikingly limited attention span to anything but registers of perception, even in public health.
While we are before a new disease, which we do not grasp in its pathways of infection fully, or its vectors of transmission, and mitigating factors, and lack the vaccine we will probably need to contain, we may feel, as historian of science Lorraine Daston put it, in “ground zero of empiricism,” and all in the seventeenth century, vulnerable to a disease far less dangerous or deadly than Yersina pestis, without adequate explanatory categories or diagnostic tools. But the disorientation of facing the disease disrupted the nation, and the current news that Gilead Sciences hope to charge hospitals $3,120 per patient with insurance to be treated with six vials of the drug suggests that Trump encouraged the inequity of any treatment or response to COVID-19,– triggering fears of a spate of unaffordable drugs in a pandemic will be driven by a profit motive in Trump’s America. Could we be surprised when we learned protective gear guidelines for treating patients with COVID-19 infections were relaxed at the urging of hospital lobbying groups that found PPE standards unduly onerous in the face of a national shortage of protective equipment in mid-March–when guidelines were relaxed from the use of N95 respirators or even more protective gear?
Trump is fond of using military metaphors of describing the coronavirus as a war, but was reluctant to ensure statistical datasets central to how military mapping tools provided a new sense of regarding the legibility of a map as a public repository of meaning, in earlier disease maps, to articulate arguments about the public good: growing levels of the public tabulation of mortalities linked to specific causes of death and their locations in a city provided a manner to present maps as a way to confront an epidemic such as cholera on a massive scale.
Why are we so enamored of using data visualizations to track the progress and understand the nature of disease? IN large part, this is because of the huge influence of the case-book example of Dr. John Snow’s map illustrating paths of infection in nineteenth century London, long credited with dismissing the notion of miasmatic pathways of infection in the mid-nineteenth century. The subject of the famous medical map by Dr. John Snow’s map, that south to present data to doctors as a way to embody the disease in clear cognitive terms, and rebut the theory of infection by effluvia as “Asiatic cholera” was transmitted in London, from “pollution” that was inherent in water,–here also shown in bars in relation to pumps–
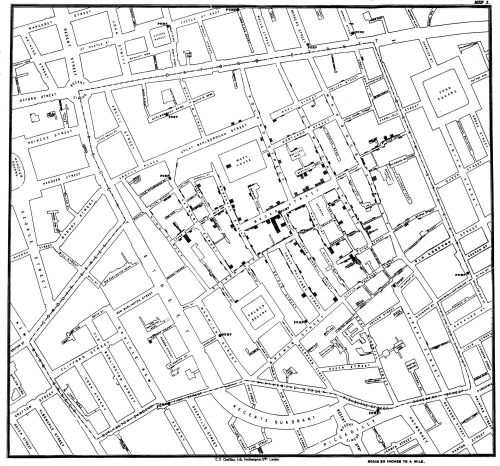
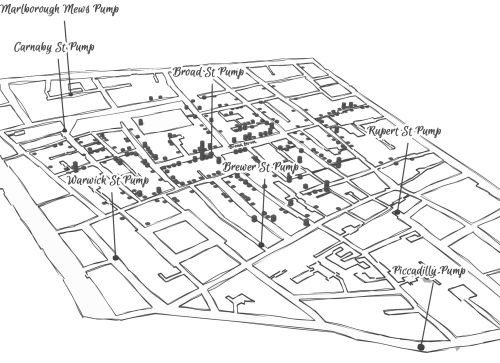
unlike the images of miasmatic infection spreading into low-lying areas from the River Thames to congested areas overcrowded with London poor–
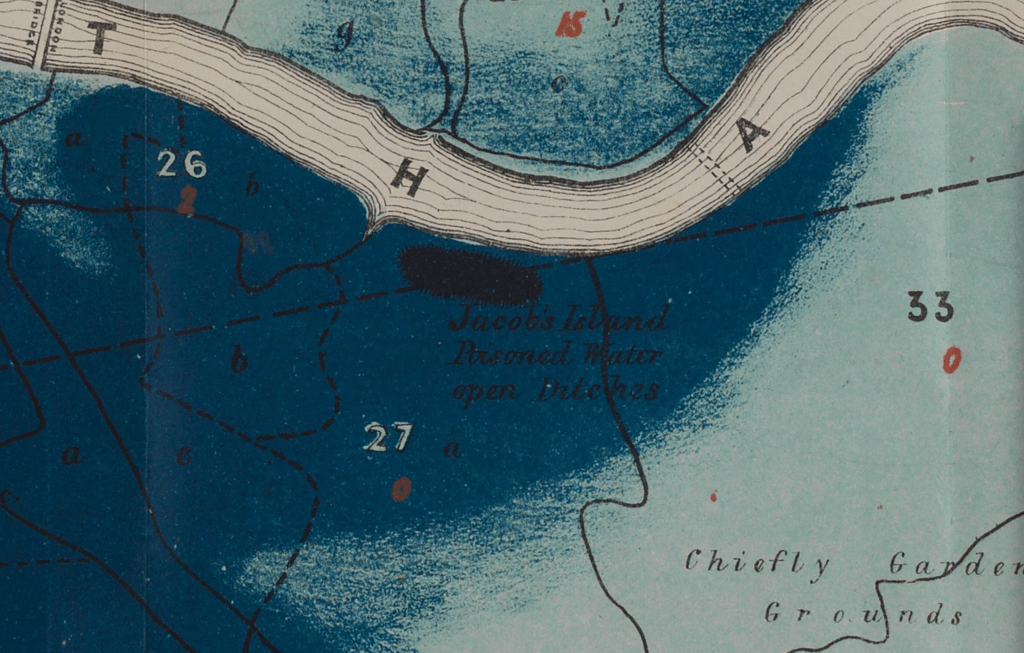
–if we were not worried by miasma transmitted among the crowding of the urban poor from effluvia emanating from river Thames, spread by endemic absence of cleanliness among urban poor and laboring classes, we were hardly able to process the spread of COVID-19, rules of its containment.
But we are hardly able to learn much about infection–indeed, the basic problem of airborne infection has only recently been confirmed by global health authorities–before the coronavirus, save to see the massive nature of its spread, and to have some fire lit under our pants.
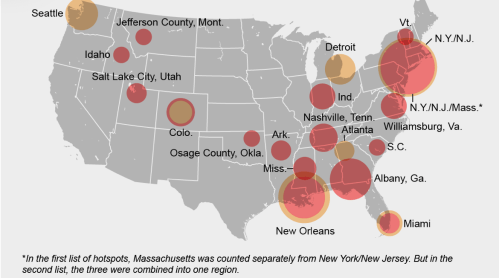
From the first bubble maps of COVID-19 infections in New York City, to the maps of “hot-spots” by mid-April, we watched waves of mortality, mostly focussed in cities like New York, but spreading into the Tri-States area, and then blooming in Miami and New Orleans, we watched “hot-spots” grow, often without orientation to the vectors of transmission.
As early as February 15, before Trump made any announcement save a denying entry of ships carrying COVID patients in the US territory of Guam, as the Philippines, Taiwan, Jamaica, and the Grand Cayman Islands–outbreaks of infections had blossomed in several cities in the United States, infections had spread across much of the nation, and we could barely trace the mutations of the pathogen already present by March 15 all fifty states.


