
Serviceman Tyrone Slothrop is stationed in London with the unit “Allied Clearing House, Technical Unit, Northern Germany”, a branch of Allied Intelligence where he is charged to look in ruins to search for survivors amidst the burning rockets frequently fired at the city’s inhabitants, and examine the rocket-bomb disasters that dotted the city, as if to find life in death. At the time of his searches, “A lot of stuff prior to 1944 is getting blurry,” and he is haunted by “the notion of a rocket with his name written on it” (25), and is left to wonder to himself “how he got into investigating V-Bomb incidents” (24). While such maps are most often retrospectively recreated from data about past strikes, as information of the extent of bomb dropping is revealed, the creation of a map of ongoing damages and destruction of bombing raids recorded in real time during the London Blitz, in an attempt to take stock of the first targeting of civilian populations, and indeed as a daily tally of the scope of destruction to try to create a record of the extent of the damages that the city had endured–in ways that seem to map the paths of the first guided missiles to target densely inhabited areas. Did they create a logical distribution, or how finely could their arrival in fact be defined from such a spatial remove? Or was it that the shock of these explosions had utterly removed one across a threshold of experiencing life in ways that eradicated not only buildings, but any possibility of return?
Although we had little knowledge that the strikes were indeed noted in a day-by-day fashion, the mapping of damage, if geared to the local buildings, provide a particular rarity of assessing the impact of dreaded rockets as they hit targets in the city, revealing something of a pattern that the English Home Ministry sought to understand to grasp the elusive logic of the deadly attacks. The record of their impacts may have created a sense of survival, but also show, as Thomas Pynchon slyly suggested in the quotation that begins this post, the changed sense of time and space they create. “Will the Postwar be nothing but a series of events, newly created one moment to the next? No links?” Pynchon asks in Gravity’s Rainbow, resulting in the “end of history?” How exactly can the scale of this destruction be mapped, and the caesura that bombs impose on history be seen as anything like a continuum?
The deliberate design of pastels that assess the geographic distribution of bombed-out buildings that were impacted by the fast arrival of unmanned bombs London in the Blitz can’t help but recall the collection of paper stars Pynchon describes as created by Tyrone Slothrop in his spare time. His mapping of the sites of sexual encounters while overseas uncannily mirrors the damage of rockets that started to strike after 1944, creating greater panic than the bombs previously dropped by Luftwaffe planes–and maps a distribution of death, tracing the distribution of the arrival of V-2s over the city and the new geography it creates in the cityscape. Slothrop made the map to track his own exploits with a diligence best described as “booblishly conscientious,” but was mistaken as a curious attempt to track such “sudden demolitions from the sky” which might reveal foreknowledge of the strikes. Rather than list the dates of bombing, the map Slothrop makes curiously precede them–since they rather track those few moments in his idle nights when “he can save a moment, here or there” of sexual intimacy amidst the surprise rocket strikes that hold London in fear. Slothrop has himself become exasperated when searching ruins, lucky to find victims alive, but “obsessed with the idea of a rocket with his name written on it.” There is not a clear ethanol-fueled rocket he has in mind, but the targeting of civilian populations haunts him as a new image of war, and leads to his odyssey across much of occupied Europe and to Berlin, after he leaves the asylum to which he is initially committed by the Army.
Tyrone Slothrop is both filled with a level of “operational paranoia” but seized by sexual excitement he uses a chart to try to map. Slothrop remains mightily puzzled by the sexual excitement that seems always to arrives as if reflexively or indeed spontaneously–“well Great God where’d that come from?”–shortly or days before the arrival of one of the V-2 rockets that are raining on London–the result of particular psychical sensitivity of Pavlovian proportions to “what is revealed in the sky.” Hoping to resolve the conundrum, Slothrop between air raid missions pastes colored paper stars on a map of the city, not to try to find a pattern amidst the heavy explosions and thunder-claps of V-2 bombs in 1944, but to record the memories of each encounter, that seems to track his encounters, but is noticed by superiors to curiously correlate with the very sites where they have destroyed the city’s buildings and populations, as of to present the bombed out city as a sort of personal demonic laboratory. The rockets, the first guided ballistic missiles to be shot from launching pads at civilian targets, which arrived faster than the speed of sound.

2. Slothrop’s enigmatic map becomes less an argument than a compelling question in the office of statisticians at the start of Pynchon’s Gravity’s Rainbow. For the ACHTUNG office is in the process of mapping sites where V-2 rockets struck, attending to their distribution in order to determine as to whether the strikes have an inherent pattern or explanation of the new reality of war. Whereas Roger Mexico thinks they follow a Poisson distribution, we find that they register little pattern beyond the personal experience by which young Slothrop was psychically conditioned–raising the question of the nature of causality that becomes a leitmotif of the novel.
Is it Poisson or Pavlov, and are we in Slothrop’s head or feeling the impact of the war? The scale of tracking bomb damage across the city reveals another sort of assiduity to track these demolitions that suddenly arrived without warning from the sky, whose distribution Allied Intelligence is trying to understand as a logical distribution on a map that sorts out the divides London into 576 individual squares of ruled at one kilometer scale, an “ink ghost of London,” as if hoping to deduce some logic from the distribution of sudden daily deadly strikes–despite the existence of statistical equation to describe the distribution, he knows the bombs must simply be understood as discrete events, rocket strikes in red circles of growing shape without predictive value; the Poisson equation enigmatically suggests how many squares will be destroyed by a number of hits, as if to give some inner logic to the distribution of rocket strikes that could presumably save lives.
While the scale of damage is most often mapped in an attempt to lend closure, coherence, and comprehension to an ongoing destruction of war, as if to lend some clarity to the fog of war itself as it is experienced on the ground. The maps of bombing raids and bombed out landscapes or cityscapes aim to impose a sense of often unwarranted closure in their implicit promise to fix meaning to ongoing events. Often, the mapping of damages in images are repressed, as the war’s violence cannot be communicated to civilians save, perhaps, after these horrendous and terrible events that effectively track a changed relation to place. For the continued air attacks of near-constant losses, the shift from bombs dropped from fighter planes to shot V-2 rockets, which arrived in the city even before their sound was audible, created a distinct ratcheting up of unease, only early evident in actual Bomb Damage Maps that the Home Survey Office drafted during the war.
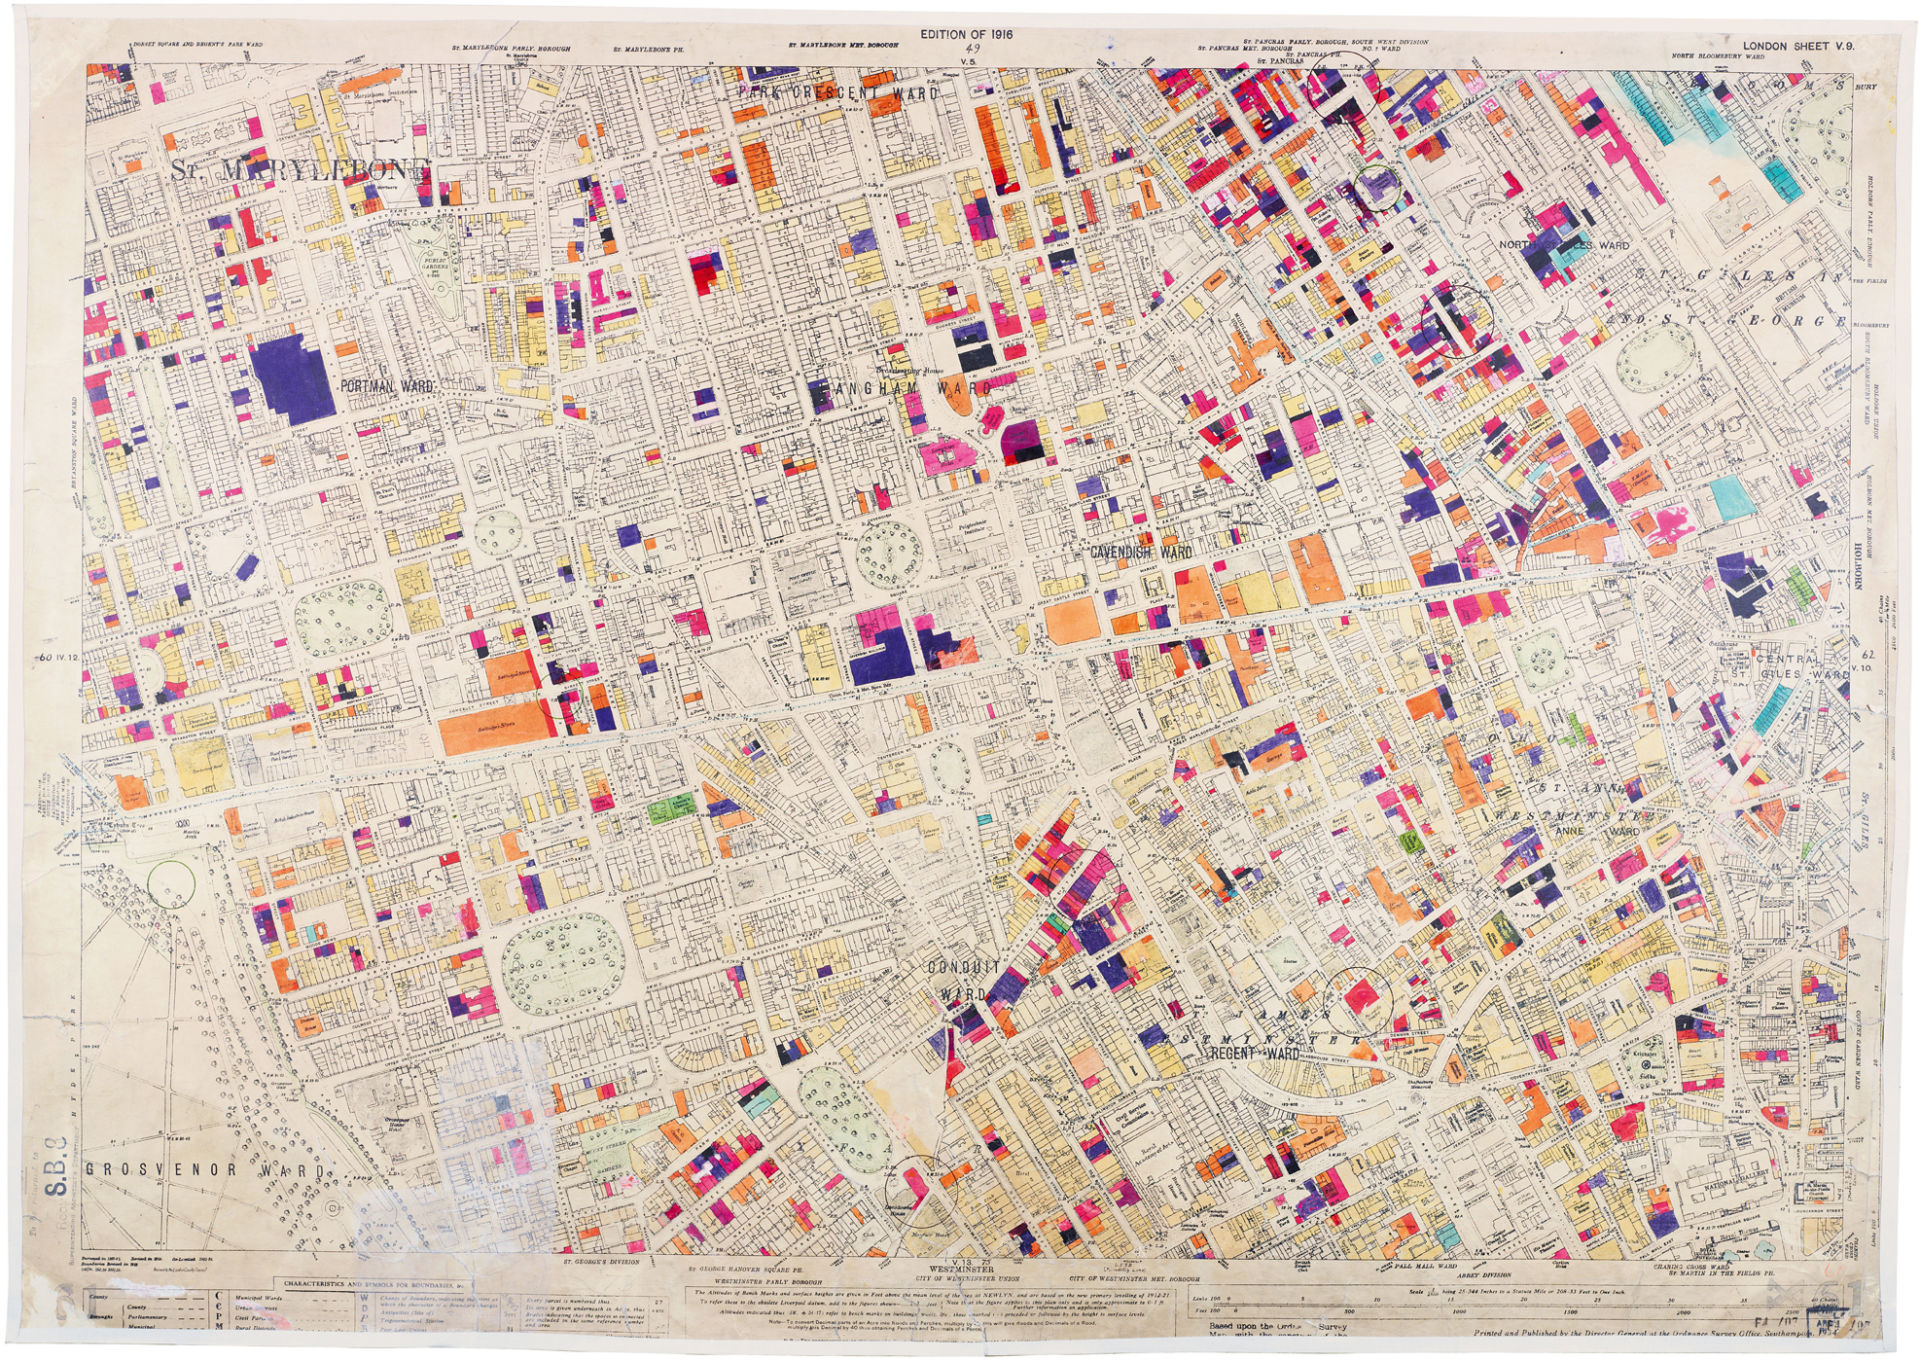
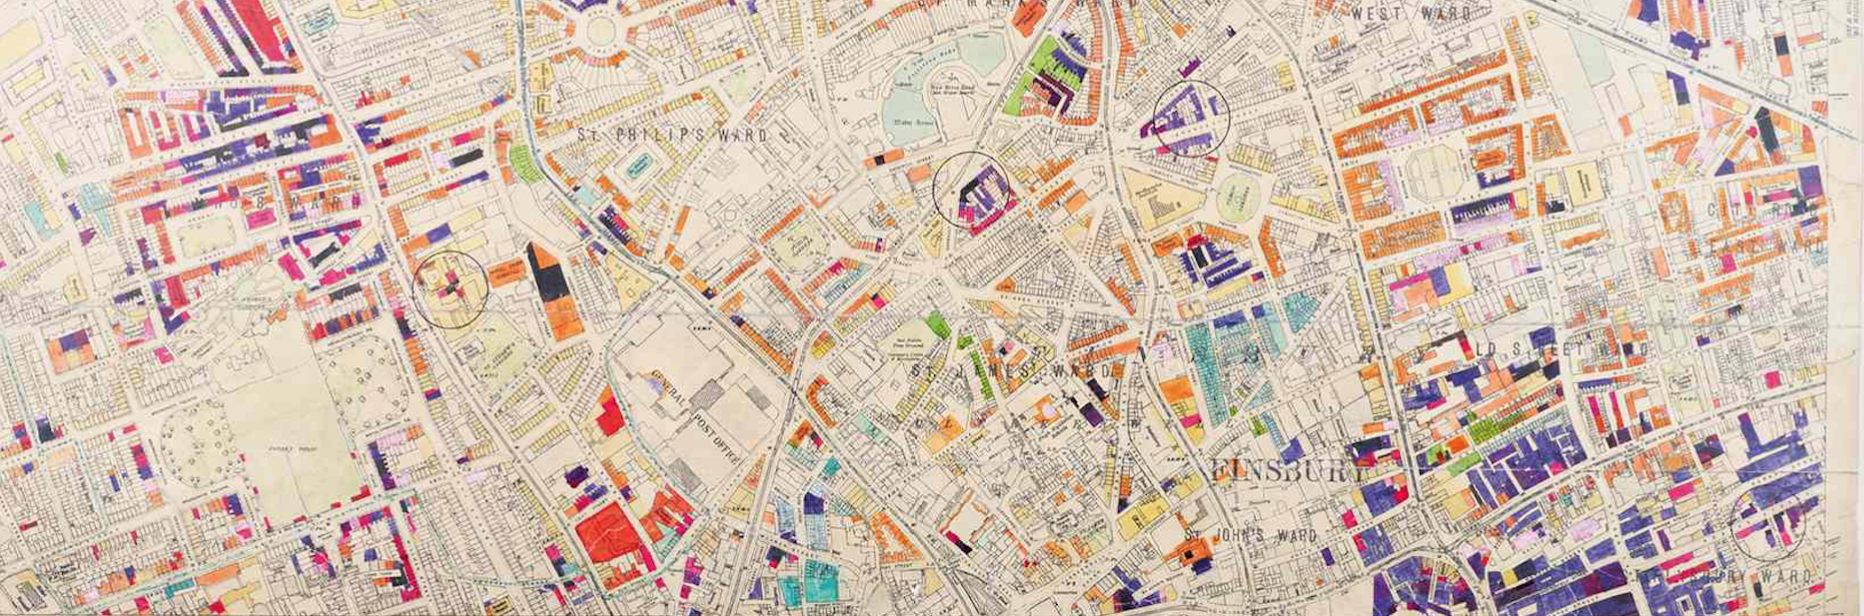
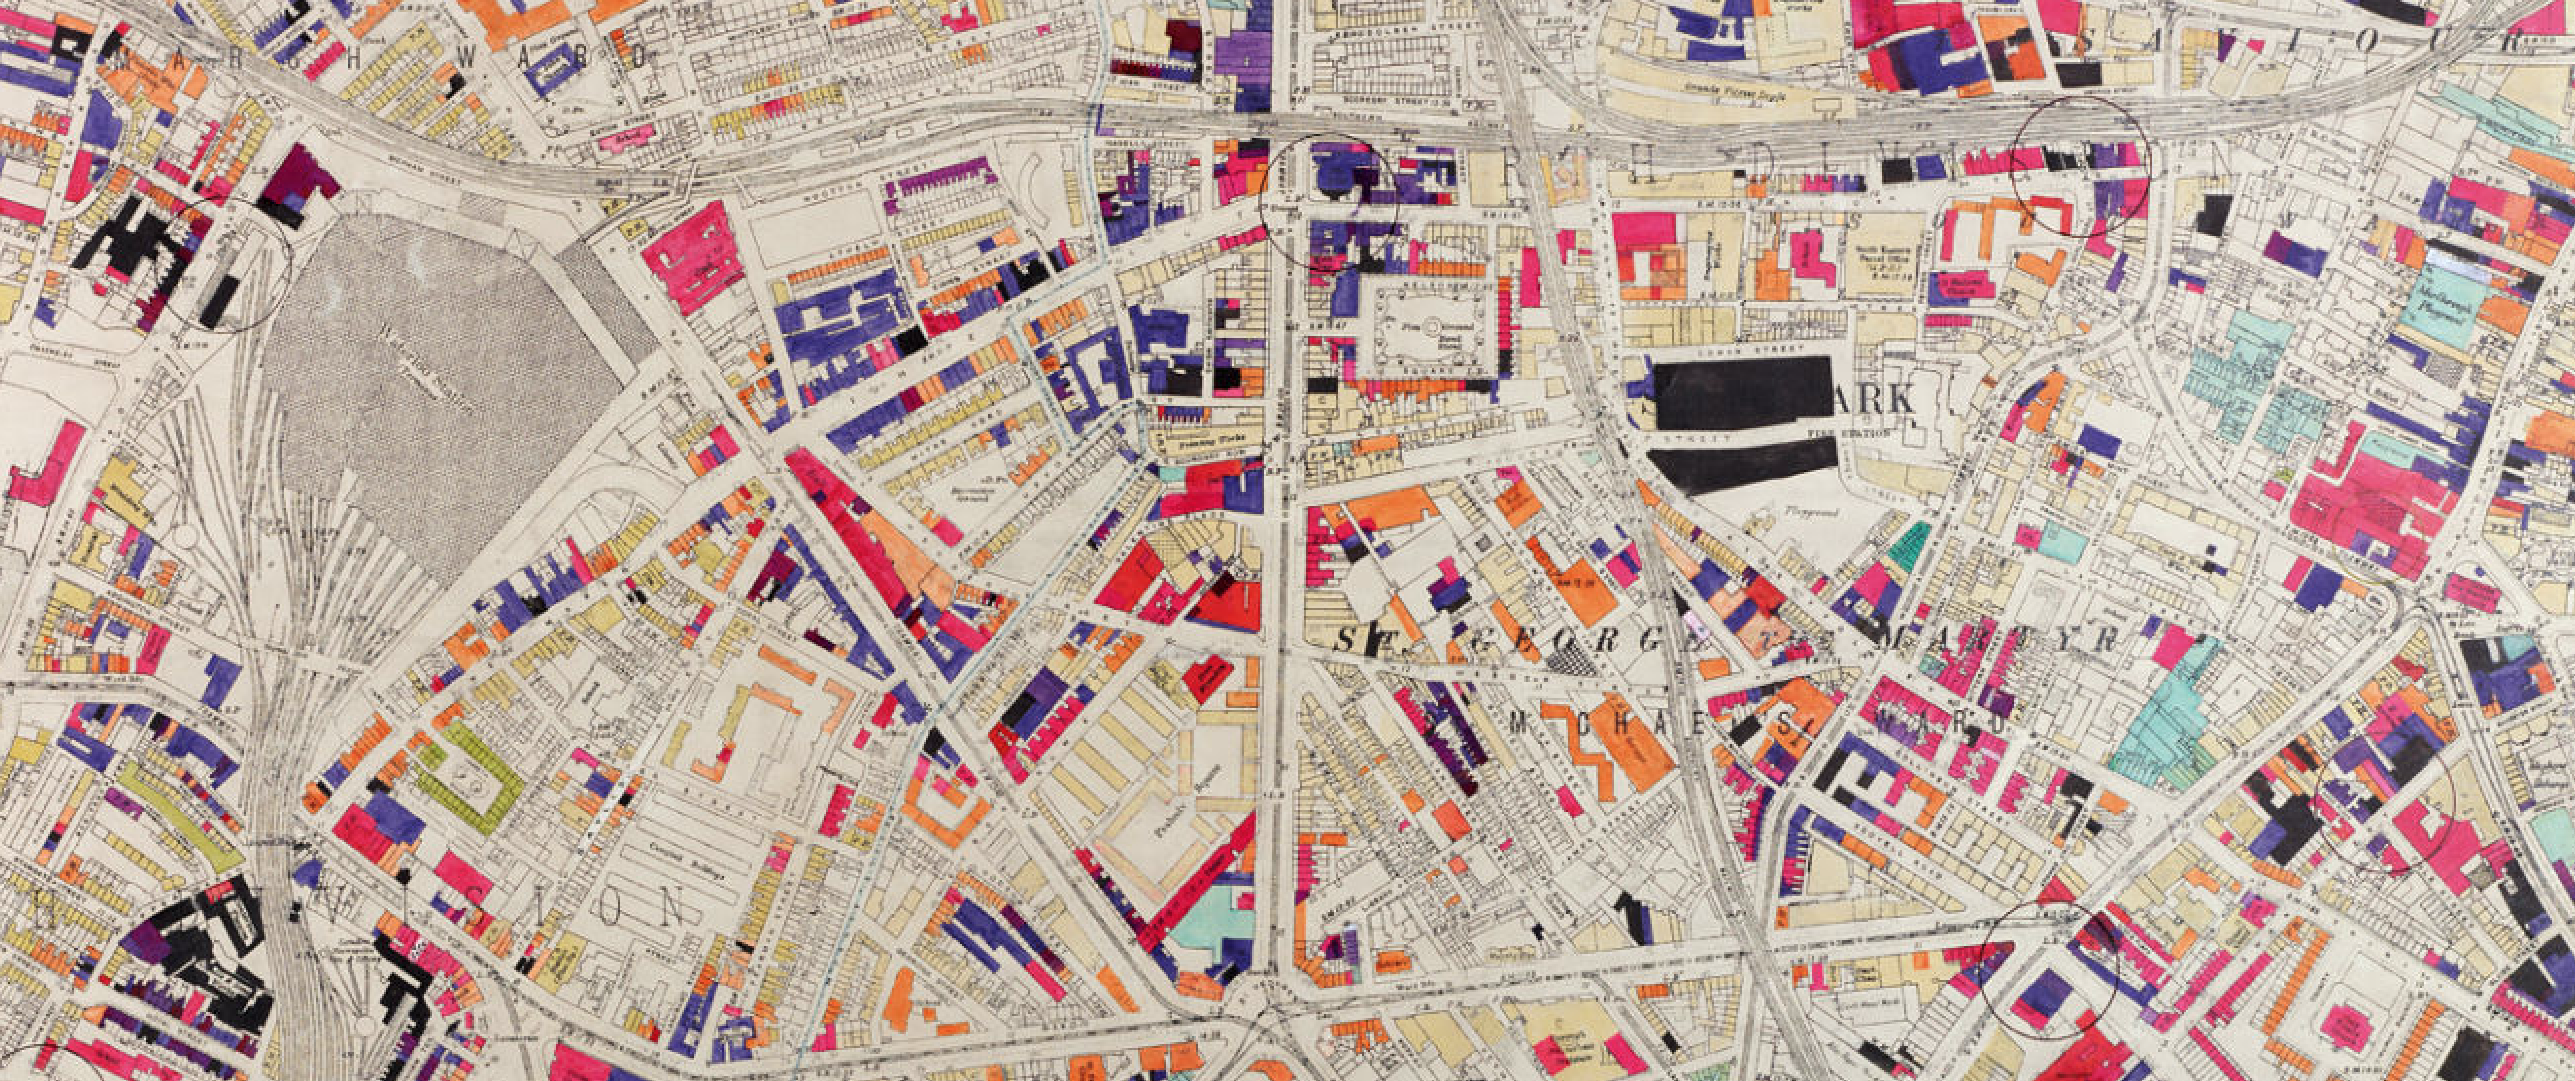
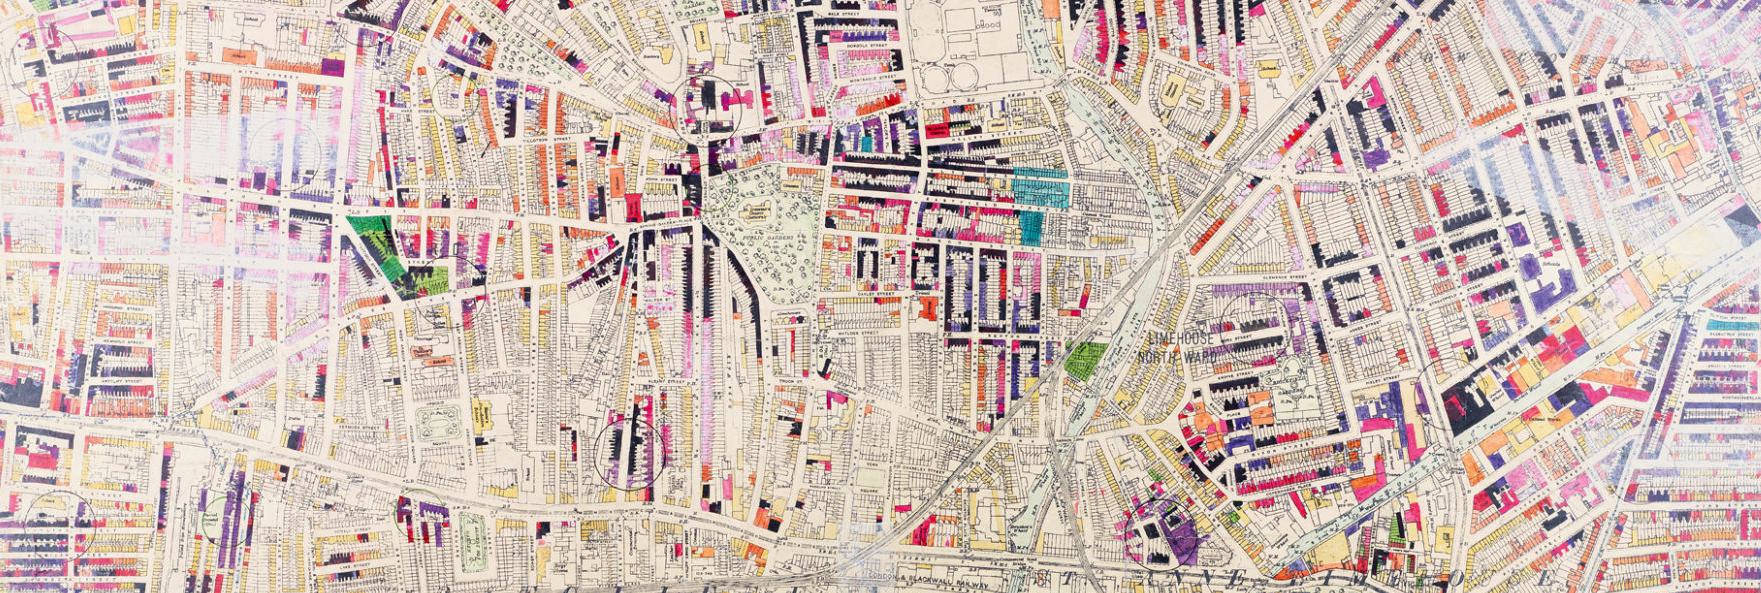
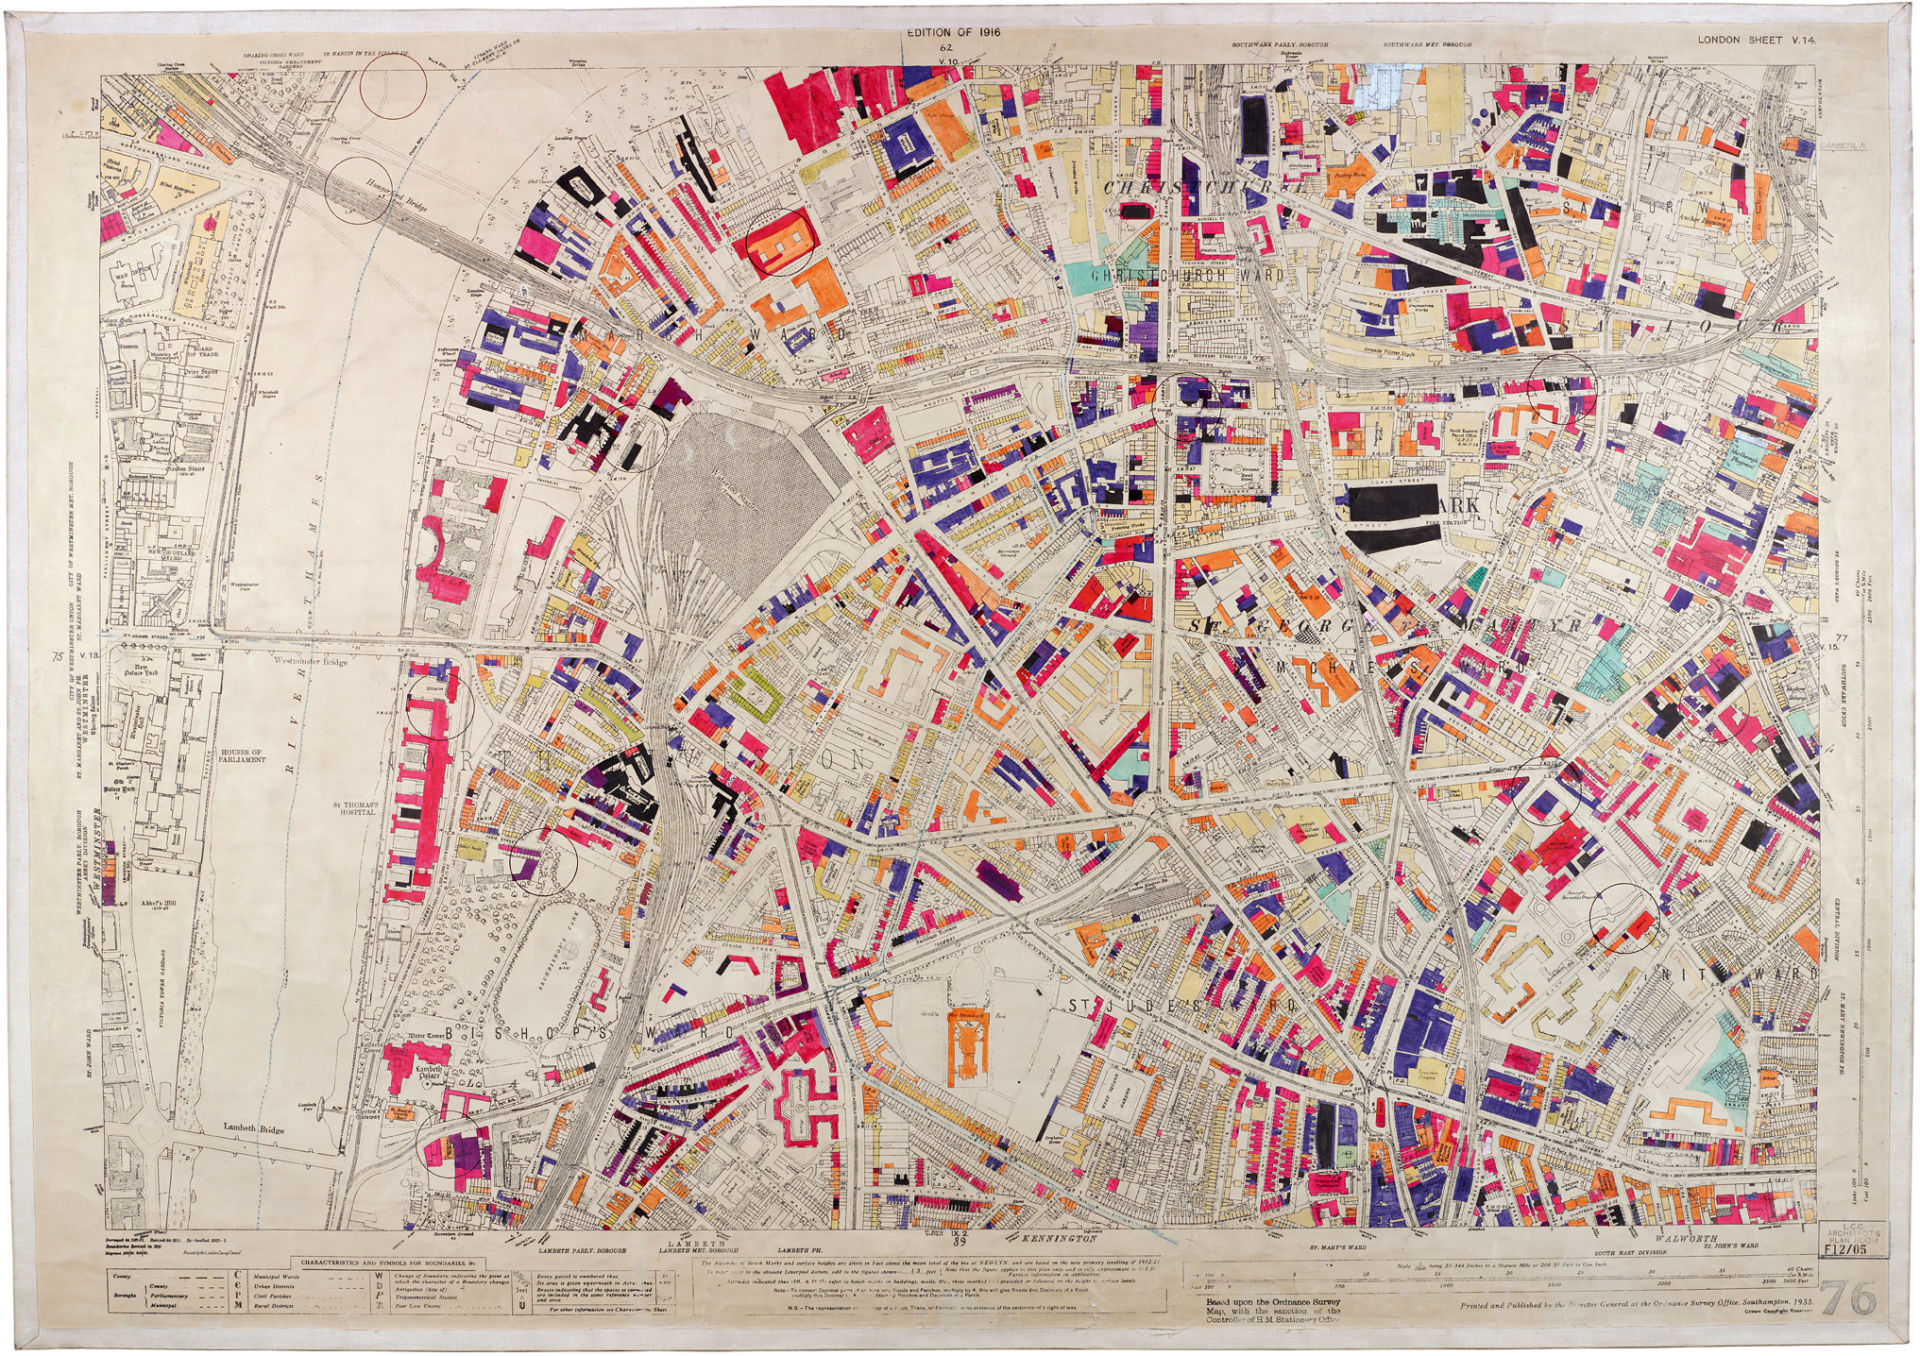
3. In order to take stock of such explosive events, the Bomb Damage Maps derived from attempts of the Ministry of Home Security to collate damages sustained during bombing raids in London and England, as if in an attempt to understand the logic of enemy attacks on the Home Front, first focussing on London, Birmingham and Liverpool but by September 1941 expanding to the United Kingdom. The mapping was a sort of respite from the daily onslaught of violence. Despite the considerable melancholic sense of loss pervading images of bombed out landscapes, as in the header to this post, there is a detectable sense of brave resilience of the Bomb Damage Maps–as this one of Soho–spoke to the need to maintain composure, perhaps, as well as faith, as V-2 rockets shot pell-mell down on the capital–in ways that could scarcely be fixed by the circles that note their impact on the below Bomb Damage Maps drawn up from 1940 and kept in the London Metropolitan Archives, which included the sites of V-2 attacks that racked the city in destructive ways from 1944,–marking sites of impact by open circles of different diameter for V-1 and V-2 rockets that obliterated buildings across the city, coloring buildings deep purple to designate the extent of damages as “Beyond Repair” or black to designate “Total Destruction.” The images made to assess local losses provide a basis to meditate on how we map bomb damage, comprehend its extent, and how aerial strikes change urban landscapes and our relation to them.
Bomb Damage Maps/London Metropolitan Archives/City of London Police: Kings Cross

 Detail, Waterloo Station/Bomb Damage Maps/London Metropolitan Archives/City of London Police
Over five hundred and seventeen V-2 rockets fired from overseas exploded in London during the German blitz of the city of London at the end of World War II from September, 1944. After V-1 bombs dropped in quick succession by some three hundred airplanes had killing upwards of 2,500 civilians, a shower of hundreds of bombs over hours shook the entire city almost without interruption, virtually covering the city during the Blitz.
The Blitz began in 1939, as V-1 bombs were dropped on the city using pilotless airplanes, creating the most striking first case of civilian raids on London. But the escalation of the ballistic V-2 missiles that began from 1944 intensified their destruction in ways that raised the threshold of war: the near-continuous aerial bombardment of three hundred successive air raids. The first use of ballistic missiles set a frightening new standard for damage on the Home Front, and the tabulation of apparently random destruction. The maps hence discriminate by open circles of slightly different gradation between V-1 “flying rockets” and the ethanol-powered V-2, coloring buildings “Damaged Beyond Repair,” “Total Destruction,” “Seriously Damaged–Doubtful if Repairable,” or more optimistic assessments, in an attempt to come to terms with the local destruction that altered the cityscape in what seemed definitive ways, in order to preserve plans for the city’s future reconstruction, and indeed to tame the sudden shocks by which blasts ignited across the urban landscape that all of a sudden seemed a war front.

Planes carrying bombs had first targeted industrial areas, but aerial bombing shifting to include civilian habitations as the raids continued; 2,000 V-1 bombs that landed in greater London killed 2,239. The later continuous onslaught of 500 V-2 rockets killed 2,511 in London alone, creating a distribution of terror and topography of death in the Home Front which the maps seem designed to contain, even as they continued to terrify. The continued onslaught of pattern of destruction was after all designed to wage a psychological form of war. The mapping of bomb attacks began in September 1940 to study how air raids impacted the United Kingdom and London, in an attempt to deduce therefrom the tactics and methods used by the German government, as well ago get a purchase on the reign of bombs. The density now trackable in OSM maps or Google Maps and engines is oddly, in comparison, disembodied–and removed from any clear sense of the displacement that this new science of war allowed.


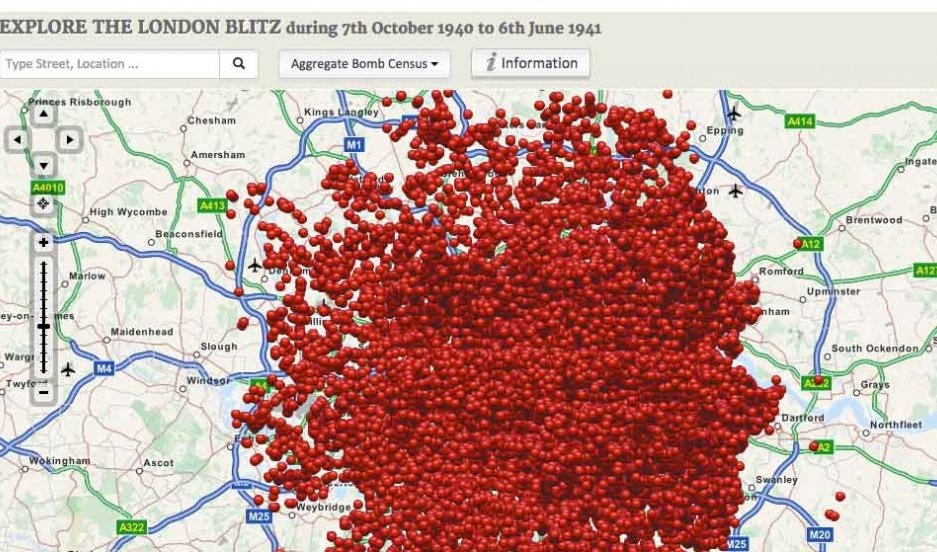
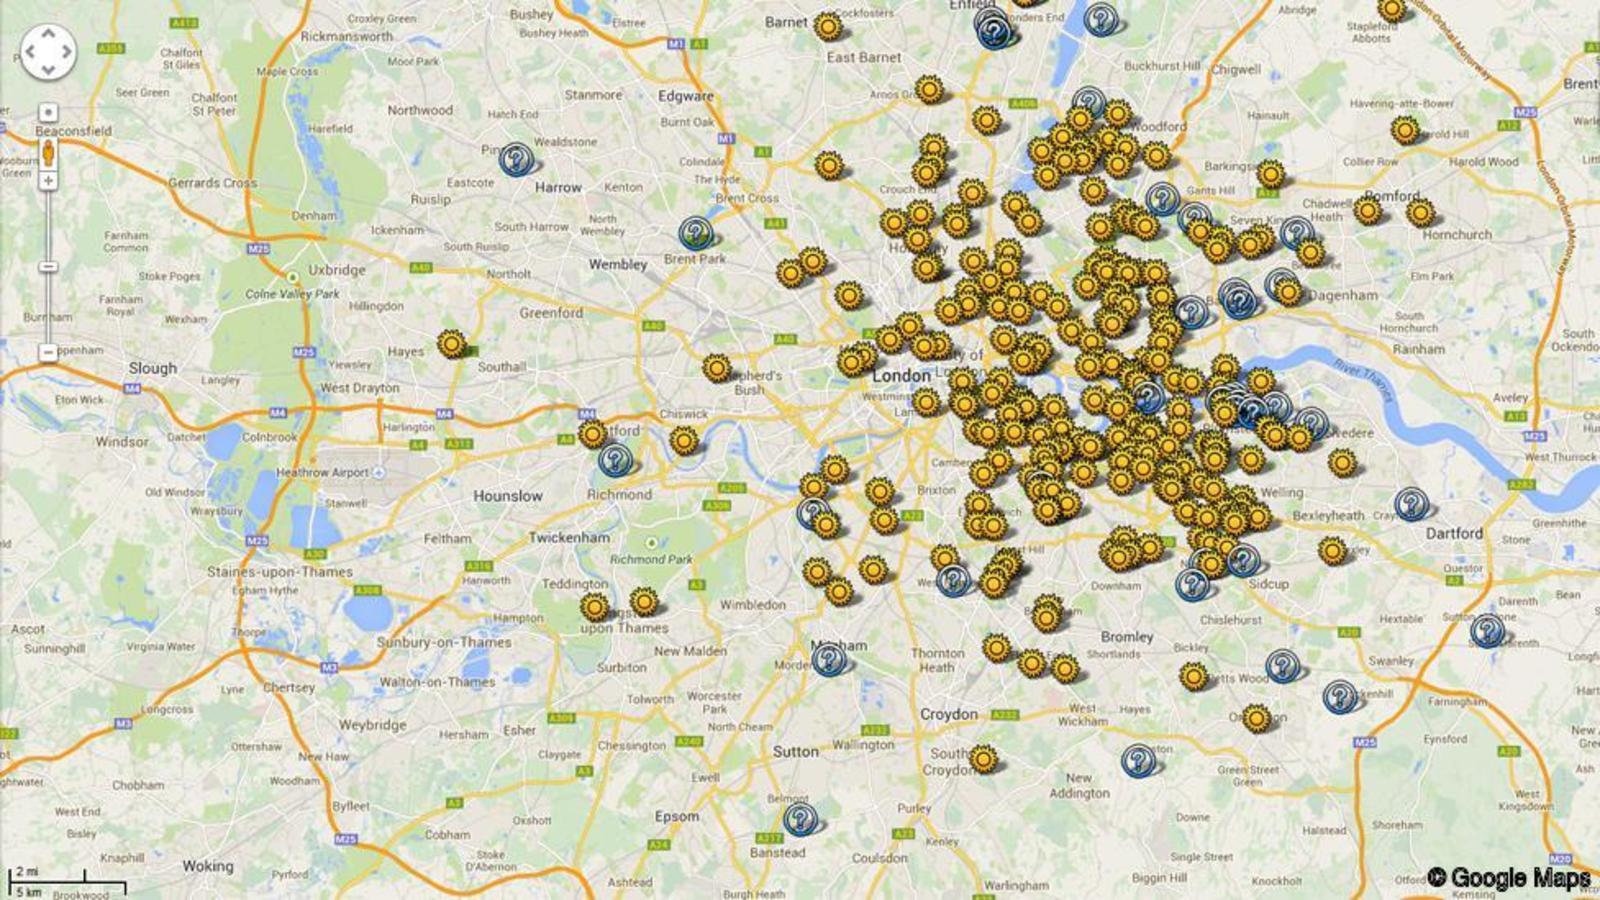
The experience and effects of bombing raids are hardly able to be summed up by even the best project to map these strikes along a Google Maps viewer and projection, given the huge surprise value of the strikes, and their difficulty to preserve as a collective memory both from above and on the ground. The nearly continuous bombing raids challenged comprehension and assessment, and created a new demand to map the damages caused by silently arriving rockets whose approach could not be detected and whose impact created immediate craters in the city. While Bombsight‘s interactive maps allow one to track the impact of bombs over London in the same period with striking density–
 Bombsight: Mapping the WWII Bomb Census
–despite the cognitive difficulty of processing those red dots as actual explosive events, the Bomb Damage Maps suggest the tension between maintaining composure in the face of onslaught and the extent of local damage of raids is preserved in the oddly antiquated, and non-interactive, colors noted on large pages of the 1918 Ordnance Survey. The continued assessments that the Damage Maps preserve, or where deep violet, carmine or hot pink crowd the sites where V-2 landed, reveals the uneven extent of damages around King’s Cross and the Barbican or Waterloo, but with the greatest devastation most caused by the bombs hitting urban areas designated in purple or violet, and the strikes denoted by circles barely visible in the reduced maps reproduced below, but evident in exploded detail.
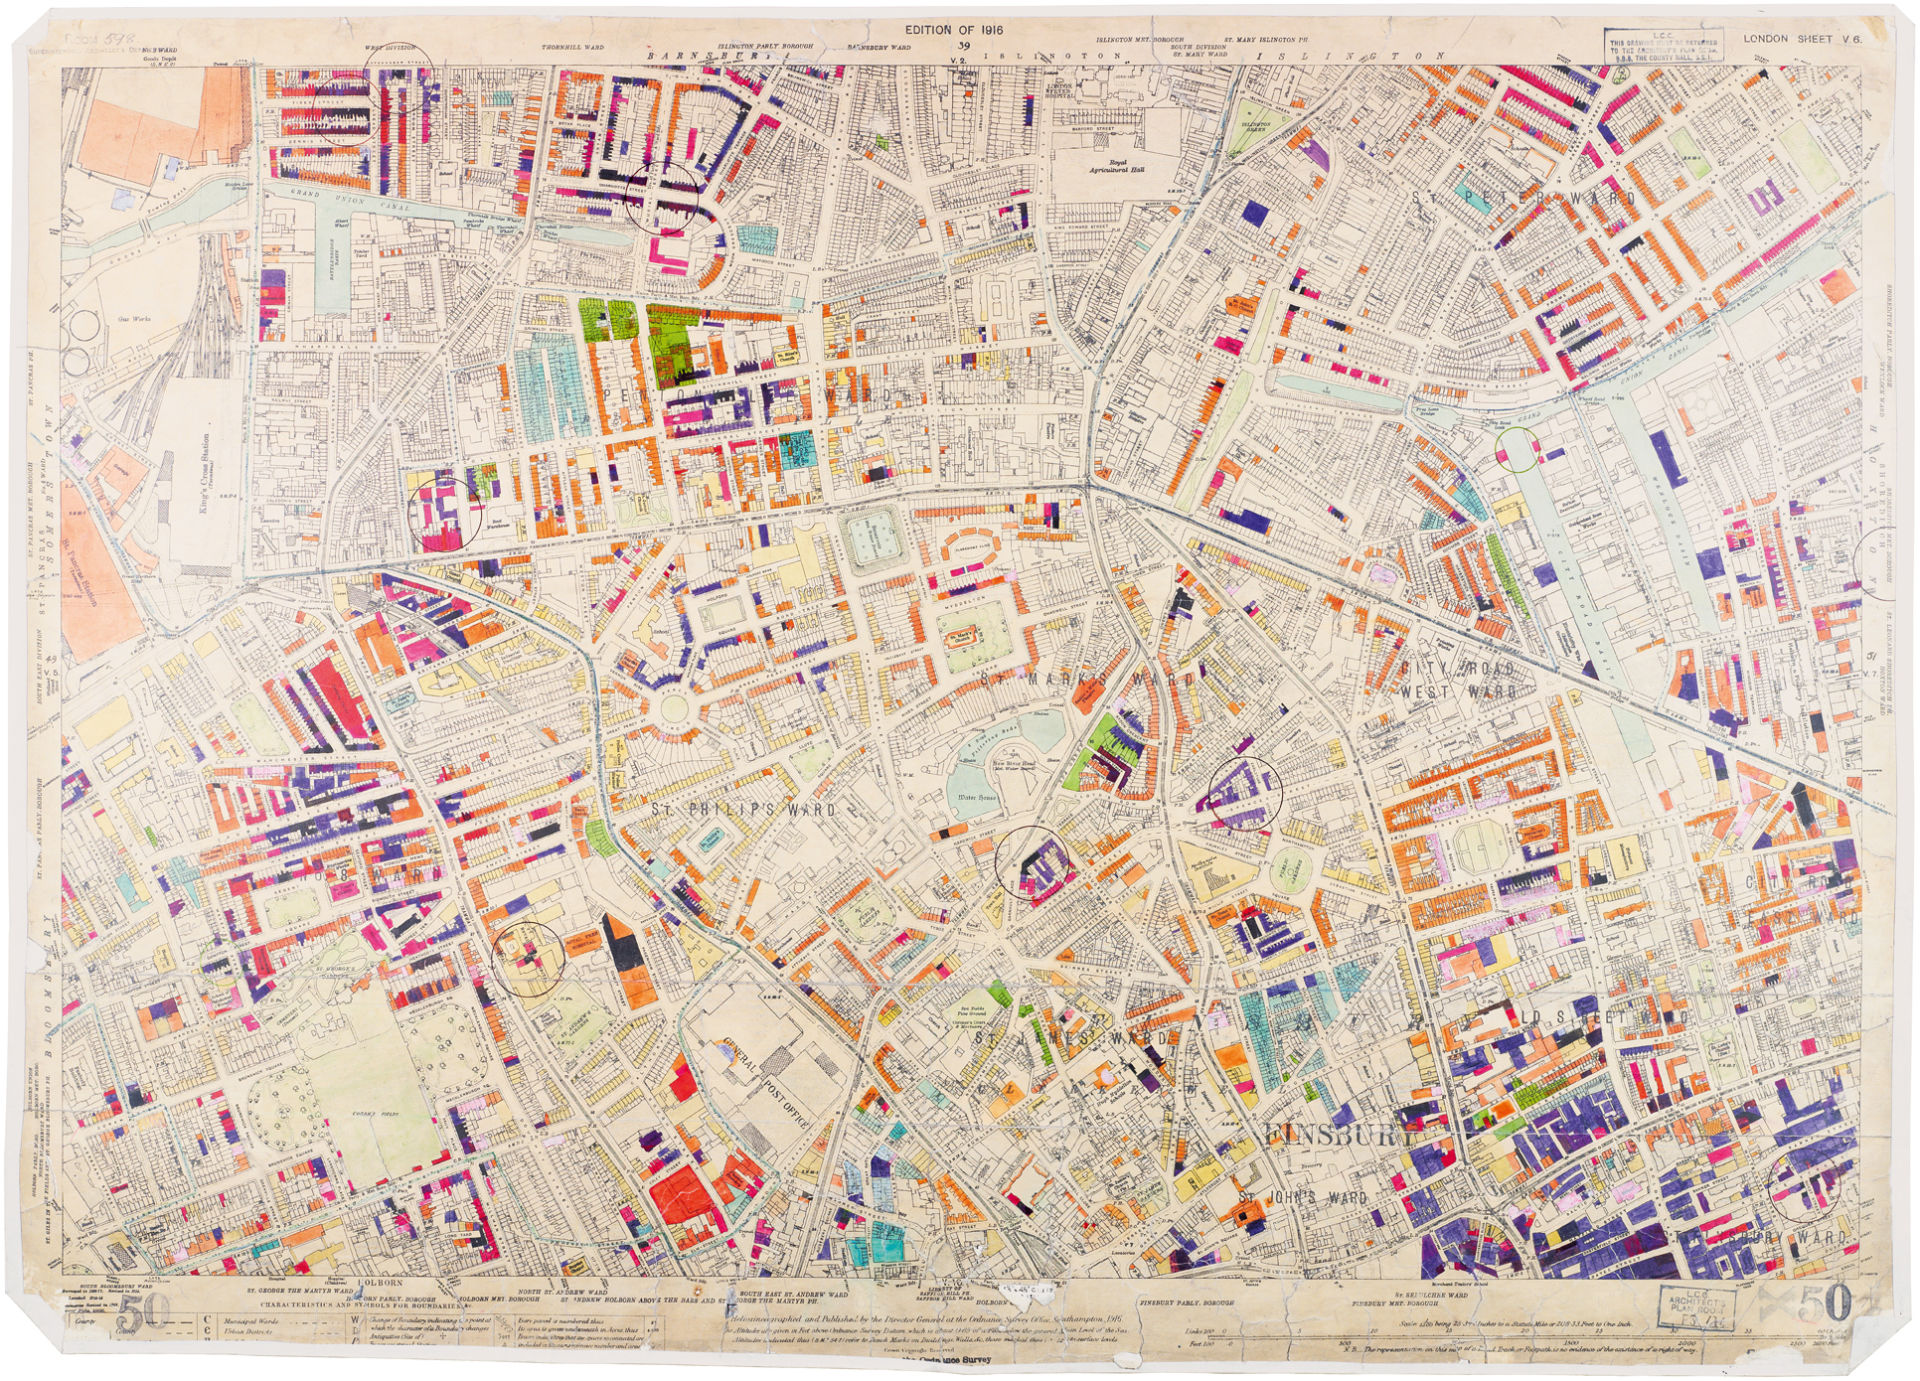 King’s Cross and Barbican/Bomb Damage Maps/London Metropolitan Archives
 Detail of four V-2 strikes, Bomb Damage Maps/London Metropolitan Archives/City of London Police
 Waterloo
 Detail of Above, showing sis V-2 Strikes/Bomb Damage Maps/London Metropolitan Archives
4. The maps of bomb damage were commissioned by the London City Council sought to capture the scale and extent of the devastation of aerial bombardment, before the age of geolocation, using the industry of architects and engineers who performed a rescue service in response to almost 16,400 bombing raids, and actively assessed the damage done to London during the war. Despite the extensive loss of lives, the maps, which show a restraint and odd distancing of the actuality of terror that dates them before television screens or the vicarious observation of large-scale violence, are less made for an audience of viewers than to prepare an analytic record for the future–and seem to consider the future landscape of the city as if in an exercise of good thinking in ways we rarely do in mapping the bombed out landscapes of Afghanistan, Pakistan, Iraq or Syria–for most places in which, including long-besieged population of the city of Aleppo, estimated at over two million, where no comparable on-the-ground maps of damages actually exist.
For the mappers’ intent was less to note the growing number of human casualties from bomb blasts than to try to narrate the tragic episode of military attacks on London as a community. Implicit in the elegant color-coding atop existing 1916 Ordnance Maps of London that noted every building, street, and park of London, revealing an intent attempt to keep composure while assessing the local extent of the damages created by incoming rockets as if to account for a constantly changing relation to space. The encoding of damage captured a changing urban landscape that allowed from the perspective of the sudden disturbance of the city’s plant–as if their rebuilding was always on viewers’ and user’s mind as they read and interpreted distribution and extensiveness of damage to individual buildings in the city. Although they now seem considerably antiquated with time, the Bomb Damage Maps eloquently preserve a sense of the considerable demand to retain the unity of a vanished urban landscape in the course of the war, as well as to tally up the unremitting indefensible assault on the city.
There is something particularly poignant, valiant and curiously removed–and farther than ever before–in how the Council’s maps adopted the block-by-block surveys to take stock of the damage inflicted by flying ballistic missiles that suddenly appeared, causing damage before their arrival was even heard, creating a record of the new reality of war that had suddenly extended to include the Home Front–using circles to designate the sites at which V-2 rockets regularly struck, and the color-coding of deep purples, lines of black, and the gentler violet for the regions that were destroyed by bombing raids and rockets.

Stepney, London County Council Bomb Damage Maps, 1939-1945 (London Metropolitan Archives)
Detail of above, with V-2 Rockets encompassing purple, violet, and black
 Detail at greater scale, showing damages of six V-1 bombs and one V-2 rocket
The care with which the Architects Office tracked the unprecedented scale of destruction were based on judging devastating effects on the city to be mapped by a color-coded key of the extent of damage in each neighborhood, to track the ongoing losses inflicted every day. In tracking each neighborhood’s relative damage was tracked, block by block, building by building, a composite aerial view of the city was created, but in the service to preserve a sense of place under attack, as if to make losses legible and to grasp the scale of their destruction–noting the state of each street corner in each neighborhood, and destroyed residential blocks the line the city blocks of London as if to preserve an image of what was. The choice of such light pastels seems an aesthetically brave transcription of the violent obliteration of an urban landscape–as bombing raids changed London’s cityscape and the architecture, obliterating buildings with a terrifying instantaneous force–whose instantaneous explosions were often seen before being heard.
There is some irony in the fact that the very same missiles–the V-2 rockets–were used to create some of the earlier aerial maps of place when they arrived, with Werner von Braun, to the United States in the post-war world. The far more local maps that the London City Council commissioned during wartime seem a process of cartographical mourning of the local landscape, and as such, it is hard not to read their distanced tracking of the destruction of local buildings in London against the iconic images of the damage and tragedy of the two Boeing 767 passenger airplanes hijacked to collide into New York’s World Trade Center, and the damage caused by the ignition of the 20,000 gallons of jet fuel each carried; the image of the crashes that interrupted the New York cityscape’s bright blue skies and left 3,000 dead is seared into our minds, among the most photographed and rewatched moments of the past fifty years–if it is still poorly grasped or understood.
There is a sharp contrast of the sustained bombing of the city to the apparent unicum of the image of flames bursting from both towers in the moments after collision, and their later destruction to rubble, is mourned by the maps of the hijacked airplane’s arrival, as by towers absent from lower Manhattan’s skyline, and so often commemorated over decades. For the regularity of the onslaught of bombing demands a different sort of mapping, and was designed to destroy the urban fabric, as much as attack one target, and seems akin to the ongoing bombing of Aleppo by Syrian and Russian forces over multiple years, in ways that made the arrival of bombs a terrifyingly undeniable part of urban life. Unlike the destruction of the World Trade Center, long taken as emblematic of an assault on the Untied States as a nation, the ongoing destruction of buildings in the Blitzkrieg was mapped with far less designs of open patriotism or cinematic scope, and definitively removed from a photographic record by being mapped in the flat lines of an ordnance map. Local evaluations of damage taken by rescue teams was less to create a sense of virtual witnessing of damage in the logic of disaster movies, or to put us at the scene as observers of the terrible event, but sought to take stock of the scale of loss.
There is no sense of mourning or attempt to frame or give meaning to a human tragedy of loss of lives, in other words, but to generate an abstract assessment that archived the effect of what had become routinized events of terror. The Bomb Damage Maps were drafted by the London City Council in response to local assessment of air raids; its Architects Department carefully assessed local damage to buildings from 1939 to 1945, sending surveyors and engineers to examine bombed out sites in the city between regular rocket raids. The only recently published maps designed to assess bomb damage reveal the scope of London’s devastation during the Blitzkrieg, designating degrees of damage in each region of the city–“Total Destruction,” “Damaged Beyond Repair,” “Seriously Damaged–Doubtful if Replaceable.” These elegantly hand-colored maps collate the extent of individual strikes and coded, registered in ways that presented an ongoing record of the devastating effects of the so-called vergeltungswaffen, which arrived in five minutes to their targets, powered by liquid ethanol, in a new science of military destruction.
The maps of the damage of aerial bombing, oddly rendered beautiful by their choice of pastel colors, for this blogger cannot help but recall the war-time map from the Blitz that was studded with spectrum of multicolored stars “that cover the entire spectrum” which the fictional American military intelligence officer Lt. Tyrone Slothrop tacked beside his desk in a military office wartime London during the Blitz, which Thomas Pynchon took as a central fiction if not symbolic motif of Gravity’s Rainbow. Slothrop’s map, made while he worked for the Allied Clearing House reveals a strikingly similar pattern to a map of bomb strikes and raises questions about the slothful protagonist’s foreknowledge of strikes’ locations several days before they hid–and raise questions of what he was mapping with such accuracy. The map of colored gummy stars soon incriminate poor Slothrop, whose task was to visit the sites rocket-bombs had destroyed–and not only because it seemed evidence that he paid far more attention to the girls whose names are noted beside each star than the actual damage of explosions, even though it’s clear little was intended by those Slothropian stars, whose distribution began with silver (labeled “Darlene”), “sharing a constellation with Gladys, green, and Katherine, gold, and as the eye strays Alice, Dolores, Shirley, a couple of Sallys–mostly red and blue through here, a cluster near Tower Hill, a violet density about Covent Garden, a nebular streaming into Mayfair, Soho, and out to Wembley and up to Hampstead Heath–in every direction goes this glossy, multi-colored, here and there peeling firmament, Carolines, Annes, Susans, Elizabeths”–“perhaps uncoded, perhaps the girls are not even real” but which he began to work on about the same he began to start going out to look at rocket bomb disasters for a secret group, ACHTUNG, the ‘Allied Clearing House, Technical Units, Northern Germany.’
When the map attracts the suspicious eyes of superiors, the map leads the military to open proceedings into Slothrop’s apparent precognition by rockets that had so suddenly and indiscriminately destroyed parts of London after screaming across the sky, as they seek to understand what patterns the rocket seem to fall. While the colored pin-heads by which Roger Mexico notes the sites of V-2 strikes in the city provide a record of strikes, the paper stars that Slothrop dates map not only eros onto thanatos, but suggest a suspicious precognition of the pattern of rocket strikes that was already particularly puzzling: Slothrop’s map raised questions of the role of predetermination or chance in where those rockets hit. Pynchon used the map assembled by Lt. Tyrone Slothrop to introduce the hero’s dilemma, but it also becomes a puzzle that begins its narrative. The interpretation of the map provides a basis for Slothrop’s commitment to a mental institution, as psychologists and statisticians try to determine the possibility of a determinism in the sites of bomb attacks–leading Slothrop to wonder if the sites are predestined, and “the flight of the rocket actually follow from the fated eruption latent in the city,” in an imagined congress inherent in the arcs of the V-2’s rockets that have begun to destroy London’s fabric and its citizens. These musings are based on the revelation that the map suggests Slothrop’s foreknowledge of the bombs’ locations leads the statistician Roger Mexico to wonder how they follow a set mathematical model–finding a clear “Poisson Distributions” in the apparently random strikes of bombs in the city–leading him to question whether the apparently random pattern of V-2 rockets followed an internal logic. Roger Mexico’s map notes each event by round-headed pins “stuck in his map” to mark rockets’ strikes, they are but “a pinhole in paper that someday will be taken down, when the rockets have stopped their falling, or when the young statistician chooses to end his count.”
But the surprise at how the two maps coincide, when projected over one another, shows the distributions not only identical–they match up, square for square, girl-stars and rocket-strike circles–but that Slothrop’s dating of each star in fact proceeded the actual strike from two to ten days–suggesting his sexual adventures not only corresponded to each rocket strike, with a “mean lag” of about four and a half days, but raise the possibility (and indeed high probability) of his precognition of where the deadly rockets struck. The colored local damages in the Damage maps preserve a similarly cryptic pattern, in noting bomb damage by blocks of black, violet, red, orange, pink or blue.
Detail near Waterloo, Bomb Damage Maps, showing five V-1 and two V-2 strikes
The map seems to give coherence to disorder–and lead to reflection on whether the war had a logic–as tMexico mapped the distribution of a similar map above his own desk, in a map of London studded with round-headed pins of the “event” of V-2 rockets. Did Pynchon himself ever see the spectrum of bright colors in the Bomb Damage Maps? The rainbow of colors that render disastrous damages similarly struggled to give coherence to the absence of evident meaning in the barrage of destruction that the rockets wrought in London, if Slothrop’s map was certainly also a bit silly. There is certainly an odd beauty in the classical rigor by the extent of damage done by V-1 and V-2 Rockets is tracked in the Damage Maps of London’s devastation by the Blitzkrieg– an odd silence of the human deaths that accompanied these deadly and unforeseeable strikes from above.
5. The archival maps offer the most analytic register of the strikes, and distinguish the strikes from V-2 rockets by smaller circles–using larger ones to mark the bombs delivered by V-1 unmanned planes–and the physical damage they created to the city.
The marks cannot capture the extent of damage created by their range of impact around London, nor do they entirely try, but they track Blitzkrieg as it was lived through–less as a range of impacts, than the qualitative damage they produced, as if in real time, and offer a record of destruction more than the Google Maps register of datapoint can capture–despite the horror of its density.
Viewing the methodical Bomb Impact Map, one cannot help but be struck by the set of muted pastel colors that cluster sites of impact and destruction, and elegant vision that the color-coded field of pastels preserve. They almost orient viewers an aestheticized to an early record of mass-destruction. Its color spectrum seem to come to terms with the unprecedented scale of destruction, by re-dimensioning the loss to a scale by which to grasp what parts of the city might possibly be repaired, as if the destruction could be tracked in a recognized and remembered place, even many were actually obliterated.
The work of mapping seems a clear attempt to re-dimension the stunning intensity of loss, or establish a sense of normalcy as far as was possible. They were organized by overlaying a range of pastel strips and circles on the Ordnance Maps: the somewhat spectral and haunting Bomb Damage Maps provided a running account of the destruction from 1944 in the Blitz, as Luftwaffe planes attempted to obliterate in some three hundred flights over the city, destroying entire neighborhoods into rubble at no actual notice, in a terrifying condensation of the rapidity of long-distance aerial strikes at a Home Front. The project of remapping the damages from V-1 and V-2 rockets, and the destruction that they caused during the Blitzkrieg, is nothing short of an act of resistance, if form of wartime mapping that seems dated and remote.

Wapping and Bermondsey/London County Council Bomb Damage Maps, 1939-1945 (London Metropolitan Archives)
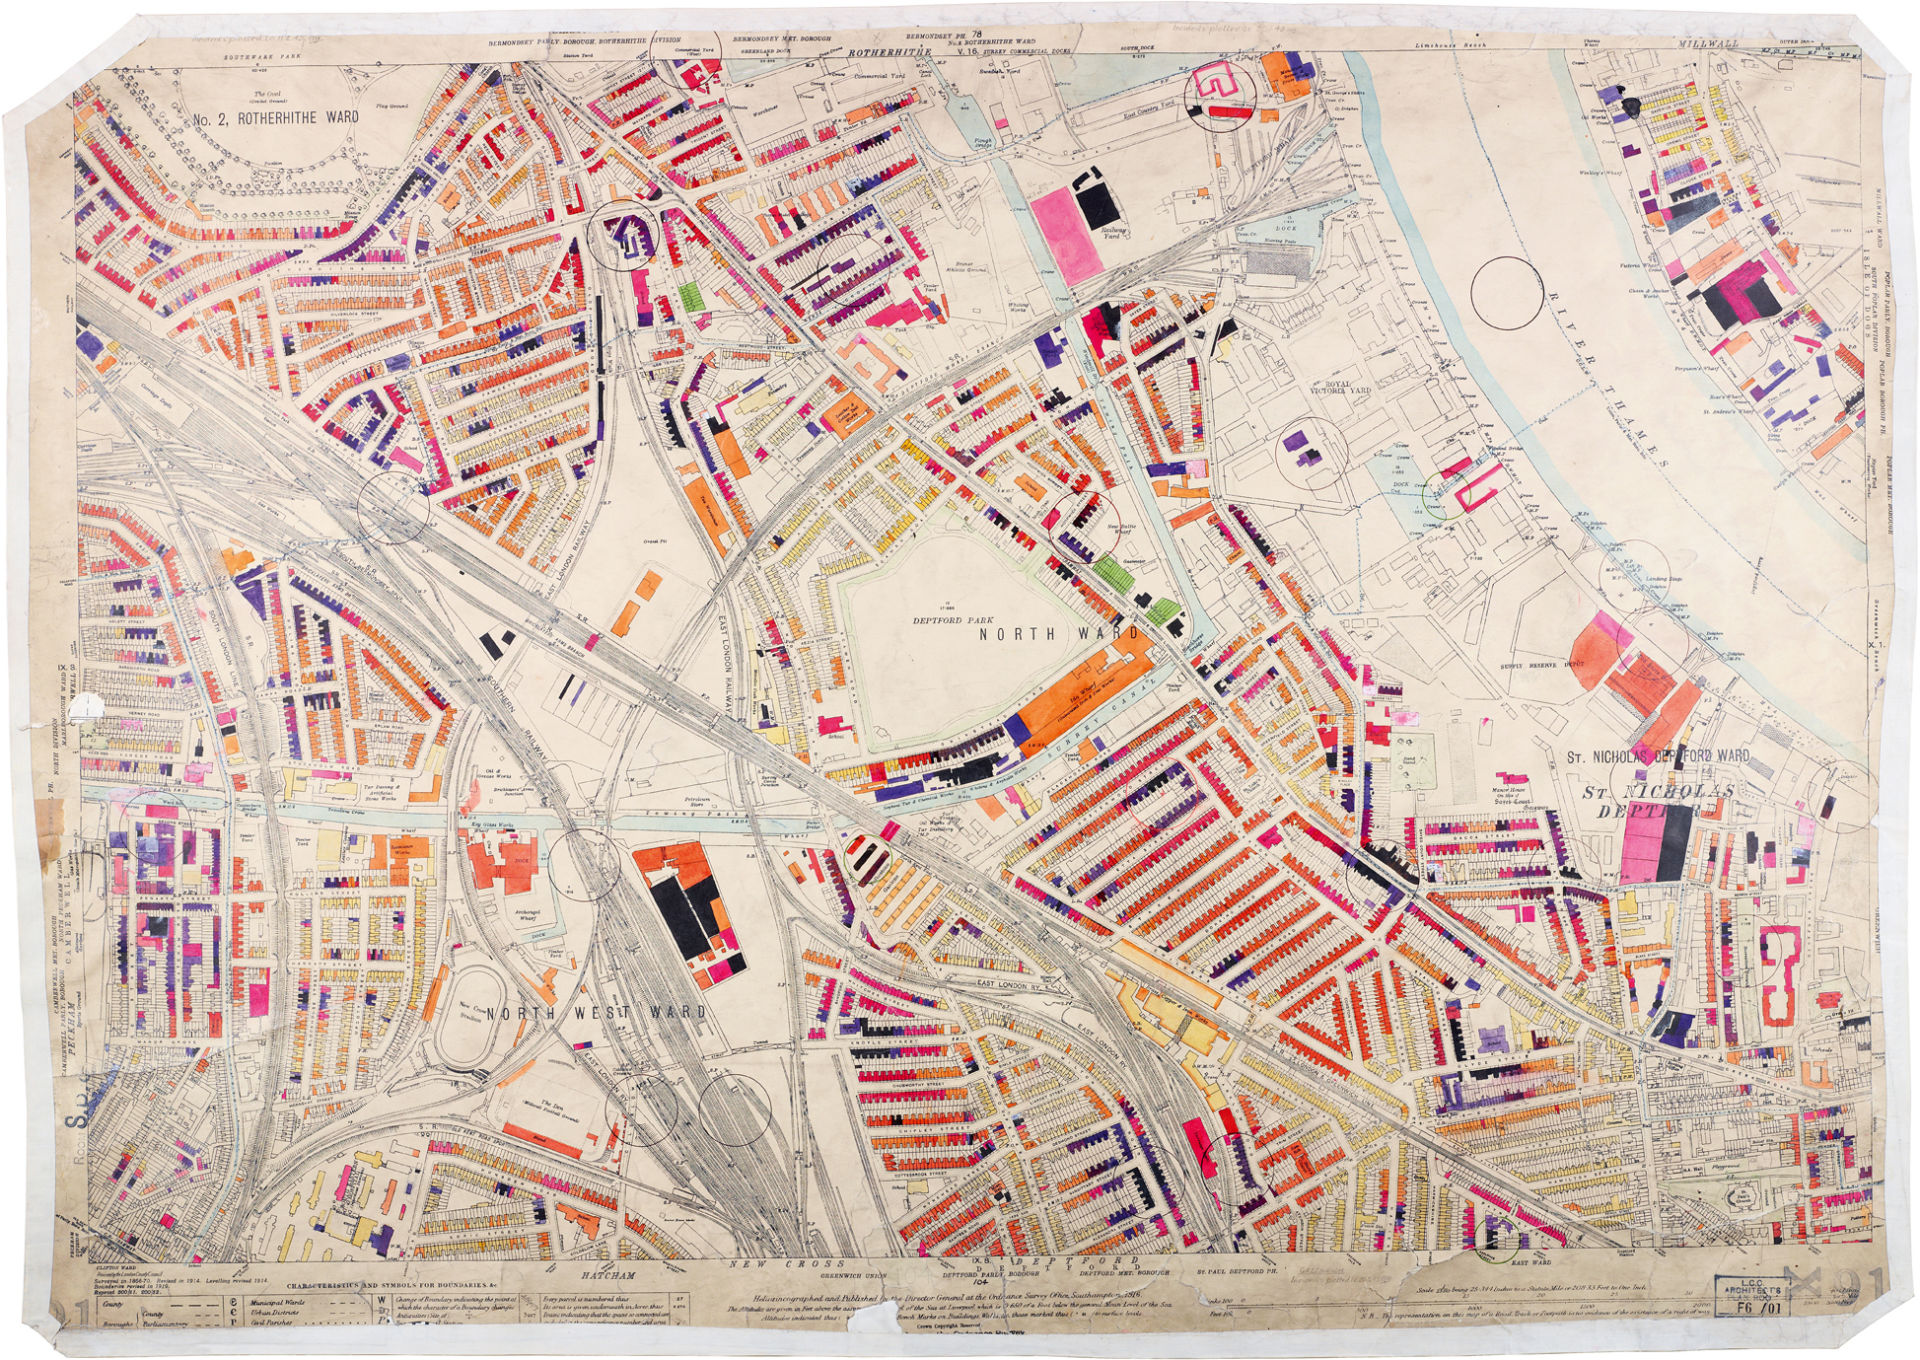
Deptford, SE London, London County Council Bomb Damage Maps, 1939-1945 (London Metropolitan Archives)
The care with which these antiquated maps, property of the London Metropolitan Archives, take to note ongoing destruction of the city seems to provide a record of the Blitzkrieg from below, taking stock of the extensive damages to familiar places and their loss, with an attentiveness and care which we could barely imagine today. The vivid colors not only trace the consequences of the thousands of bombs German Luftwaffe dropped on the city of London with a fascinating documentary appeal but seem an aesthetic response to disaster. As such, their pastel colors recall that memorable map posted in Allied Intelligence that raised colleagues’ eyebrows. Slothrop had hung beside his desk a painstakingly assembled the map of gummed colored stars across a map of London from 1943 to 1944 to chart his sexual escapades and conquests of women in the city, starting with silver, then green, gold, red, blue, and violet, and their code is never discovered, and might not even exist.
But when Slothrop’s map is discovered, and can’t help but puzzle his superiors, since it suspiciously correlates so strikingly with where V-2 bombs actually exploded. The map becomes a compelling cypher whose coded organization is a framing conceit of Gravity’s Rainbow, explained only by the peculiar history and experiences of Slothrop himself and the psychological experiments the child Tyrone underwent. Slothrop himself strove to make sense of the curious coincidence as he pasted gummed stars to the city map appear. He had started to investigate rocket disasters in the wartime city for the fictional intelligence unit known as ACHTUNG–presumably to pay attention to where bombs fell in the besieged city. The striking glossy “multicolored distribution” Slothrop creates behind his desk raises seems to be for his own memories of girls, but soon arouses suspicions from superiors, as his office-mates bring it to their attention: the map becomes a site for the generation of several theories on the distribution of where bombs fell–and psychologists are convinced of their relation to Slothrop’s own cortex–and seem to make the entire city of London a sort of experimental site to reveal what Tyrone’s foresight of the impending arrival of bombs actually consists of, and if there is a subconscious alteration of the missiles’ flight Slothrop might be able to cause by psychokinesis, if it’s just precognition, or if it is really due to a conditioned reflex that is a residue from the experiments performed on young Tyrone, which the aerial bombardment of London seems to reproduce: in any event, “It’s the map that spooks them all,” as “girl-stars and rocket-strike circles [are] demonstrated to coincide” and the dated stars in “the map Slothrop’s been keeping on his girls” always precede the corresponding rocket strikes.
The map that mirrors the distribution with which V-2’s hit London with an intensity, but rather than the sites of craters that they caused, shows a violet density around Mayfair, and red and blue beside the names of girls; it seems to illustrate a dedication to chasing English girls at sites of urban destruction and places of death in 1944. As the map is shown to coincide, the fact that they uniformly predate the bomb-strikes that Slothrop later visited, by stars that “fill the spectrum,” makes his superiors particularly interested in them as a code–or as possessing an internal logic–that suggests the rocket strikes are somehow determined by as well. Slothrop had at the very time been adding colored stars to his own map of individual girls in the same cumulative manner that the recently published color coded maps were produced by the London County Council Bomb Damage Maps by architects who were commissioned from 1939 to 1945 to assess local damage from almost regular rocket strikes. The set of a 110 maps, preserved in London Metropolitan Archives, were created by city surveyors employed to assess damage and work with rescue teams, who after returning from bombing sites worked to classify the damages cause by 16,000 explosions, noted possibilities of rebuilding by six levels of damage on military Ordnance Survey maps, but can’t leave one struck by the spectrum of their colors–and seeking meaning from the distribution of rocket strikes, much as the statisticians and military police seek to use to describe the uncanny logic of Slothrop’s maps.
Waterloo; Elephant & Castle; London County Council Bomb Damage Maps, 1939-1945 (London Metropolitan Archives)
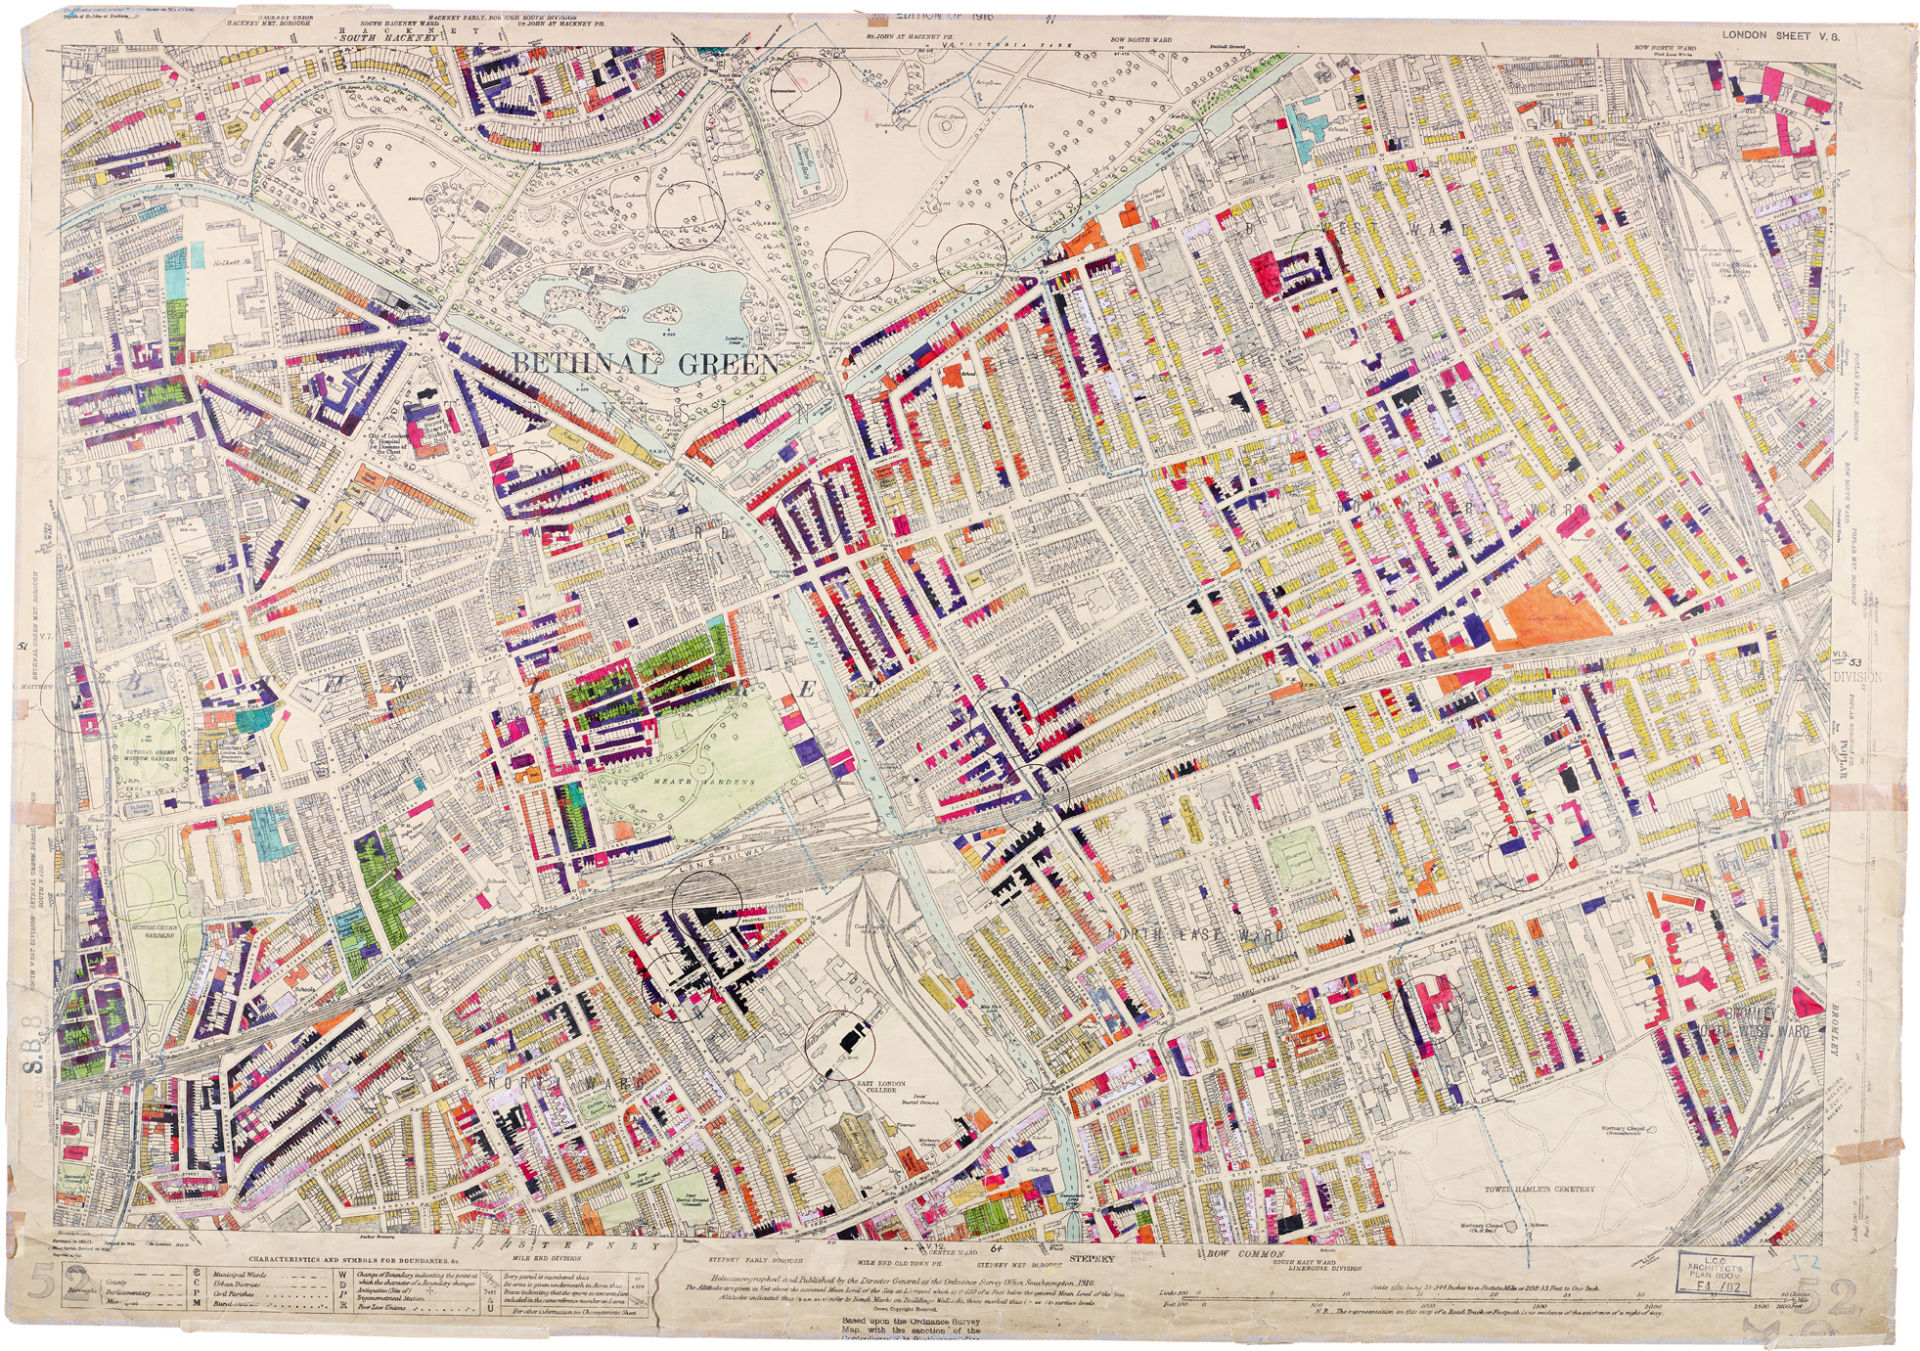
Bethnal Green; London County Council Bomb Damage Maps, 1939-1945 (London Metropolitan Archives)
The mysterious fictional map marking sites by gummed stars attracts attention and raises sudden suspicions and investigation by Teddy Bloat, after he happens to spy it behind Slothrop’s desk and notices it was begun shortly after the Lieutenant began to visit bombed sites. Curiously, they seem to predict the sites of actual rocket explosions before the fact. To superiors, they recalls the map behind the desk of the statistician Roger Mexico, marking the sites of destruction of the rockets whose approach is never heard until shortly before their hugely destructive arrival by multicolored plastic round-headed pins. The relation between the two maps is a striking image in the novel, both because of its questioning of the intersection between appearances and reality and the acute paranoia that Slothrop develops the the bombs are in fact tracking him. Slothrop carefully included names by the multicolored paper stars are puzzling: from Darlene in silver to Gladys (green) or Katherine (gold), Carolines, Annes, Marias, Susans, and Elizabeths, but prefiguring V-2 explosions by several days, as if predicting a pattern of rockets toward their targets, posing the questions about the relation of the presence of falling of bombs to human action, as well as how Slothrop came to know–or seem to know–the sites at which the rocket bombs would explode with such curiously uncanny reliability.
The bombs arrive with an unparalleled intensity, and Slothrop regularly returns from such sites of phantasmagoric destruction, as he wonders whether “There may be some cruel, accidental resemblance to life” in their pattern of arrival of “these sudden demolitions from the sky, mysterious orders arriving out of the dark laborings of nights that for him are only idle” as he searches for fragments of rockets investigating “V-2 aftermaths,” moving across London in “Slothrop’s Progress,” starting to fear that his motions are indeed being tracked in the city by bombs, while sadly working with search and rescue crews. Such fears are dismissed as being “operational paranoia,” the map that echoes the actual distribution of bombs across the city, and demand further explanation. Is Slothrop doing his job? Or does this have something to do with the odd set of Pavlovian psychological experiments to which he was subject back at Harvard? The sense of strikes as “aftermaths” of explosions suggest an attempt to gain closure by the finality of the strikes’ occurrence, even as the war was terrifyingly open-ended, lurching to its end.
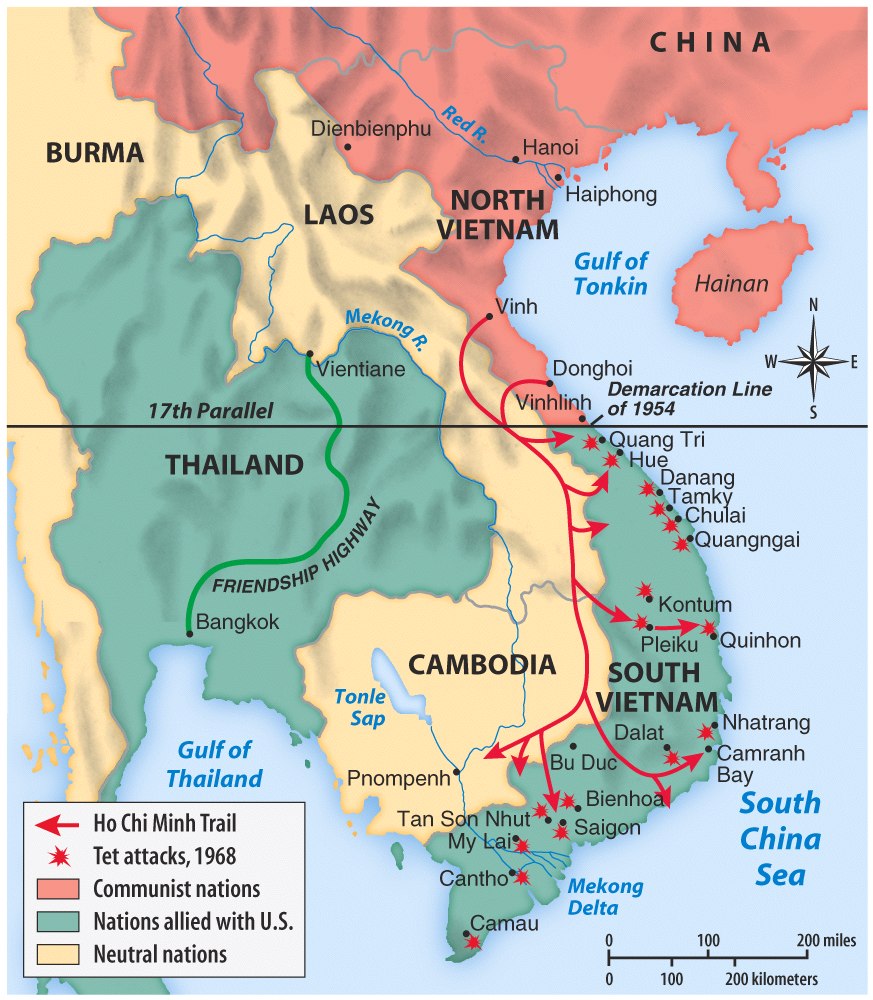
Pynchon’s exploration of the integration of the pattern of bombings that arrived in London during the Blitzkrieg with Slothrop’s personal as well as military life was not only about the Blitz. The increased pace of the curious integration of bombing into Slothrop’s life was not obliquely echoed by the increasing realization during the Vietnam War about the rising numbers of bombing raids on Vietnam, Cambodia and Laos, which began from 1965 and was the heaviest bombing campaign since World War II. Indeed, the attention of Americans slowly turned, as if slowly awakening to the actuality of war crimes, from the deaths of American soldiers, and rising numbers of POW’s and MIA’s to the terrifying pace of the actual the increase of bombings of the sustained bombardment of the Democratic Republic of Vietnam–but whose results were rarely seen or mapped–and was intended to be a similar mission of psychological deterrence rather than a tactical strike–“to peruse the Hanoi government that the cost of persisting was unacceptably high“–although the increases in sustained campaigns of bombing never produced the promised tactical results.
6. The bombed out landscapes endured, in ways only begun to be mapped. Despite some attempt to target munitions and transportation hubs, the frustration of hitting targeted sites under poor weather conditions led to the development of radar systems that were designed to predict the exact sites of bomb drops in simulations–the Radar Bomb Scoring or RBS, and SAC radar system–to allow F-100 fighters to deliver ordnance to precise sites–for unlike those V-2 which were designed by Werner von Braun, local rain and fog often meant that bombs regularly fell even as bombing concentrated on the flow of men and supplies down North Vietnam’s panhandle in 1965, and outdated F-100s and F-105’s were far less versatile in delivering bombs than required–leading to a range of armaments from cluster bombs, napalm, and television-guided missiles–and an expansion of bomb dropping that led the USAF to run out of bombs–only to be compelled to buy back some 18,000 bombs first sold to allies by the Department of Defense.
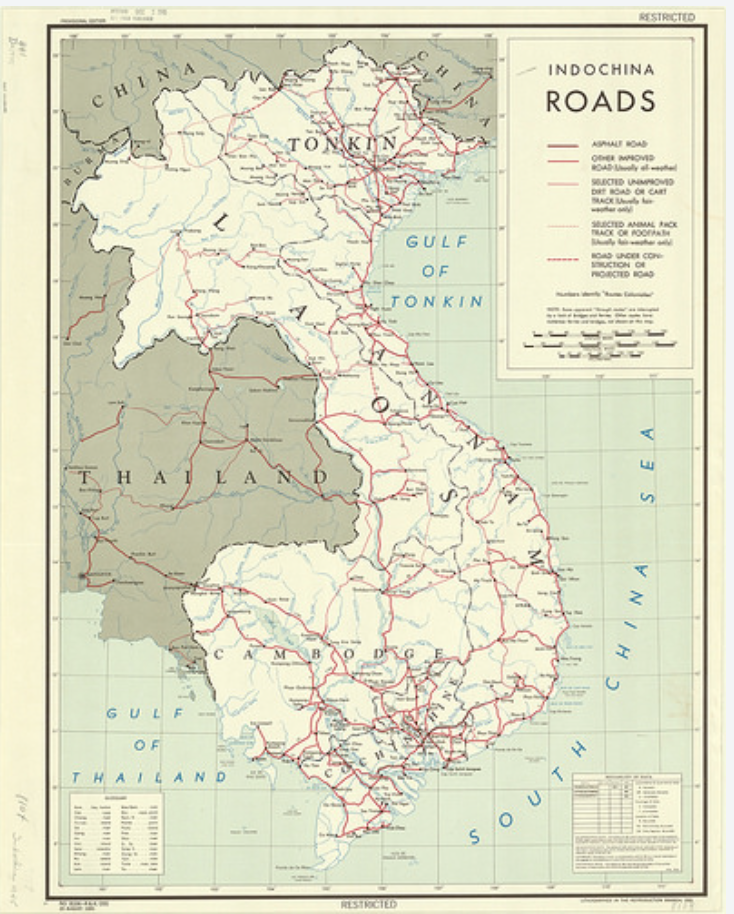
The result was to change the landscape of the Indochina peninsula as a region fed by rivers and linked by newly paved asphalt roads–
–into the heavily bombed-out landscape that it became, in ways that similarly seemed to stop history, but through which time somehow lurched. Already, the Communist-held areas of the nation were by 1951 shown as saturated in red, in a recently-released CIA map of the future targets in what was the first long war of the post-war.
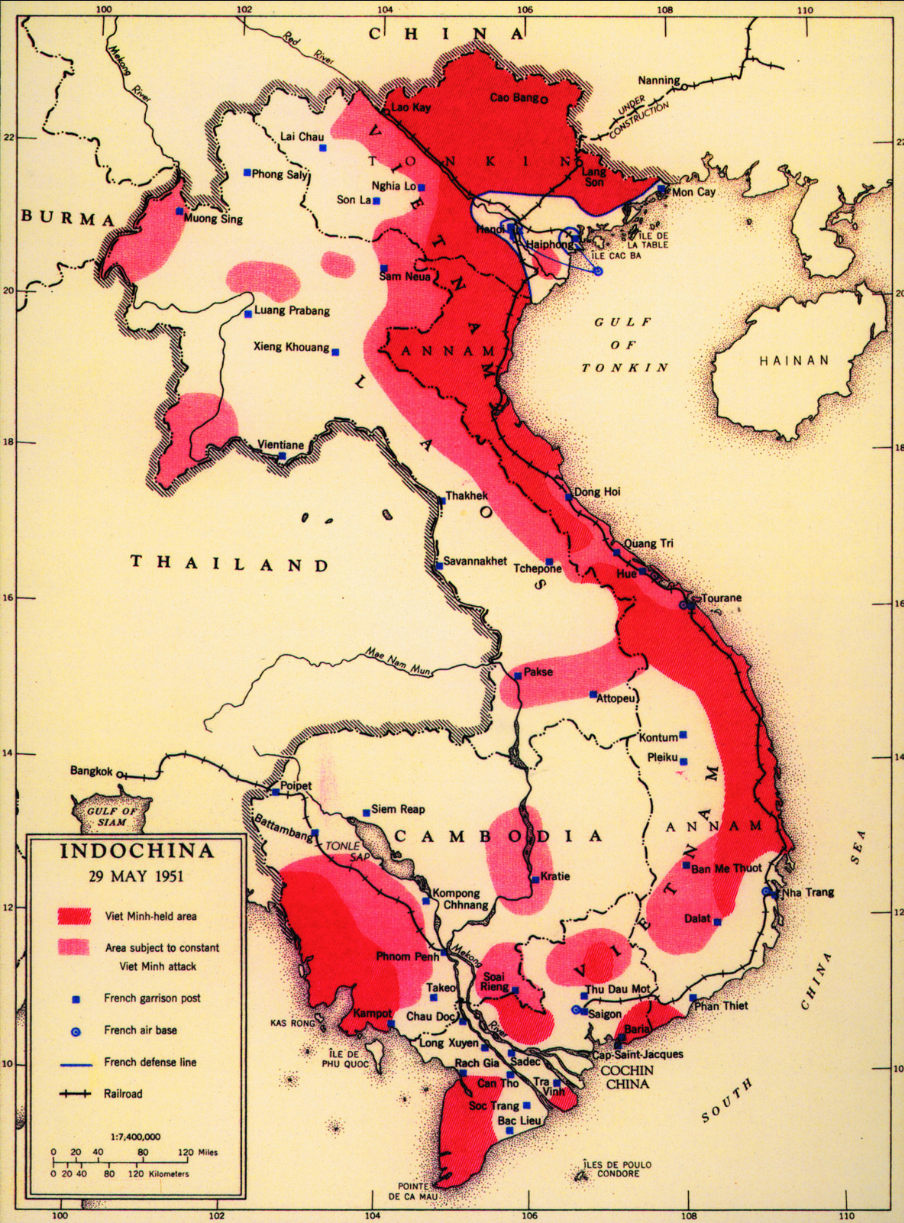 Central Intelligence Agency/Cartography Maps 1950s
And as the Vietnam war encouraged a massive acceleration of official mapmaking–which encouraged the demonization of territories occupied by “Communist rebel areas” on the map. The increased goverment demand for maps from 1965, based in the CIA, led analysts to demand using a variety of visual strategies to explain complex problems during the Vietnam War, as well as for more accurate maps to determine bombing targets: using a borrowed digitizer, a CIA working group in 1966 first created a digital geographic database, World Data Bank I (WDBI), with over 100,000 vertices so quickened the material production of maps to consolidate the widespread use of machine-generated maps, now projected by the Cartographic Automatic Mapping (CAM) program–obviating the need to determine a graticule and consigning hand-drawn military maps to the history bin.
If maps had already had a crucial rhetorical importance in Presidential addresses that took the guise of geography lessons to an uncertain nation–
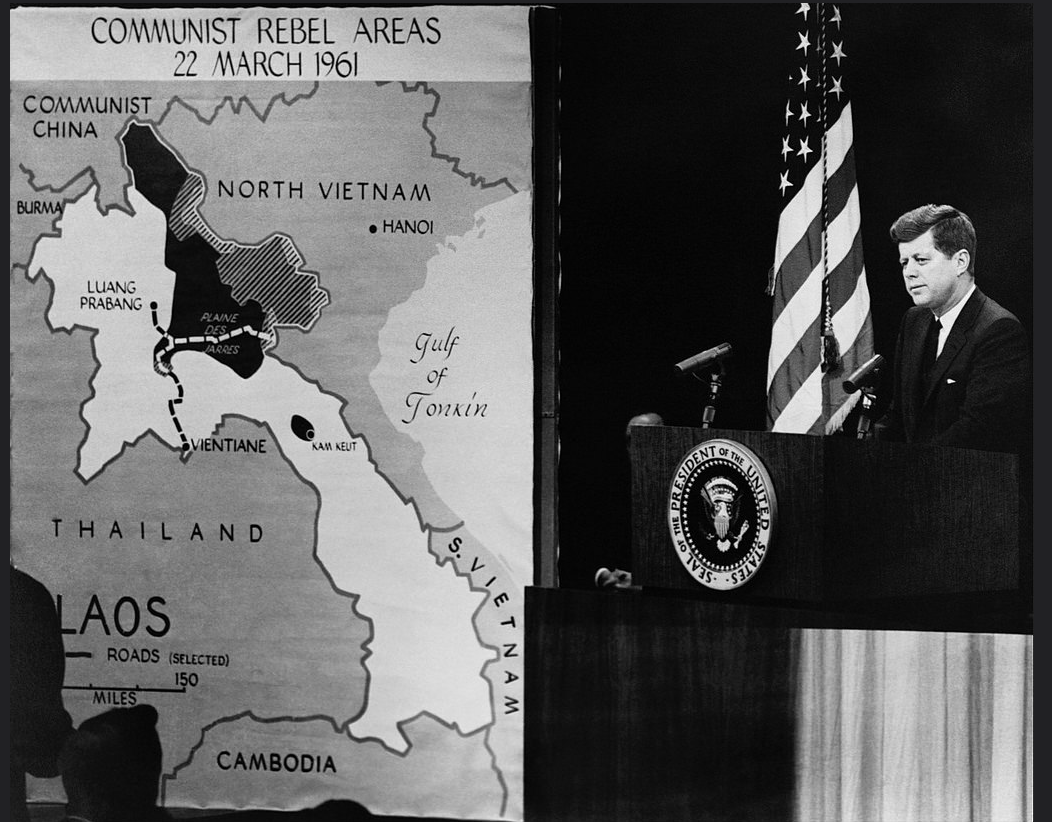 President Kennedy Describes Communist Rebel-Held Areas of Vietnam to Nation (1961)/Central Intelligence Agency
–increased military involvement in Vietnam mirrored the expansion of a rapidly expanding cartographic database in the American military and Central Intelligence Agency, compiling data on rivers, roads, centers of population and other infrastructure, as cartographical production was driven by the Vietnam War both in the government and popular press in increasingly detailed fashion, convincing the nation of the need for the war and creating an increased sense of global danger, uncertainty and risk.
7. As a broadening of targets from enemy camps and routes in an expanding airwar grew, air strikes only assumed a logic of their own–in part because USAF planes lacked requisite precision, and in part due to military frustrations–creating a bombed out landscape of carpet bombing more intensive than few ever saw. As early as 1965, North Vietnamese prepared themselves for “the complete destruction of the country” against an increasingly indiscriminate air war that assumed a bizarre logic of its own: even as it emerged as a “tactical” mission, the mission all but accepted a removed relation to place–and American presidents to worry more about the accidental strike on a Russian ship than the costs of bombing a civilian theater of war, and the “primary objective . . . to communicate resolve,” and the bombed out landscapes that resulted that remained increasingly removed from American consciousness, as the rain of bombs created an eery continuum whose falling seemed to interrupt or shatter historical time.
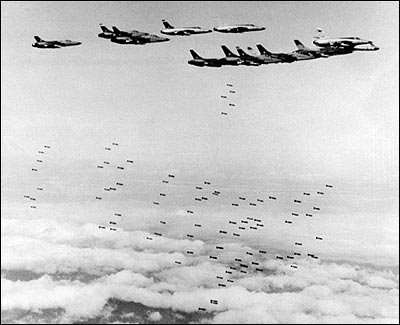
The mission sought to damage an increasing range of targets at a pace designed to shock and struck across South Vietnam in 1967 and 1968, in hopes to compel peace negotiations–even as increasing aircraft were lost over North Vietnam, and pilots captured. Many more bombs were launched against Cambodia than were fired during World War II in Europe, at a payload estimated at over 500,000 tons–leading the Guiness Book of World Records (an odd source, admittedly) to award the dubious if also terrifying pride of place to Cambodia of “most heavily bombed country per capita.”
The “secret war” against the highland plateaux in North Vietnam and Laos along the Ho Chi Minh Trail targeted military, but mostly hit civilians, leading some two million tons of ordnance to be dropped by American military planes over an expanse only recently mapped, of proportions and scale difficult to fathom–in hopes to conclude the war against a particularly and increasingly resilient population, and an increasingly unethical expansion of precision bombing raids in a mind-boggling pace of military onslaught as bombing sorties increased and multiplied beyond any rational proportions in the wartime theater–especially as the United States Air Force lacked any .
The resonance of the mapping of bomb raids that responded to the Tet Offensive on the Lunar New Year of 1968, and the escalation of carpet bombing that followed it, were increasingly mapped in print and on television in the years that Pynchon wrote, as if in eery precognition of the mapping of ongoing drone strikes in our own news media:

The expansion of bombing raids shifted from a war of psychological deterrence to a project of bombing the country into submission, which only recent attempts to reconstruct bombed out landscapes by data visualizations seem able to recuperate in their vague outlines, although the ghosts of that bombed out landscape remains.
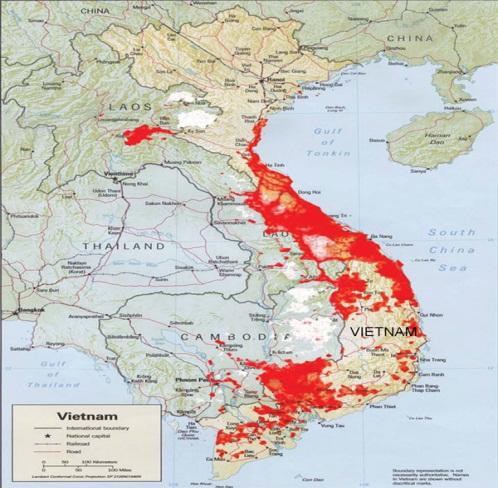
Laos today remains the most bombed country in toto, thanks to raids performed to the United States Air Force over ten years–the rendering of the expansive bombing of regions of the nation in a GIF seems almost a game of data density, so abstracted is the image from the territory as it contracts extent of the bombed out landscape to a disembodied sea of monochrome red, hard to parse and quite removed from the landscape in which they fell. Indeed, the project of reconstructing the bombing of this landscape suggests a new frontier of data visualization, with renewed ethical imperatives in an era of drone strikes, but also so eerily mapping a present-day haunting of the destruction on so much of the Laotian landscape and territory by compressing nine long and terrible years in a GIF that condenses an accelerated imagined aerial view of a bombed out expanse, removed from any real sense of place.

The strikes of B-52’s are visualized retrospectively from Air Force data retrospectively, but one can only imagine the targeting of population centers–or the heightened impossibility of living in such a scenario over a decade. The maps were not created at the time, but from USAF data, as if to comprehend the levels of destruction in a country where land mines are still being mapped in a comprehensive database of a secret war, as over 80,000 million of these sub-munitions left unexploded in Laos are being tracked.

We have tried to map a comprehensive view of bombing in the region to assess extent retrospectively from some ten years of bombing data released after the fact to grasp the effects of those many red dots in the region to understand unexploded ordnance–
and comprehend the over 221,000 people injured since the end of the war in 1975 to suffer death and/or injury on account of unexploded ordinance left across a huge landscape.
At the time of the Vietnam War and the escalation of bombing, American news media struggled to map firefights and bombing raids by similar exploding stars, as if punctuating space in ways familiar to Pynchon’s readers, the precognition of potential targets was something of a ludic counter-map, as it possibly was for the author putting pen to paper in Manhattan Beach, California. Indeed, the unprecedented carpet bombing of Laos that began as Pynchon wrote ran past the 1971 publication of Gravity’s Rainbow, visualized below from US Air Force data of missions flown to drop cluster bombs and big bombs over Laos, with an intensity that forces one to shudder, can only hint at the repeated destruction inflicted on the local landscape, and the terrible human cost of dense munition drops.
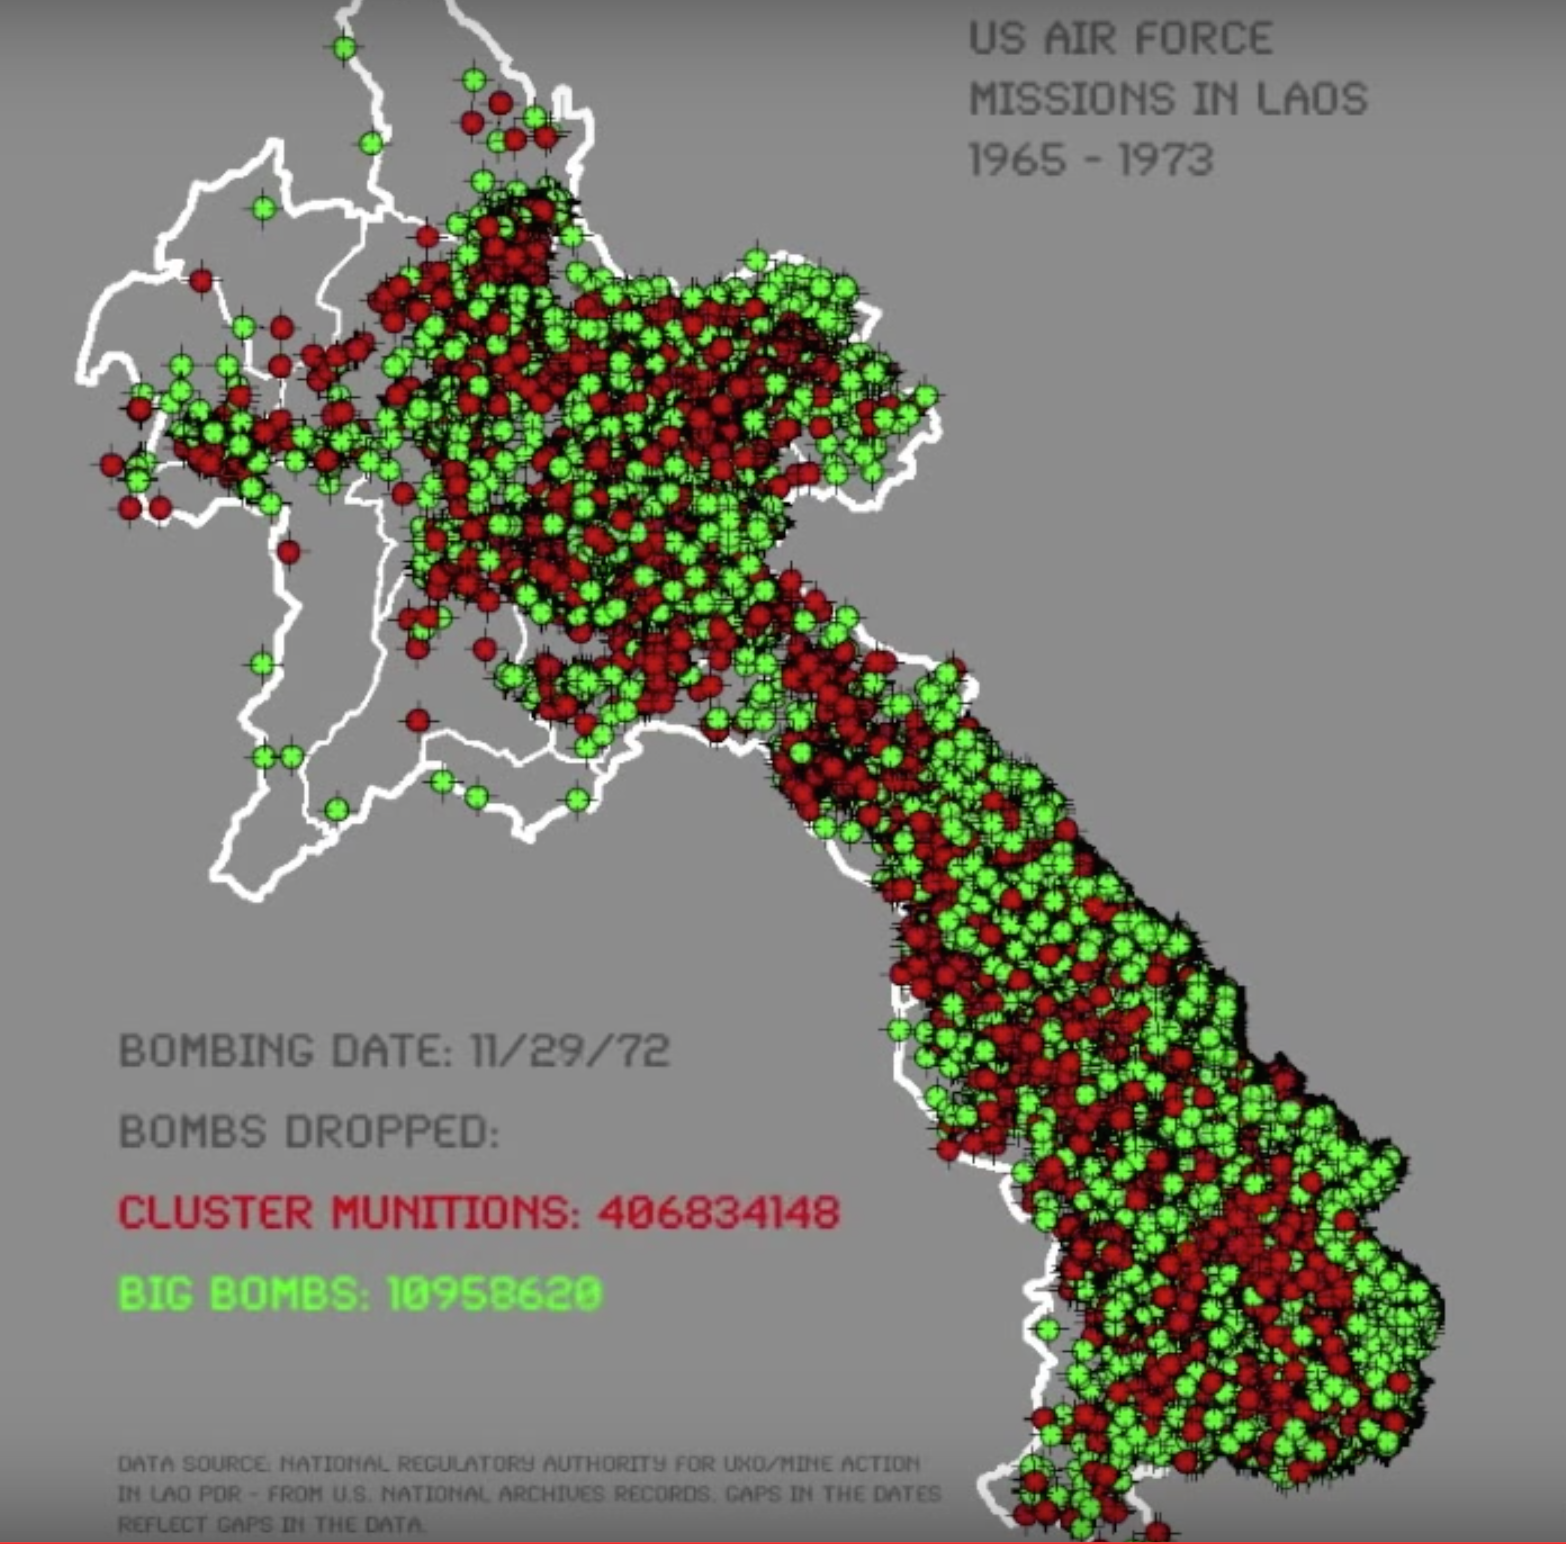
–while Americans were largely most preoccupied with mapping of the toll of American soldiers in the war, as even such abstract dots of losses of life that stud the terrain of South Vietnam by 1973 were obscured by the loss of life since 1961 by Americans, which became a primary way to view and map the stippled landscape of South Vietnam as a landscape of loss in the press as Gravity’s Rainbow (1971) appeared.
It is not a coincidence that in the same seven years Pynchon wrote Gravity’s Rainbow, Americans were increasingly disoriented to the expansion of aerial bombardment after the Tet Offensive in 1968. The expansion of aerial bombing was overwhelming, terrifying, and not comprehensively mapped. The secrecy of its intensity may have acclimated American audiences to the distribution of bombing flights across space, if not desensitizing them–and their fliers–to dropping cluster bombs from B-52 flights, terrifyingly without asking individual pilots to fathom their pattern or intersection with daily life of those who lived below.
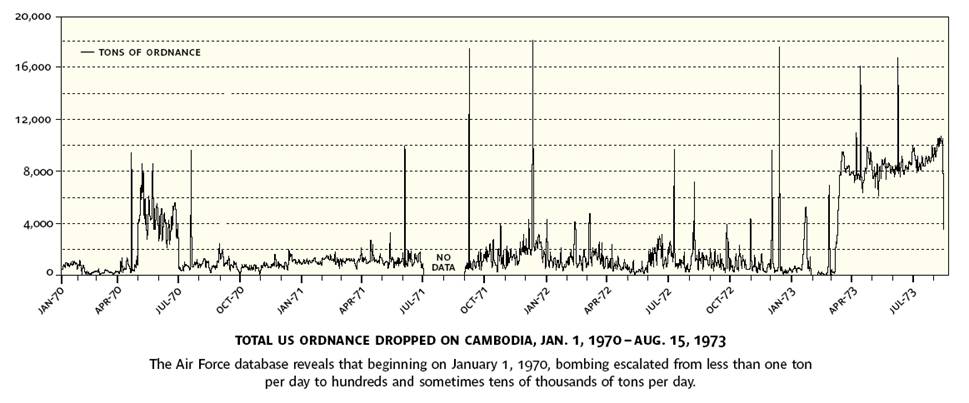
8. The considerably greater scale at which these clusters of bombing sites are mapped–incompatible and irreconcilable with the scale of local bombings of cities in World War II, as is the scale of the over 230,000 bombing sorties over Cambodia over the course of eight long years–makes it even harder to imagine the scale of destruction. The sites of bombing, here imposed upon a Google Earth projection, is so massive an aggregate of individual sites of destruction that the mind boggles. The increased scale of destruction and human loss is but attempts to take stock of the costs of the inhuman war crimes of such an ongoing series of aerial bombing strikes.
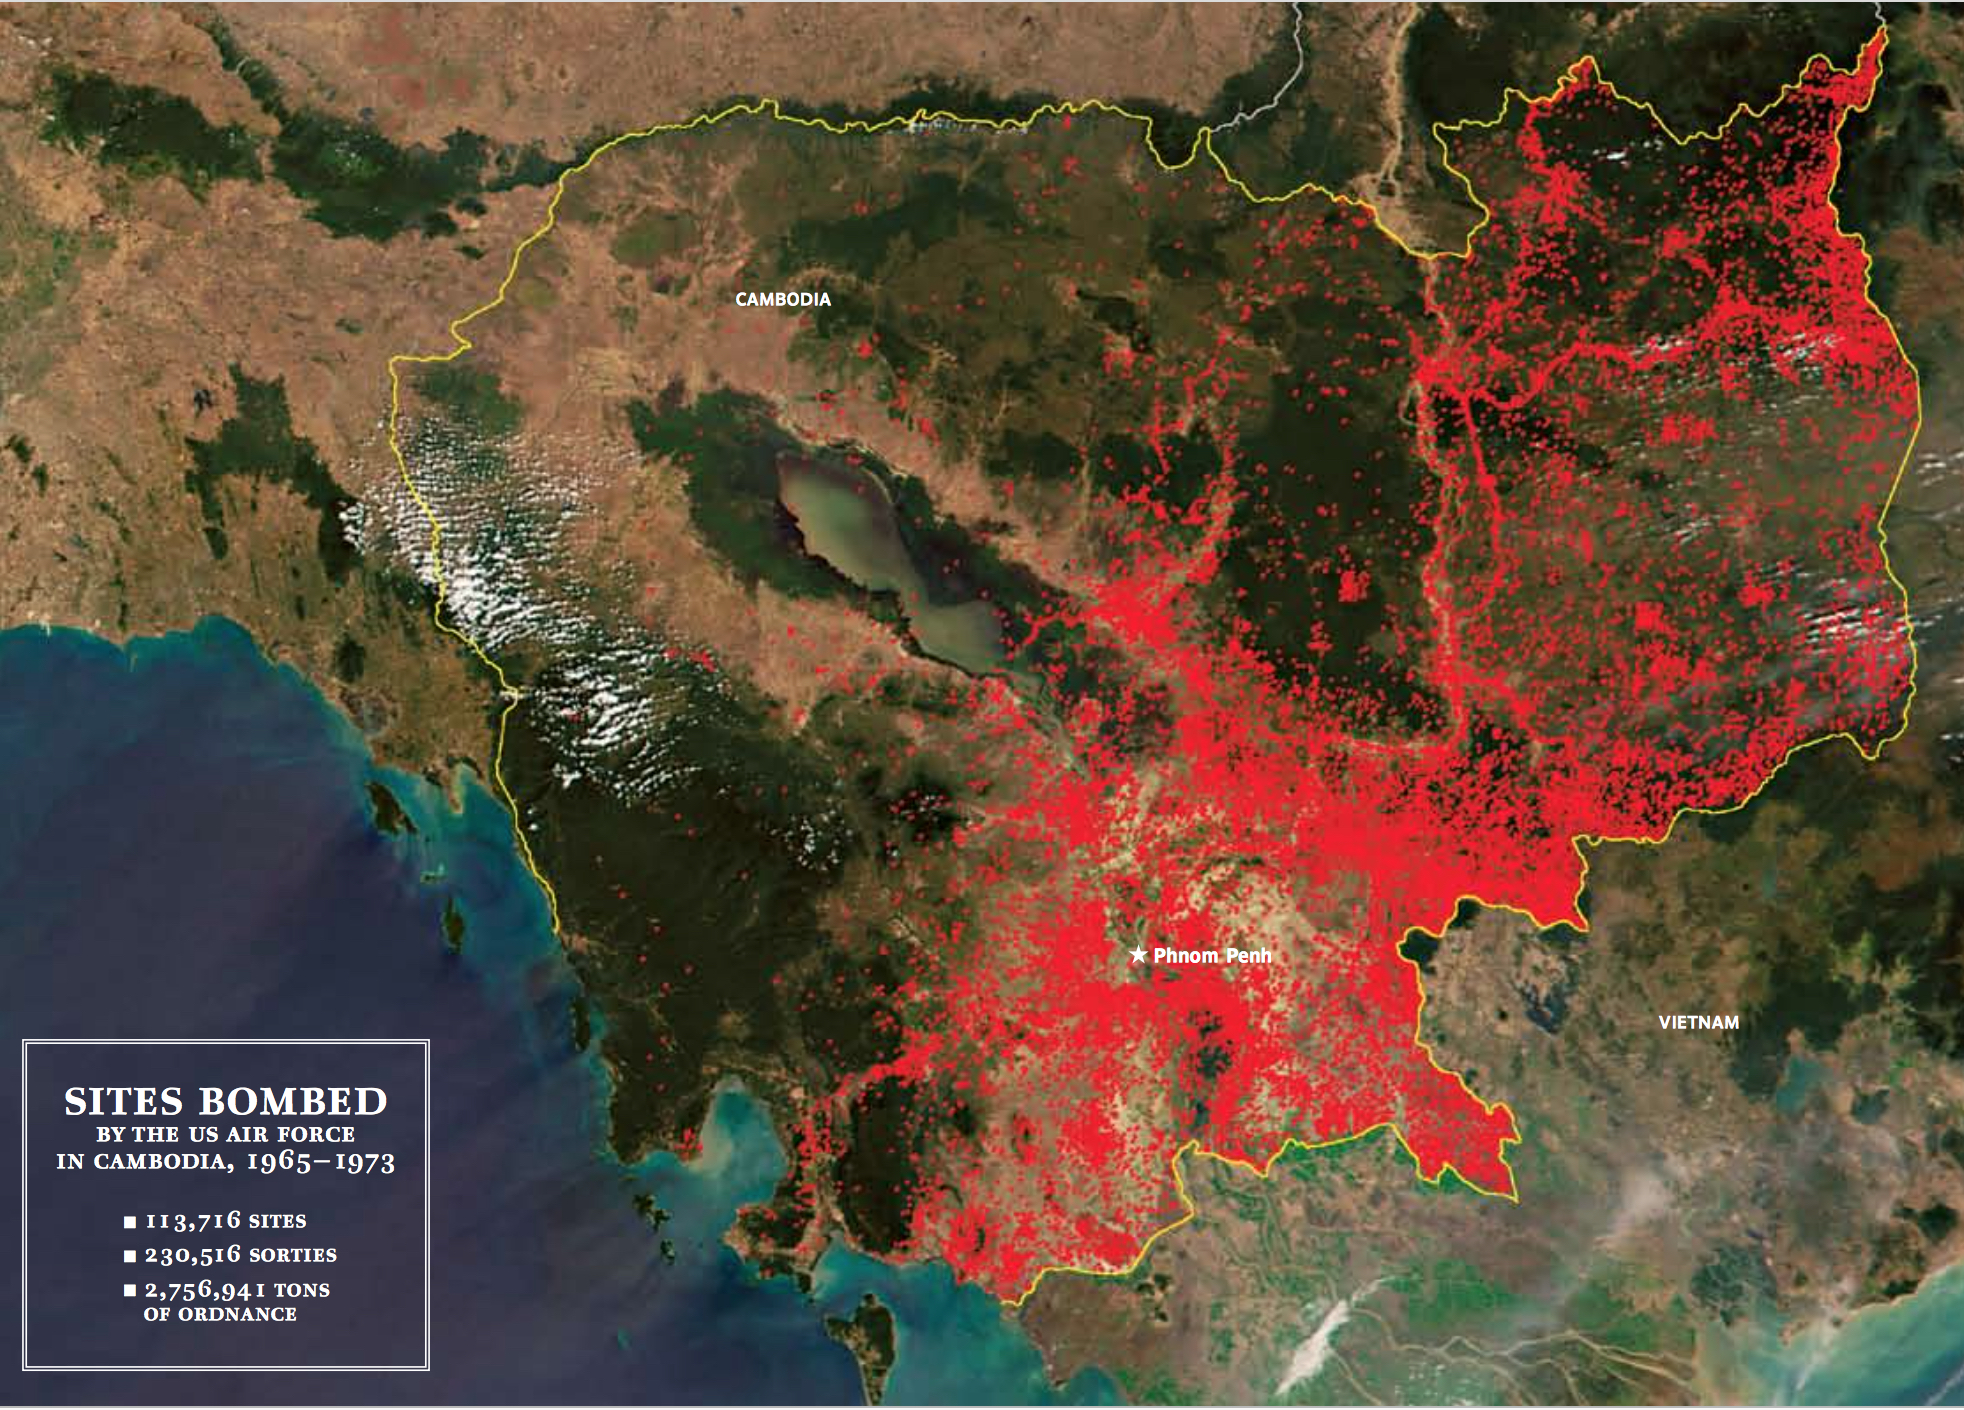
The awesome scale of the above reconstruction leaves entire areas bleached red after eight years of bombing strikes, mostly from B-52 bombers.
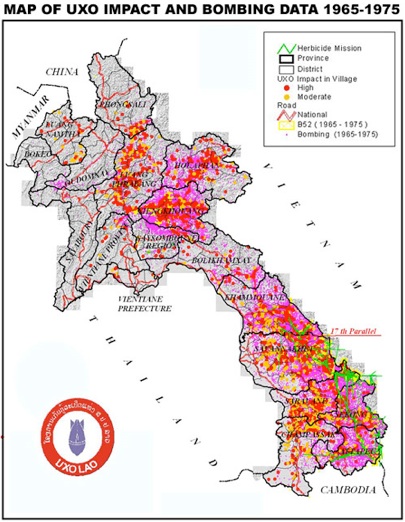
Retrospectively imaging the bombed out landscape in large scale maps of bombing targets in Laos have been made that try to escape the overwhelming of the viewer with so many crowded data points. By using U.S. military data have been made for the National Regulatory Authority for UXO/Mine Action Sector in Lao PDR (UXO-NRA), local maps of the region show a density of bombing at a level one might grasp to track the landscape they obliterated and unexploded ordnance that may remain along roads and in fields, and to gain a better sense of where unexploded ordnance might lie–as well as the extent of the destruction caused by its initial impact:
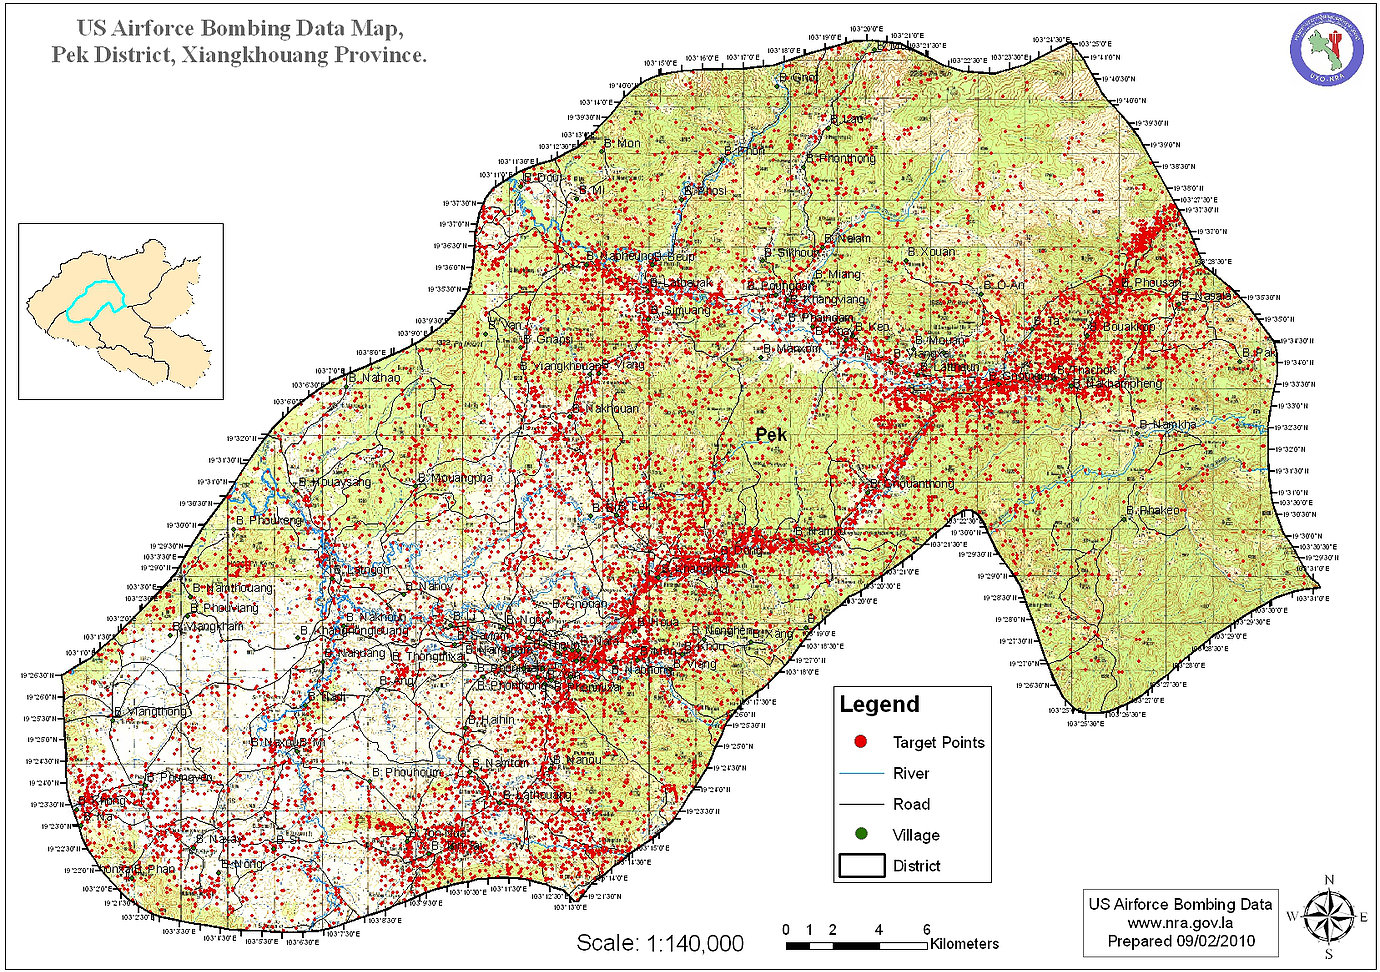
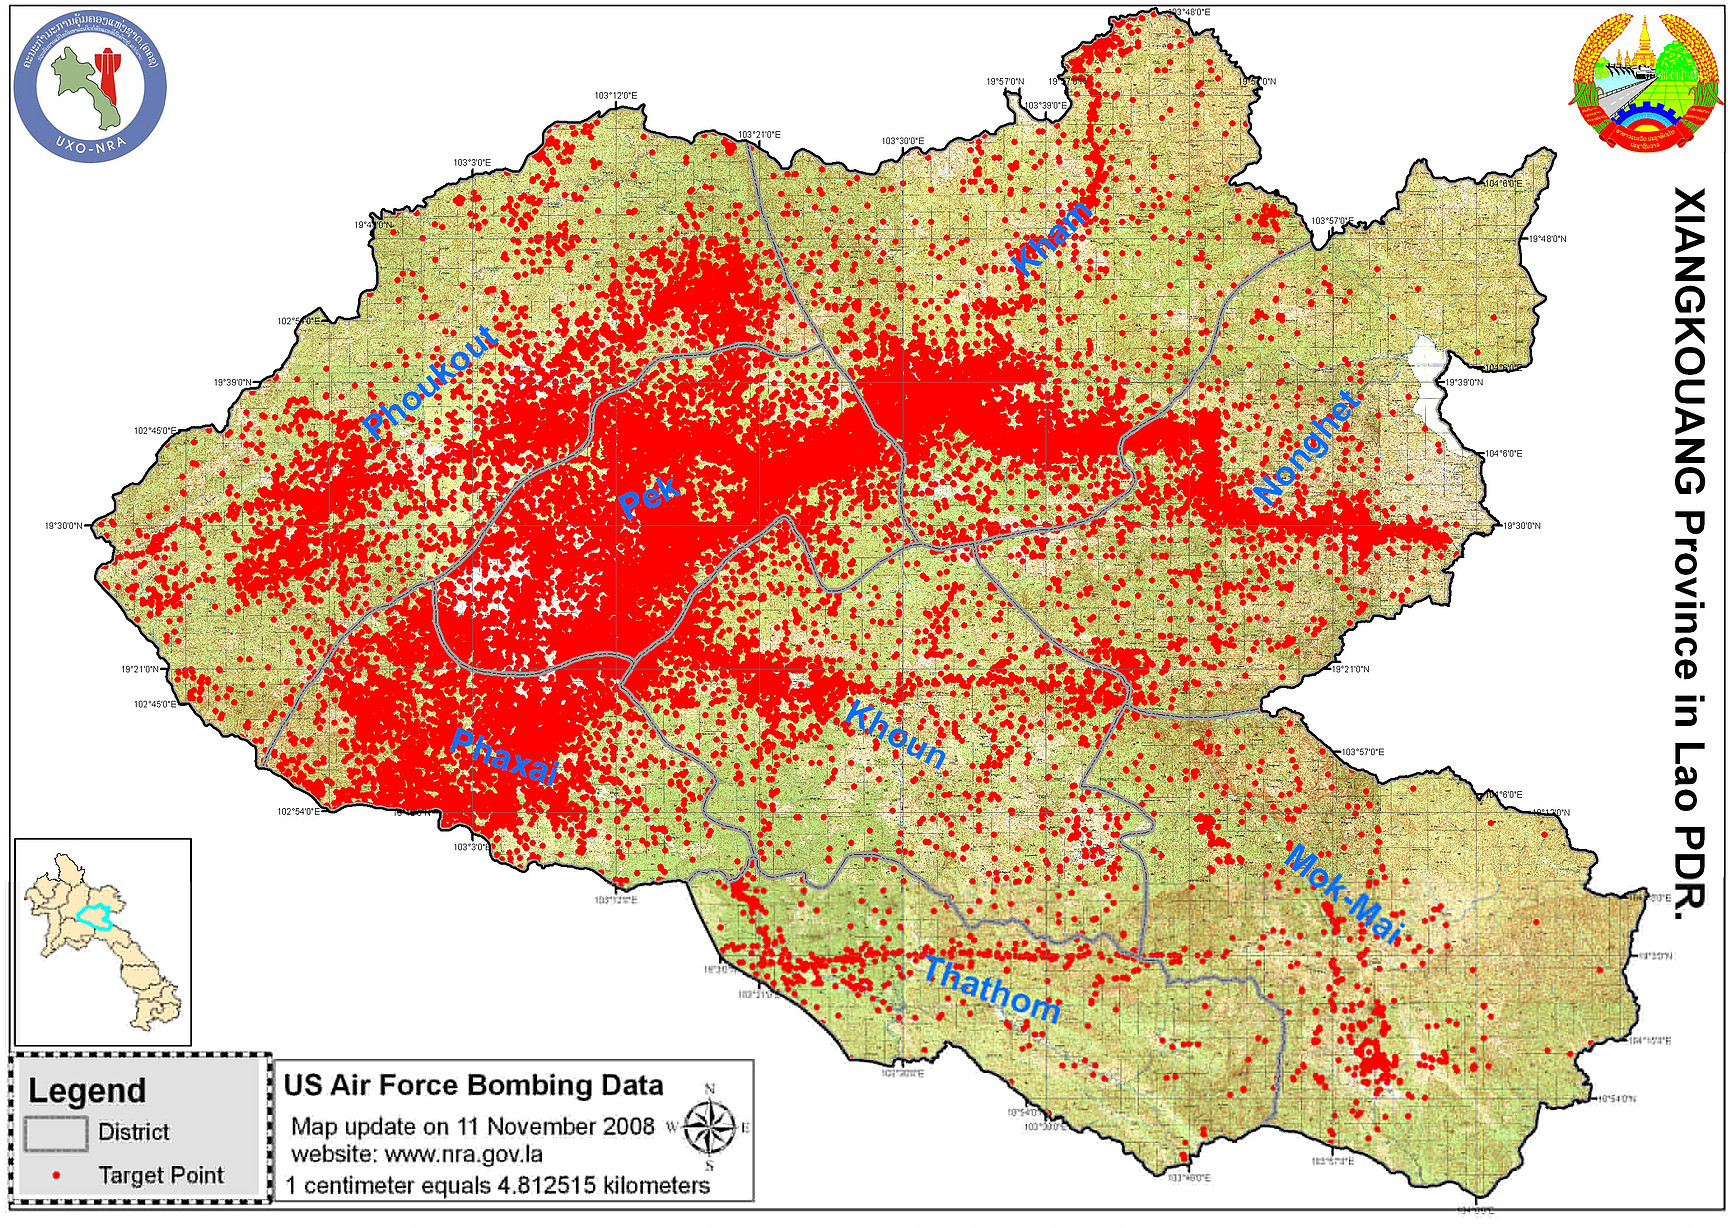 National Regulatory Authority for UXO/Mine Action Sector in Lao PDR (UXO-NRA)
Suspicions increasingly turned around Slothrop given the care he gave to compiling a map that seem to predict where bombs hit wartime London and a pretext for his investigation in Gravity’s Rainbow. The semantic status of maps as partial records and encoded signs become a compelling vehicle for the plot, as elsewhere in Pynchon’s fictions as both seductions and literary foils, as the map Herbert Stencil followed in his quest for V., in which the map provides a ploy to grasp an inexistent order, but the haunting image of the display of a map ostensibly predicting V-2 explosions in wartime Europe.
But it is odd to see these earlier colored paper “Bomb Damage Maps,” noting the extent of local destruction based on first-hand witnessing. They seem a response to the efficiency of an almost mechanized methodical onslaught of London with bombs back in the 1940s, and seem to be a possible model for Pynchon’s image of bombed out London, which itself is a prefiguring of Slothrop’s visit to bombed out Berlin, now rendered “an inverse mapping of the white and geometric capital before the destruction–everything’s been turned inside out . . . the straight-ruled boulevards built to be marched along are now winding pathways, their shapes organic now, responding, like goat trails, to laws of least discomfort.” If the Berlin bombed out landscape surpassed anything that could be mapped in terms of loss–streets reduced to goat trails–even the violence of the fall of V-2’s in the Blitzkrieg could be mapped, or processed at first hand. In contrast, the reconstruction of an awesome ten million big bombs and 270 million cluster bombs dropped in Laos–more than were dropped in all of World War II on Germany and Japan combined, and long kept a secret from the American nation, not only injured many civilians, but continued to do so, as some eighty million munitions remained unexploded over forty years, as unexploded ordnance wounded or killed 20,000 individuals. Who can measure the extent of local losses or of physical damage.
9. Which returns us to the elegant pastels of the maps compiled of The London County Council Bomb Damage Maps, 1939-1945, registering local losses incurred by air raids as assessed in real during their arrival. The maps present a picture that they present of a city partially destroyed by bombs which would damage 1.7 million buildings, demolish 70,000, and take 30,000 lives. While taking stock of the historical legacy of lost buildings in an efficient and necessary way, the maps, necessarily mute about 30,000 dead, both encode a disaster in stayed terms and register a particularly stoic response to the moment of crisis–“Keep Calm and Carry On”–whose map of the arrival of V-2 rockets along the Thames and in SE London, Elephant & Castle and Bethnal Green can be located, but the semblance of multi-colored strips to note assessed levels of damage–purple for “beyond repair” and light orange “seriously damaged, repairable at a cost” and crimson “seriously damaged, doubtful if repairable“–communicates a sense of restraint.
The color-coded spectrum of bomb damages across the city leads one only to imagine the dedication to rebuilding that was already so intense, and that barely prefigured the unheard of scale of things to come. No evident pattern emerges to the strikes, similar to that which Mexico deserves, but the multiple strikes on the neighborhoods where rockets fall during the aerial bombardment seems to suggest their obliteration, and the bizarre randomness with which misfortune seem to have struck select neighborhoods, and the city as a whole lived on edge with the near-constant background sound of rocket explosions from bombs that suddenly arrived overhead.
Mayfair and Soho; note V-2 Rockets; London County Council Bomb Damage Maps, 1939-1945 London Metropolitan Archives
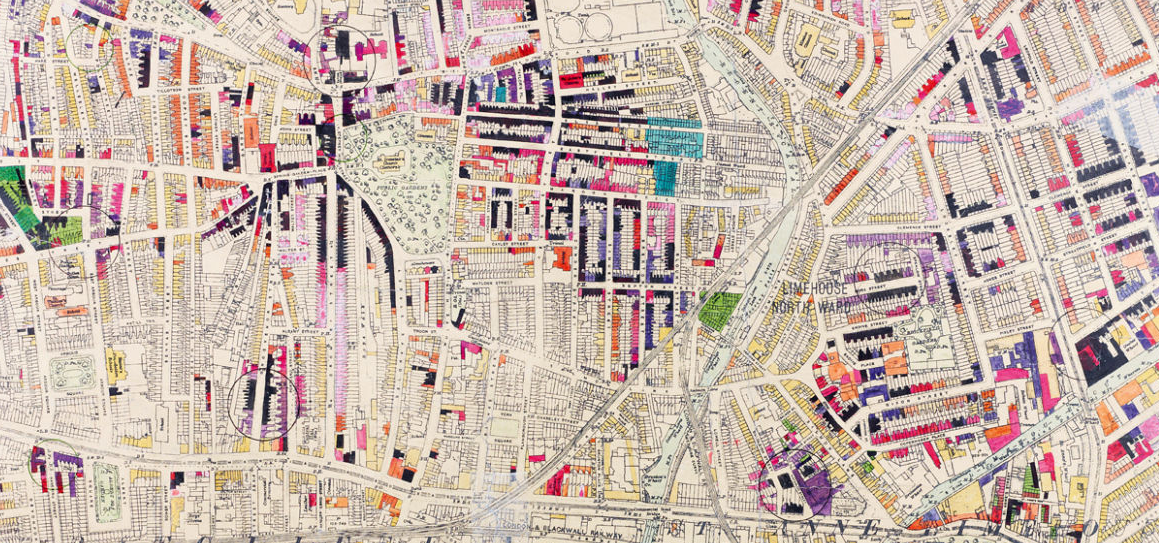
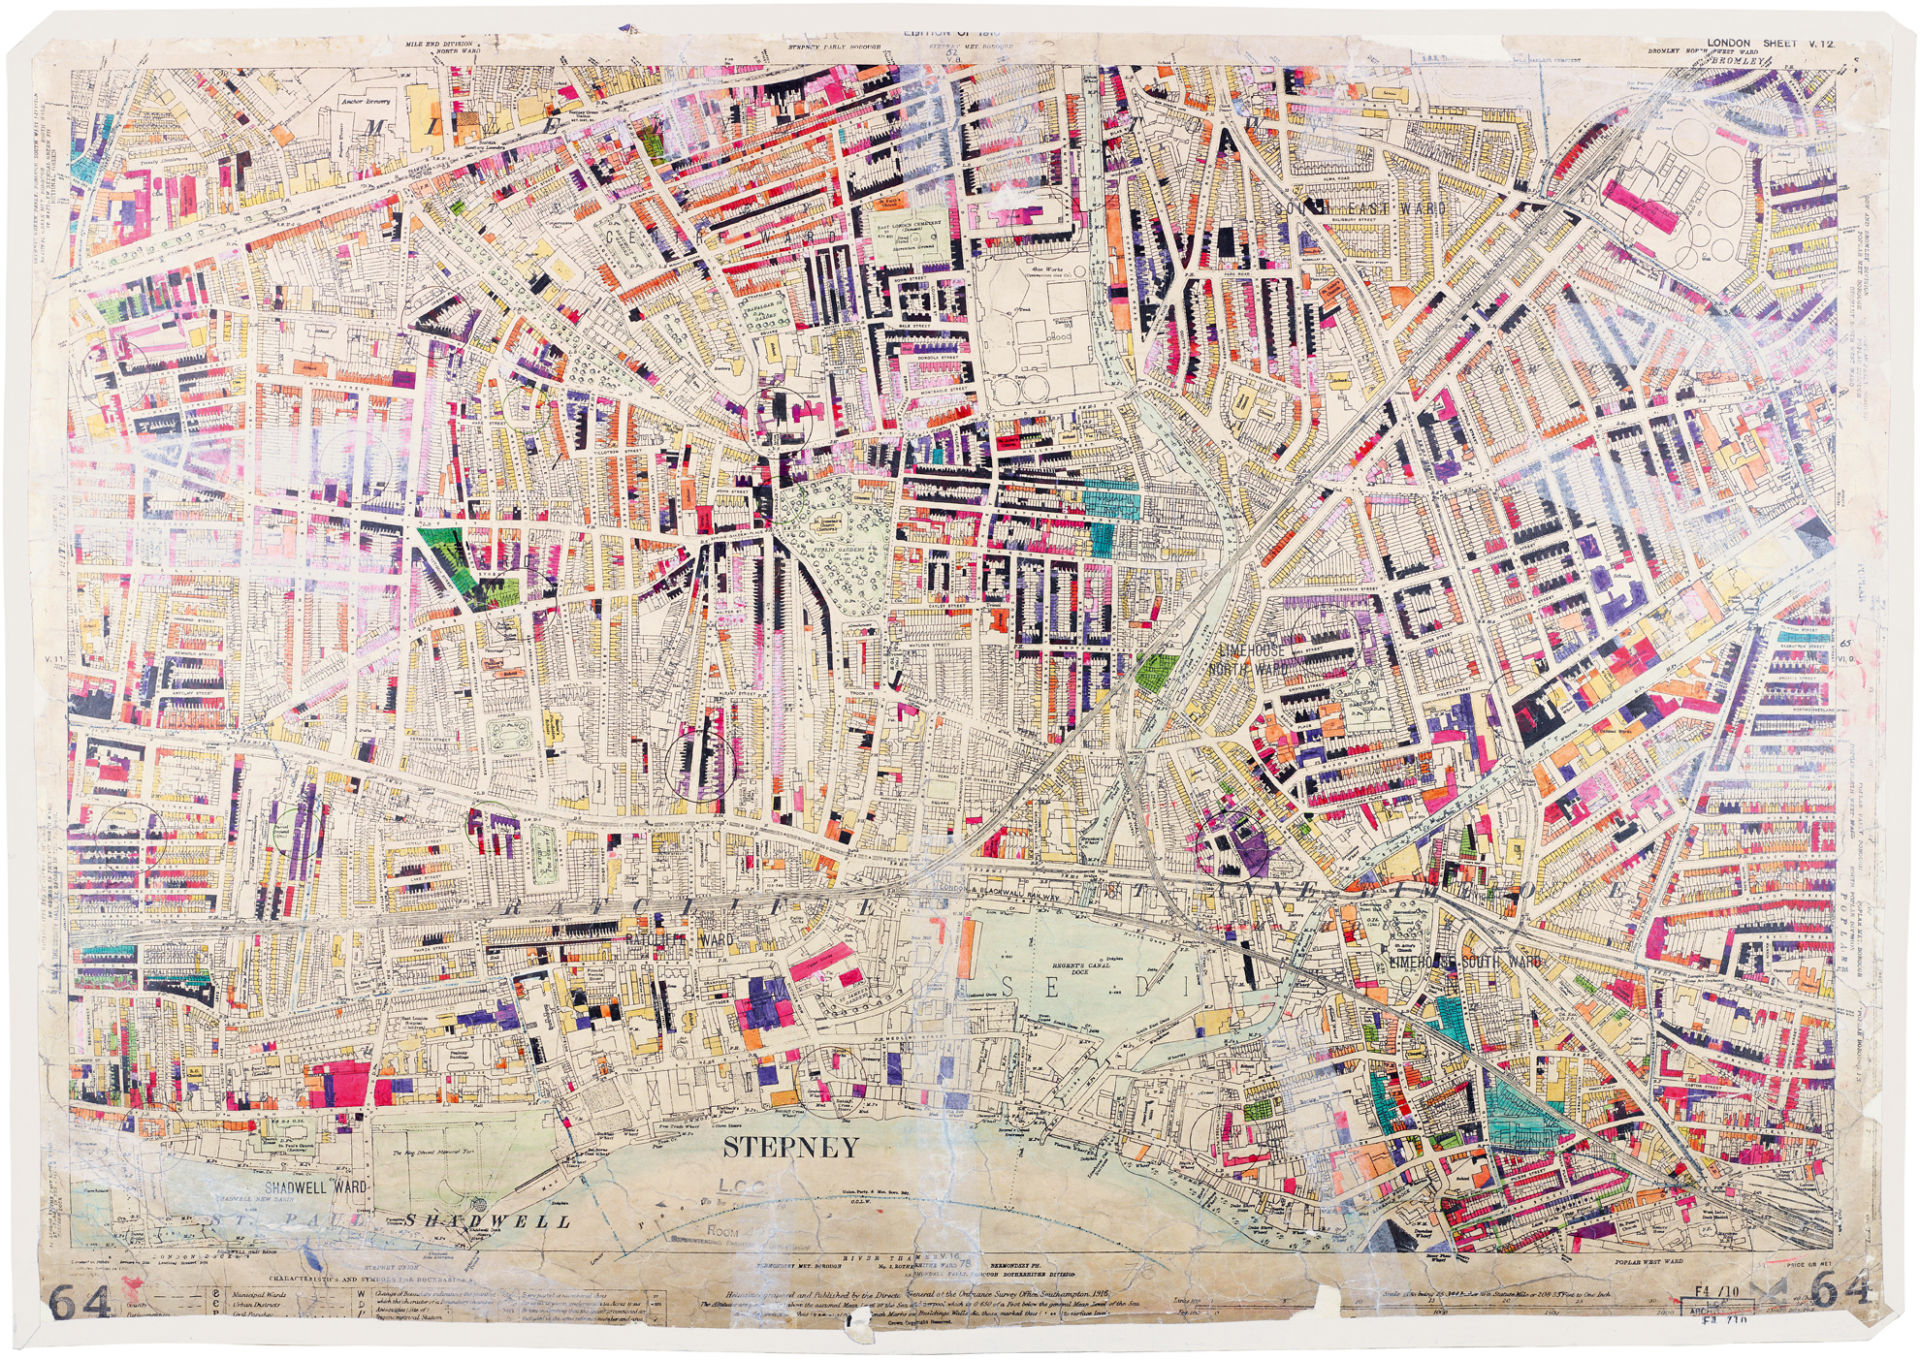
Stepney/Limehouse; London County Council Bomb Damage Maps, 1939-1945 London Metropolitan Archives
The maps reveal what seem distinct chapters in the evolution of data visualizations. But as well as reflecting changes in attempts to chart or measure the scale of blanketing land by aerial bombings, the bomb damage maps reflect a resilient calibration of the levels of destruction as they were suffered, perhaps trying to process first-hand observations of the scale of destruction on the Home Front. They provide an early instance of synthesizing first-hand damage assessments that come to terms with the scale of their continued violence on the ground: the Bomb Damage Maps synthesized from cumulative observations according to protocol, offer a painstaking register of an unprecedented scale of destruction of a fundamentally civilian space, if the strikes sought out industrial targets. The methodical color-coding of individual residential neighborhoods found Damaged Beyond Repair (purple), Seriously Damaged–Doubtful if Repairable (crimson or carmine) or, with cautious optimism, “Seriously Damaged–Repairable at Cost” (pink), must mask the scale of destruction in order to come to terms with it. As well as providing comprehensive testimony for future generations of the damage of near continuous air strikes, they offer a strikingly methodical testimonial of living through war, unique as a cumulative survey of bombing damages by those on whom they were inflicted.


The Pynchon connection is so poignant and the maps are overwhelmingly old fashioned because no one seems to care now about the continuing devastation in the age of drones. The description of the blog and the blogger–hats off..
I’m reminded of Hitler’s instructions to Albert Speer–that the buildings be designed and constructed with such aforethought that their remains after the inevitable destruction to come would surpass in beauty even the most exquisite Greek ruins–time out of mind, certainly, the envy of the world.
Pingback: Finding Aleppo | Musings on Maps