
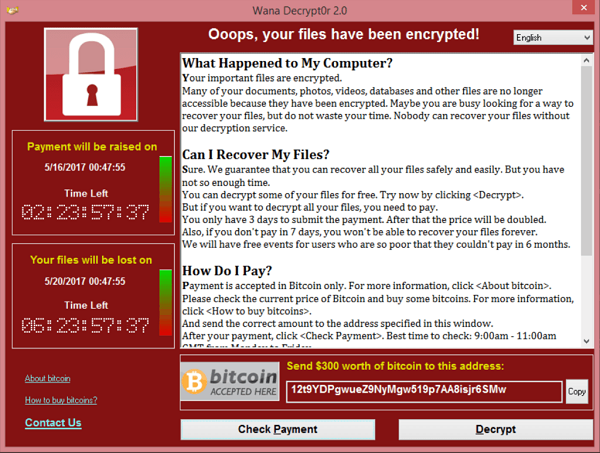
“Nothing in the world could take us back/ to where we used to be,” as Mariah Carey sings in her 1990 hit, I Don’t Wanna Cry–recorded back in the very year Tim Berners-Lee and CERN collaborators unveiled the World Wide Web, using HTML to share documents across huge networks and URL’s to specify computer targeted and information requested. The coincidence of the design of such a document system that led TBL to build and design the world’s first web browser on an NeXT computer and Mariah Carey’s cooing soft-pop hit on only emptiness inside came together again in the release the WannaCry malware–malicious self-propagating code, able to exploit back-door vulnerabilities of Windows 7–which revealed a landscape from which nothing in the world can take us back to where reused to be.
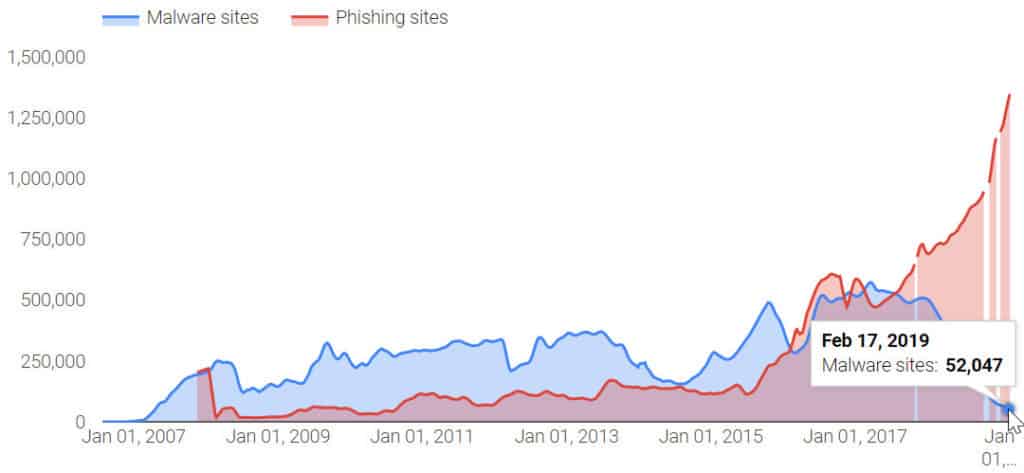
Indeed, the boom of Malware by which the world’s information highways have been afflicted may have in general declined since 2017, from when the number of malware variants has dropped considerably, malware attacks, from ransomware to cryptojacking attacks, have risen, and the number of malicious email attachments has ballooned, often by inserting malicious code into a website to allow hackers to view financial information and histories of corporate entities and other institutions. The absence of any guides to ransomware of different varieties have left many increasingly vulnerable, as networks gain the vulnerability akin to “skimmer” able to glean financial histories off of the magnetic strips of credit cards at ATM’s across the world, exposing the global vulnerabilities into an infrastructure allowing global financial transactions. And despite relatively wide consensus that one should not pay ransoms from WannaCry as doing so would neither ensure access to the compromised files and possibly only expose one to further vulnerabilities to future attacks, the current wisdom of disconnecting all devises from Ethernet cables and wireless dongles suggest that disconnection without rebooting the system is in fact the best option for compromised systems, with an installation of Microsoft’s security patch–in addition to windows security updates and a reputable antivirus blocker. But the fear of vulnerability in a world where WannaCry remains a threat that has continued to hit 13,000 plus organizations since 2020 has led to increased concern how to prevent WannaCry attacks.
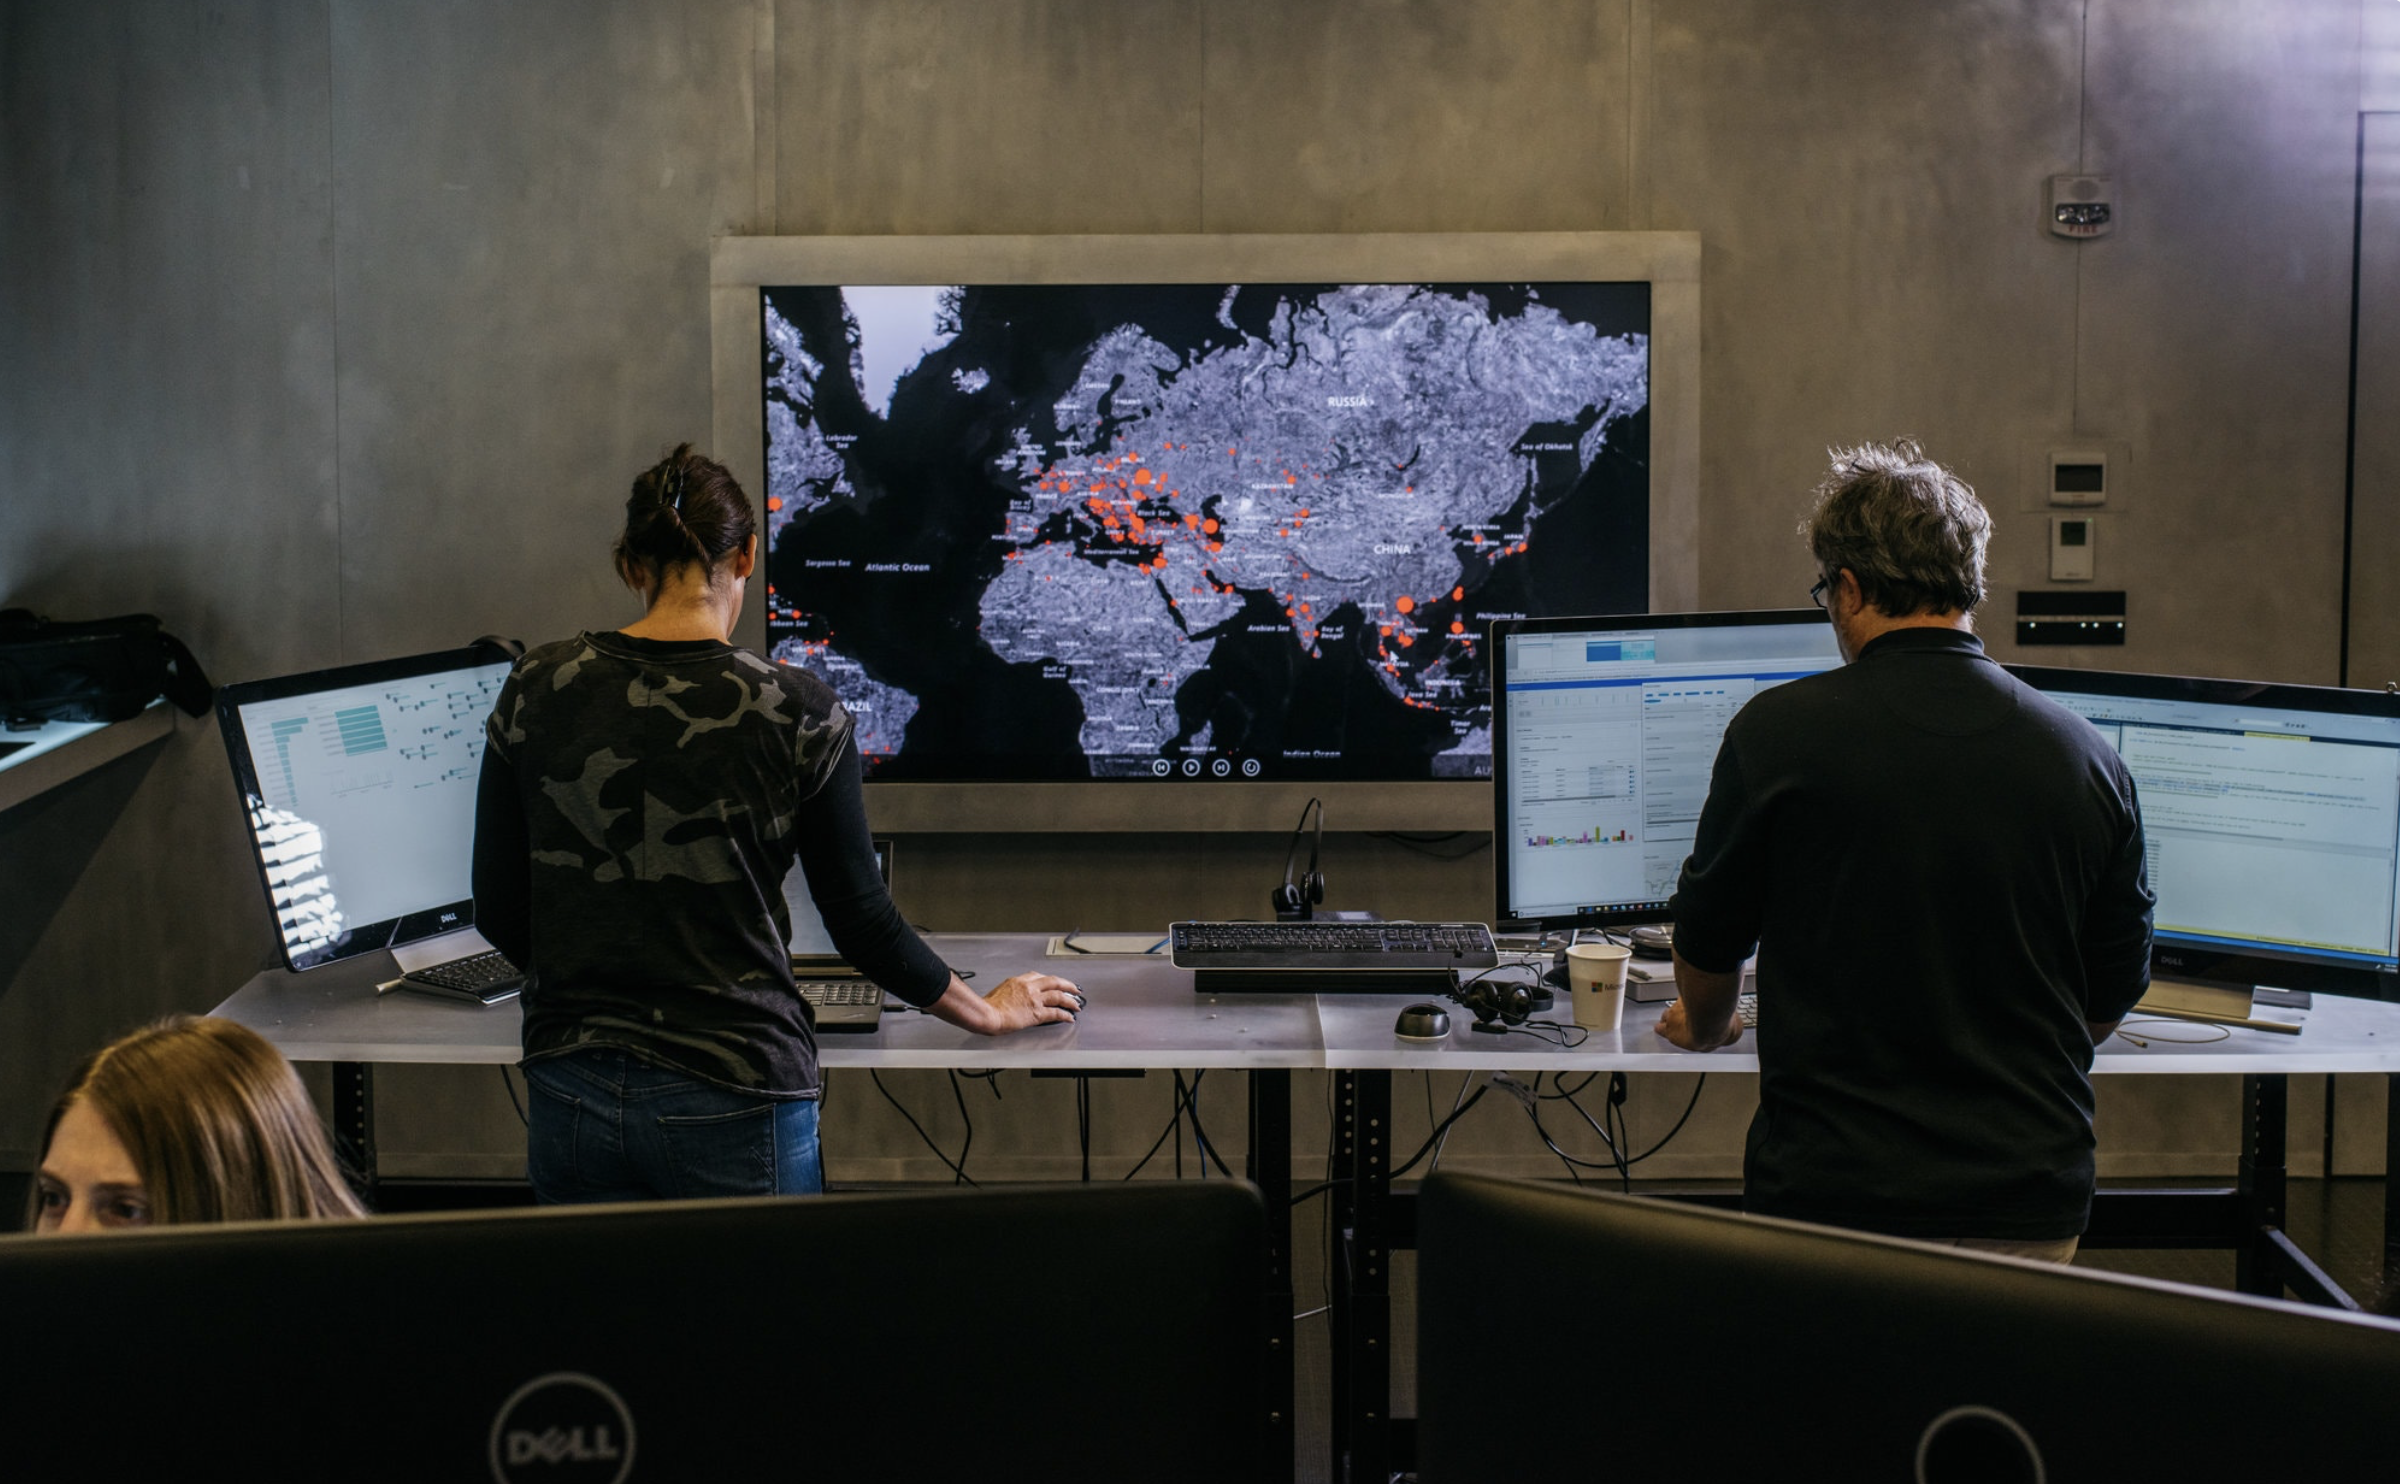
But the data visualizations we’ve used to describe the lateral progression of the encryption of data files from hard drives around the interlinked world lent a new prominence to the World Wide Web as a conduit for targeting destabilization. It not only revealed how the world wide web has reshaped what we still call the world, but posed questions of how to map such a change, as even Microsoft employees in Redmond, Washington scrambled to chart the outbreak of malware after hackers exploited vulnerabilities in the unpatched Eternal Blue, in cyber attacks alternately known as WannaCry in 2017, and Non Petya when it later hit Ukraine, together with all companies, including large American ones, who did business with that nation, in an attempt to undermine its economic viability. From command central in what seems a concrete bunker of the future, before large screens, non-state Microsoft workers in Redmond, Washington tried to maintain a sense of security in their systems around the clock, and conduct repairs, in the weeks after the United States Department of Homeland Security urgently warned that out-of-date software was a global crisis and a national vulnerability. The malware just posed problems that local governments, municipalities, and law enforcement institutions could not bear, and which it seemed only Microsoft could be able to have manpower, incentives, and infrastructure to complete.
Wanna Cry left many literally crying for the sudden encryption of data, and many without services–and was intended to leave an unimaginable number of people desolate, if not quite with the absence of love that Mariah Carey wistfully evoked. But the virulence of its spread should offer a wake-up call to possibilities of global disruption we are still working to be able to track, map or fully comprehend in adequate fashion–but record as a virulent virus blocking systems most densely in nodes of a web-linked world.
New York Times
The very same visualizations indeed obscure, by oddly rendering it as distributed, the agency that underpins such carefully orchestrated cyber attacks of global consequence, by almost naturalizing its spread. For by moving the sites where data was most encrypted into a geographical frame of reference, the graphic doesn’t help orient us to its spread, so much as overwhelm us with the data-laden content to visualize a paralysis of global systems; it removes it from context or human agency, in order to capture the omnipresence of the self-propagating cyrptoworm as much as tell a story that helps to orient us to its spread. Perhaps that is what was intended.
The mapping of global disruption is perhaps a nightmarish puzzle for members of the interlinked world, and demands a place on the front burners of data visualization: the inadequate nature of considering the spread of systems-wide corruptions can be visualized by cases of the compromising of data, we lack the symbolic tools to grasp the rise of a new map of global dangers. While such data visualizations provide a terrifying premonition of the destabilization that might result from the encryption of data on a broad scale, they obscure the possibilities of specifically targeted attacks on data and visible infrastructure that are now able to be developed, and the nature of targeted threats that we have only begun to imagine. The redefinition in this new geography of document-sharing Tim Berners-Lee and friends developed has prepared the way for a landscape of interaction between removed places broadly adopted as a protocol for information-sharing– but one that, as Mariah Carey sung, and instigators of the malware hoped, left one only wanting to cry from behind one’s screen, devastated at the scope of the unforeseen swift data loss.
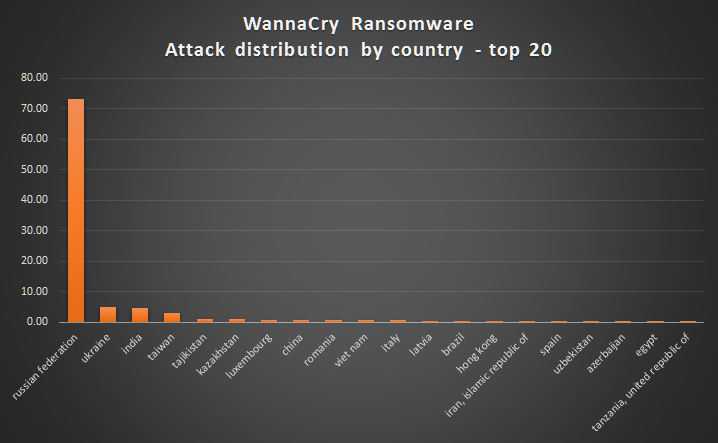
The data visualizations adopted to depict the flare-ups in compromised hard drives that the cryptoworm created in a manner of hours show the particular virulence with which malware crossed national divides in unprecedented ways, displacing relations of spatial proximity, geographical distance, and regional divides. In crippling databases including Russian and Chinese private and public institutions in but a day, demanding immediate payment for data to be restored, the ransomware raised the curtain on a new age of uncertainty. But was the threat eclipsed by the scale of the attack by which information was encrypted? If the spread of malware seemed to grow across computer systems without apparent relations, the distributed agency that was invested in how the malware spread worldwide seemed to obscure the possibility of agency of the attacks, concealing the tracks of any perpetrator by placing a problem of urgency on screens worldwide.

Websites of news media of record widely adopted animated data visualizations to orient their readers to the proliferating corruption of data on tens of thousands of computers and computer systems on account of the malware caused. Such elegantly animated maps don’t claim to be comprehensive, and are information-laden to the extent that seek to capture the unprecedented speed and range of the spread of the cyberworm launched Friday, May 12, 2017. We have trouble even comprehending or grasping the scale or speed with which the virus spread on systems, of course, and speed at which malware was propagated itself across networks and spread laterally across systems, rather than by geographic relations, working without a phishing hook of any sort but exploiting an NSA-developed backdoor vulnerability in the Windows 7 operating system to infect networks across national bounds, as it spread laterally across systems worldwide.
The spread of the encryption of hard drives data across space occurred in apparently haphazard ways, spreading globally in the first thirty minutes of across more advanced web-reliant regions of what we still call the globe. While their spread “followed” systems whose operating systems had not been fully updated, it is important to remember that rather than spreading laterally along a system of their own accord, their release was planned and released by agents, rather than being a casualty of the World Wide Web; a map of instances of hard-drive vulnerabilities however can offer few diagnostic signs or clues to interpret their spread, but offer only a catalogue of individual instances difficult to process in their entirety, so overwhelming and geographically dispersed was their occurrence to defy easy interpretation or processing–they provide little that might be suggested as forensic evidence about their spread.
Red Socks Security: Malicious Threat Detection
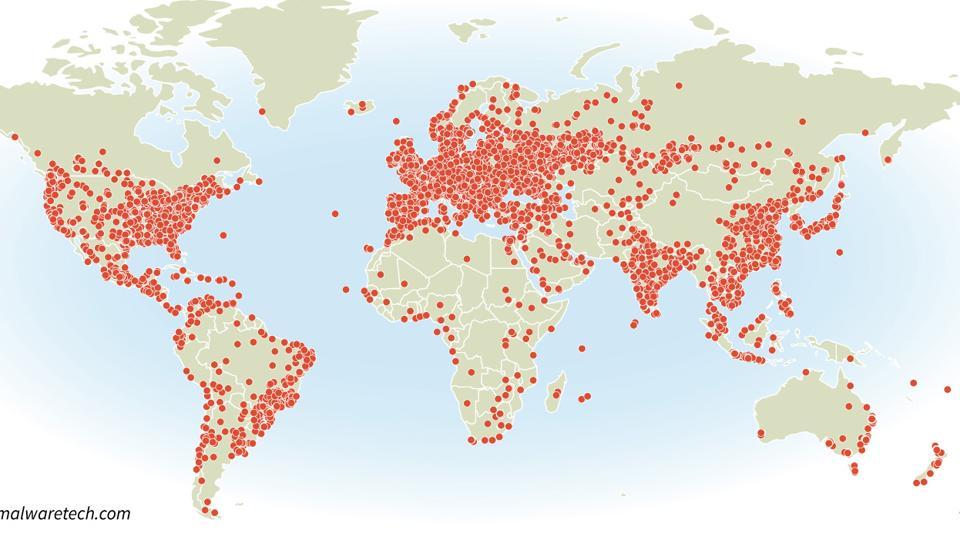
If the growth of the virus’s spread across nations made it seemed to progress in ways that lacked a target, we may lack the tools to visualize the attack. The systems afflicted were not linked on a geographical register, and in some senses didn’t make sense to read in a map–but if they spread on internet traffic, the broad scale of the attack of ransomeware only foregrounded the fears of where it had arrived from or offer any signs to appreciate any agency within its systems-borne spread. But if the map seemed the best way to the speed of its growth, it was a distraction from the potential targeted threats of the malicious worm–until a lone British researcher, known as “MalwareTech,” saved the compromising of global systems as he serendipitously identified its kill switch to stop its spread: what dominated the headlines conceals the dangers of losing sight of the specificity of the wide-ranging attacks, even while registering them in real time.
The rest of the world could only sit in silence, as Mariah Carey once sung, and watch the range of attacks unfold in space in real time: something went wrong in the mode of sharing data across online systems that had to be couldn’t quite be understood. If Maria Carey’s hit single contemplated the definite break in time, “only emptiness inside us,” the shock of the screens informing users across the world that their data had been definitively compromised made then realize that any notion of data security vanished, and any hope for composure in the face of cryptoworms had disappeared, as Mariah Carey’s softly-sung lyrics described, and as far away as a network-free world, or one where inter-connected users didn’t define the primary routes of its transmission, without considering the dangers of the compromised infrastructure–not only in banking, but in traffic system, airport controlling, water quality monitoring, and even traffic flows.
But we continue to rely on geographic registers, as if we can’t let go of them, and it is what we have to explain the global spread of compromised systems and a collapse of data security. The cryptoworm successfully obtained advanced user privileges that allowed it to hijack computer systems that allowed hackers to encrypt documents worldwide in one day, reaching such a broad range of hard drives to make it seem the attack was random or haphazard. The attacks used code to release a self-propagating worm that didn’t really move spatially, but progressed online, using a vulnerability for which Microsoft had released a patch only two months previous, in March, in devices that share files across local networks. After the patch arrived, we were still mapping its spread, and contemplating the prospects of the return of a similar virus, so clearly had it asked us to redefine internet traffic. But was did the broad spread of the worm and broad scope of systems compromises, which was quick to provoke deep fears of the vulnerabilities that exist from ransomware erase the targeted nature of a similar subsequent malware attack? The spread of thousands of infections in over a hundred–and then over a hundred and fifty countries–across hard drives across the world exploited the failure to update software systems so broadly to obscure the origins or coordination of such malware attacks, whose use of normal language to alert users of encryption made them seem as if it were an isolated standard operating failure, able to be resolved by individual payment–
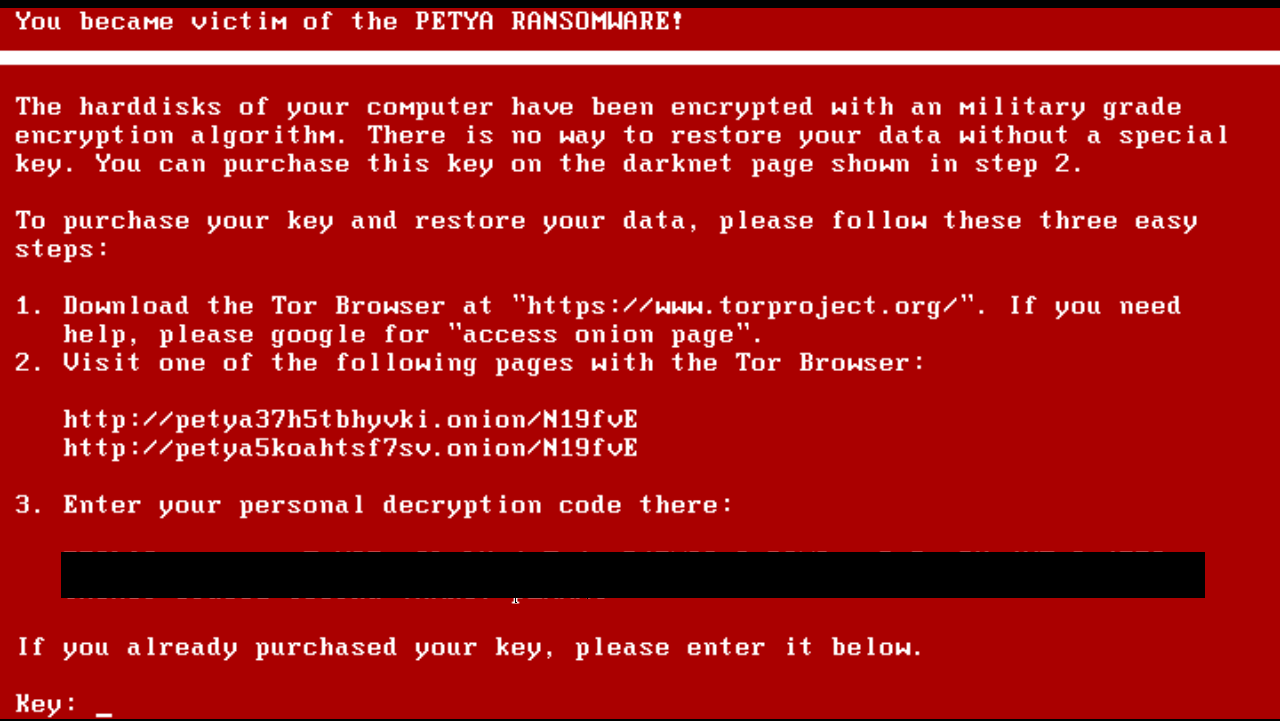
–even as the malware crippled networks in different countries without having the appearance of any fixed target. And if masquerading as a form of ransomware, later variants of the cryptoworm suggested a far, far scarier version of the scope of data corruption.
We were of course struck by the unprecedented speed with which such worms replicated along these dispersive networks–following paths that are not made evident in the map of compromised hard drives provided by data security firms, which show the progression of a disease that, like a cancer, creeps invasively along a hidden network, suggests a nightmare of the distributed agency of the internet, invaded by a particularly vicious parasite that for a considerable amount of time even experts saw no way to resolve.
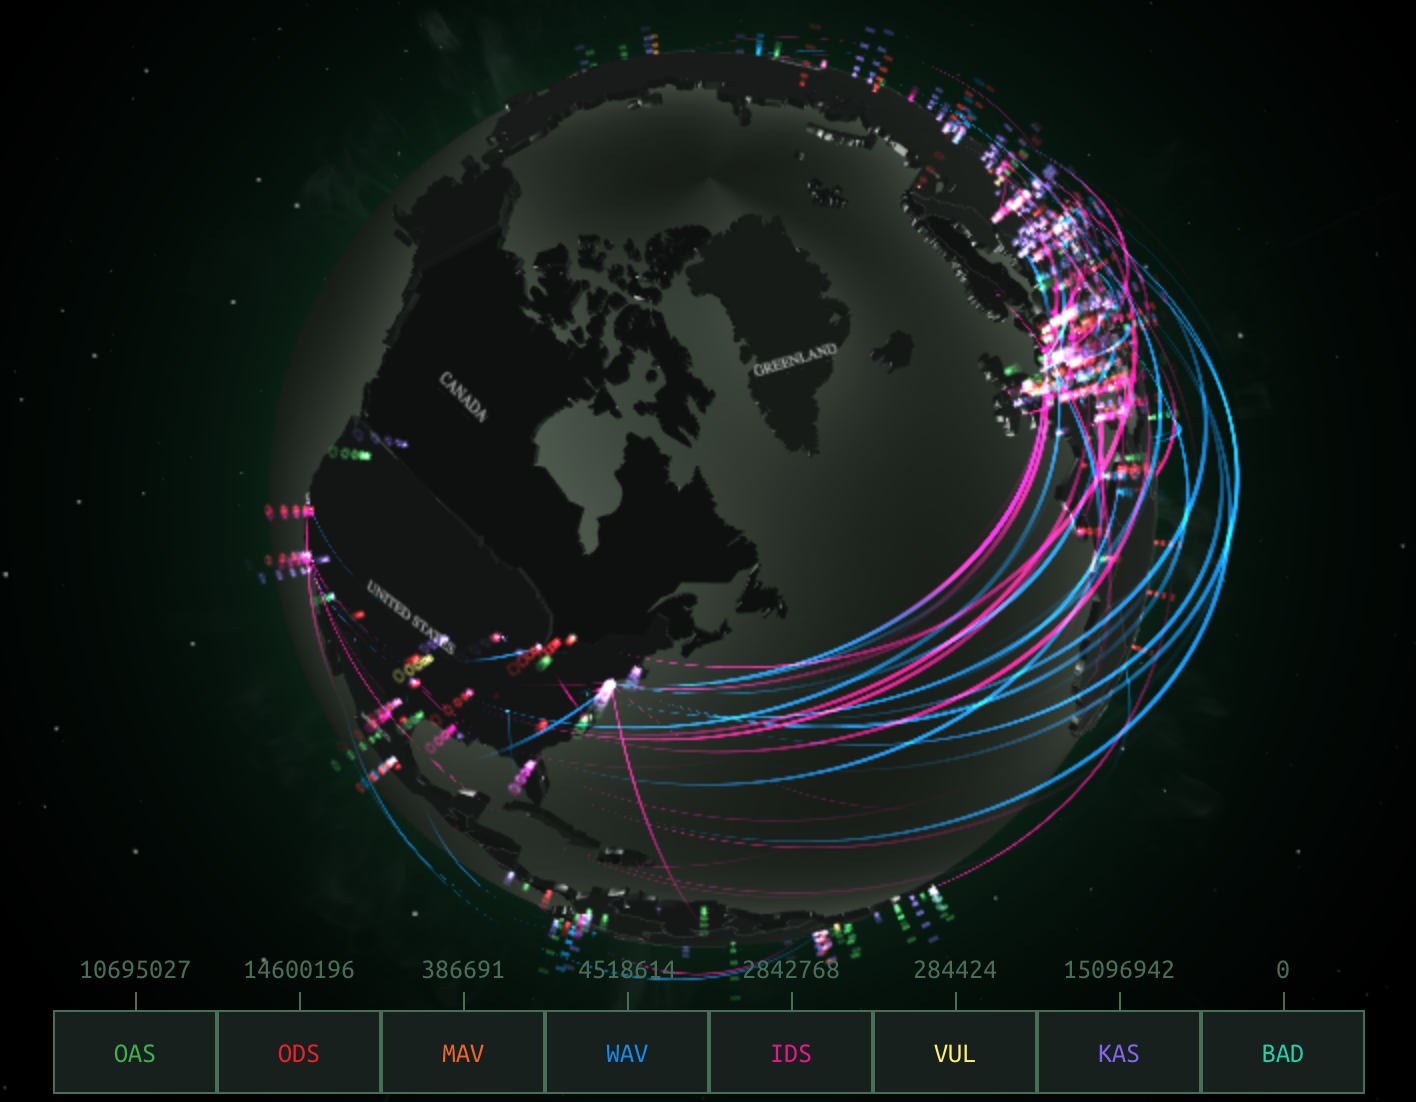
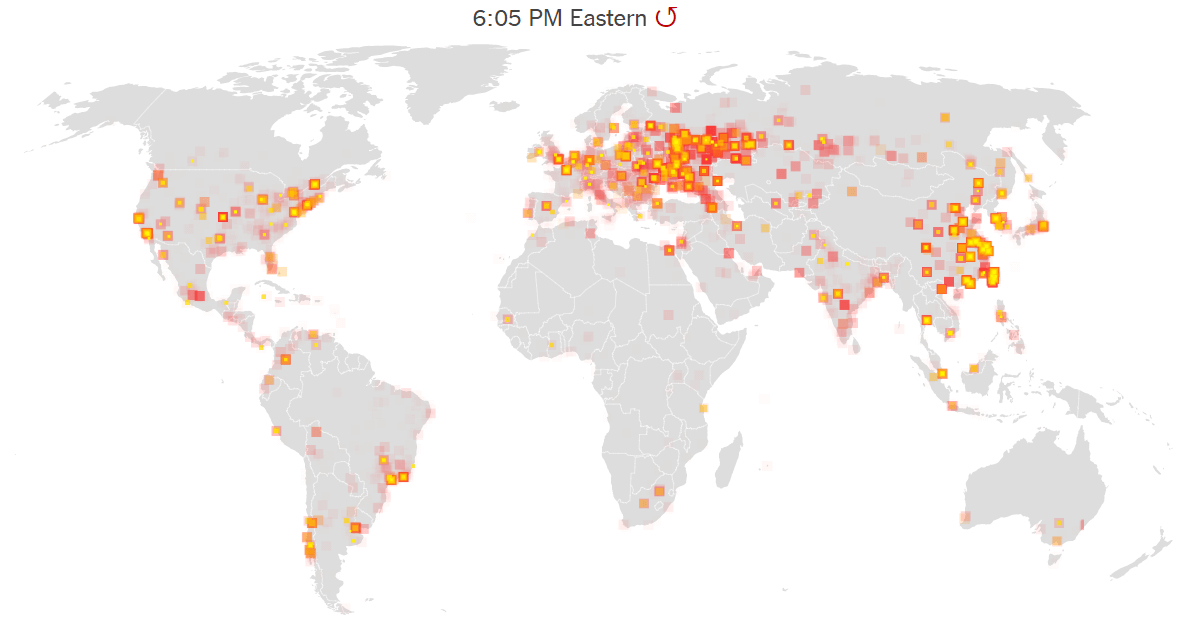
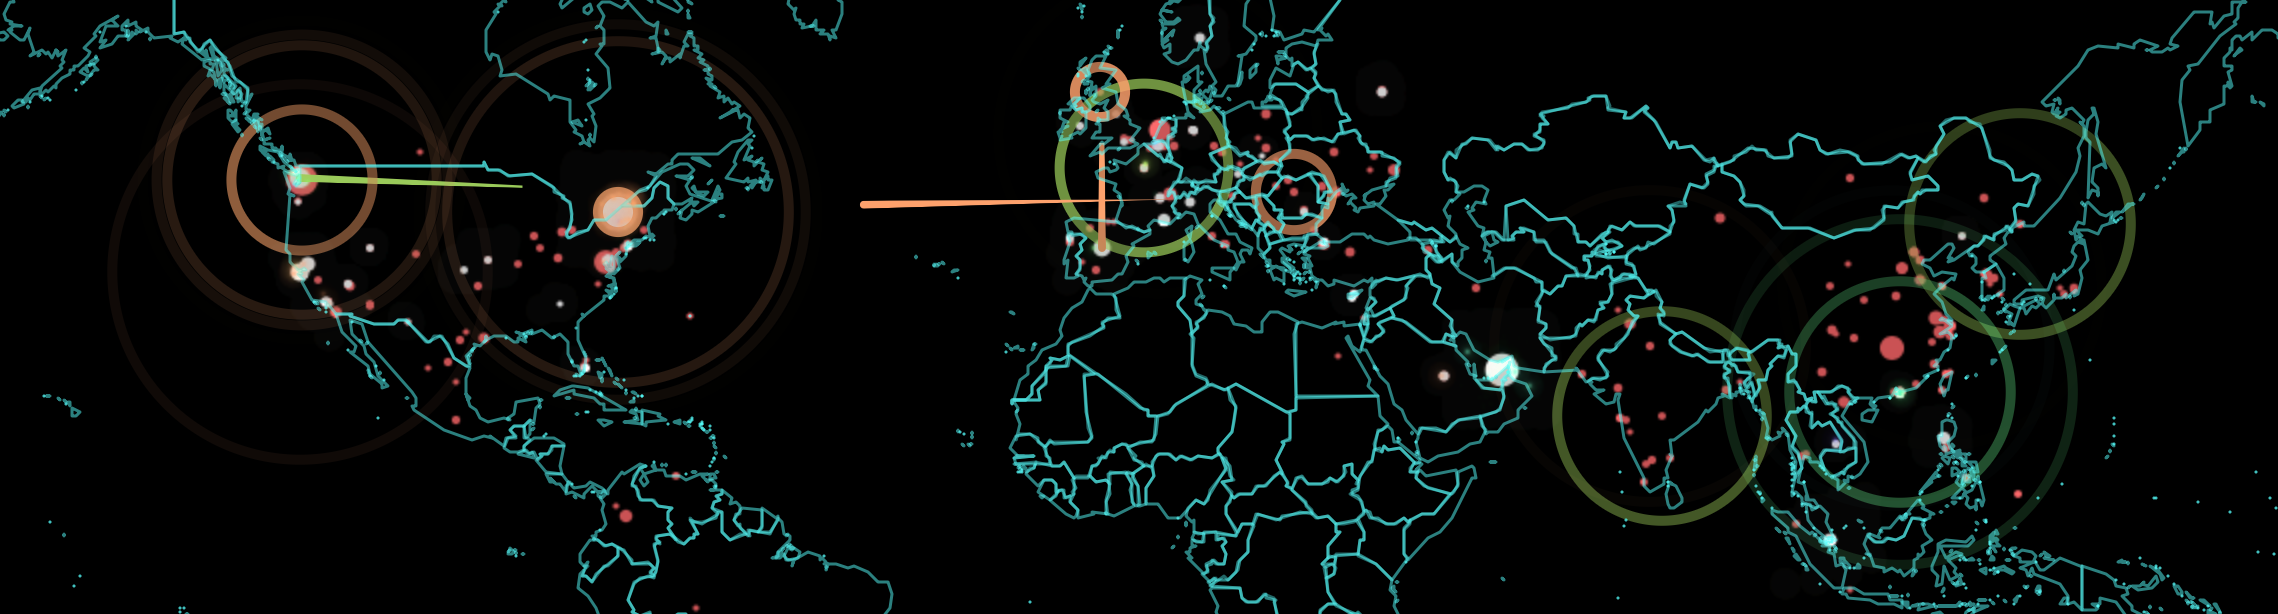
We can now watch the spread of internet attacks in real time, looking at the threats of hacking in real-time, in ways that reflect the emergence of the internet and World Wide Web as a real-time battlefield, even if this is only a representative tracking of hacking attempts tracked by Norse. It doesn’t include the ten millions of daily attempts to hack into the Pentagon, or the similar number of threats that the National Nuclear Security Administration tries to fend off–and the millions of attacks universities daily confront. But if we are apt to be mesmerized by the range of such attacks, impossible to fully comprehend or track, we’re likely to be overwhelmed by the serious fears of the security vulnerabilities of which they cannot but remind us, although the abstracted sense of a constant barrage of online attacks can remove us from all too real dangers of their infrastructural effects–and the dangers of destabilization of specifically targeted strikes.
And if we might do well to take stock of the range of attacks by hackers to which the United States is vulnerable, mostly from China and Chinese sources, privileging our country as the target of future strikes–
–we loose sight of their increasingly global nature, now that much of the software to exploit vulnerabilities is available in the Dark Net. The origins of such attacks aren’t really clearly able to be mapped–hackers are experts at deflecting or rerouting their signals, and bouncing around their traces to make hacks that are located from one site appear to emanate from another from another. And infrastructural vulnerabilities of infrastructure are increasingly on the table for nations other than the United States, often without the means to monitor such cybersecurity issues or strikes.
In an age when the pathways of internet links may have spawned spontaneous revolutions, uprisings, and unexpected results of elections, non-human communication and propagation of such malicious malware viruses seem an apotheosis of the absence of any agency–a worm that is able to replicate itself within hard drives world wide, removed from any intent. To be sure, the range of sped-up animated maps to track the progress of the viruses that compromised data across the world produced a sense of wonder at our vulnerability of a sort that has not been widely mapped since the Cold War: the images generated of internet threats mirrors the map of the danger of missile strikes that emerged in Life magazine back in 1945, at the end of the Second World War–only months after the destruction of Hiroshima and Nagasaki by American atomic bombs, that increasingly stand as a premonition of the new nature of things to come.
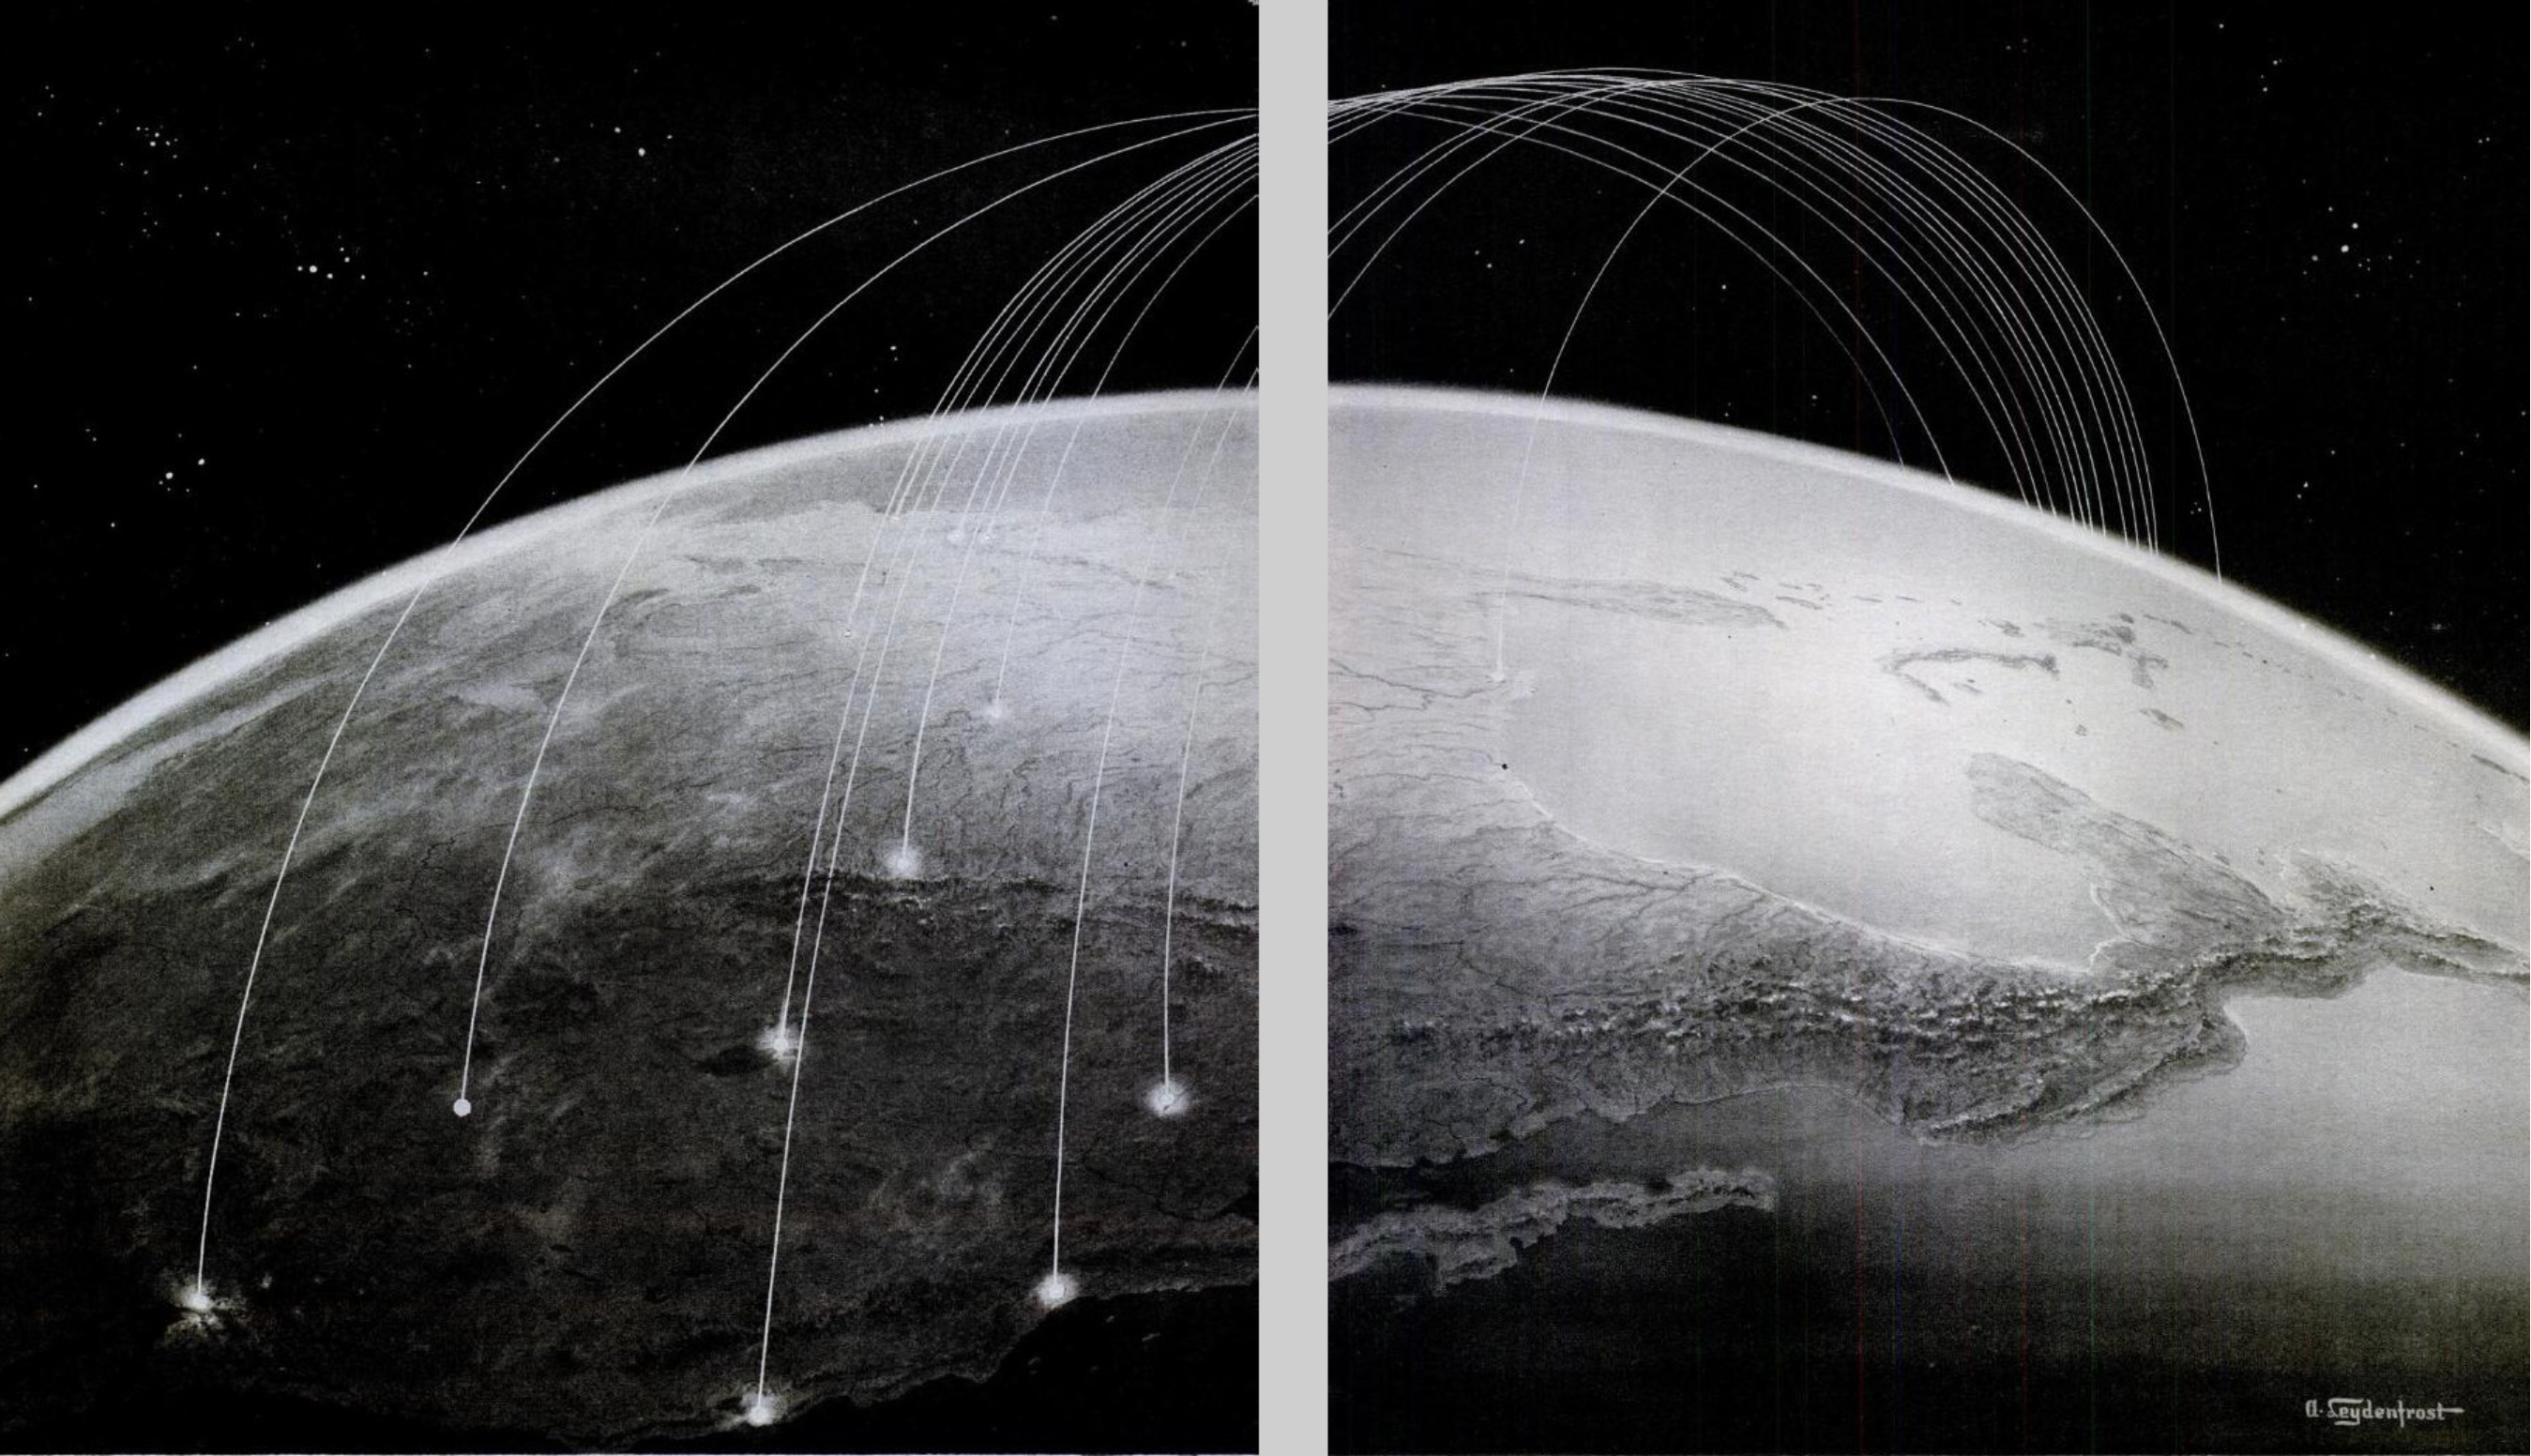
Life Magazine: The Thirty-Six Hour War (November, 1945)
Mutatis mutandi, the image of the visual culture of the early Cold War was adopted by the Russian internet security agency, the Kapersky Labs, as a strategy to image the globally expanding threat of hacking to compromise hard drives and data-based systems.
In an era that was defined as after or following the thaw of the Cold War, the internet emerged in 1990–just a year after the fall of the Berlin Wall heralded its thaw–as a new battleground to wage global conflict. To be sure, the cybermaps of phishing schemes and potential email attacks are traced by the Kapersky labs in real time, to monitor for global security on the interlinked world-wide online systems. But their dynamic images retain the symbolic structure of the arcs of a violation of national airspace to suggest the magnitude of the incursions into cyberspace they monitor and report on round the clock.
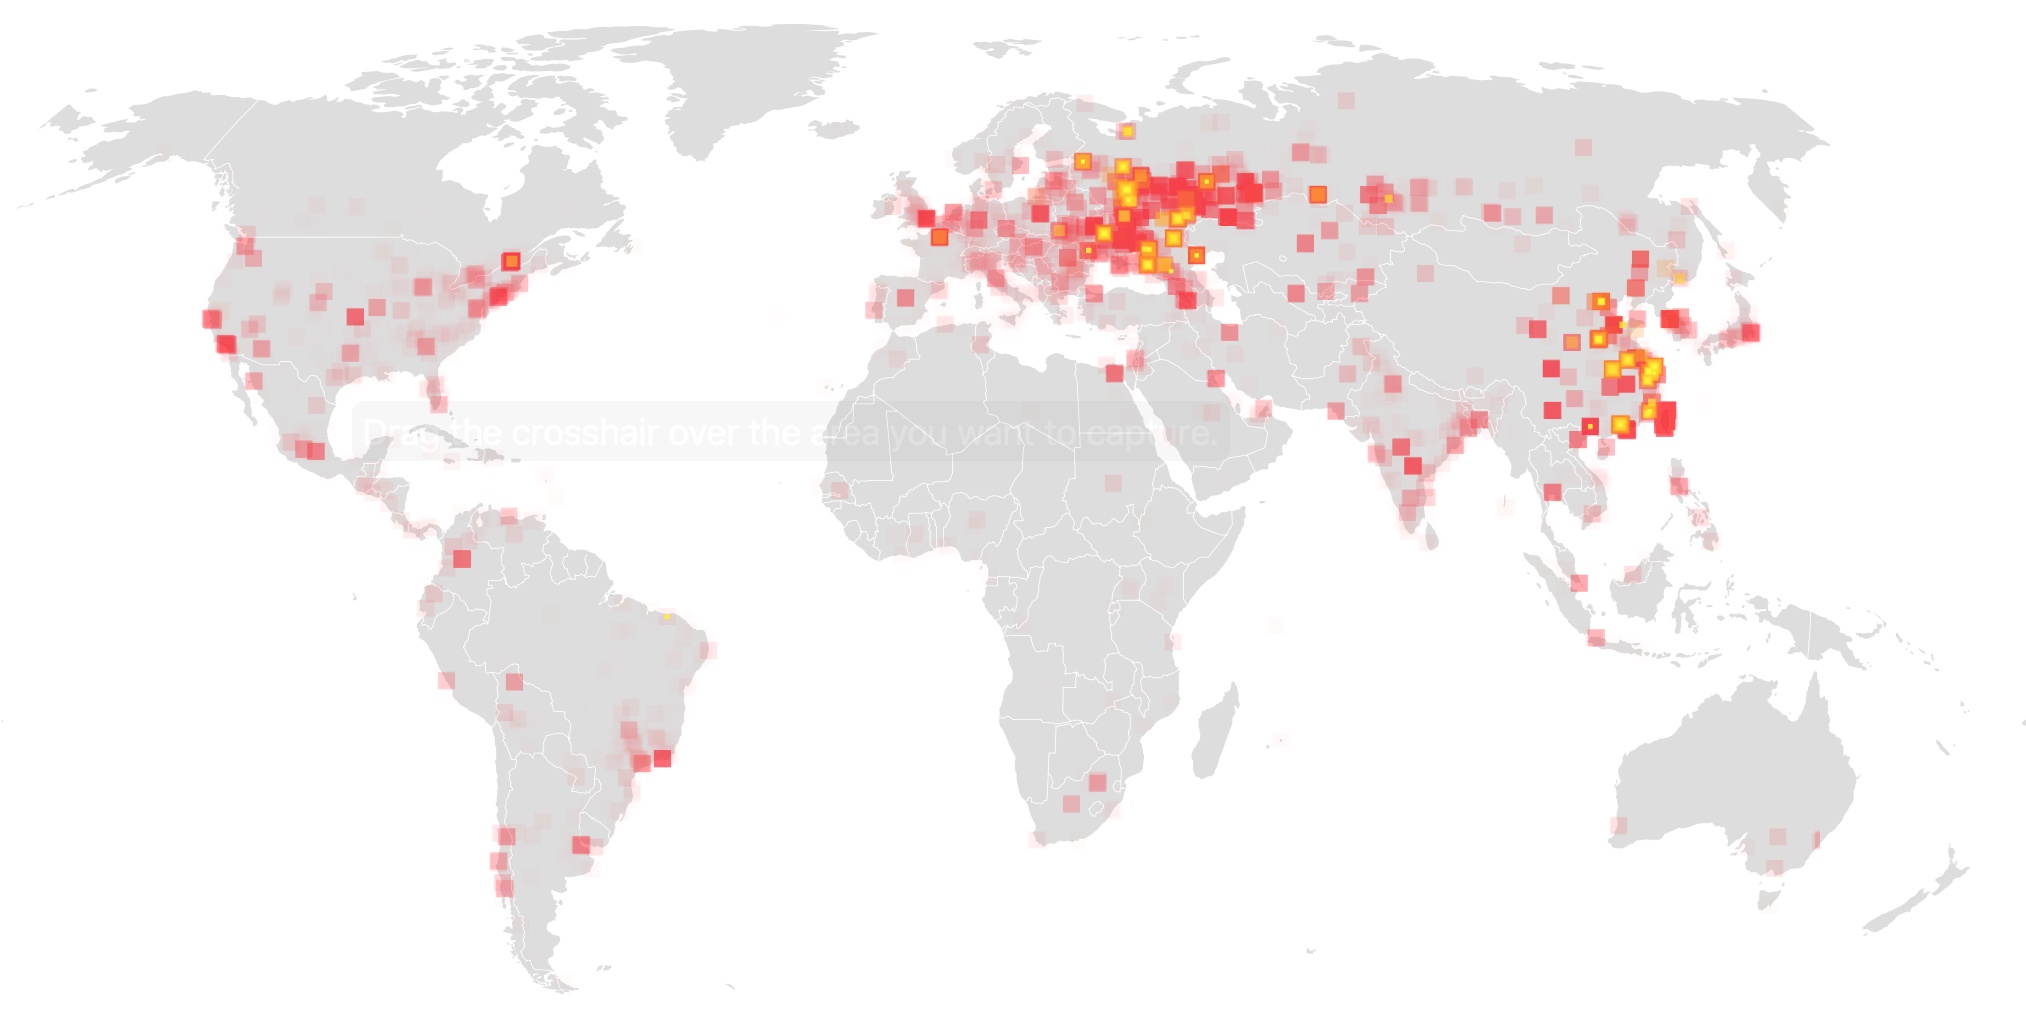
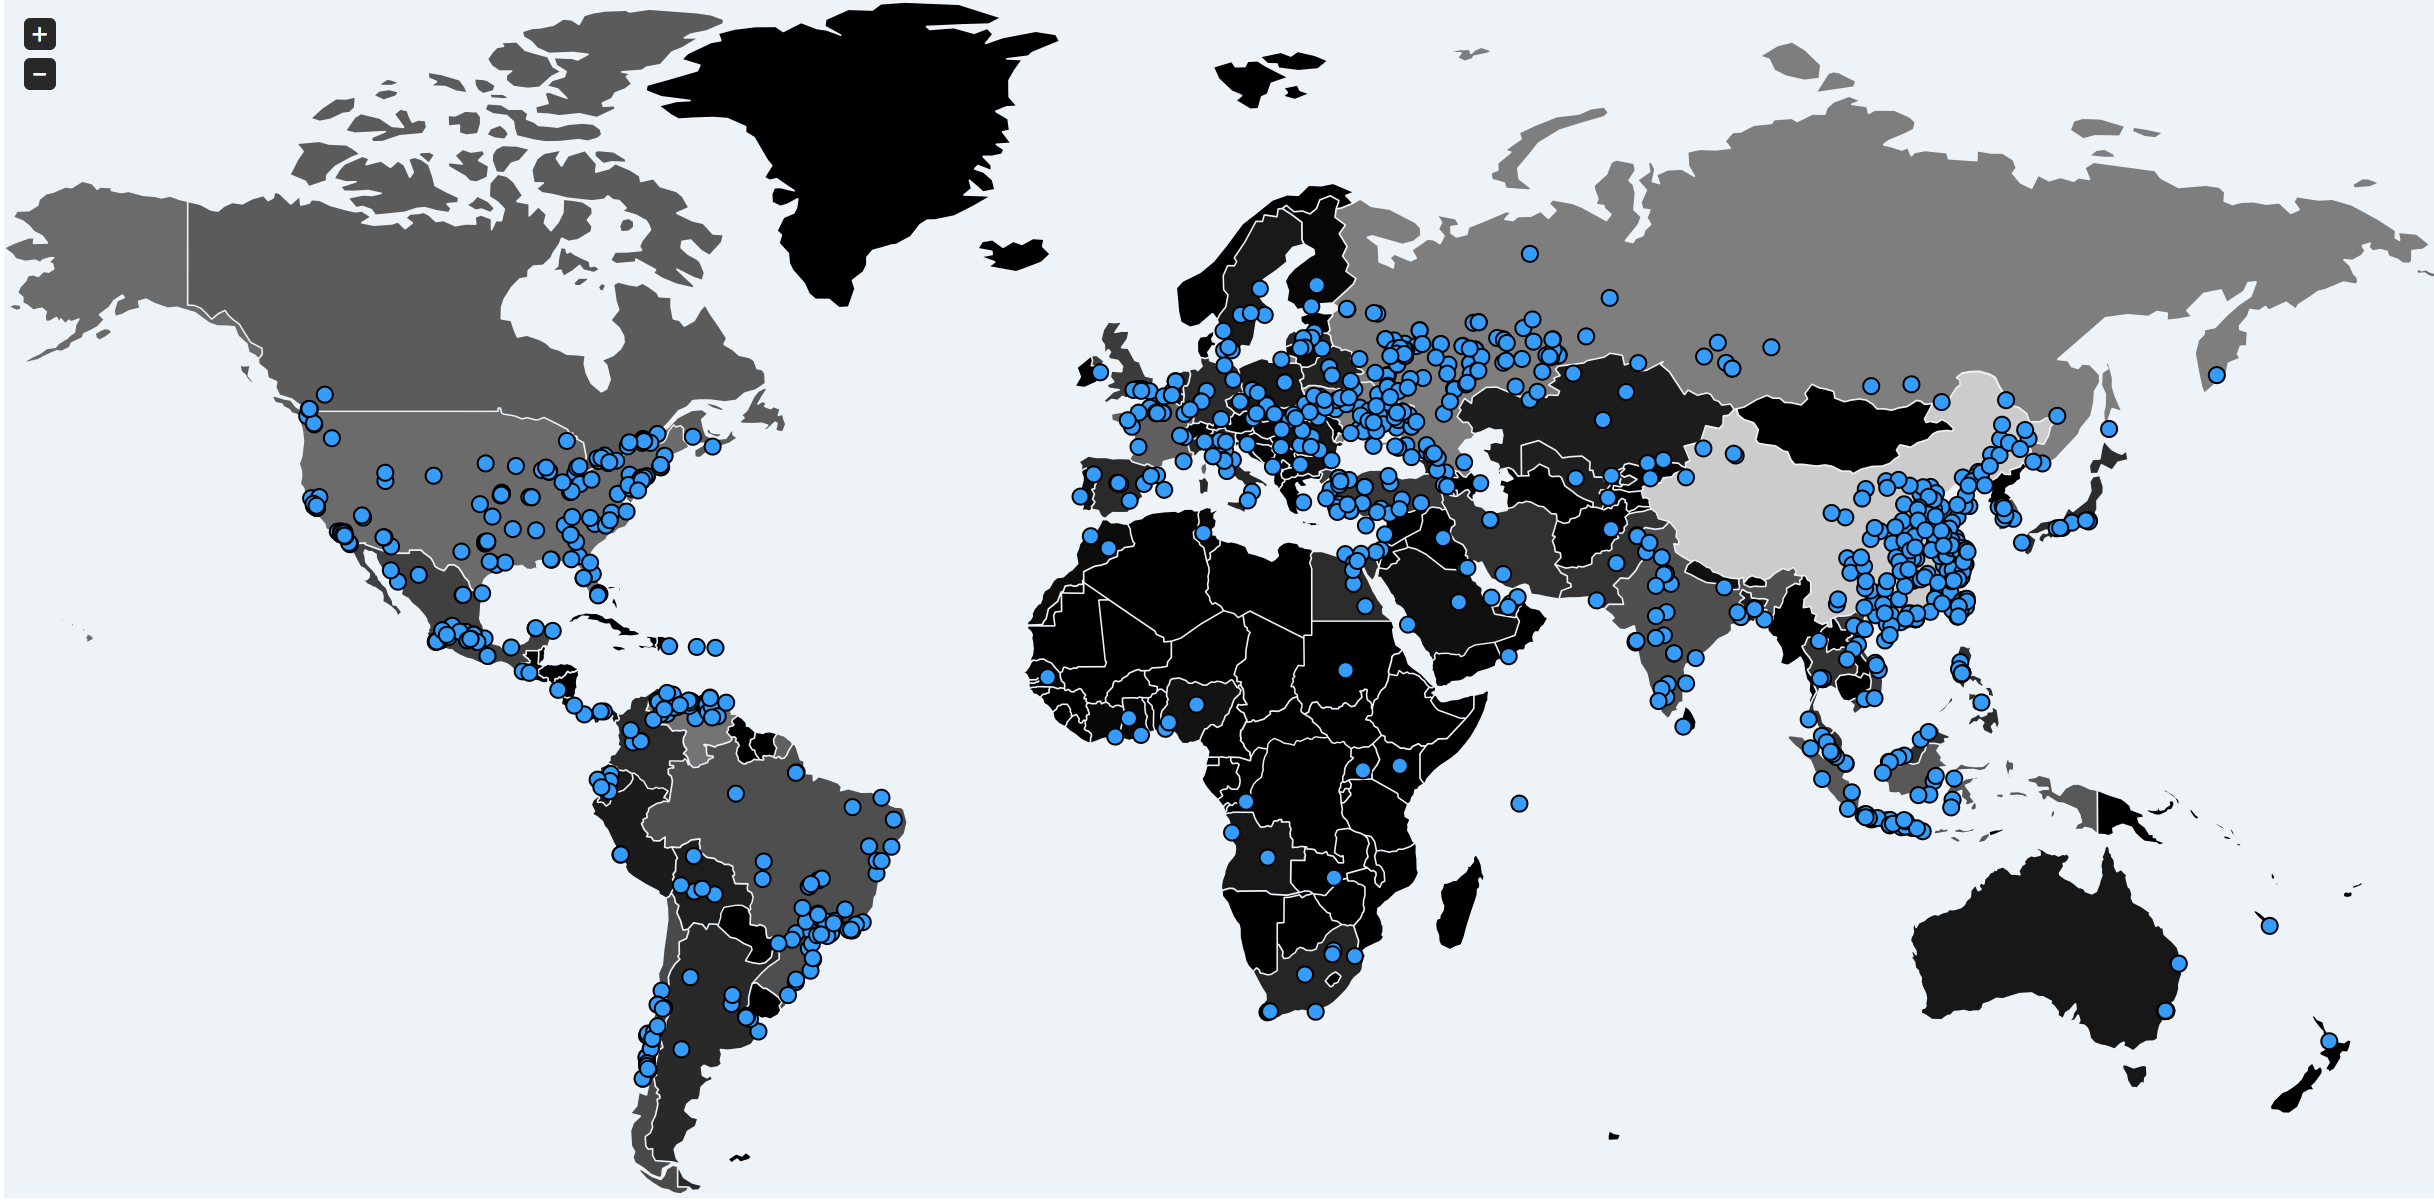
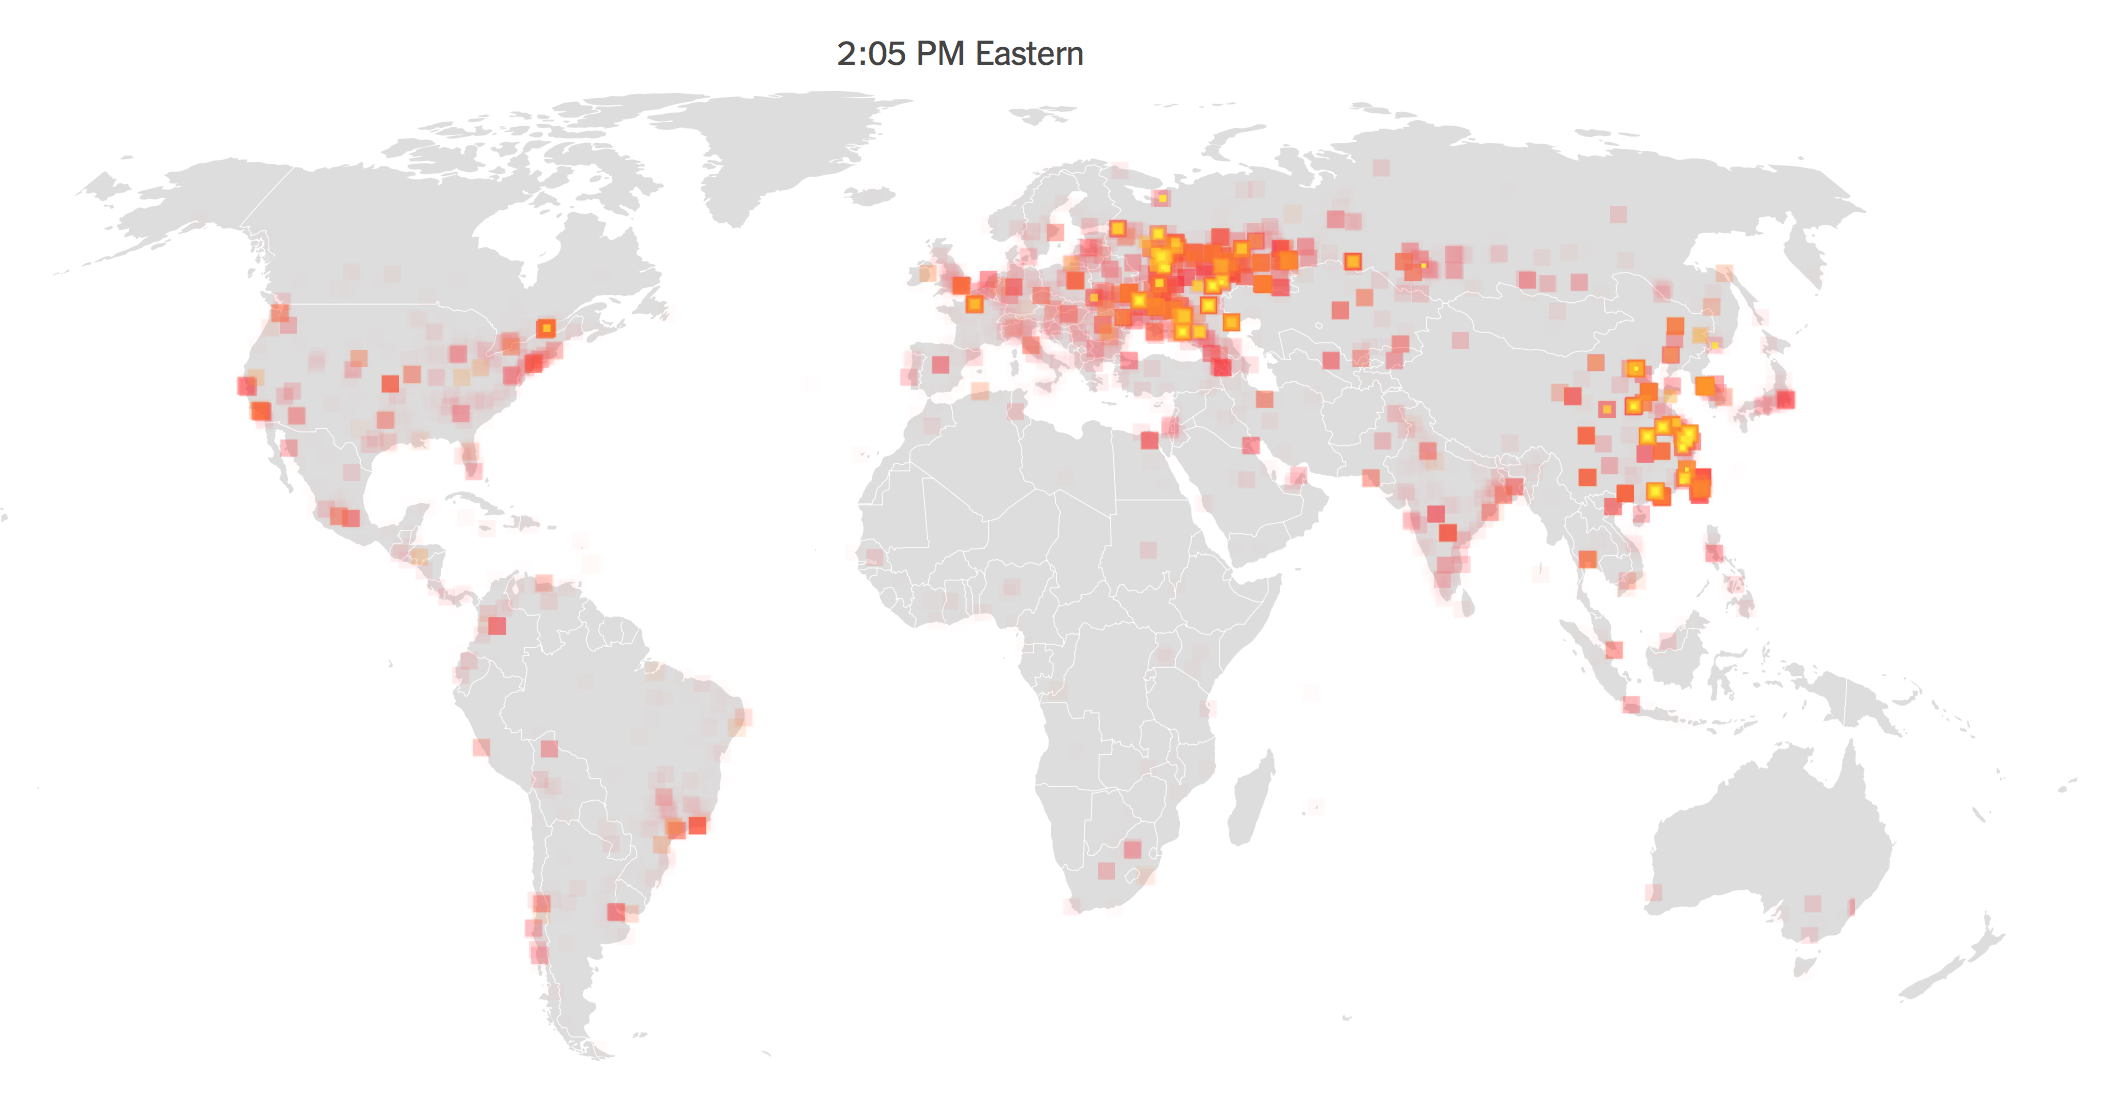
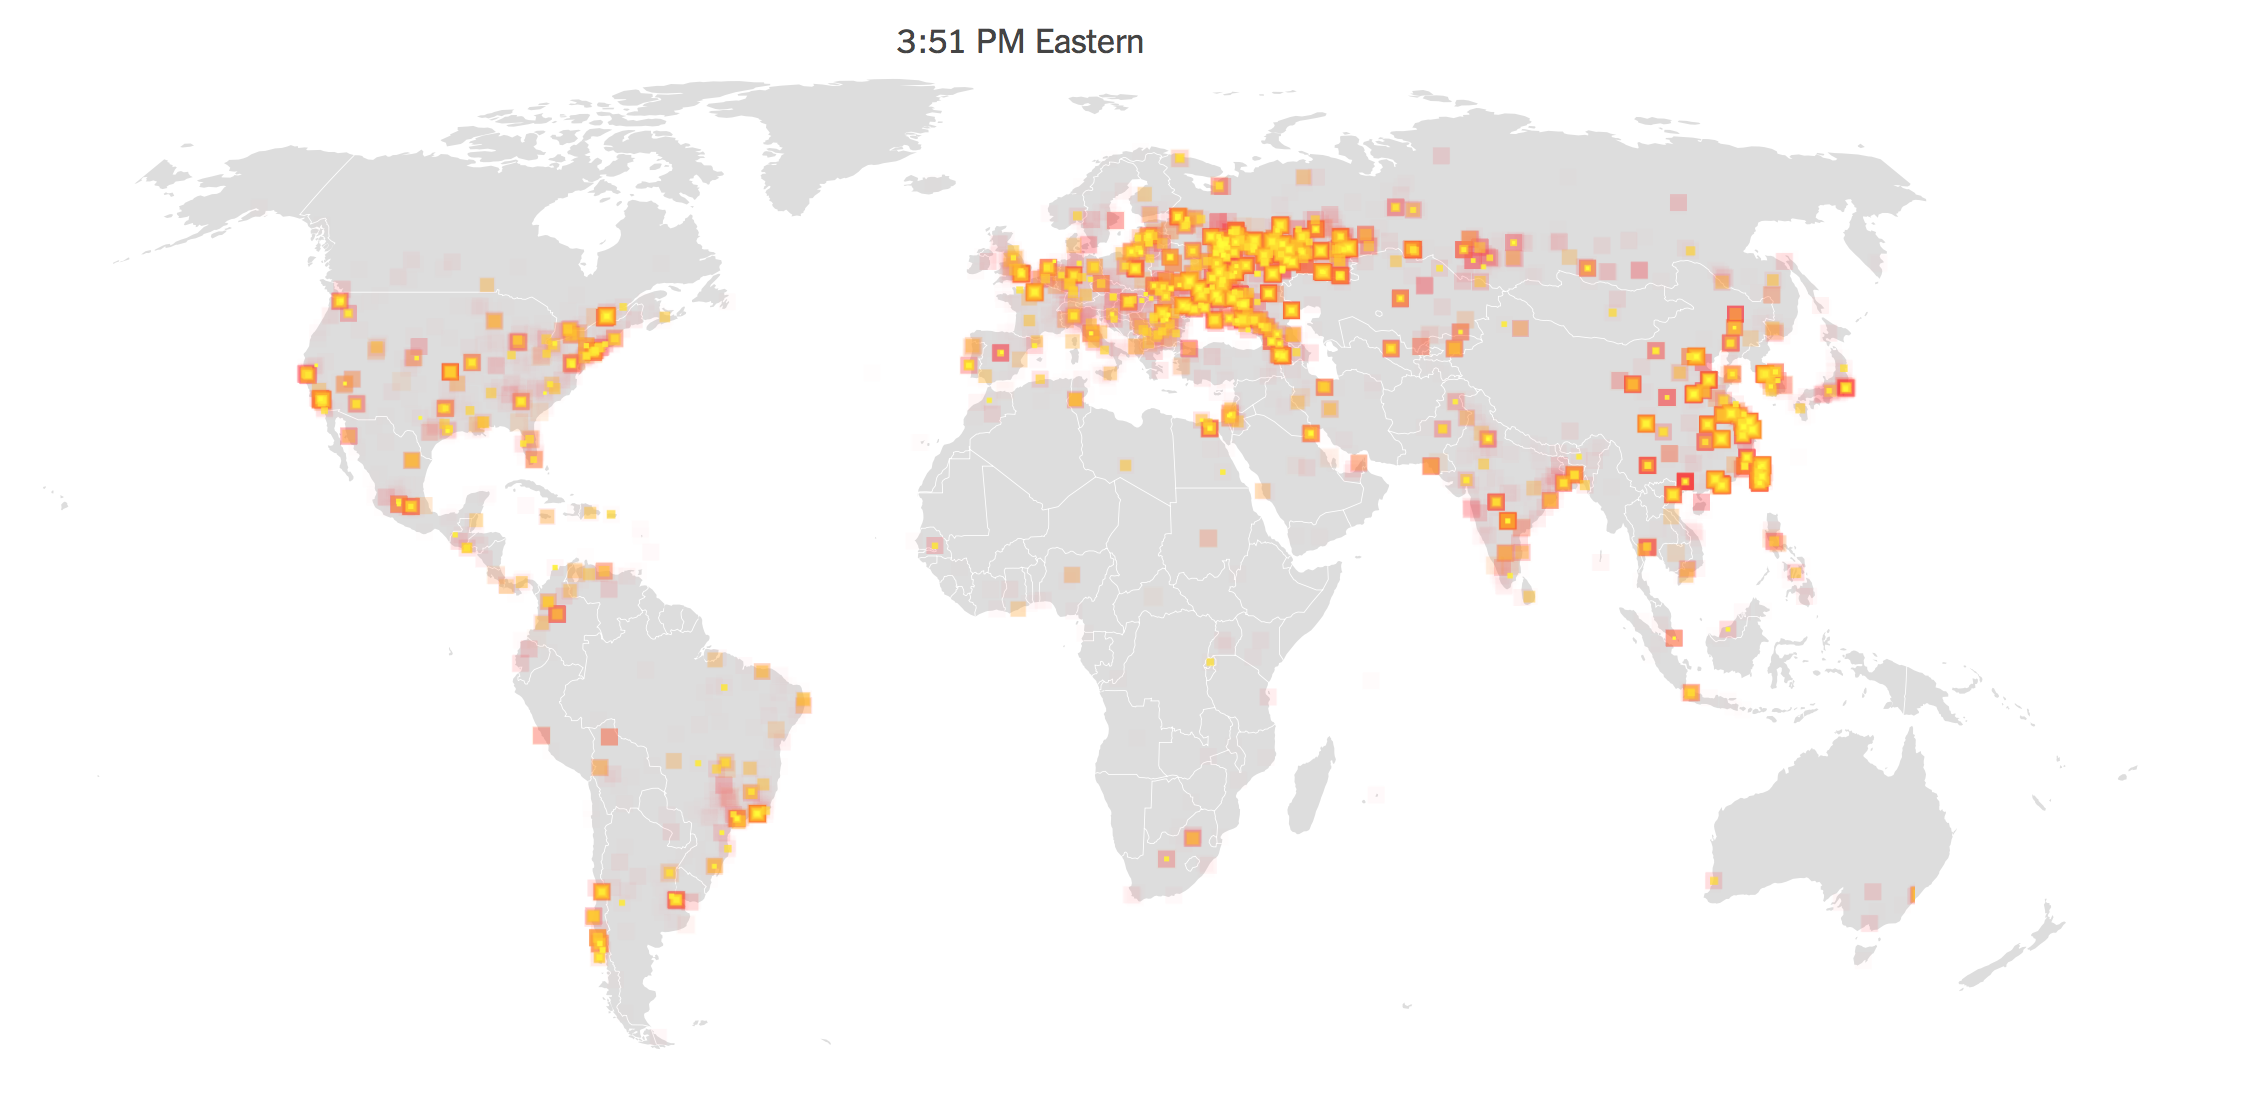
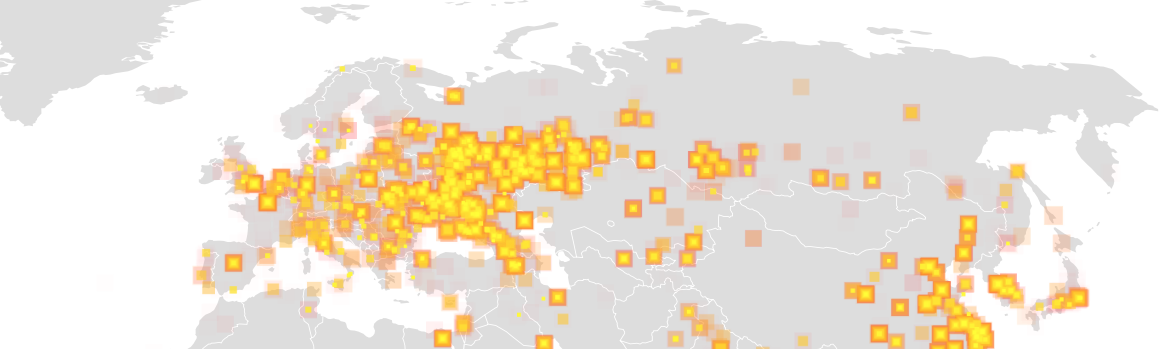
We continue to map the global spread of malware as if to wonder at its scale: the distributed compromising of data as an animated sequence of simultaneous flare-ups of intensity from yellow to burning red across the world, as if to pose the question of its communication in terms of spatial continuity and proximity. In some of the best data visualizations of the scare of WannaCry and Petya viruses, the brightly burning flare-ups signalled a fire that burned so brightly to become impossible to contain as if a metastisizing online cancer spread across the world’s wealthiest regions. Despite the power of the animated visualization, we may map it wrongly, as if to imply it can be diagnosed as a spatially transmitted contagion without a target or destination. In using the data-laden information of cybersecurity firms to map the occurrence of data corruption and systems infection, the political antagonisms and animosities that have fed the growth of malware are cunningly left absent from the map at our own peril.
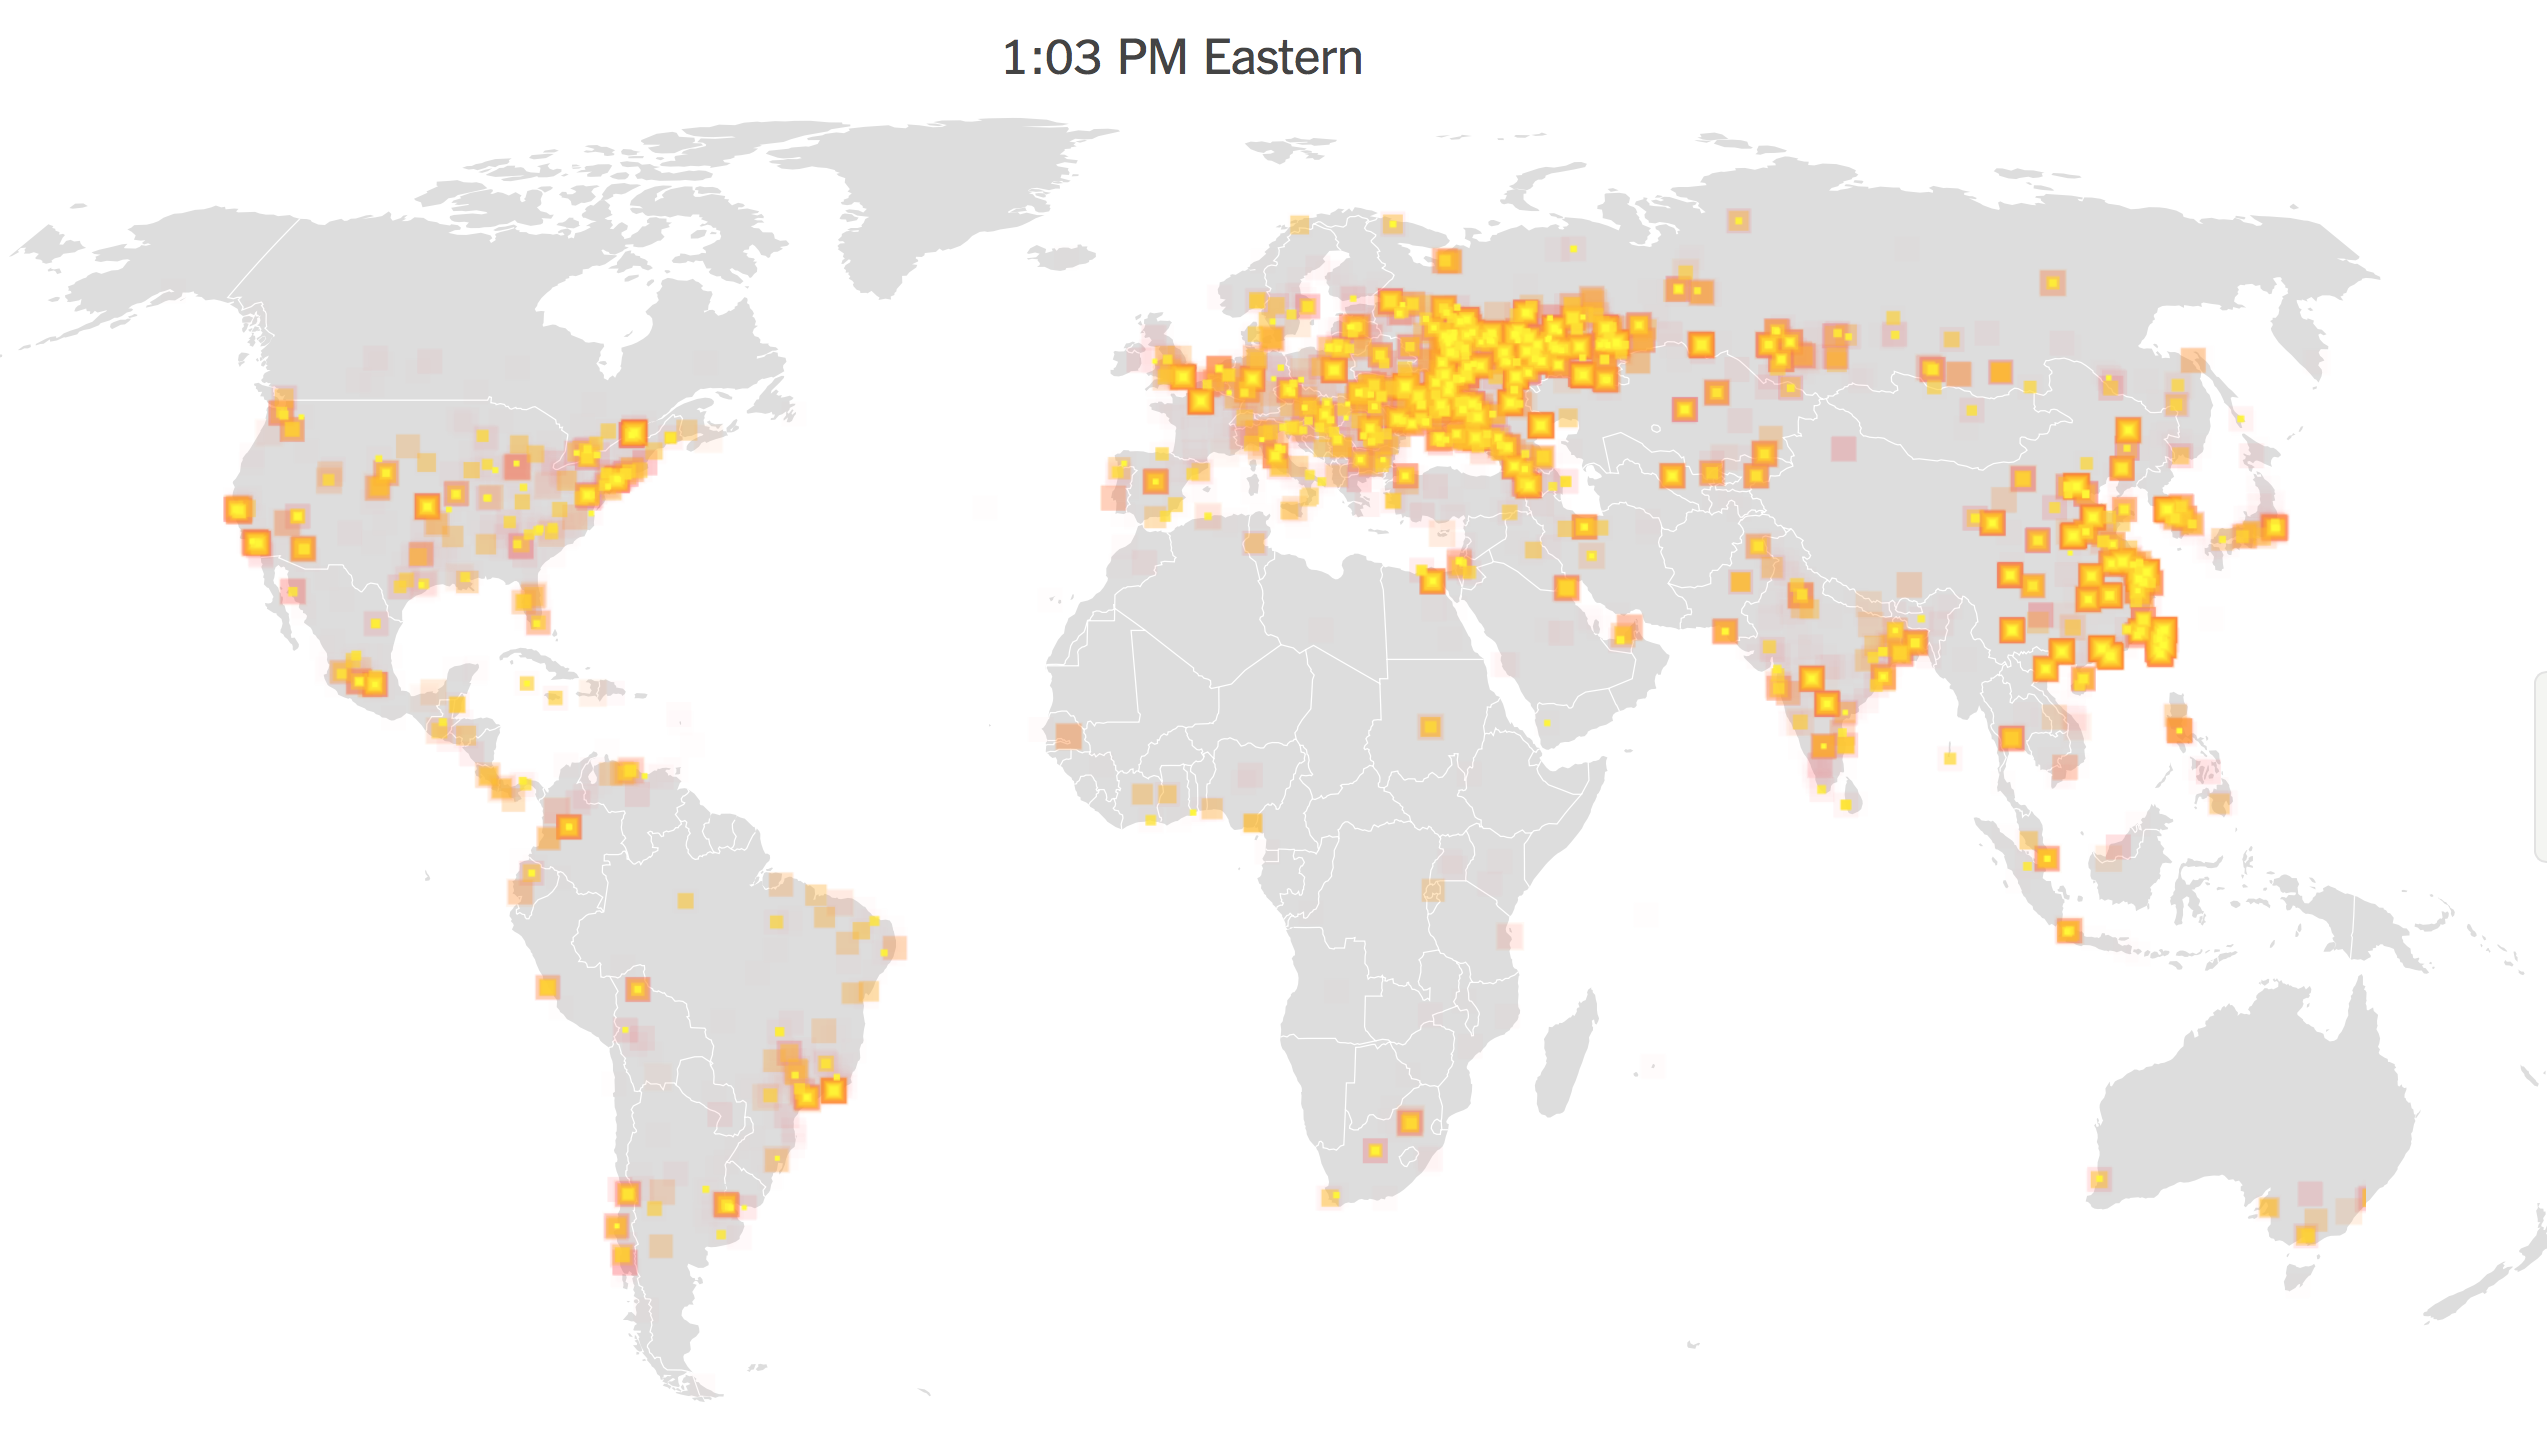
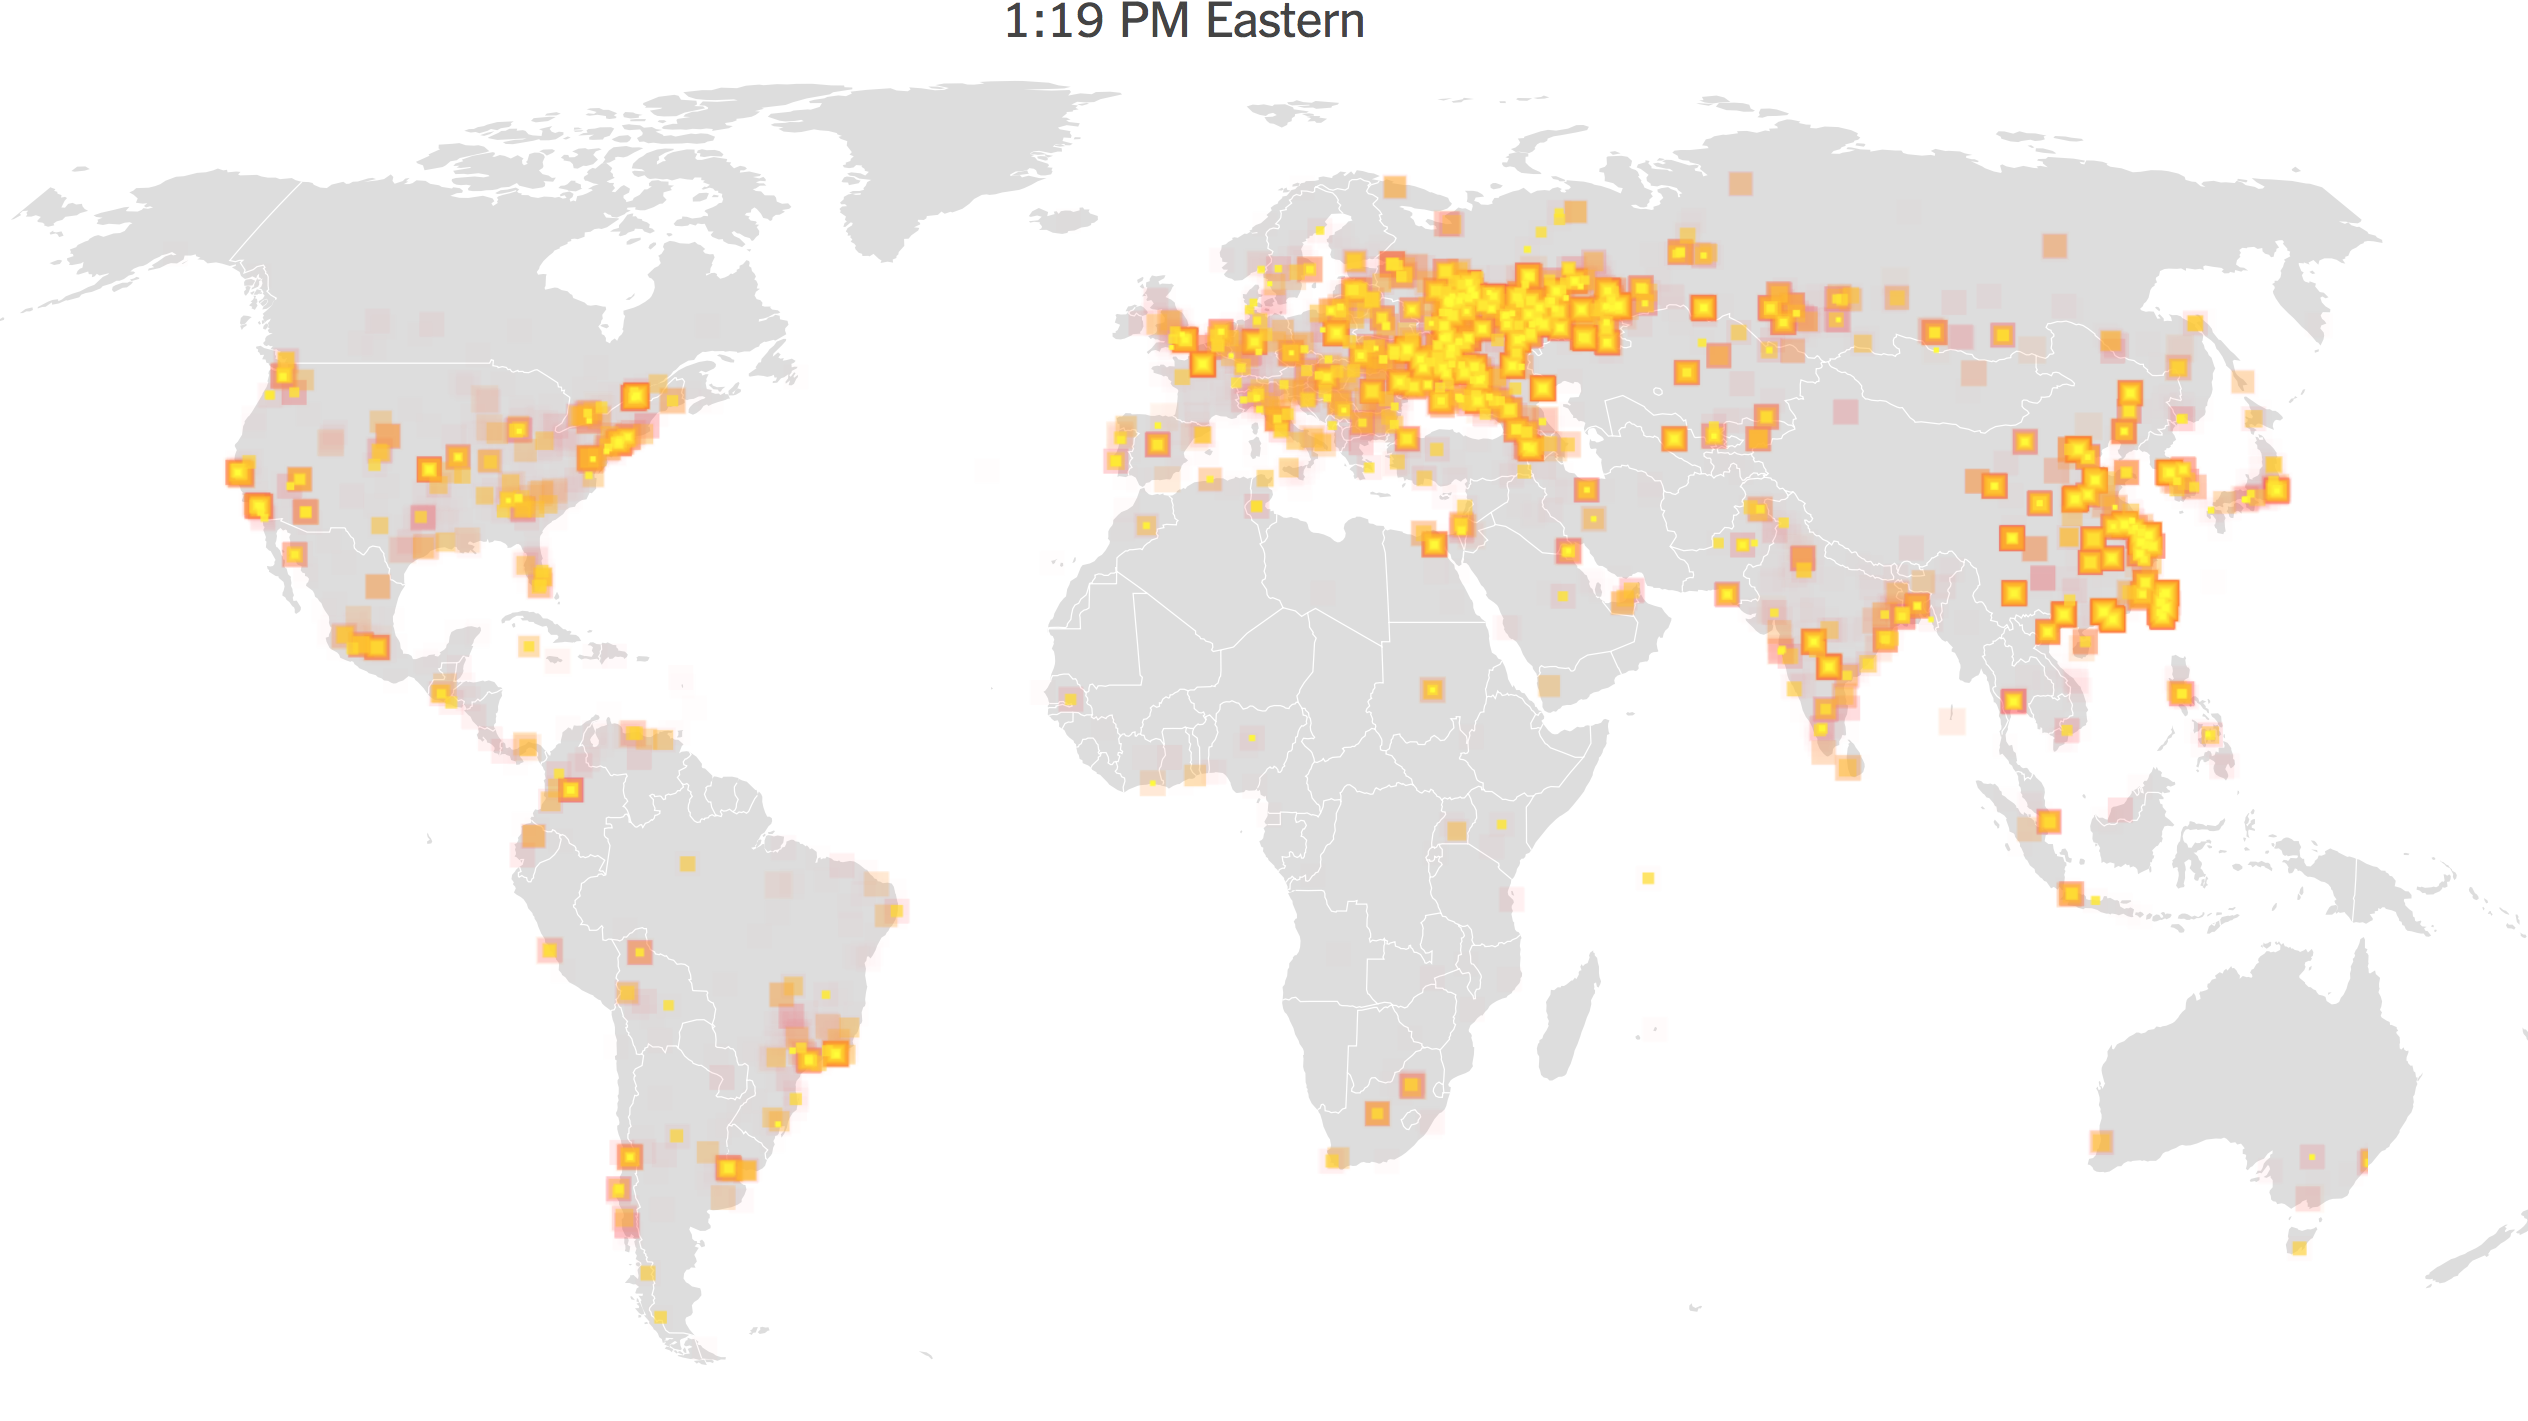
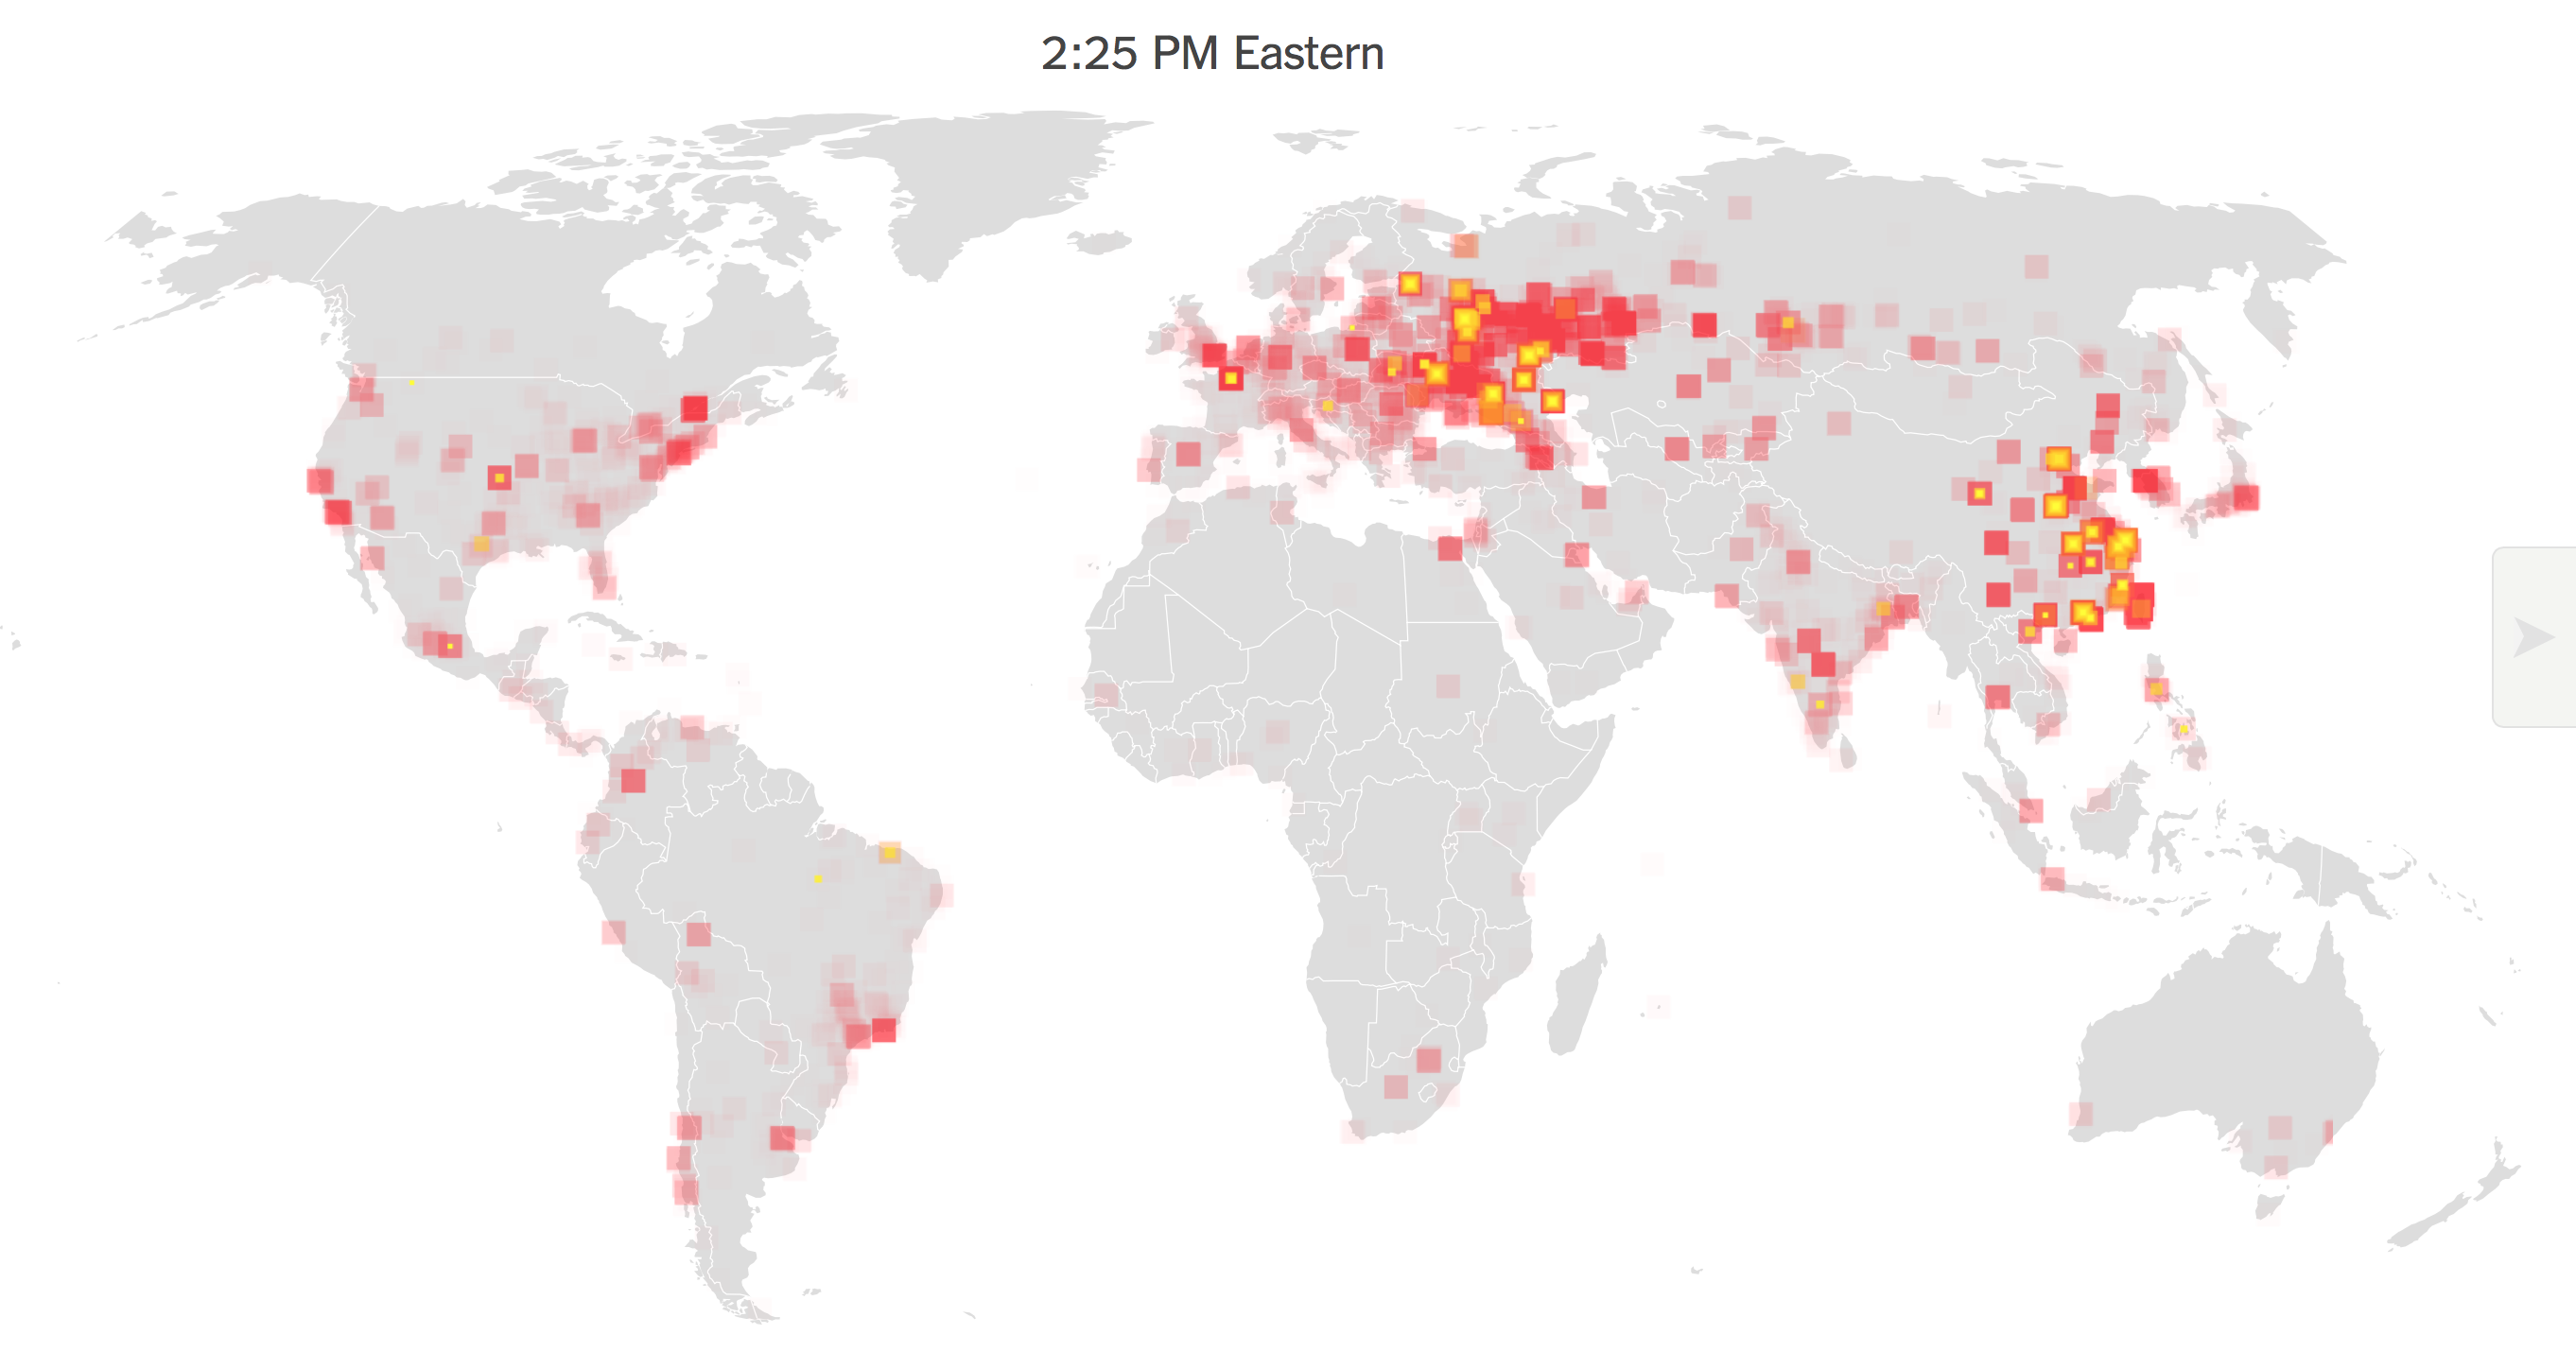
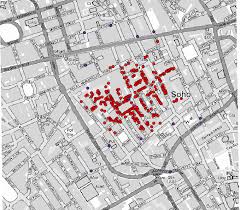
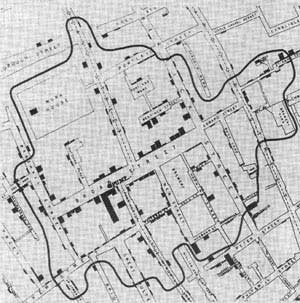
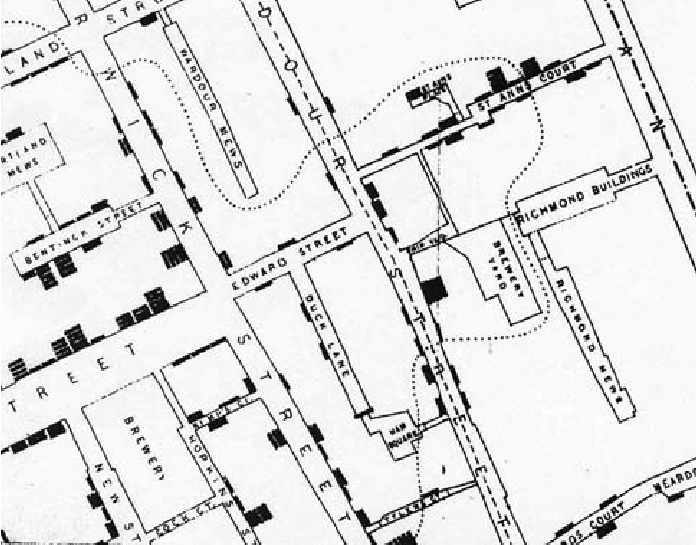
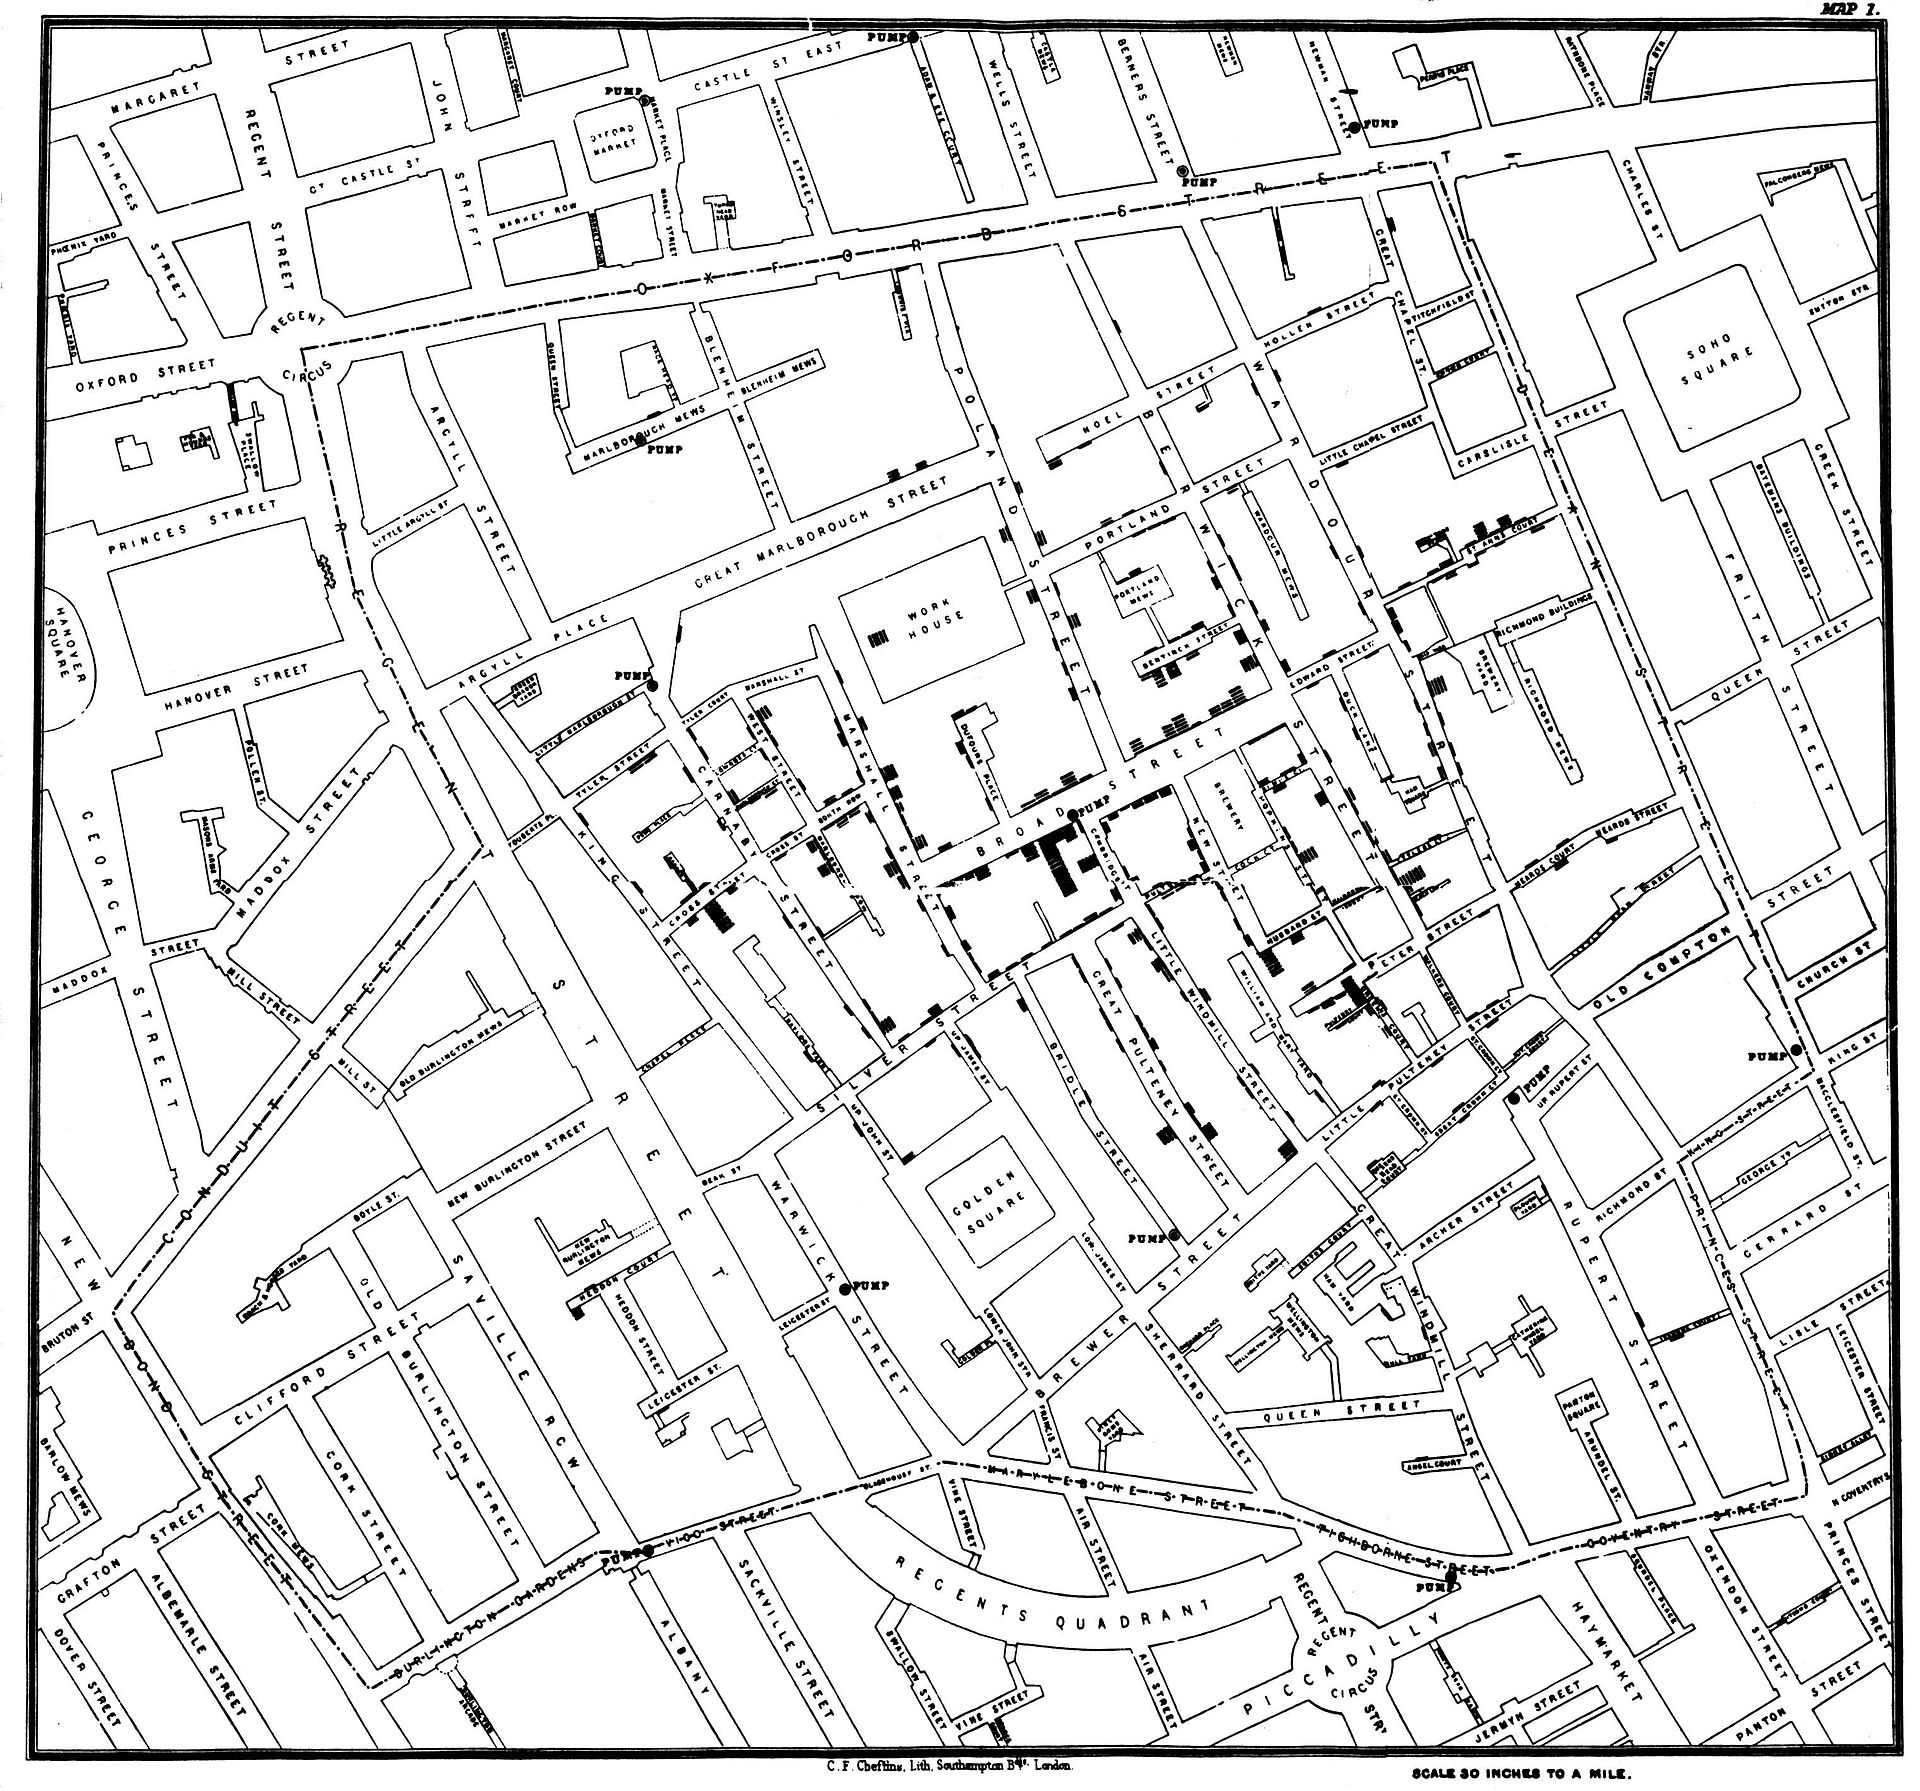
Although these maps suggest the scope and nature of the self-replicating cryptoworm, they may take the metaphorical value of a computer virus in literal terms, as a disease map, or biological virus whose contagious could be explained,–like the famous Snow Map, created by a founder of modern epidemiology, Dr. John Snow, to devise a mode to convince readers of the transmission from a water source of the 1854 London cholera outbreak. Of course, the malware maps do not try to communicate the pathways or mechanics of the virus’ spread. For rather than showcasing an event that was planned and of human agency, and whose propagation was in some sense designed, they run the risk of naturalizing both the incidence of systems’ compromises and the malicious nature of the very phenomenon that they describe. While the meaning that each bring pixel cannot even be understood or processed in a global scale–its impact was local–the intensity of the outbreak seemed almost a skin disease on the surface of the world. The intensity of its transmission surely mirrors the density of online connections or an economy that was web-based, as networks allowed its contagion spread from Indonesia to Europe the United States, raising alarms as it seemed to actualize some of the worst fears of a cyberattack, of the de-empowered nature of a computer system suddenly devouring its own data, but like a faceless god, from 11:00 one Friday morning, so that by 1:20, the spread of the malware had dense sites of infection on five continents.
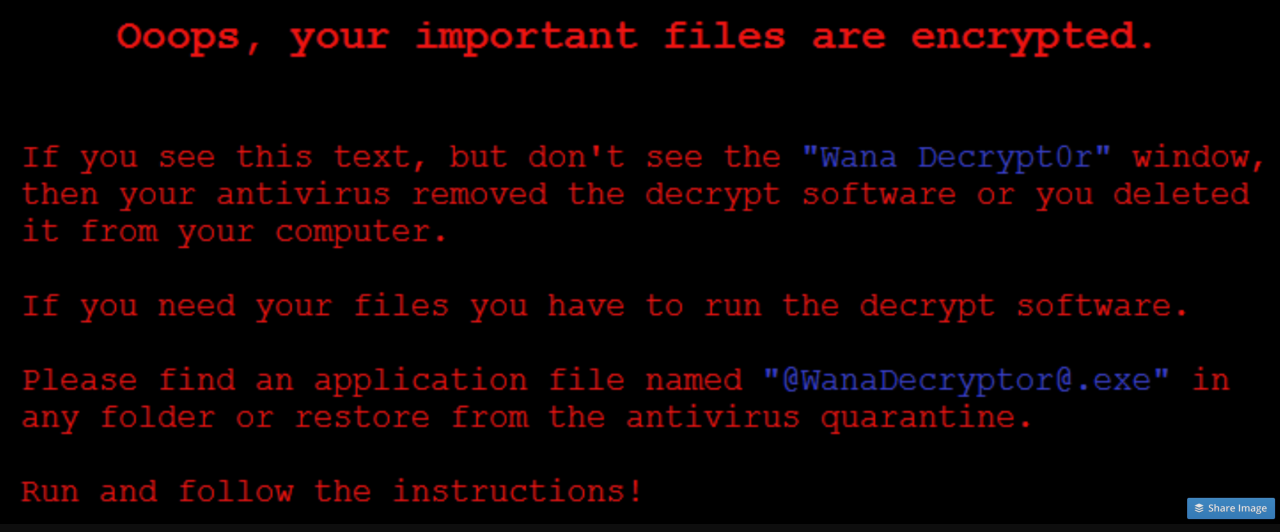
The local merged with the global, however, in ways difficult to map: the maps of real-time tracking of the spread of the worm across a grey, global map made it seem totally removed from human actors, in hopes to capture the speed by which the worm managed to rapidly to spread laterally across systems, using an onslaught of randomly generated IP addresses as a way to target an ever-proliferating range of hard drives through multiplying packets sent to remote hosts, whose own hard drives were hijacked, leaving anonymous-sounding messages of no clear provenance to pop-up on users’ screens, in ways that seem to imitate the “normal” logic of an algorithmic process entertaining the possibility of implicating the user in the encryption of their hard drive or the deletion of necessary valuable files.
The communication of the virus–a biomedical metaphor that seemed particularly unable to offer any diagnostic value, suggesting either the banality of the infection or its nasty spread–was not nosologically helpful, but suggested the virulence of its spread. The natural history metaphor of the worm–or, better yet, the coinage of the cryptoworm–better expressed the lack of clarity as to its provenance or the seriousness of its damage. Although subsequent investigations found that the first infections appeared, globally, on computers in India, Hong Kong, and the Philippines, according to SophosLabs, the stage was set for a three-pronged global spread–as if in a negative version of the Trans-Pacific Partnership, moving from South-East Asia worldwide–that began from 7:44 UTC with such startling rapidity that it will demand detailed unpacking to understand the target or decipher any of the aims that underlay the attack, or the extent of its destructive scope. The spread of the self-proliferating worm was only stopped by the inadvertent discovery in the code of the ransomware of a kill switch, which allowed a security researcher known only as MalwareTech to register a domain name able to slow the spread of the infection in a compromising manner, effectively halting its viral spread. Despite the rapid proliferation of visualizations of the unprecedented sale of its virulence, in retrospect, it might make sense to ask whether the undifferentiated global nature of the visualization, while stunning, distracted from the malicious operations of its code, and what better metaphors might exist to describe the spread of something dangerously akin to cyberwar.
We only have a few cartographic metaphors to describe the lateral spread of online compromising of computer data and the infiltration of networks, because of the speed with which it spreads challenge human cognition. Even if it can be schematized in a format that suggest the density of data compromises or the amount of encrypted files, the visualizations offer a limited basis to orient oneself to the seriousness or the danger of these infections, which once they start offer little possibility of stopping their spread. The later visualizations of the global impact of the release of Wannacry network worm are usefully foreground the rapidity of its spread, and raise the specter of its unstoppability. But the visualizations of the rapid flare-ups of malware that infect hard drives and encrypt their data may conceal the targeting of instability. If the spread malware and ransomware have been primarily linked to extortion, the spread of self-propogating cryptoworms cannot only be seen in numbers of systems compromised: for they are released and created in order provoke instability, as much as for Bitcoin revenues. Although theft of data is usually seen as most valuable to the owner of the dataset, the potential interest in ransomware as a service–and much ransomware is now available on the darknet in different forms, suggests a needed growth in cybersecurity.
If ransomware collectively netted about $1 billion during 2016–and stands to become a growth industry of sorts–the latest Petya virus netted but $10,000, although the benefits of the attack might have been much greater–in the form of the disruptions that it creates, often not so clearly racked or visible in the data visualizations of its spread, whose animated explosions suggest its out of control migration across networks as wildly crossing boundaries of state sovereignty, encrypting data on computer systems across space as it travelled along the spines of the internet as if without any destination, as tens of thousands od systems were entered and compromised via ‘back door’ disrupting hospitals in the UK, universities in China, rail in Germany, or car plants in Japan, in ways that were far more easy to track as a systems collapse by locking its victims out of critical data that allowed their continued operation. The demand for ransom payments to restore apparently stolen data was a screen for the disruption of invasive attack on companies’ computer networks, whose compromising can only start to suggest the infrastructural disruptions they created as they rapidly globally spread, whose apparently anarchic spread revealed the new globalized nature of system vulnerabilities.
While malware is distinguished by the demand to hold hostage the encrypted files of one’s hard drive, the viral spread of worms targeting systems vulnerabilities can disrupt systems and infrastructure in ways particularly difficult to defend against. Although the attacks depend on failures to update systems and to preserve retrievable back-ups, the vulnerabilities invite disruptions on a scale only so far imagined in futuristic films. These apocalyptic scenarios are perpetuated by security firms–and by the video games of the global imaginary that require only greyed out background maps to treat data visualizations as having sufficient complexity if they register the intensity of attacks, even if this only gives cover for the malicious actors who perpetuate their spread. But the assault on systems by the backdoor vulnerability first discovered by the NSA, in its program for targeting and infiltrating select foreign computer networks, but now for sale on the Dark Web, may only raise the curtain on a far more malicious range of malware, able to backdoor systems that are connected to transportation networks, water treatment plants, traffic systems, credit card systems, banking and airport controlling, far beyond cel phone systems, and able to–as the attack, just before WannaCry plagued web-based systems, compromised IDT Corporation–evade security detection systems. While regular, complete and restorable systems back-ups may be the only response to ransomware, the possibility of already backdoored systems has lead to fears that the Shadow Brokers group who unleashed the Eternal Blue code from the NSA is a group of Russian-backed cybercriminals, and the hackers who released WannaCry who cyber researchers believe have tied to North Korea, may raise the threshold on cyberwarfare of a scale unheard of in previous years.
“Nothing in the world could take us back/to where we used to be.” Golan Ben-Omi–who views the analytic skills honed in studying Torah as good training cybersecurity in the Chabad-Lubavitcher community– Chabad-Lubavitch communities are interested in preserving the integrity of their websites from profane pollution, but are attuned to the dangers of data breaches. The attack that was made on his company, IDT, by means of an NSA tool with the capacity to penetrate computer systems without tripping alarms–named “DoublePulsar”–enters the kernel of computer systems, or its inner core, to trip the connections between hardware and software that would allow hackers to steal systems credentials in order to compromise systems with far greater impact than earlier breaches and infections, appearing as ransomware, but perpetrating far more serious damage on a system. The sequential flaring of compromised computer hard drives suggests a landscape that Ben-Omi has been studying for over fifteen years–and believes that the analytical skills honed in the study of Torah will allow his students to analyze.
While we lack the tools to start to map disruptions on such broad scale, the If the attacks on hard drives that occurred in over one hundred and fifty countries on Friday, May 12, 2017 may have been a case of intentional disruption, but the Petya ransomware attack of July, which successfully targeted the same vulnerabilities, exploited similar vulnerabilities in a potentially more targeted weaponized manner. Although it “is only code,” the lateral spread across the spines of the internet created fears of impending disaster across the most digitally rooted areas of the world, spreading fears of data disruptions, crashes and infrastructure collapse whose potential won’t be able to be so clearly mapped for quite some time.
The terrain of the crypto worm’s spread is better able to be understood, if not quite familiar. During the most recent space of malware attacks left most untouched places those farthest from the most unreflective internet-dependent, the map only can suggest the real-life inconveniences that can hardly be captured by the burning flares of yellow-red bursting at spots across the globe at unprecedented velocity.
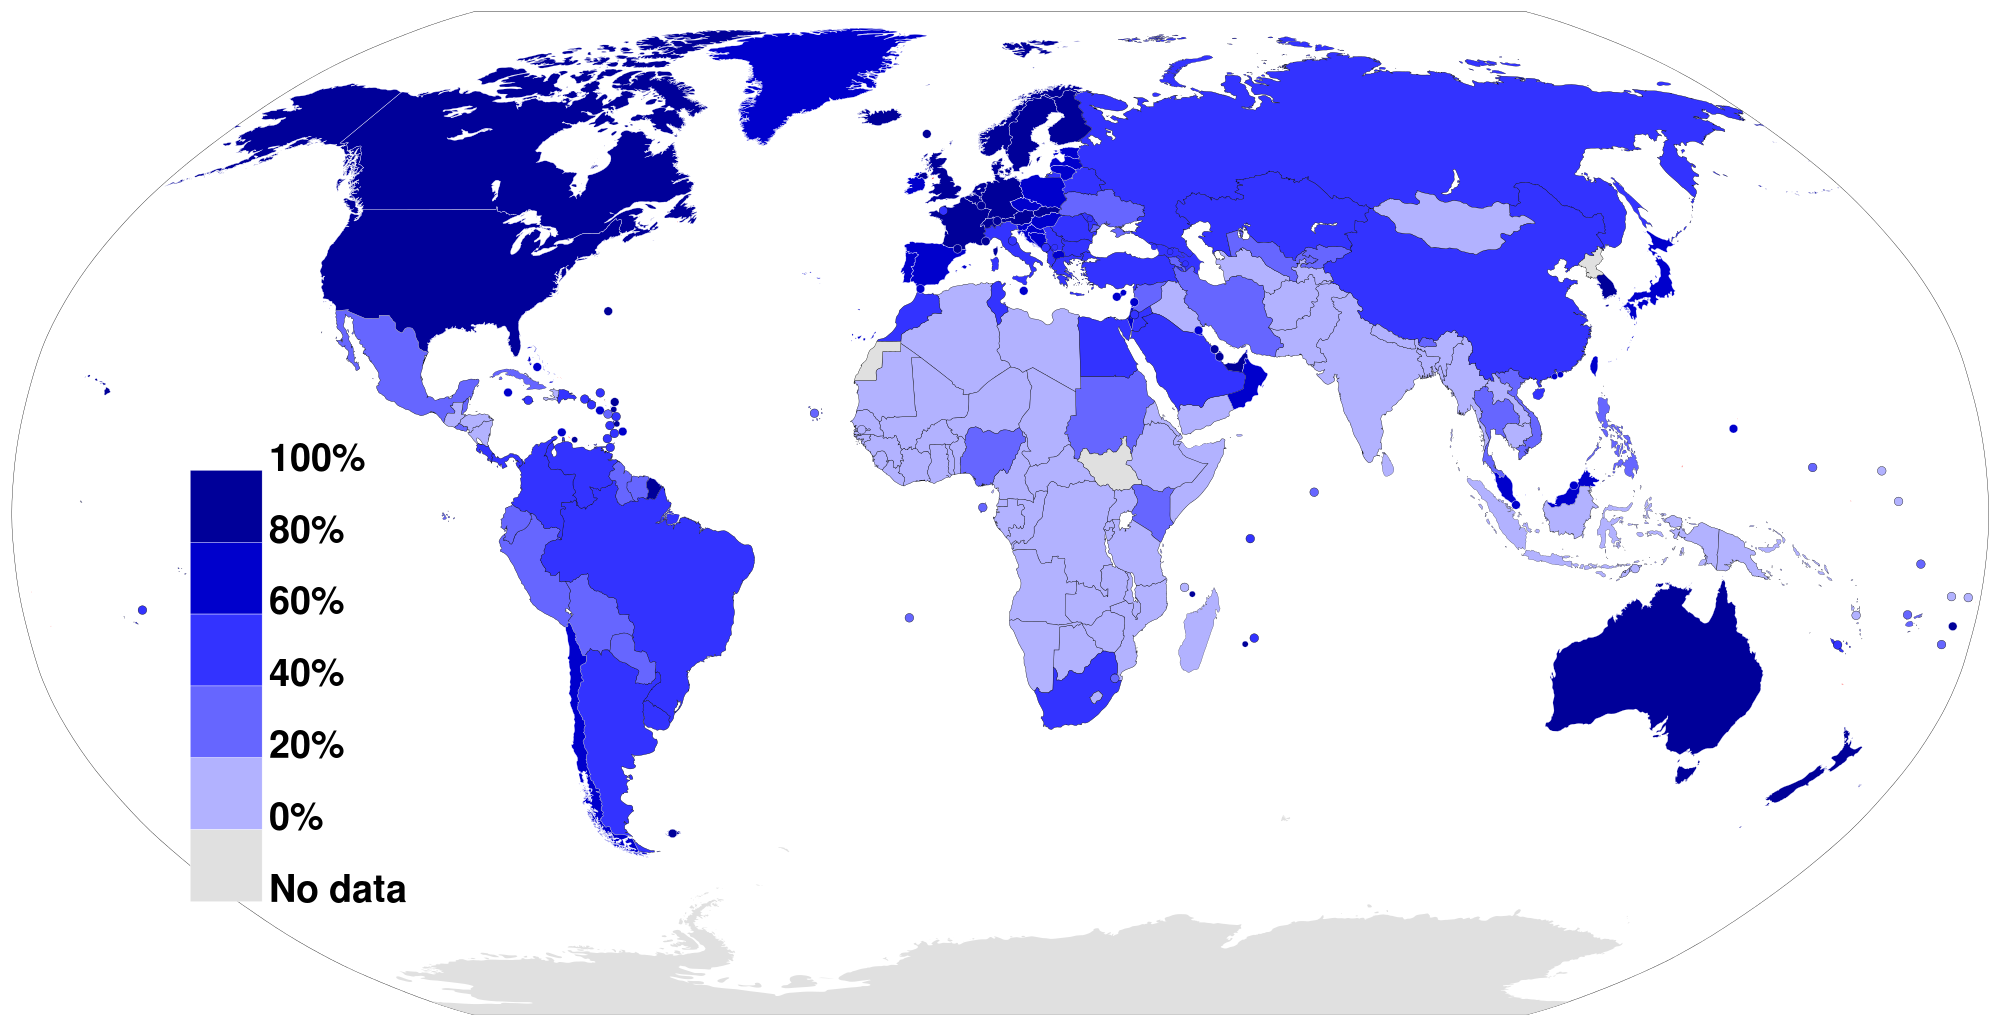
Global Internet Penetration 2012/Jeff Ogden
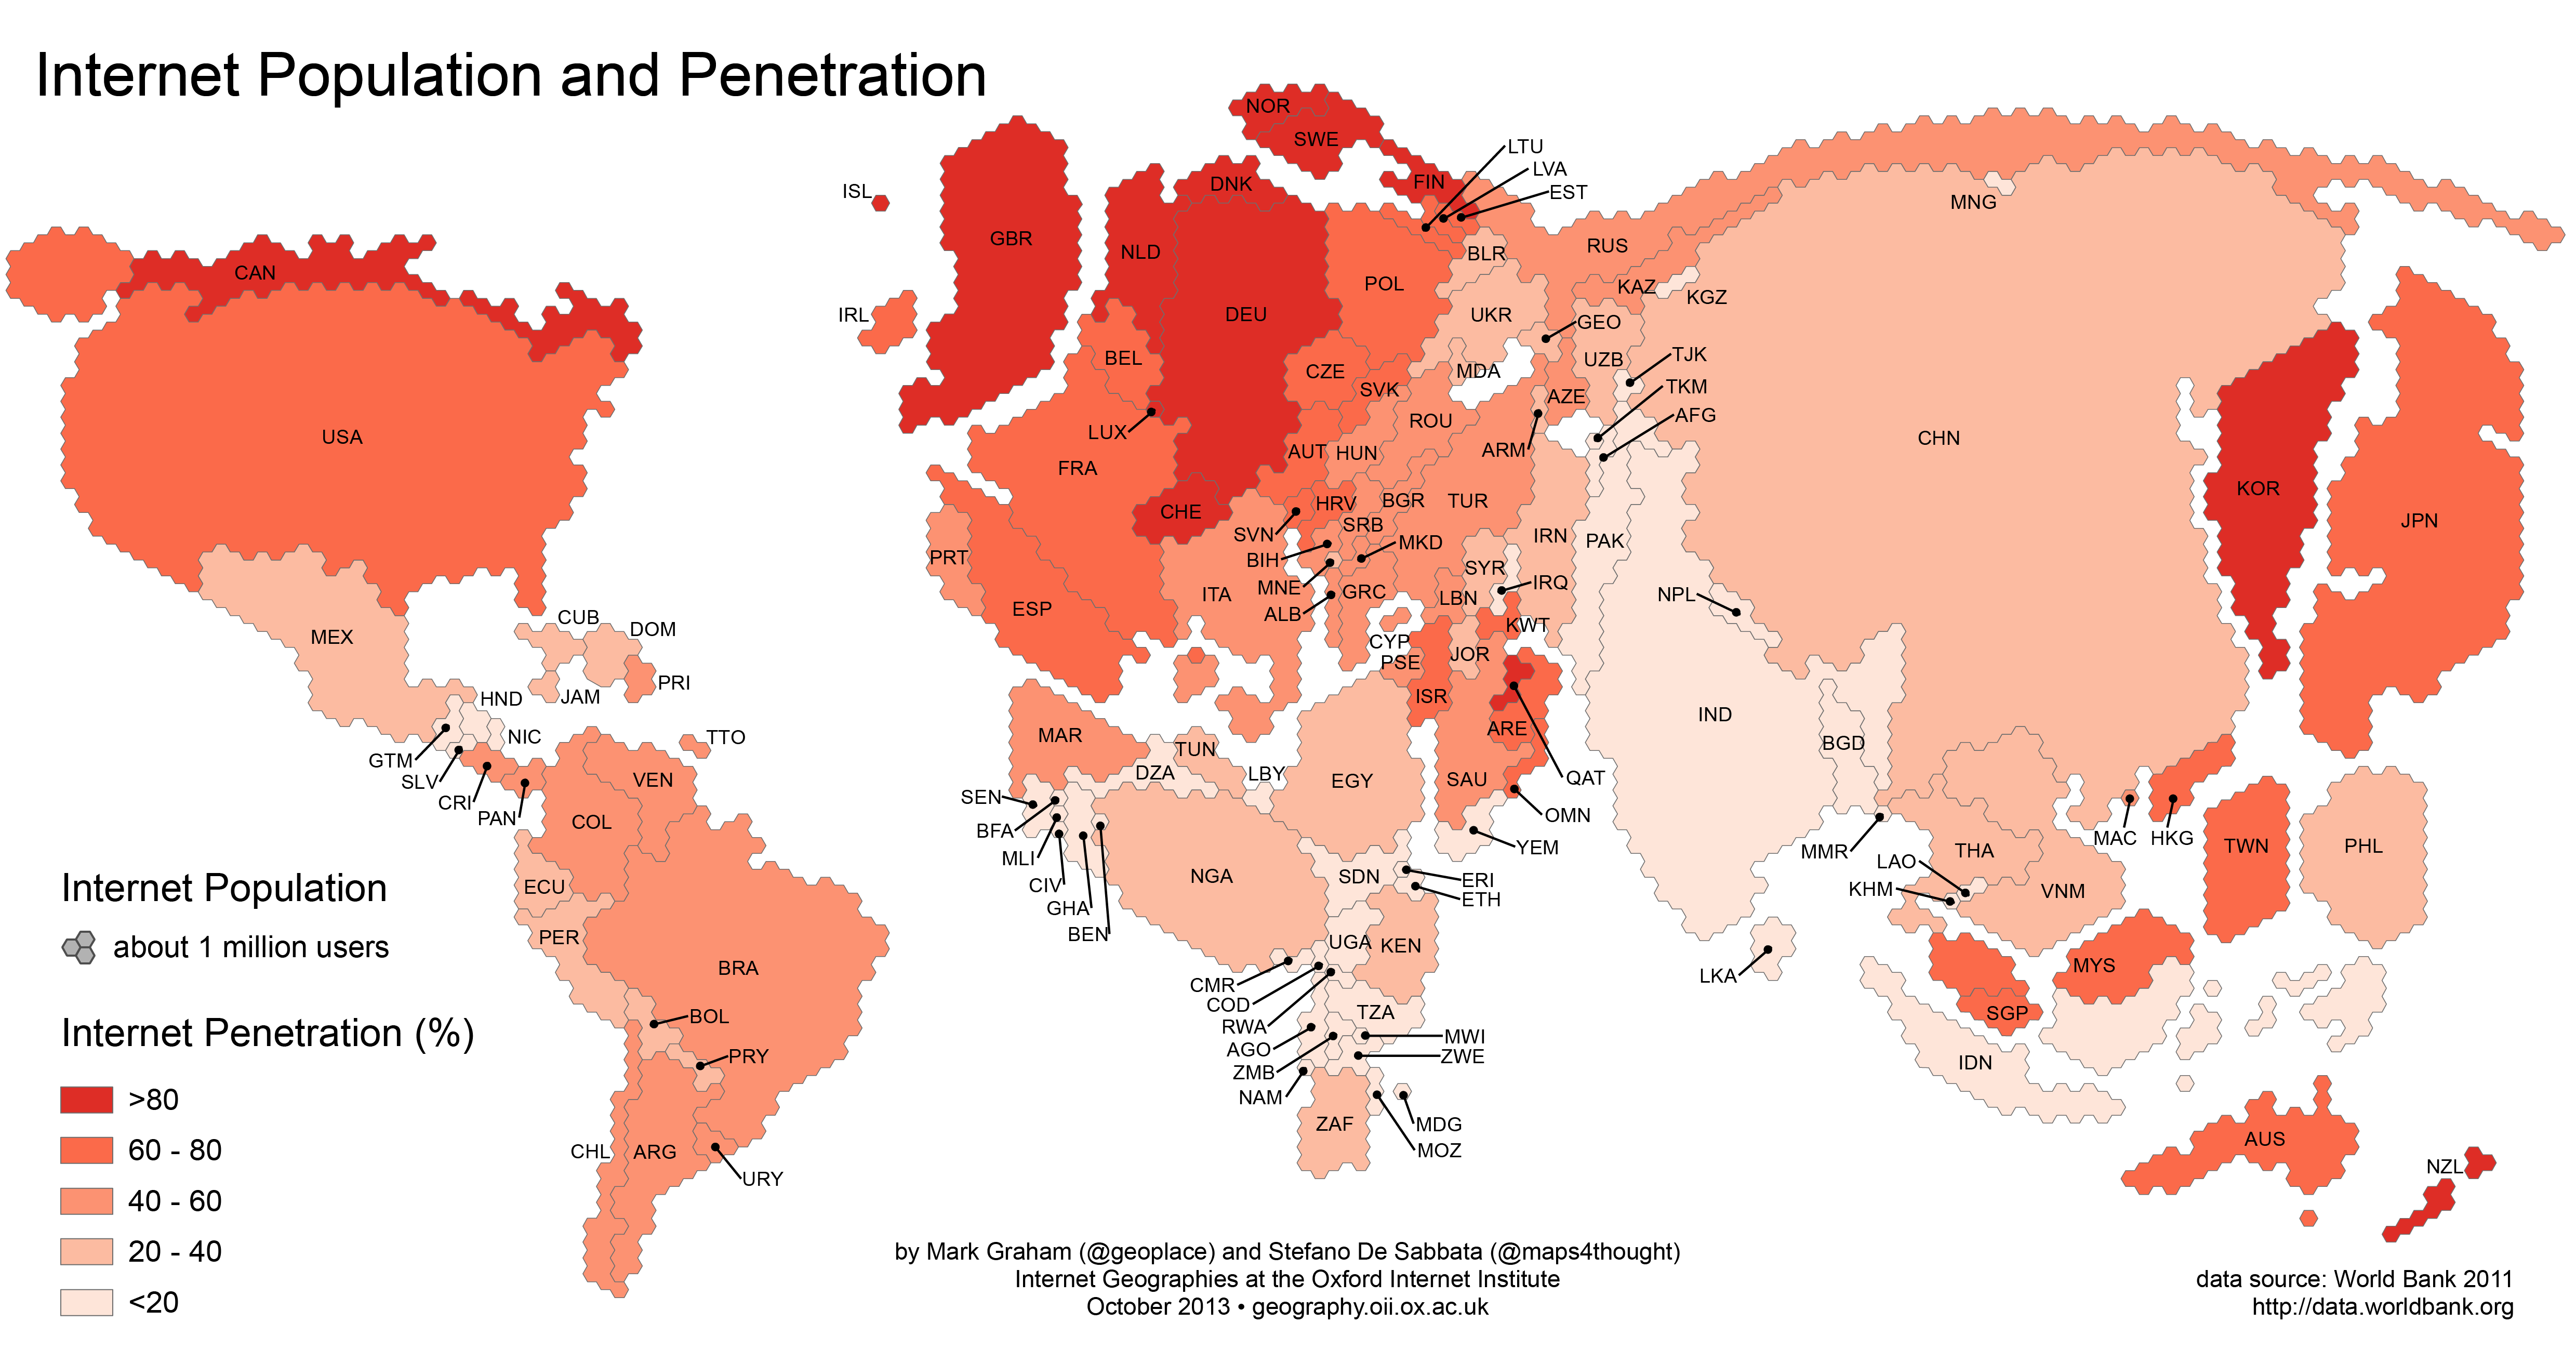
Oxford Internet Institute (2011) Data on Internet users and population from World Bank
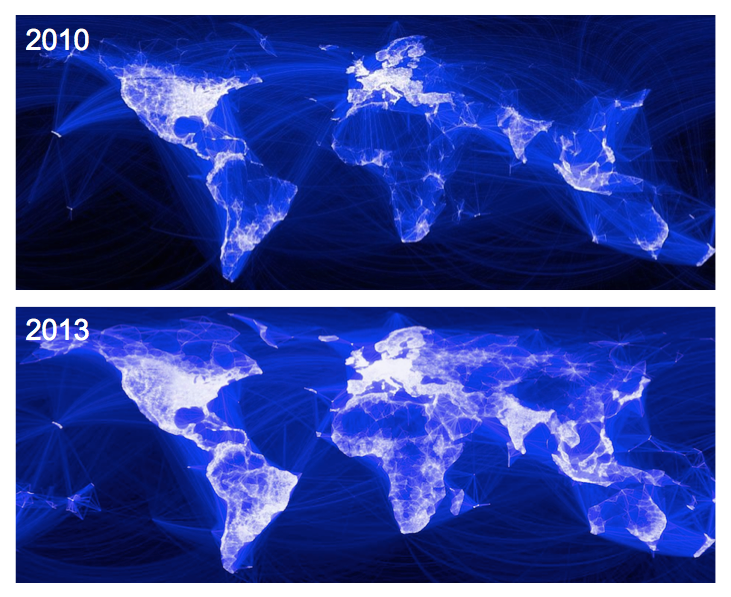
For while not only communicated–as at first believed–by malicious email attachments, internet links clicked by users whose unreflective response unleash lost data, frozen systems, or looted bank accounts, the spread of ransomware parallels the amazing intensification of net-dependence and systems-based communicative tools, revealed below in the new information ecosystems that have arisen, illustrated in the quite spread of Facebook use over a short amount of time.
The relation between online activity and real-time consequences are difficult to map.
All maps serve to help tell stories, and the intensity of Facebook connections suggest more than a huge time-suck of human lives: it reveals the increased homogeneity of the systems we use, and the similarity of what we see and read. But if all maps tell stories, the necessarily partial nature of the dense visualizations of the global disruptiveness of malicious attacks on computer systems seem compromised: while over-laden to challenge the abilities of viewers to process their content, they only tell the most superficial part of real-time story–the compromising of data–and not the consequences that the widespread collective compromising of hard drives will effect both immediately and in the long run. And here we get onto thin ice in terms of what can be visualized, and the limits of counting the datasets of the corruptions of computers or systems, and the difficulty of counting beyond the density of compromised hard drives to the real-world implications of systems’ collapse. One can only start to imagine the implications of such collapse in maps contracting the real-time compromises of computer systems, in ways that reveal the global nature of an infectious spread of malware, but also obscure the different places that might be targets of weaponized malware attacks.
What we can track is the most immediate end-product of the malicious attack, but it offers few clues to interpret the basis for the attack or indeed the different scale of its real-time long-term consequences.
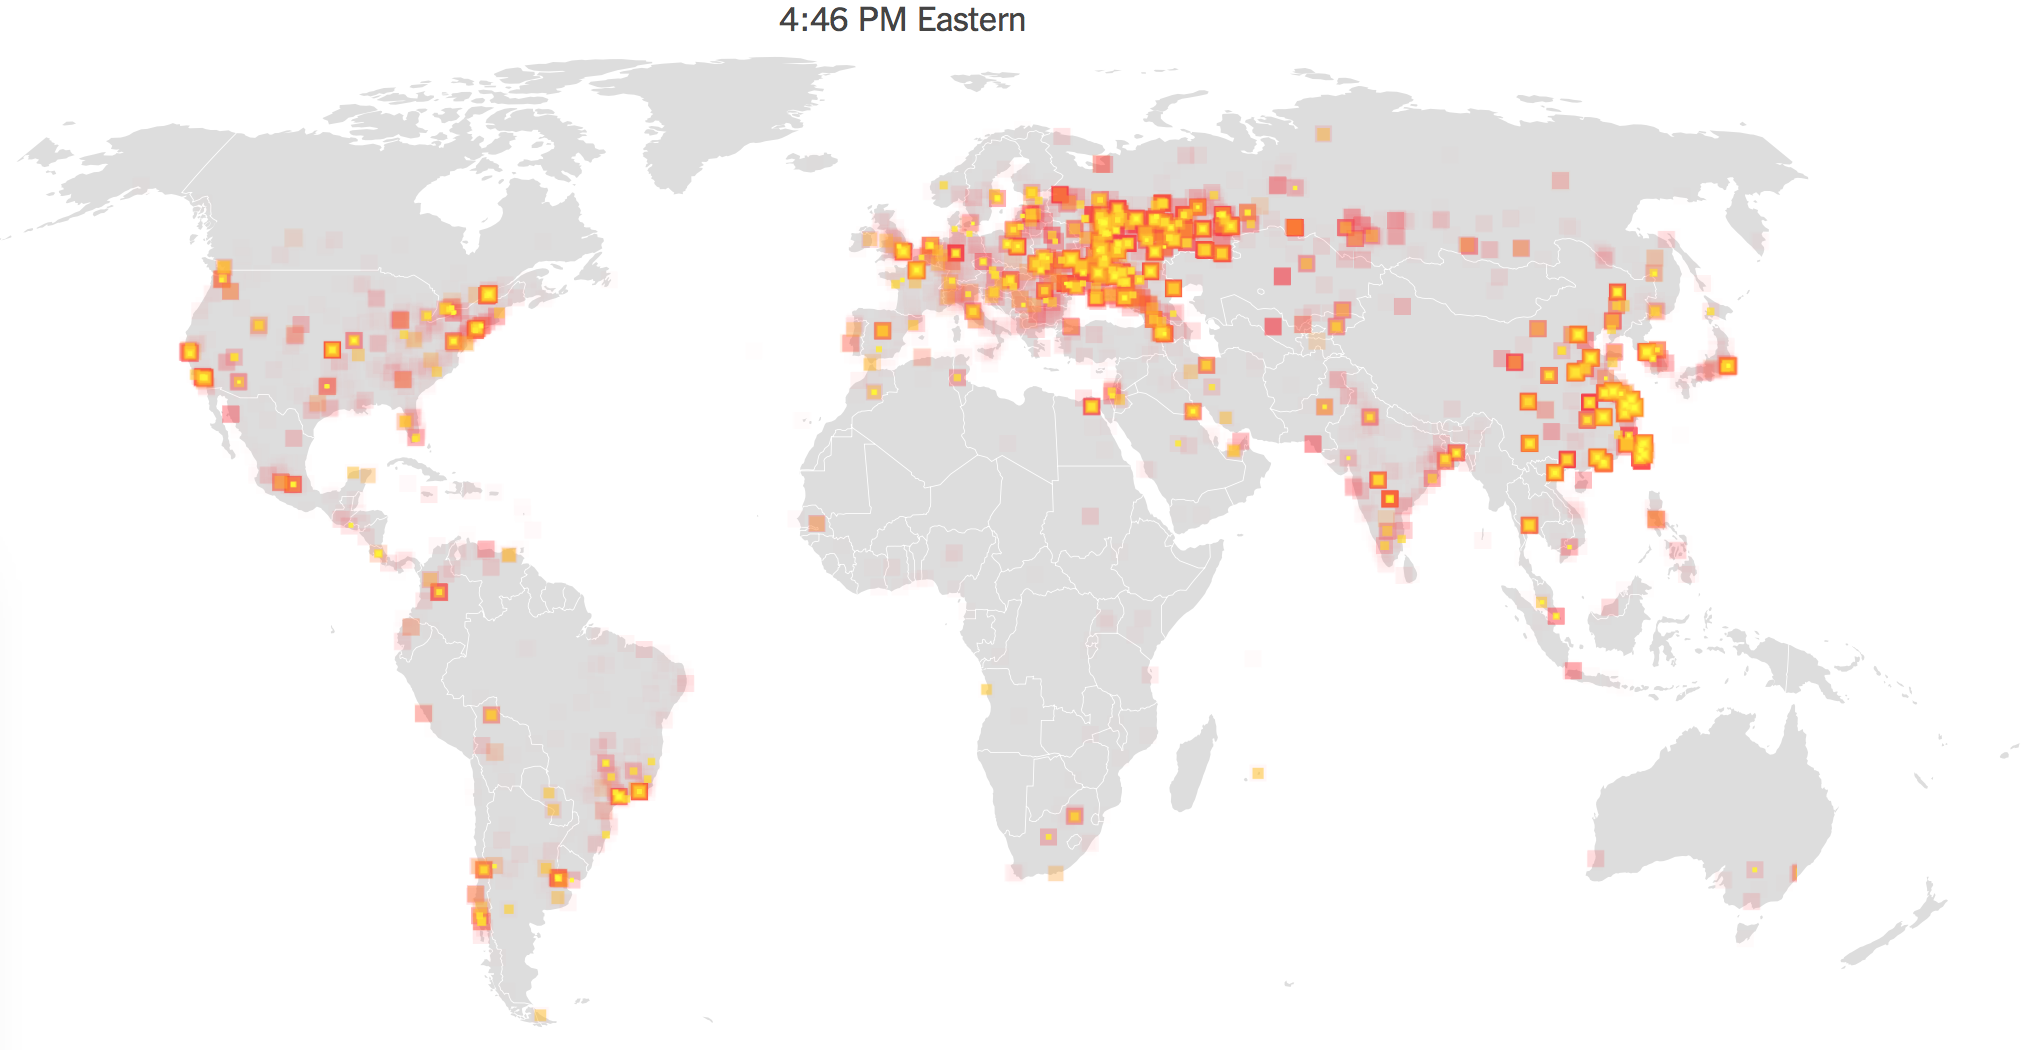
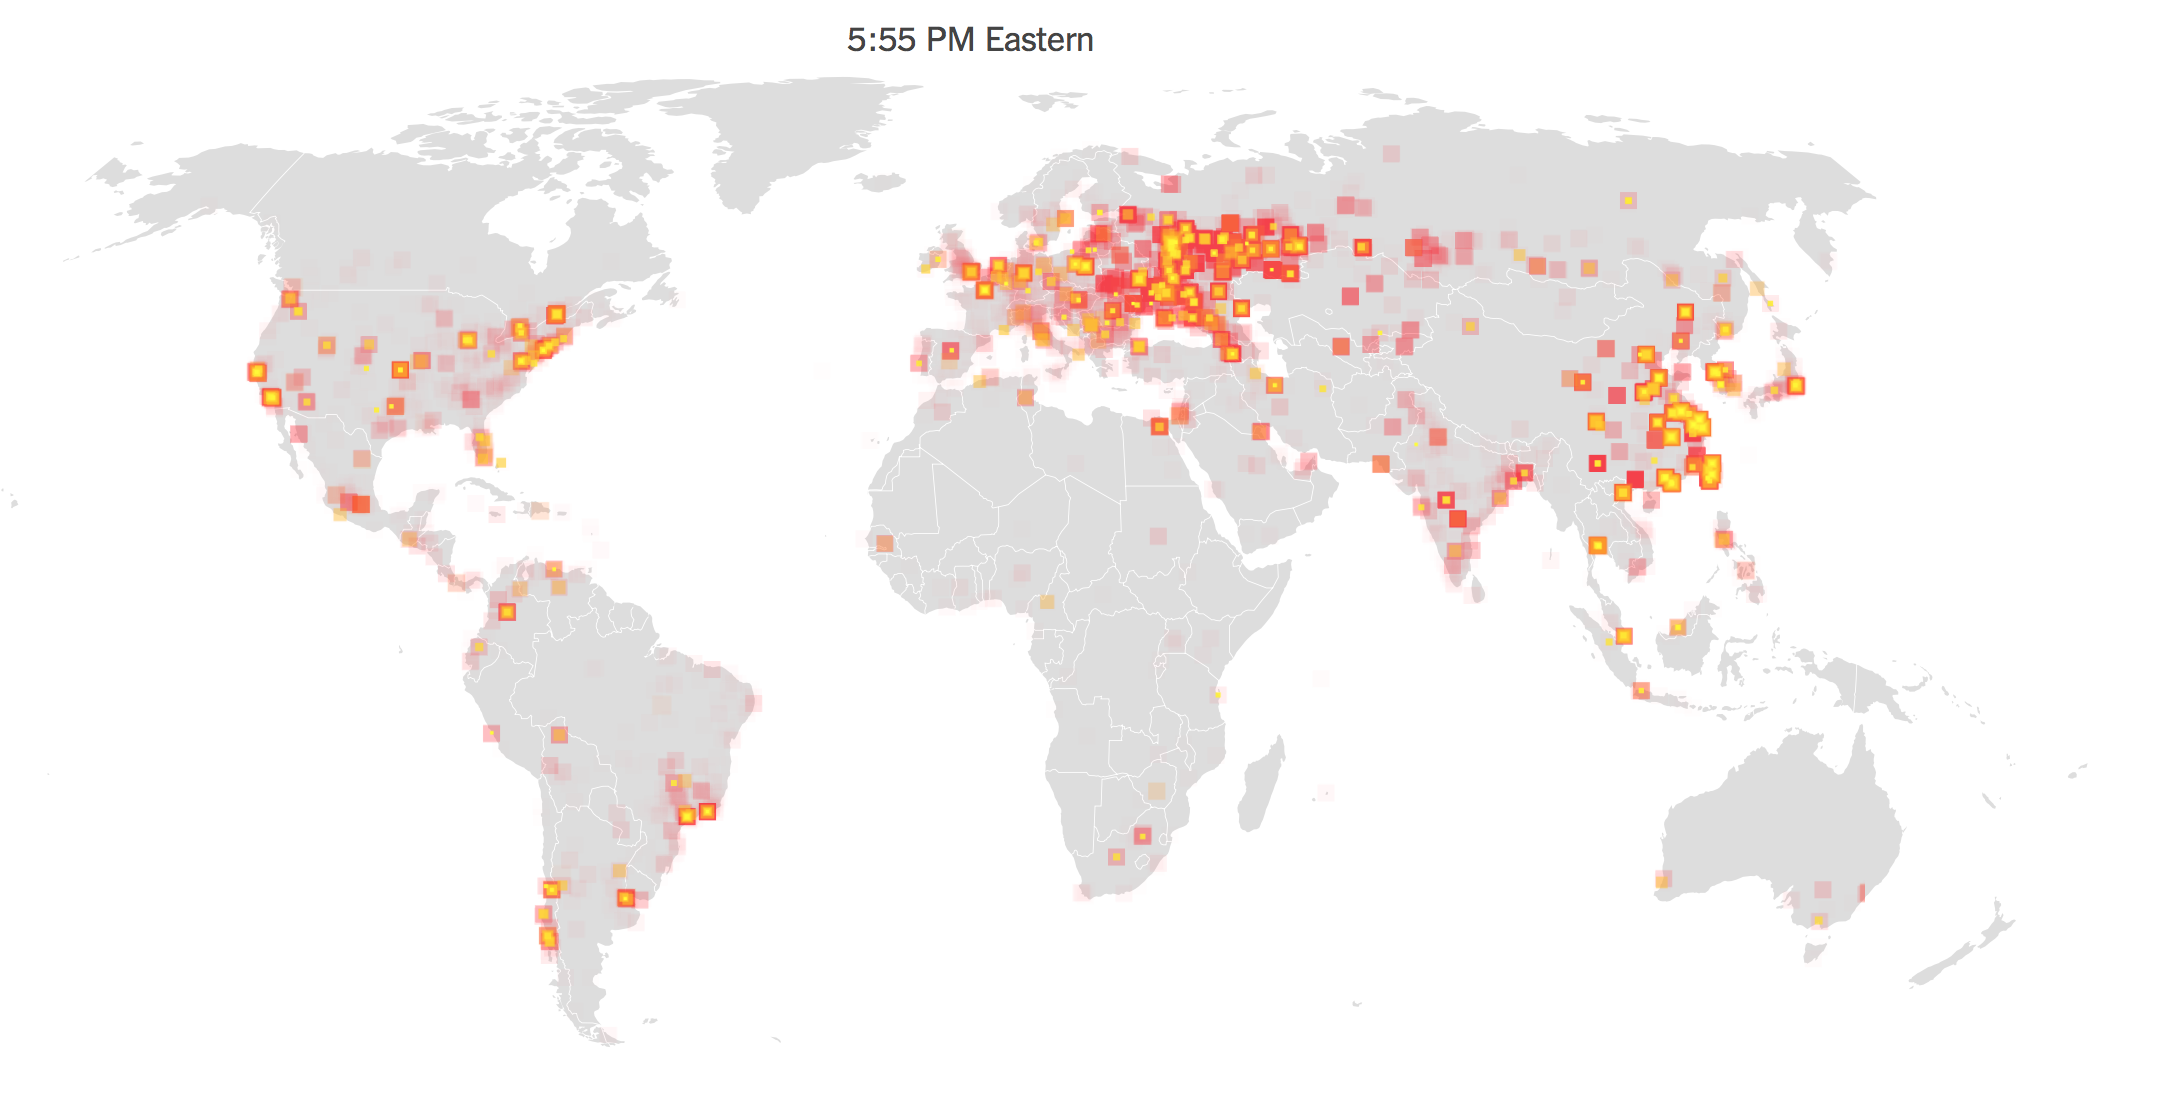
The visualizations track an almost near-inevitable progress of red flares in internet-dependent hubs that appear to overwhelm viewers with their over-laden information in ways that run the risk of obscuring any sense of human agency–or intent–as if to track the spread of a virus across a system that lacks internal logic of its own. The intensity of attacks on computer networks tracked from the Wannacry ransomware showed the astoundingly rapid spread of the infectious cryptoworm that caused the attacks. But it presented them as if they were in fact geographically localized, but the disruptions were purged of any explanatory context, geopolitical or other. For the inevitability of the spread of malware that the images provoke–and the fears of the unstoppability of further crypto worms–may obscure the dangers of their weaponization. If the launching of cyberthreats is often depicted as a real-time war by cybersecurity firms as Norse–
–we may be increasingly in need of mapping the intersection of such live attacks on data and their real-life consequences beyond the compromising of datasets.
We were recently warned how the expansion of malware and ransomware would soon propagate over networks in more virulent ways. Earlier worms that infected hard drives as Conficker in 2008 and SQL Slammer back in 2003 or SamSam, spotted in 2016, offer but “a harbinger of a new wave of more malicious, tenacious and costly ransomware to come,” of even greater scale, warned Joe Marshall of Cisco Talos, with “bigger payouts.” Marshall warned of the greater goals of hackers to infect networks, and his warnings might be augmented by suggesting the dangers of hackers working with governments to use malicious code to “cast a wider net” through self-propagating crypto worms able to laterally traverse huge corporate networks as tools by which to target nations–and national infrastructure–in ways that the fear of network intrusion have only begun to come to terms. When Marshall and his co-author Craig Williams noted in 2016 that the rise of ransomeware was an “ever-growing problem” that will involve greater payments to restore databases in Ransomware: Past, Present and Future with greater “intrusive capabilities,” with the repurposing of network vulnerabilities, on a massive scale, presumably including the targeting of entire systems. The maps of data encryptions and corruptions that WannaCry caused worldwide served to capture these fears, and their broadly trans-national consequences; the trans-national nature of such a strike on hard drives may well obscure and conceal the strikes and intentions of other malicious actors. Although some believe payment the easiest option to retrieve data, as the worms are developed that target vulnerabilities in systems, they will potentially be able to compromise targeted banking, transportation, and emergency infrastructures.
Do visualizations of the immediate fears of the spread of one virus conceal concerns of the weaponization of such internet-born infections on specific targets and nations, despite the seemingly unplanned ubiquity of their spread across interlinked systems? Despite their shock, such visualizations of the intensity of compromised systems, often echoing hubs of internet service, raise pressing questions about how to map the operations and actors behind them that are far more complicated to process fully–and lie off of the map.
1. Viewing visualizations of such rapidly spreading worms that compromised computers on a global scale, one wants to be able to peel away layers of the visualization, to reveal, as layers of an onion, the networks along which the cryptoworm laterally spread and the extent of disruptions that its spread caused. For the scale of the disruptions, and the intent of the hackers or those who launched the malicious code, may only be revealed in a more localized map of the sorts of destabilization that cryptoworms might produce. While leaving us to wonder at the unprecedented scale of their recent spread over a few hours or minutes, the visualizations take geographical space as their primary register, blank background maps bleached of underlying history, may make them all the more misleading and difficult to read, as they are removed from human agency and context, and treated as an artifact of the spread of the reliance of increasing multinationals on internet services and web-based networks.
Differences in online activity are far less lopsided across geographic space than in previous years, as shown by the Oxford Internet Institute by a cartogram warping of global space showing the relative density of online activity by 2013 data, in ways that allow the broader targeting of systems to conceal a malicious attack on a country.
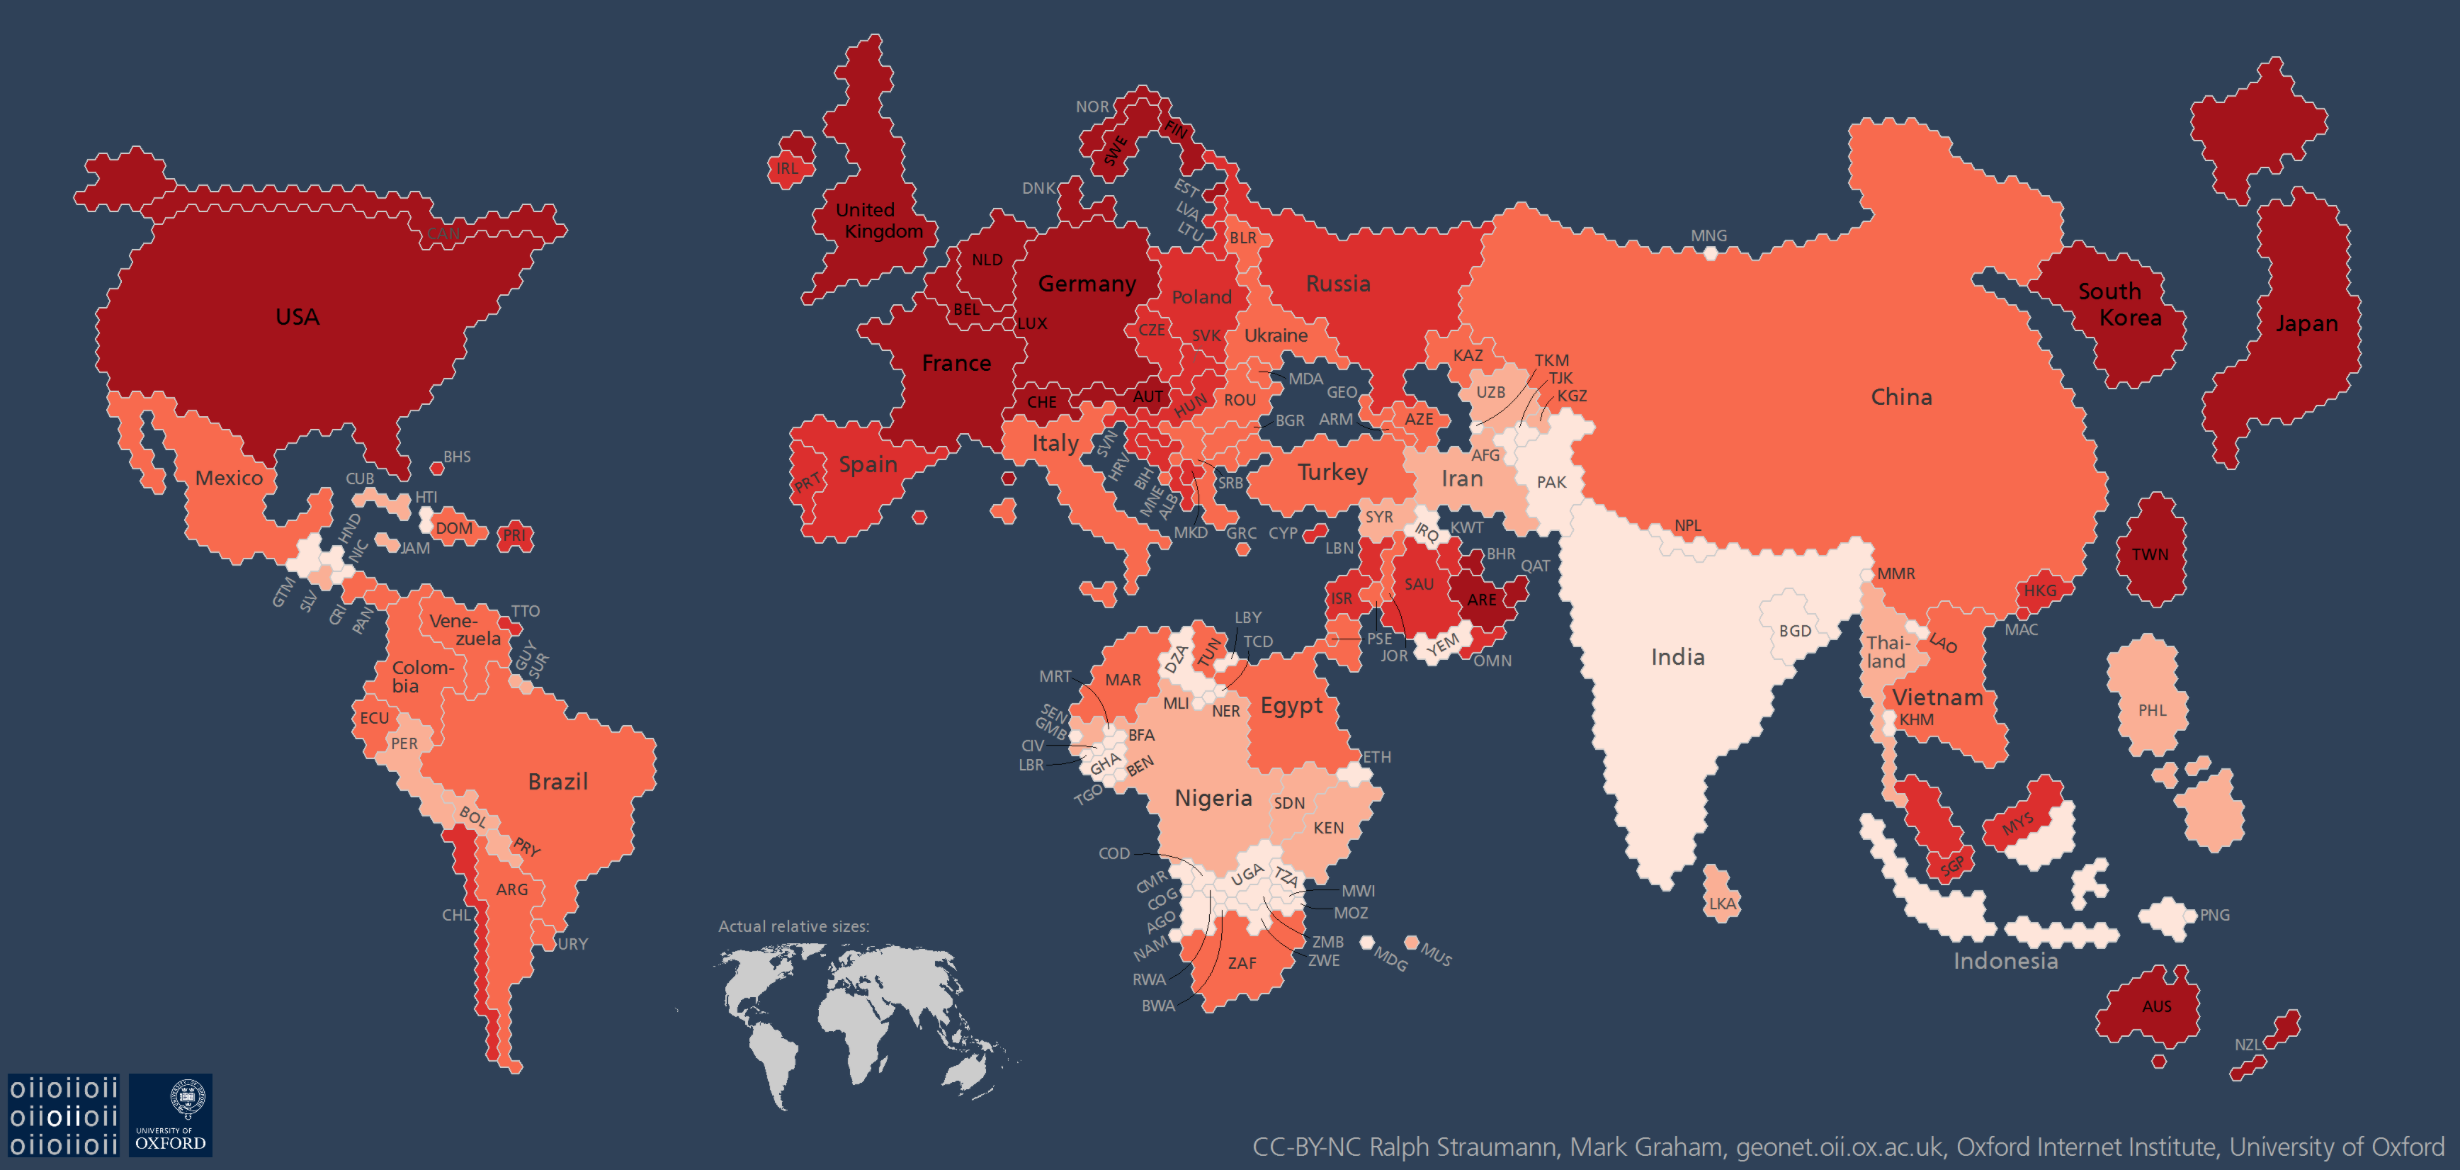

–which might also be read as a record of the increased vulnerability of specific areas, and the systems vulnerabilities might offer to compromise local infrastructure, and start to focus on the implications for those places. Doing so would consider the growing intersections between The Real World and the internet in a complex social continuum, where stability can be disrupted at select nodes more dependent on how worlds of finance, banking, shipping, health, and traffic are increasingly interlinked. Given the inevitable nature of such vulnerabilities, the frequent backing up and smooth restoration of backups are necessary to erase the growing threats not only of malware or ransomware, but the disruptions of critical infrastructure future attacks might allow.
Continue reading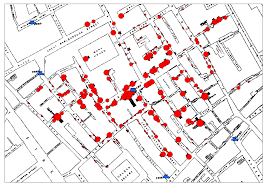


