Daily Archives: January 26, 2013

Up in the Air

Guy Lussac en Ballon
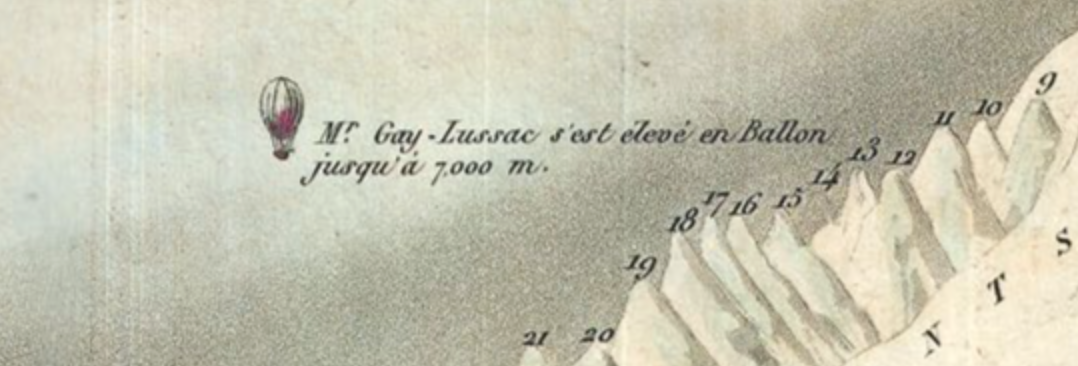
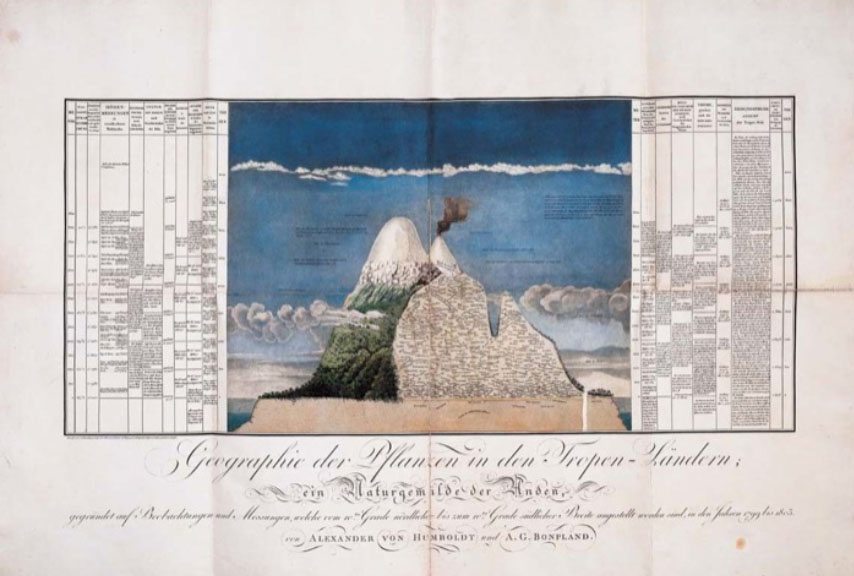
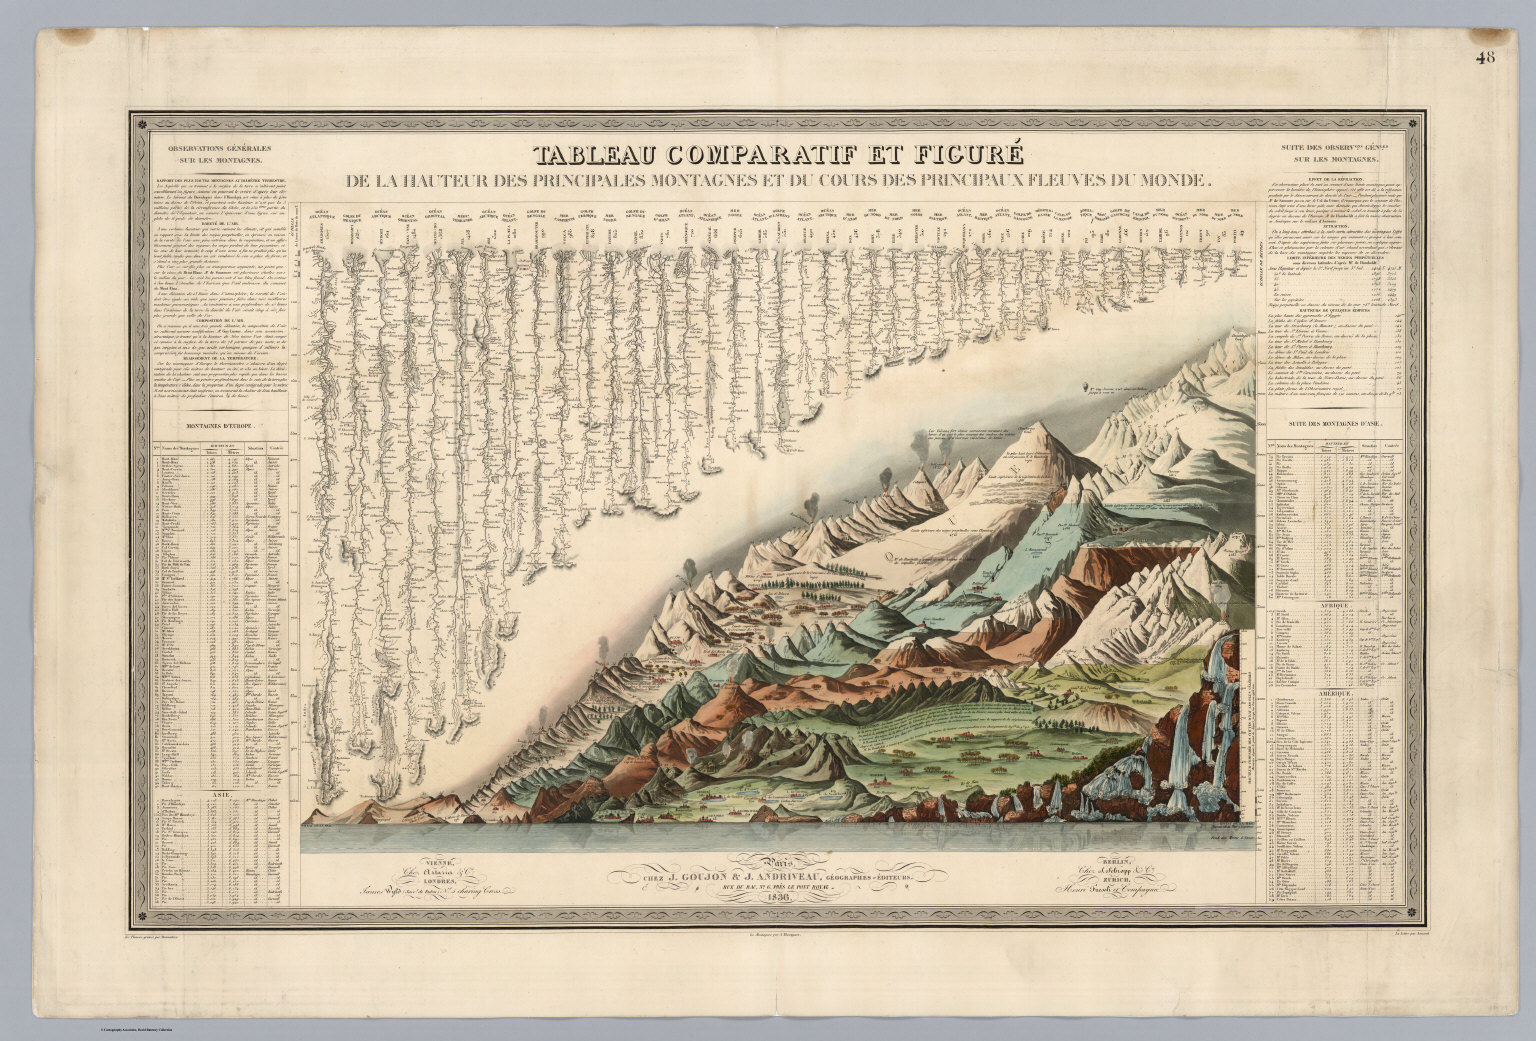
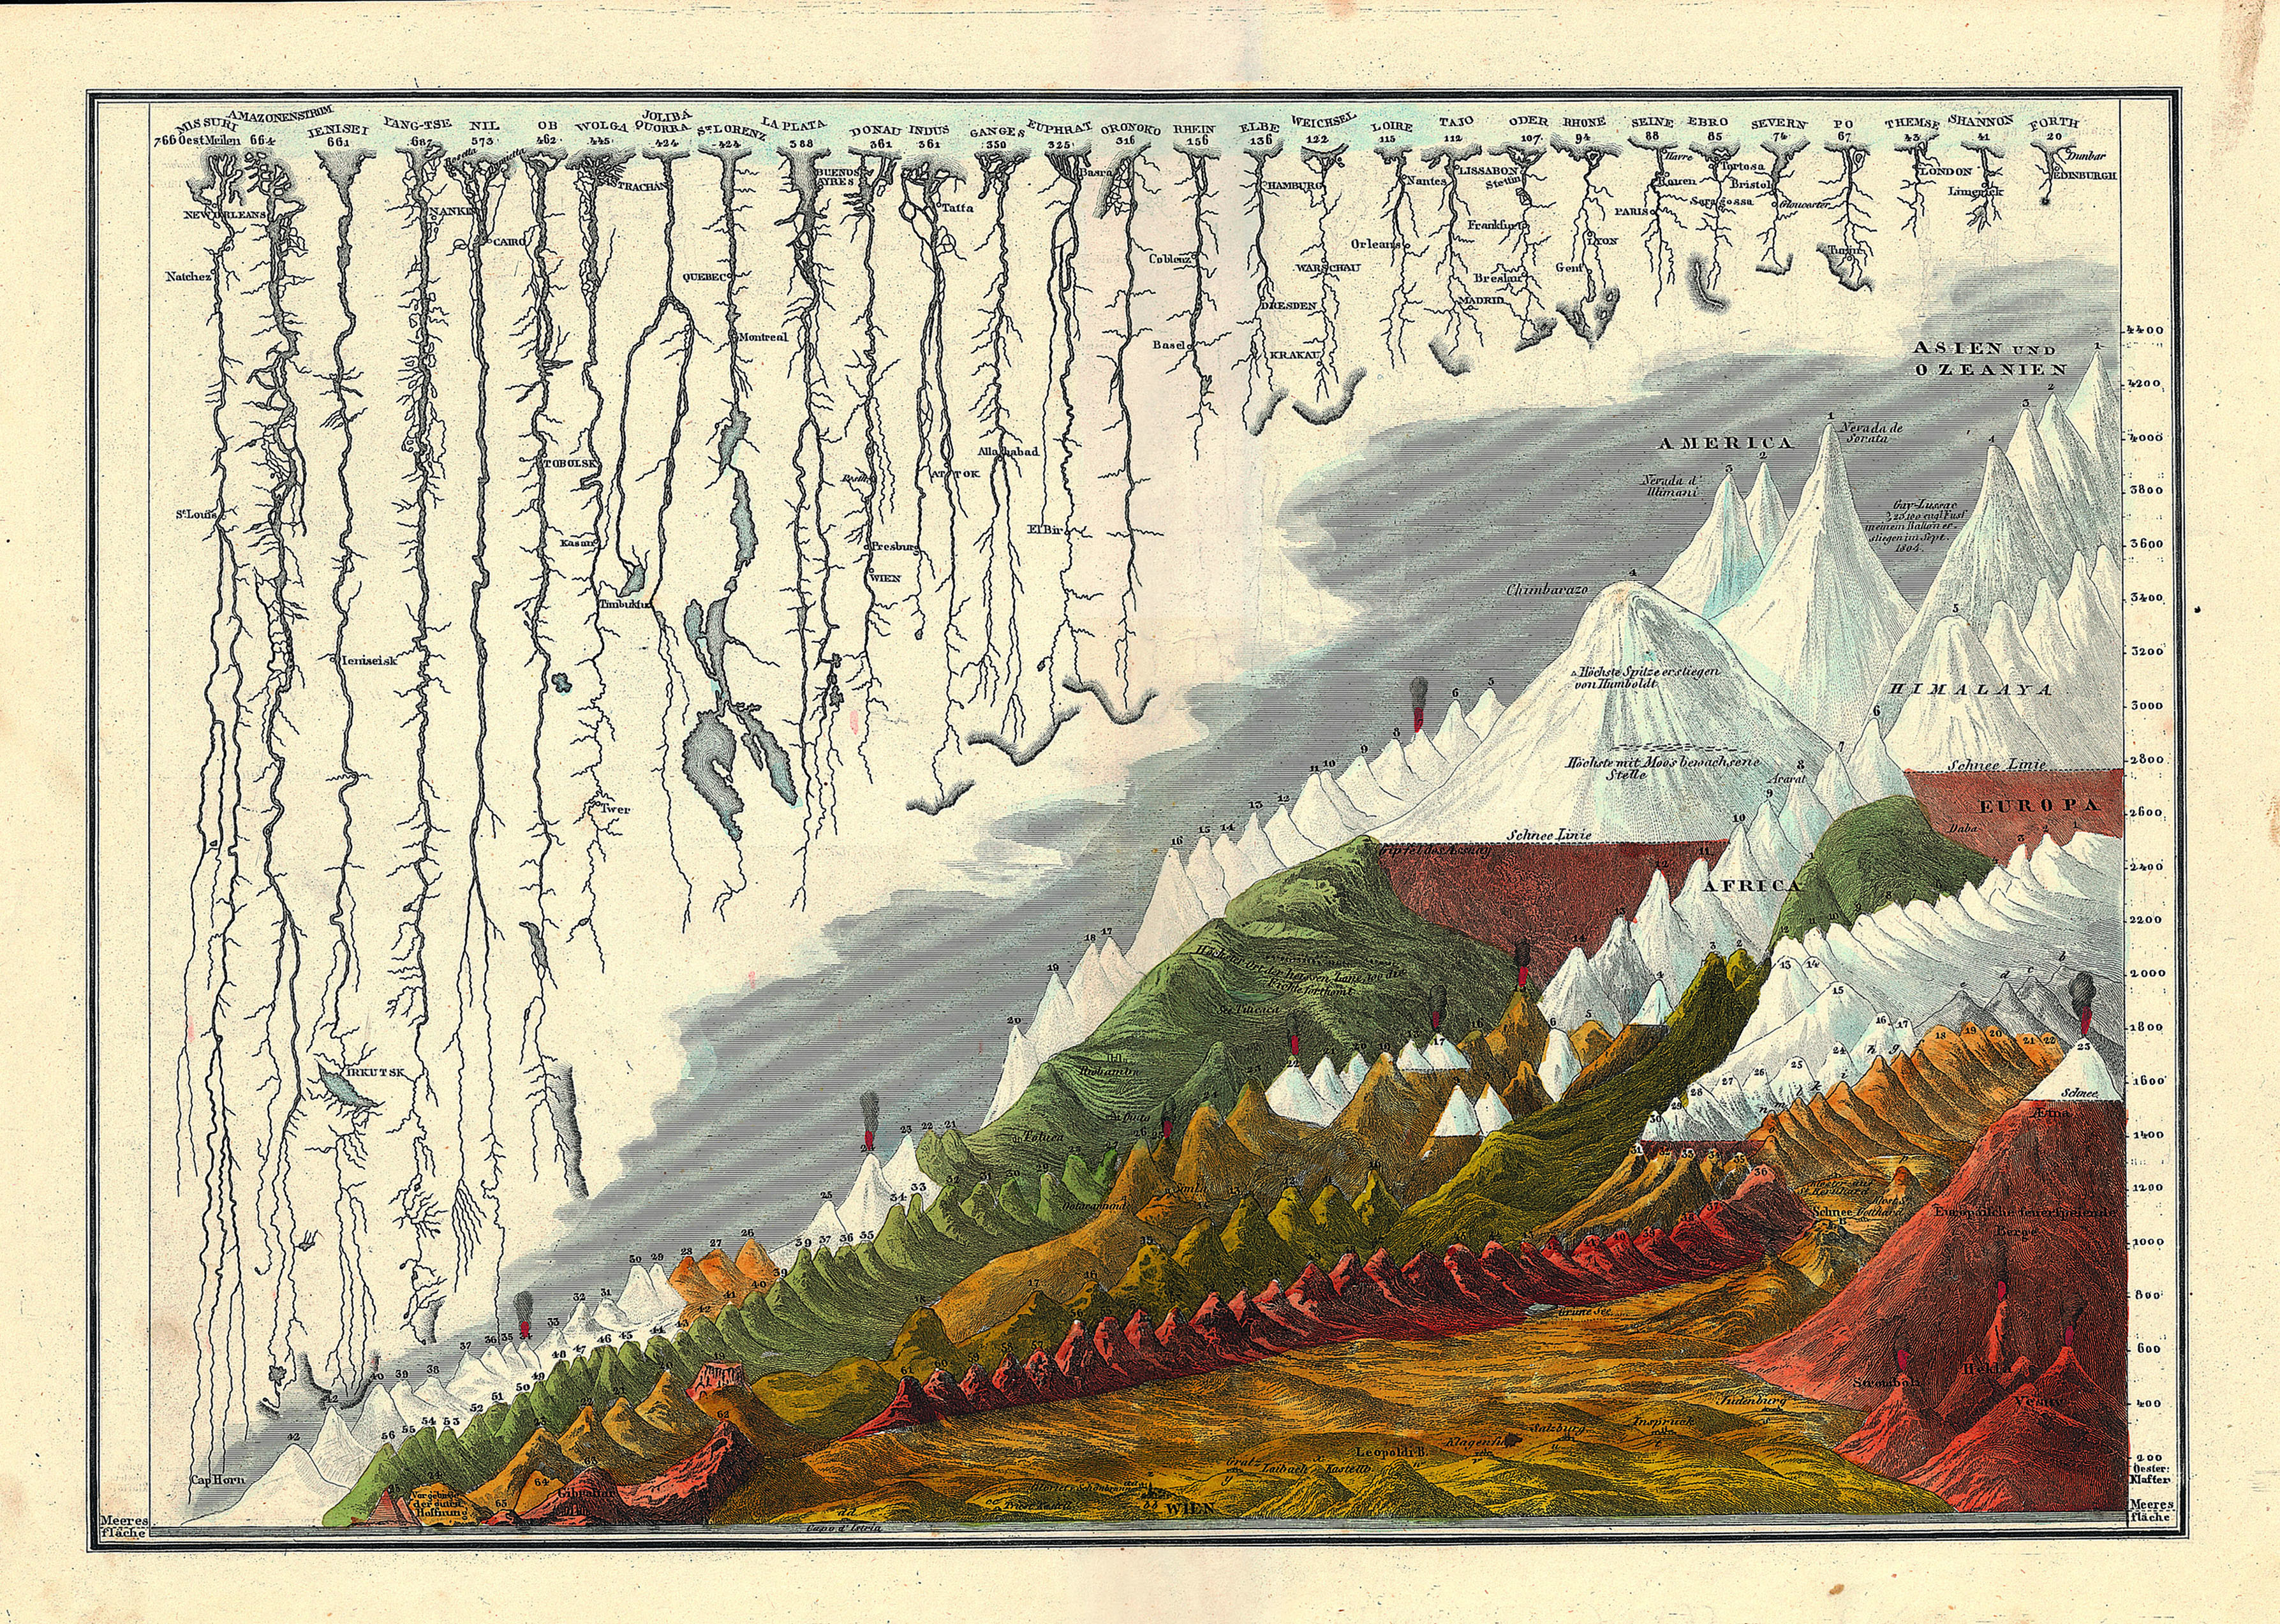
The balloonist Joseph-Louis Gay-Lussac, who set a record for ballooning of 7,016 meters in 1804, flying in his hot air balloon beside the Himalayas, in Andriveau-Goujon’s 1834 Tableaux Comparatif et Figuré (Paris 1834).  The ballooning record was only broken in 1862.

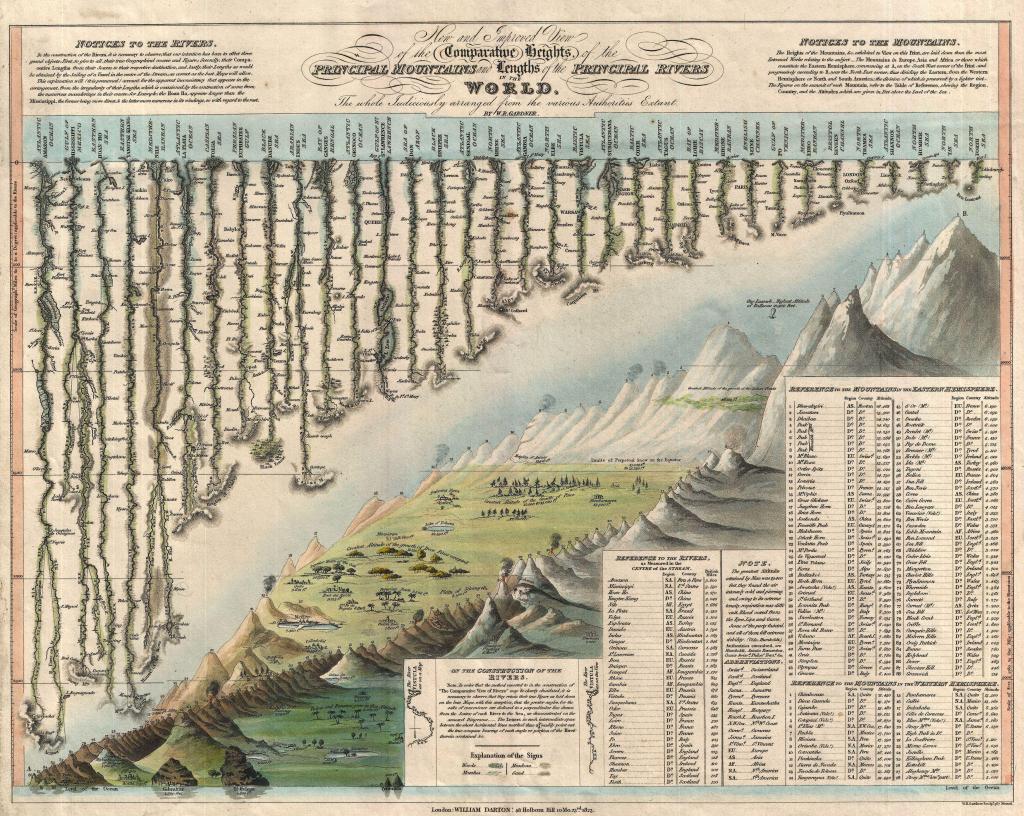
The crisp condensation of an array of multiple mountains and rivers by their magnitudes in a uniform scale and imagined plane represents an image of the coherence of scientific knowledge by its transformation of nature into a single reference tool.   The etched “comparative map” reveals an exquisite conflation of legibility and the cartographic surface: it contains not only a database of Humboldtian proportions, but information about the nature of the world’s tallest mountain ranges, volcanic eruptions, longest rivers, and even some waterfalls in Peru–although not the waterfalls in Yosemite, which were not yet discovered or surveyed, or Andes.  The map, if prosaic, is a register of the first age of globalism, before maps of air-travel or internet bandwidth, but processing and echoing a new taste for global aspirations in a post-Napoleonic era, in the elegance of lithographic form.

Containing, and finding a unique way of dominating the increased expanse of the natural world, the popular comparative chart of rivers, mountains, and waterfalls of the world first printed by Bulla & Fontana in 1828– based on Darton’s far more stodgily titled “New and Improved View of the Comparative Heights of the Principal Mountains and Lengths of the Principal Rivers of the World” (1823)–offers more than an episode of cartographical entertainment. The landscape that it opened for viewers suggested something like a popular panorama, in cartographic detail, a prospective view of global scope the likes of which was on the cutting edge of popular entertainments and sophisticated cosmopolitanism of a global map.

As it was redesigned to accommodate increased information and encompass a greater global purview in its qualitative imagery, the map became something of an assertion of the unboundedness of post-Napoleonic levels of global knowledge, and a celebration of data.  Encyclopedically growing through the complex 1834 chart of Andriveau and Goujon celebrated the addition of new claims of knowledge as a domestication of the natural world by indices of scale, even if it abandoned the orientation of the viewer to their geographic locations or spatial relations in a purely idealized record of the mastery of global proportions–the illusion of a growing global mastery illustrated by the comprehending a proliferation of local qualitative detail in its frame in encyclopedic detail.

bulla and fontana
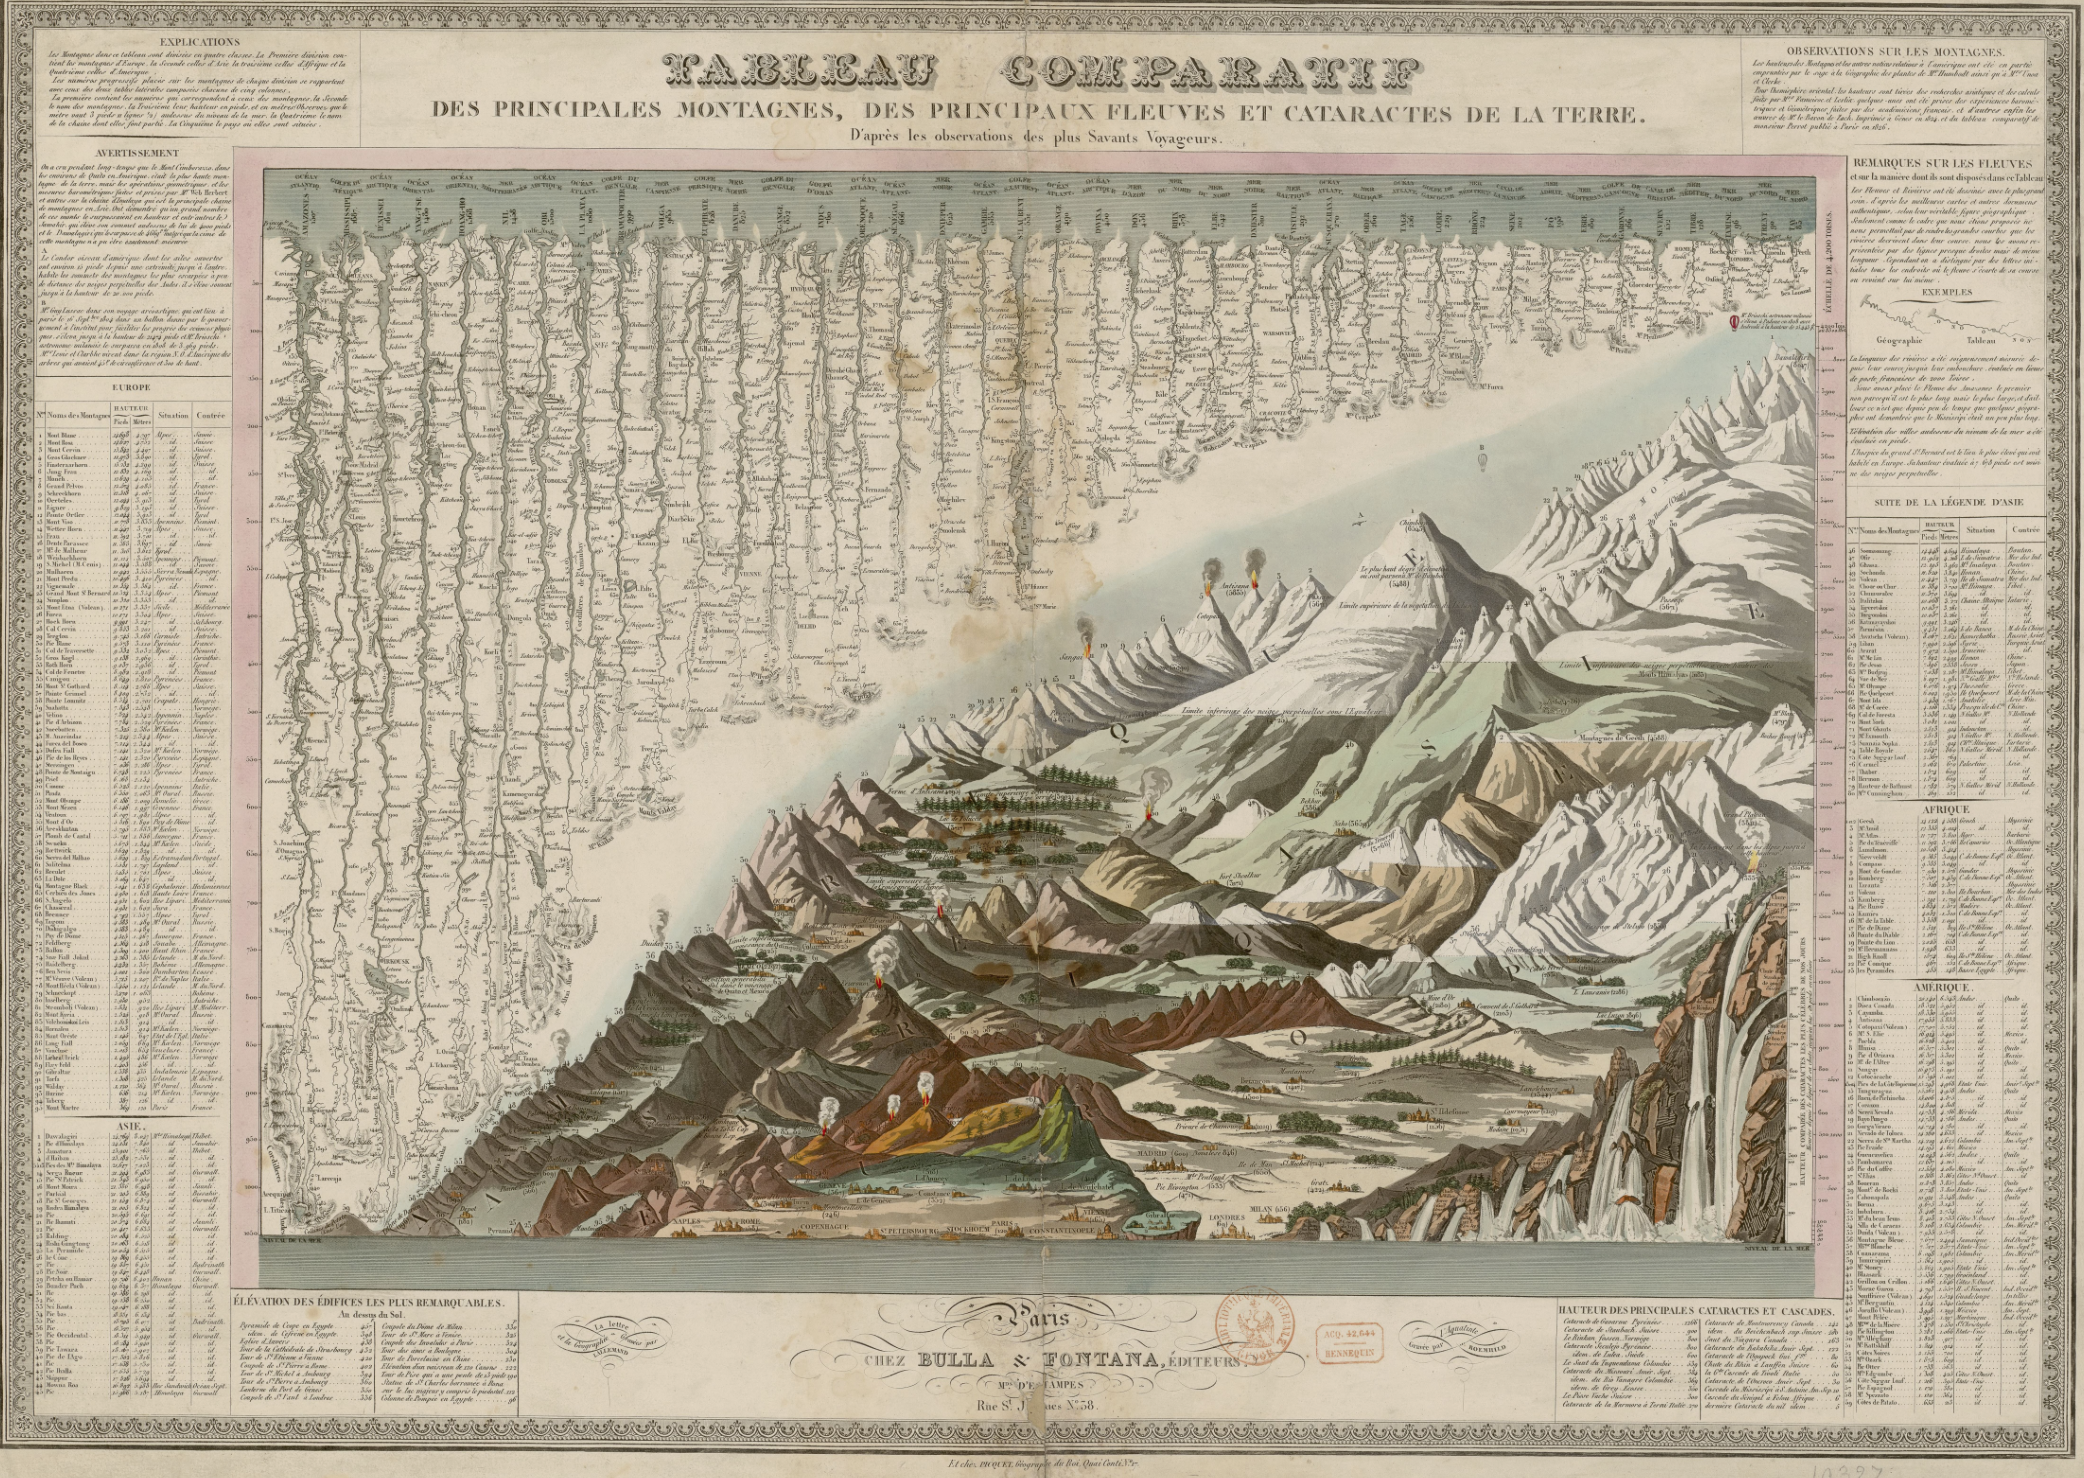
Bulla & Fontana, Tableau Comparatif des principales montagnes, des principaux fleuves, et cataractes de la terre

The vertiginous pleasure of the lithographic map lay in the combination of metric precision and exactitude with utter abstraction from place. The marvels of the world were presented, as it were, in a mental landscape of the geomorphological features of the known world, abstracted from territoriality or national divisions, in a gloriously unified view of the world.

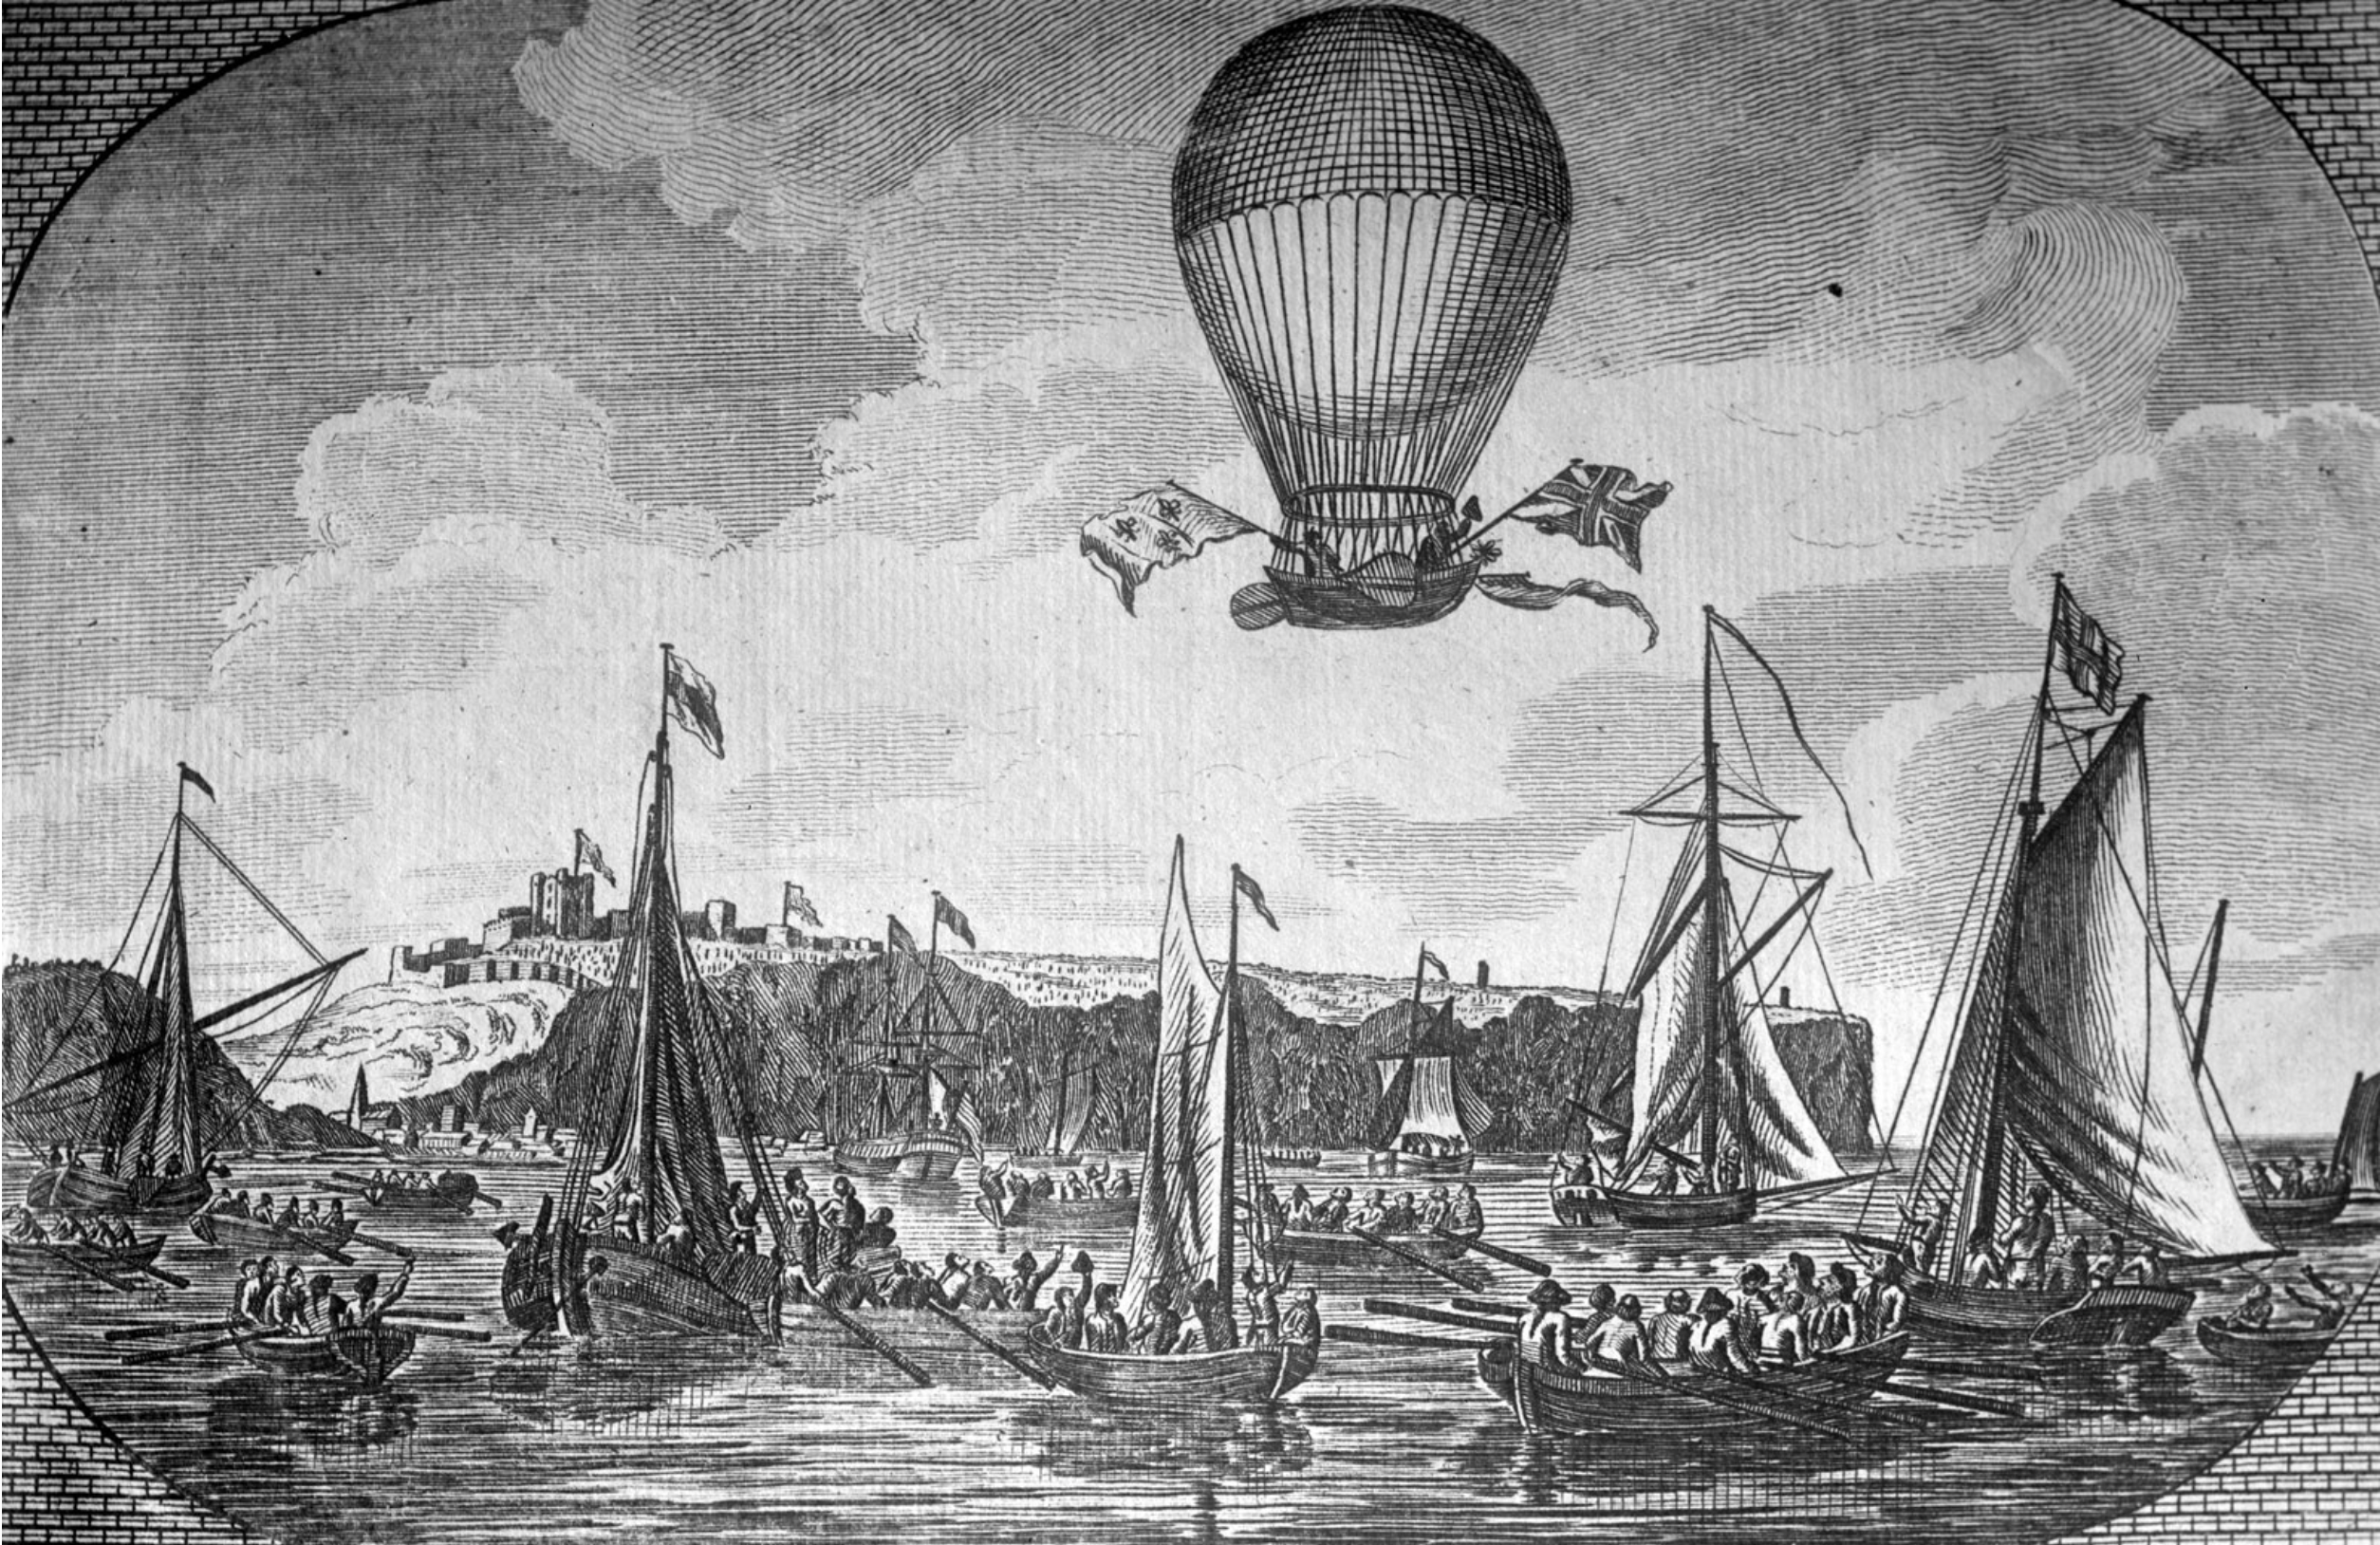
The terribly successful genre of mapmaking essentially offered an elegant compilation of human achievements as well as of the natural world–from the pyramids, to the tallest buildings in cities, and highest ascension made by a voyage in a helium balloon.  Despite its encyclopedic scope and the range of data it processed, the “table” is human-sized, a large wall-map abel to be readily scanned, in order to digest spatial immensity to a scale designed at a human dimension for exploring a virtual record of the natural world that seemed to distill a global atlas to one sheet:  the findings it collated derive from first-hand observations, each concretized in a clearly pictorial fashion so that it can be immediately recognized and understood.  If the aerial triumph of ballooning as a transcendence of the everyday was well-known from the late eighteenth-century aerial flight over the English channel by a French-American team, accomplished in 1785, the celebrated flight of the hot-air balloon was an emblem of the national transcendence offered in the comprehensive map, breaking the bounds of national survey.

1785 British Channel crossed by balloon.png

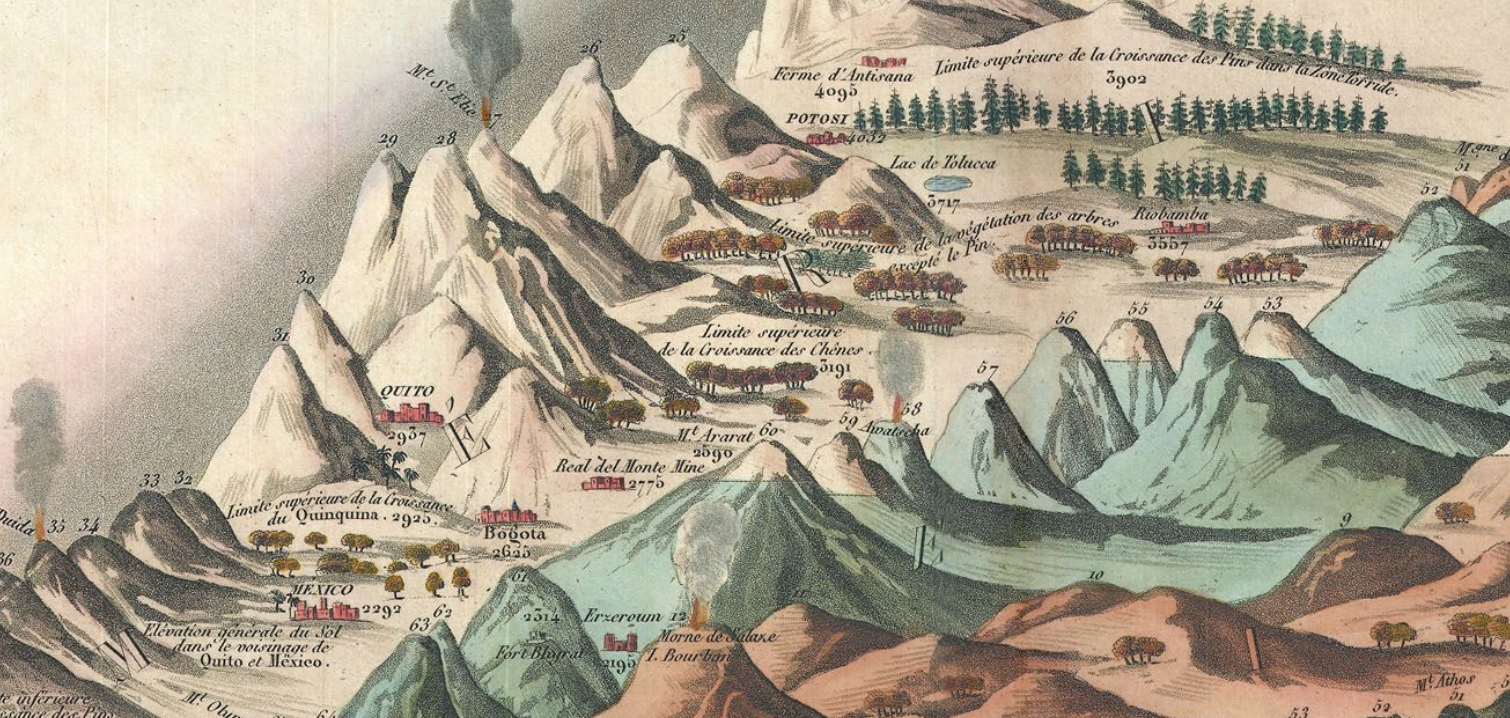
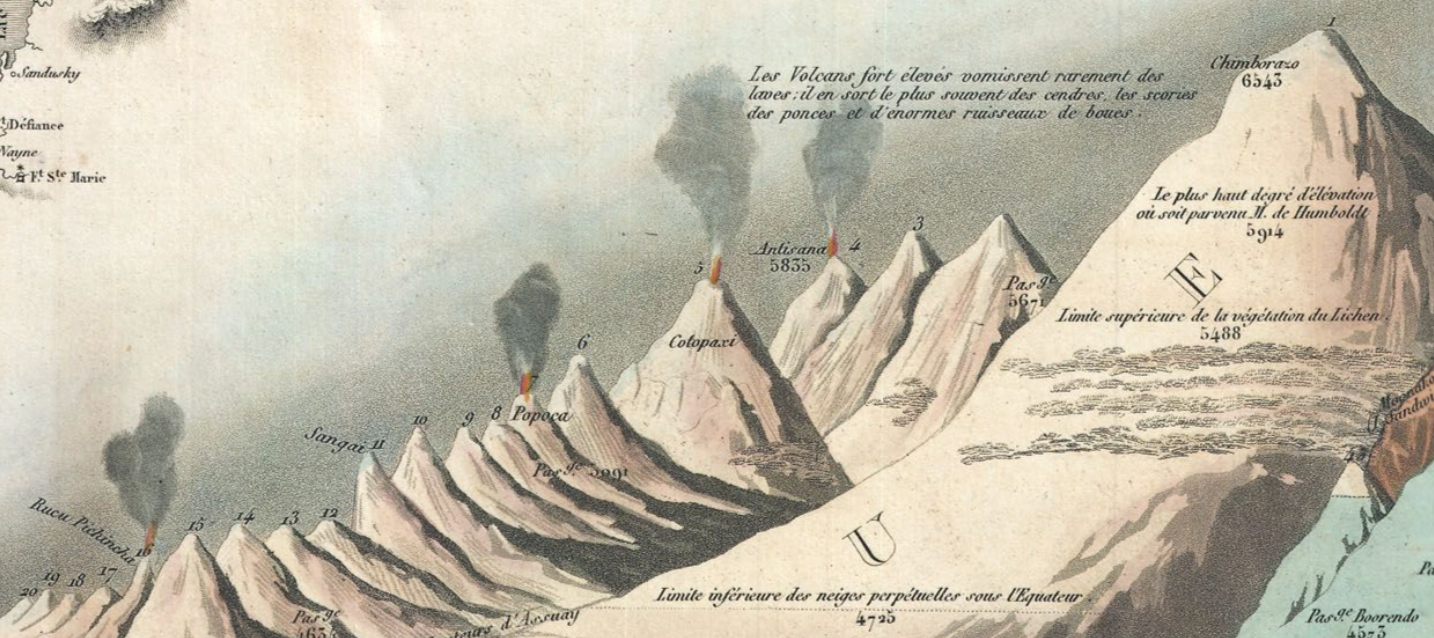
The most striking single detail that dates the map is the place it accords Gay-Lassac’s recent triumphant ascent to 7000 meters in a hot-air balloon of 1808, noted in the sky of the Tableaux, just above the mountain range of the Himalayas.  Perhaps more importantly for readers, the height of the balloon was just above the highest elevation that Humboldt himself had climbed (5914 feet), as well as the highest levels at which vegetative life–for lichen, 5488.  As it rises above this barrier of living vegetation, and beyond the furthest height of the German explorer, the lone balloon is a triumph of the modern world, and an exploration of the unknown that was great as the ascension of peaks or waterfalls.  The balloonist suggests a sort of French victory in the transcendence of previous bounds of knowledge, and a sign of national pride for the Andriveau-Goujon workshop (fl. 1805-94).

Readers of the map could not only recognize the transcendent flight of Gay-Lussac, but could project themselves into a range of comparable adventures.  The map is not in any familiar sense a projection–or a uniform transference of a conformal expanse to fixed bounds.  There’s not even a pretense of uniformity in the map, because the assembled landscape discards usual cartographical operations that ensure continuity, fix orientation, establish directionality, or claim exact measures of adjacency.  All are sacrificed for one criteria of scale–height–that provides a lens by which the cartographer’s fantasia of representing how space can be viewed.

The notion of such a mental transcendence of space-and idealization of the basis of knowledge–was of deeply Humboldtian spin, and rested on his neo-Kantian comparative categorization of the relative height at which he scaled Mt. Chimborazo to place it in the context of the scaling of Mt. Blanc, Vesuvius, and the elevation of Quito. The scaling of mountains provided a sense not only of worldly retreat–as, for example, Petrarch, who ascended Mt. Ventoux for a new look on life and worldly vanity–but of global triumphalism of geographic plates, trumpeting natural knowledge of the Andes as a register of global sophistication by tallying a comprehensive compendium of all terrestrial mountains of in a panoptic survey of heights.

GeographiederPflanzen-humboldt-1806

Unlike Humboldt, however, the atmospheric ascension of the balloonist implies an imagined prospective of an actual landscape, where the pictorial embraces, domesticities, and processes the comparative, and presents a pictorial unity of comprehensive scope–in ways that echoed how the prospect of ballooning was long associated with maps.

The synthesis is truly cartographical because of how it “writes” space against uniform indices to offer a domestication of geographic diversity and variety within the inhabited world–even while abandoning actual inter-relationships.  A fantasy of mapping, stripped of coordinates, enlists the familiar repertory of cartographic conventions of accuracy to offer a compendium of statistical knowledge.  The cartographer abandons the usual cartographical conventions of noting spatial orientation, directionality, or adjacency, as well as cartographical signs, but transfers statistical measurements to a pictorial view in which heights can be viewed in relation to one another.  This popular format of mapping uses our familiarity with mapped space to sacrifice the need to record or establish location to fashion a comparative collation of known topographic variations.  Optimistically, it shows the world as a unity and unified landscape, without divisions of nationality, in a project in which knowledge about the world is curiously disembodied (in numbers) and re-embodied in a single tableaux of global synthesis.

Gilbert’s Modern Atlas (1840)

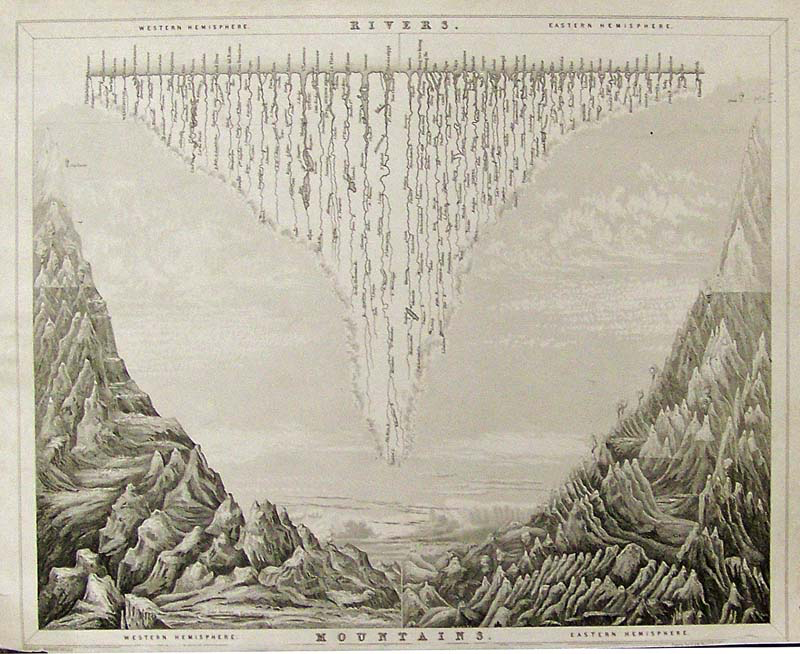
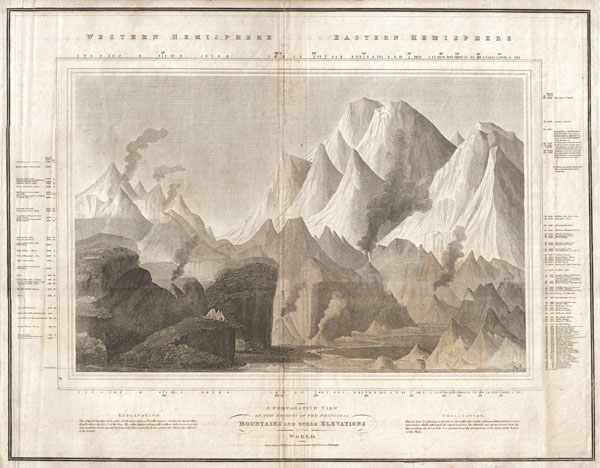
The elegant steel plate from Gilbert’s Modern Atlas, 1840 arranged the world’s rivers and the heights of its mountains by length across an imagined chasm, juxtaposing Western and Eastern Hemisphere, running off from the spine of the bifold plate, even abandoning indices in a prospective view of the globe’s natural splendor that suggest a reduction of natural philosophy to one triumphal prospective view: akin to an unveiling of a natural harmony of revealed knowledge, the cleverly combined plate of Rivers with Mountains is not only an economic illustration of information but encourages an imagination of how rivers descend from the mountain ranges that flank them–including the now-iconic figure of Guy-Lussac’s aerialist feat as a way of entering the tallest heights ascended by man in the upper left and upper right as an index of human achievement before this natural splendor, as if to ask the reader to imagine achieving a view over this imaginary landscape from an awesome prospective, if not the landscape that it might afford.

Although there are no recognizable cartographic indices in the, the Tableaux comparatif reveals a familiarity with the collation of information in mapped space, rising above the range of important cities that formed points of spatial orientation on most maps–including, but by no means limited to, Paris, Rome, London, Geneva, Mexico, Bogota, and Quito, among others, that were noted prominently in the various maps and pocket atlases that its printers also produced, Whereas most maps map itineraries, routes, pathways, or memorable sites of human interaction, the Tableaux is a compendium that draws from different human experiences, correlated with one another in a space that does not exist, but assembled in a single whole.  It is a sort of surrogate for the totality of what we know about the inhabited world and its bounds, and the victory of the diffusion of a form of cartographic writing:  its readers were able to place each of the world’s greatest rivers in their geographic situation,–but now afforded a chance to measure (or rank) the Nile beside the far longer Amazon and Mississippi, in order to decontextualize and historicize the limits of global knowledge, and afford a transcendent view.  

As the ascension of the balloonist occupies a crucial pride of place in the 1834 map, verticality is the implicit theme of the map, which registers heights and lengths, to be sure, but focussed on the collation of knowledge by elevations, including forest lines, barometric readings of the elevations of cities, and heights of mountain ascents to make it a repeated object of visual curiosity that merits intensive scrutiny to local landscape detail.

elevations

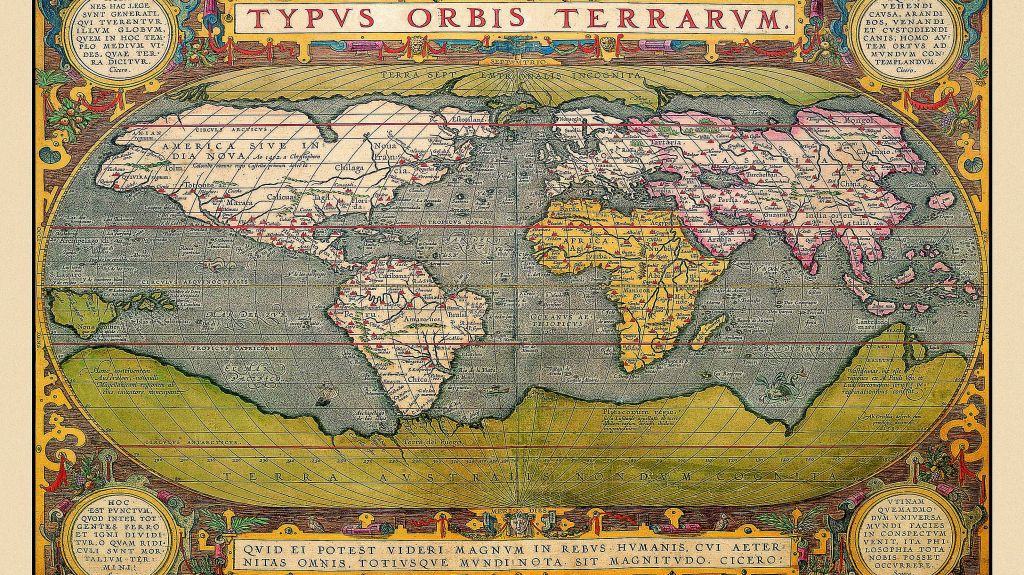
The Tableaux stands as the culmination of known science, and the triumph of the map–and Geography–as a subject able to comprehend the physical sciences.  One might take the map may be a final redaction of the Ortelian ecumene (the inhabited world),  which it processes for the mind’s eye, but takes the idiom of a pictorial landscape to decontextualize the abstracted record of geographical knowledge.  And also to the observer’s eye:  for the data accumulated and synthesized is clearly both “figured” and “represented” to be readily recognized by viewers familiar with maps. The synoptic register of mountains, rivers, waterfalls and rivers that exploited the four-color potential of maps.  The image was based on a map first assembled in Paris during the 1820s, before being widely reprinted in schoolbooks or atlases through the century as a compendium.

Inscribing the landscape with remarks on vegetation and marking the turning points of ports on rivers, which the cartographer has straightened for adequate comparison as if from a laundry line, the picture is a representation of the use of the inhabited world as well as of the limits of its inhabitability, and a condensation of all that needs to be known about the world and all one shall, presumably, ever know.

bulla and fontana
5796000
ComparativeMountains-thomson-1817

The collage-like landscape, if impossible, placed global features for the observer in a way that reflected their own competency and sophistication, boasting its accuracy and transparency in the manner of a geographic map.  

Rather than constitute a new genre, the assembly of the world’s principle mountains had become a sub-genre of geographical knowledge, echoing the French taste for lists, perhaps, and the mastery of geomorphological features in ways ways that suggest an imaginary landscape, and the power of placing the world’s known mountains beneath the viewer’s eyes, as the hemispheric division of principle mountains of note suggested, in this 1825 atlas that abandons territorial bounds, but presents the romantic mountainous landscape as divided between the hemispheres,–with the ancient Egyptian pyramids, topics of huge touristic attraction that were almost included in a French patrimony in the post-Napoleonic period, if by erudition alone, front and center–

Carte des principales montagnes du globe. Hauteur comparative des principales montagnes du globe. Fonderie et Imprimerie de J. Carez. (Paris 1825)
“Montagne du Globe: Hémisphère Occidental/Hémisphere Oriental,” Bossange/Carez 1825

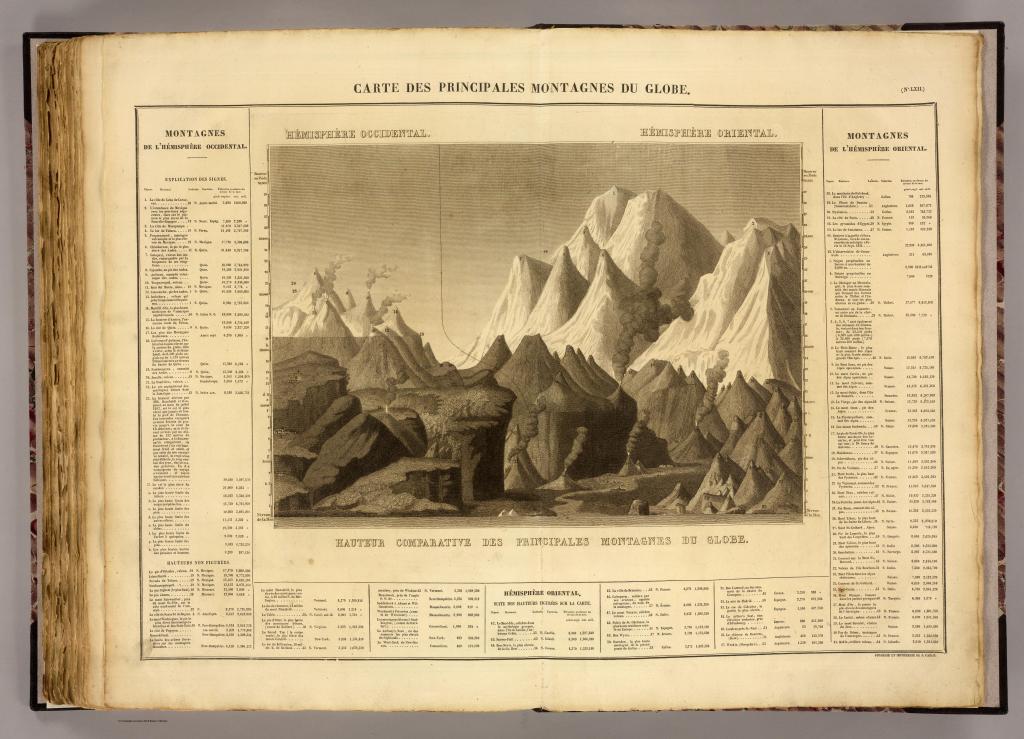
–between both hemispheres, as if in a signature of French erudition. The synthesis of global triumphalism in a pictorial landscape is the triumph, as it were, of pictorials over borders, in a graphic synthesis of volcanic and ice-capped glacial mountains arranged for the viewer in a landscape panorama of sheer verticality, measured on a scale rooted, at its base, by the limits of human achievements–the Egyptian pyramids.

Instead of offering any spatial or directional frame of reference, the Tableaux is strikingly framed by statistical tables that serve as the basis for its ordering of space–an imaginary space, that compiles locations in relation to one another, without correspondence to actual directionality or adjacency.  Adjacency and orientation are sacrificed in the hope of registering human measurements and achievements of measurement, conducted “après les observation des plus savants voyageurs” with the truth-claims familiar from geographic maps, but by expanding its level of synthetic view and the scope and range of its qualitative content o a degree that few earlier geographic maps had ever dared.  By collating these measurements in a truly utopic map, the cartographer transformed these multiple observations into a single scene that viewers could readily survey–in a supremely confident of compendium of collective observations that demand our trust, and promise to enlighten ourselves about the world’s entire form.  The arrangement of these observations in a map allow us to measure distances in ways that were not possible, moreover, in a simple map:  in a map, we see a river, like the Nile, as difficult to measure given its many twists and turns to its source, but all–even the Amazon–are now laid out in their relative lengths for easy measurement.  

This format of mapping, both for its synthetic scope and pedagogic utility, was extremely popular. Indeed, the genre was so popular as a synthetic view of space that it was widely imitated–if without the detail of the French balloonist.  An undated German reprinting grouped ranges of mountains not only by size, but actual geographic location in continents, as if the map was somehow an image of the members of different continental families–elevation of mountain ranges trumping coextensiveness of global expanse:

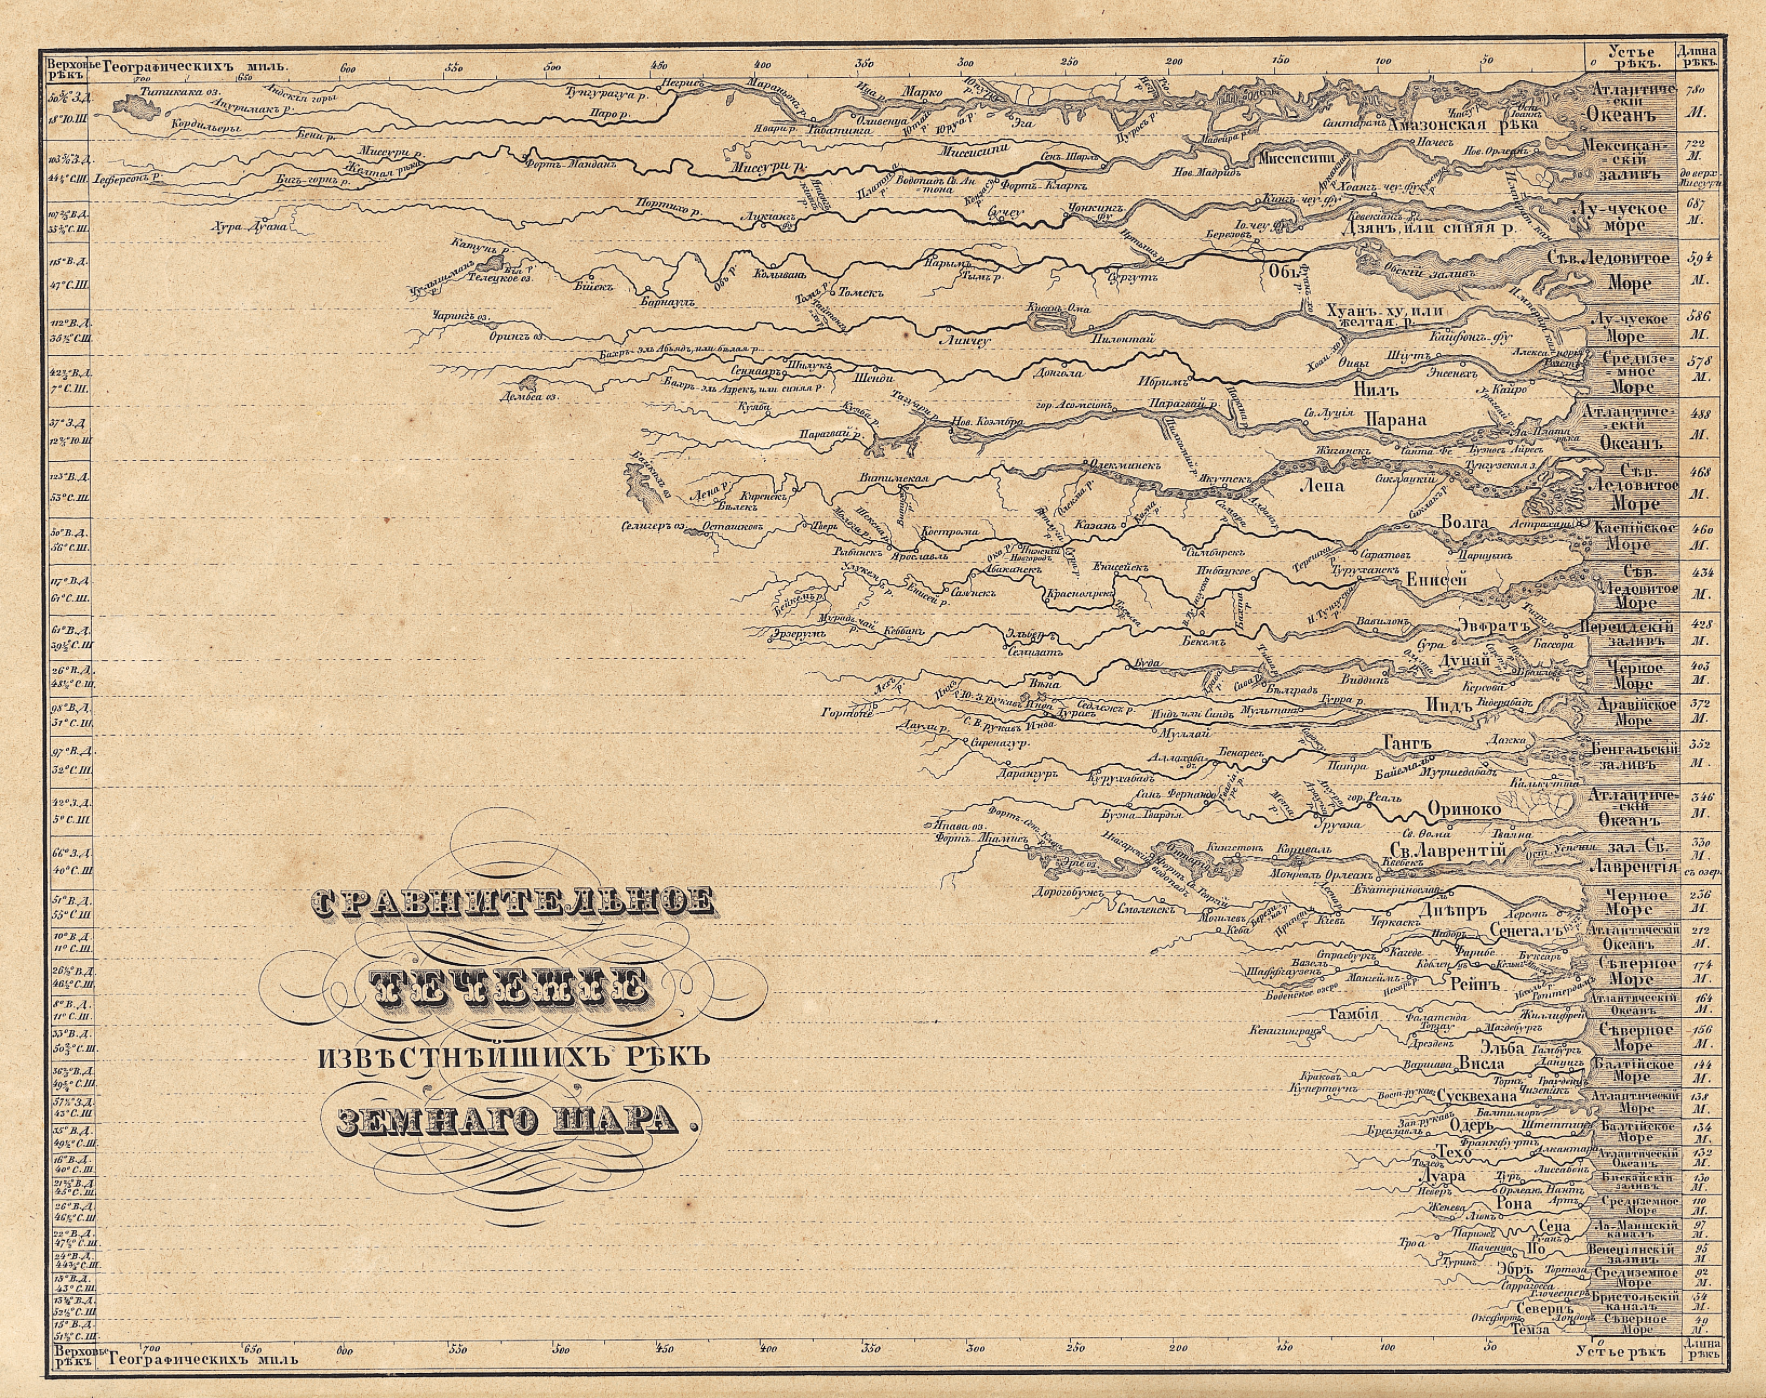
The imagined landscape of global topography, newly indexed for ready consultation, imagined the landscape as a library catalogue.  A contemporary Russian chart comparing rivers expanded on the genre in its own manner, displaying rivers as if their estuaries lined up to open to a contiguous body of water, to facilitate their comparison:

Russian Rivers

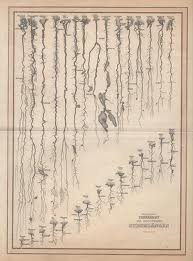
More often, this variety of map disembodied rivers or topographic markers from its surrounding landscape, oddly tracing the outlines of aqueous bodies alone:

images

All exemplify a recognized cartographical imaginary; the geographical compendia became popular tools to synthesize information for schoolchildren at their fingertips. The abstraction of the Ortelian globalism that reconciled topography with political bounds was dismissed, with a French wave of the hand, in a sort of cartographical magic trick that reduced space to a flat surface of the engraving, and hierarchalized rivers by size.

Abraham Ortelius, Typus Orbis Terrarum

To be sure, John Thompson’s earlier undated “Comparative View of the Heights of the Principal Mountains and other Elevations in the World,” dated to 1817, presented a composite prospect of mountain tops from different hemispheres, in something of a cartographic collage that took advantage of the aesthetics of landscape to abandon the principles of coherence or spatial proximity that paramount in most geographical maps.  Thompson, a Scottish cartographer, united the relative heights of the mountain tops of the eastern and western hemispheres, comparing the presence of buildings, cities, vegetation limits, and even fauna in an aestheticization of empirical observations that bridged Ecuador’s Mount Chimborazo, beside which flies an Andean Condor at an altitude of 21,000 feet, and figured Alexander von Humboldt himself scaling the peak, as well as Lake Toluca, Quito, Caracas, and Mexico City, in the same frame as Nepal’s Dhaulagiri, 27,677 feet–promising a global prospect if without either the Chilean peaks or Himalayas. 

ComparativeMountains-thomson-1817

If the map of mountains echoes Humboldt’s maps of mountains, Thompson had issued the first comparative atlas of rivers–“A Comparative View of the Lengths of the Principal Rivers of Scotland” which had a purely choreographic intent, in 1822, in one of the first comparative river chart of the century, just after his inclusion of the comparative chart showing the height of global mountains for the 1817 edition of his “New General Atlas” (Edinburgh), which built on Humboldt’s 1805 work–and also acknowledged that dependence by including Humboldt in his map, scaling Mt. Chimborazo.  The map of Scotland’s rivers offered an even more pictorial rendition of the many rivers that watered Scotland’s heaths–and is striking for representing the same sort of Kantian transcendence that inspired Humboldt’s own work.

Comparative Veiw oft he Lengths of the Principle Rivers of Schotland

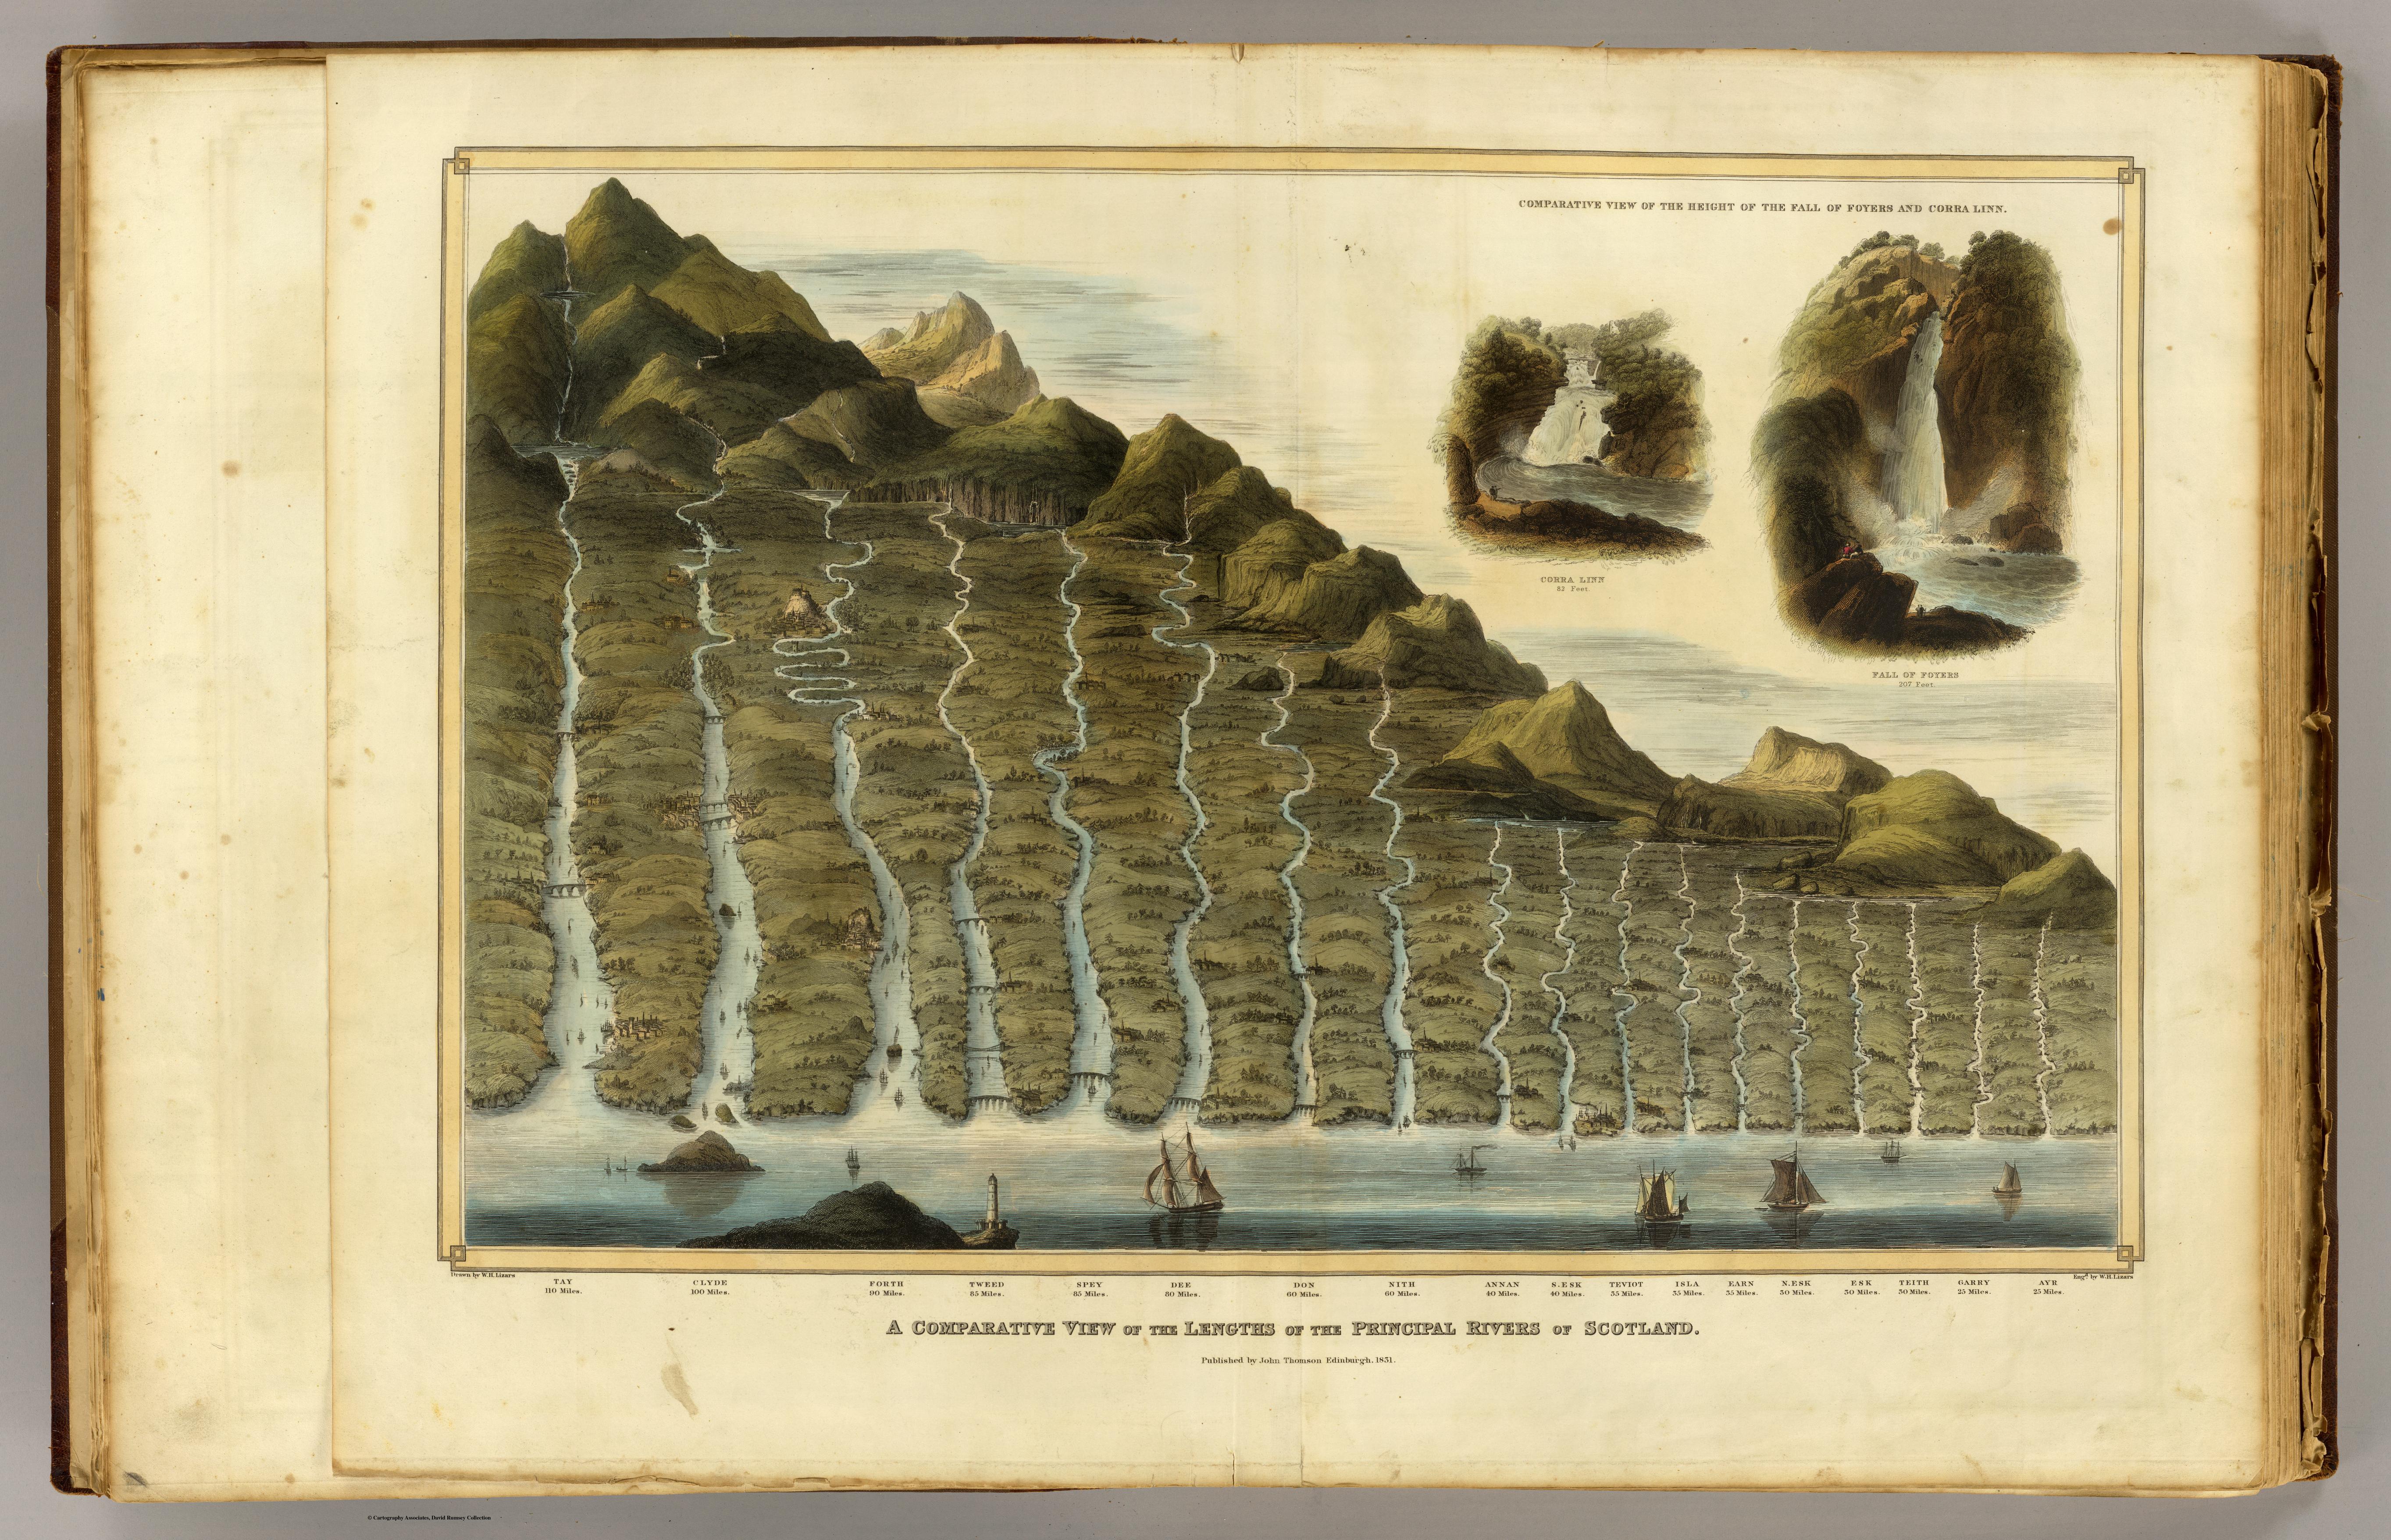
“Comparative View of the Lengths of the Principal Rivers of Scotland” (1822) (Courtesy Rumsey Associates)

But the esthetic appeal of the composite map’s original designers and cartographers, Bulla and Fontana, had designed it in the 1820s as a landscape for viewers to enter and explore in ways that Thompson did not fully exploit, so careful was he to preserve and synthesize the newly arrived data of naturalists.  The slightly later Bulla and Fontana Tableaux comparatif retains the four-color format of printed maps; the original Bulla and Fontana from 1826 was exquisitely hand-colored in a range of manners that spectacularly heighten its coherence as a landscape that is inviting to the eye:  the warmth of these hand-painted colors is hard to ignore, and contributed to how the map was cast as a landscape picture.

The set of impressive rivers that emerge from the upper edge of the Tableaux extend, for example, from a grassy region near their mouths, the waterfalls are thunderously crashing with white spray, the snowy peaks with their blueish hues imposingly weigh heavily upon the stoney landscape beneath them:  the mountain ranges indeed fill up the yellow frame of measured indices, which serves as a pictorial frame for the scene, unlike the neo-classical border that frames a band of white in the later Tableaux.   In Bulla and Fontana’s map, the icy light-green valley underneath the mountain ranges invites eyes,and suggests a reserve of ice from which one can believe the set of lengthening waterfalls contain the freezing cold run-off of icy plateaux.  It seems that this wonderful post-Enlightenment map not only synthesizes measurements, but presented to the post-Napoleonic Europe the harmony of a state of total geographic knowledge as another green world, in true Renaissance fashion, in a sort of bucolic land that was both richly irrigated, filled with waters indicated by the synecdoche of waterfalls,and ready to be cultivated by man, even as Europe had been dissolved by wars and the migrations of soldiers and military campaigns planned in military maps.

Comparatif, 1836.png

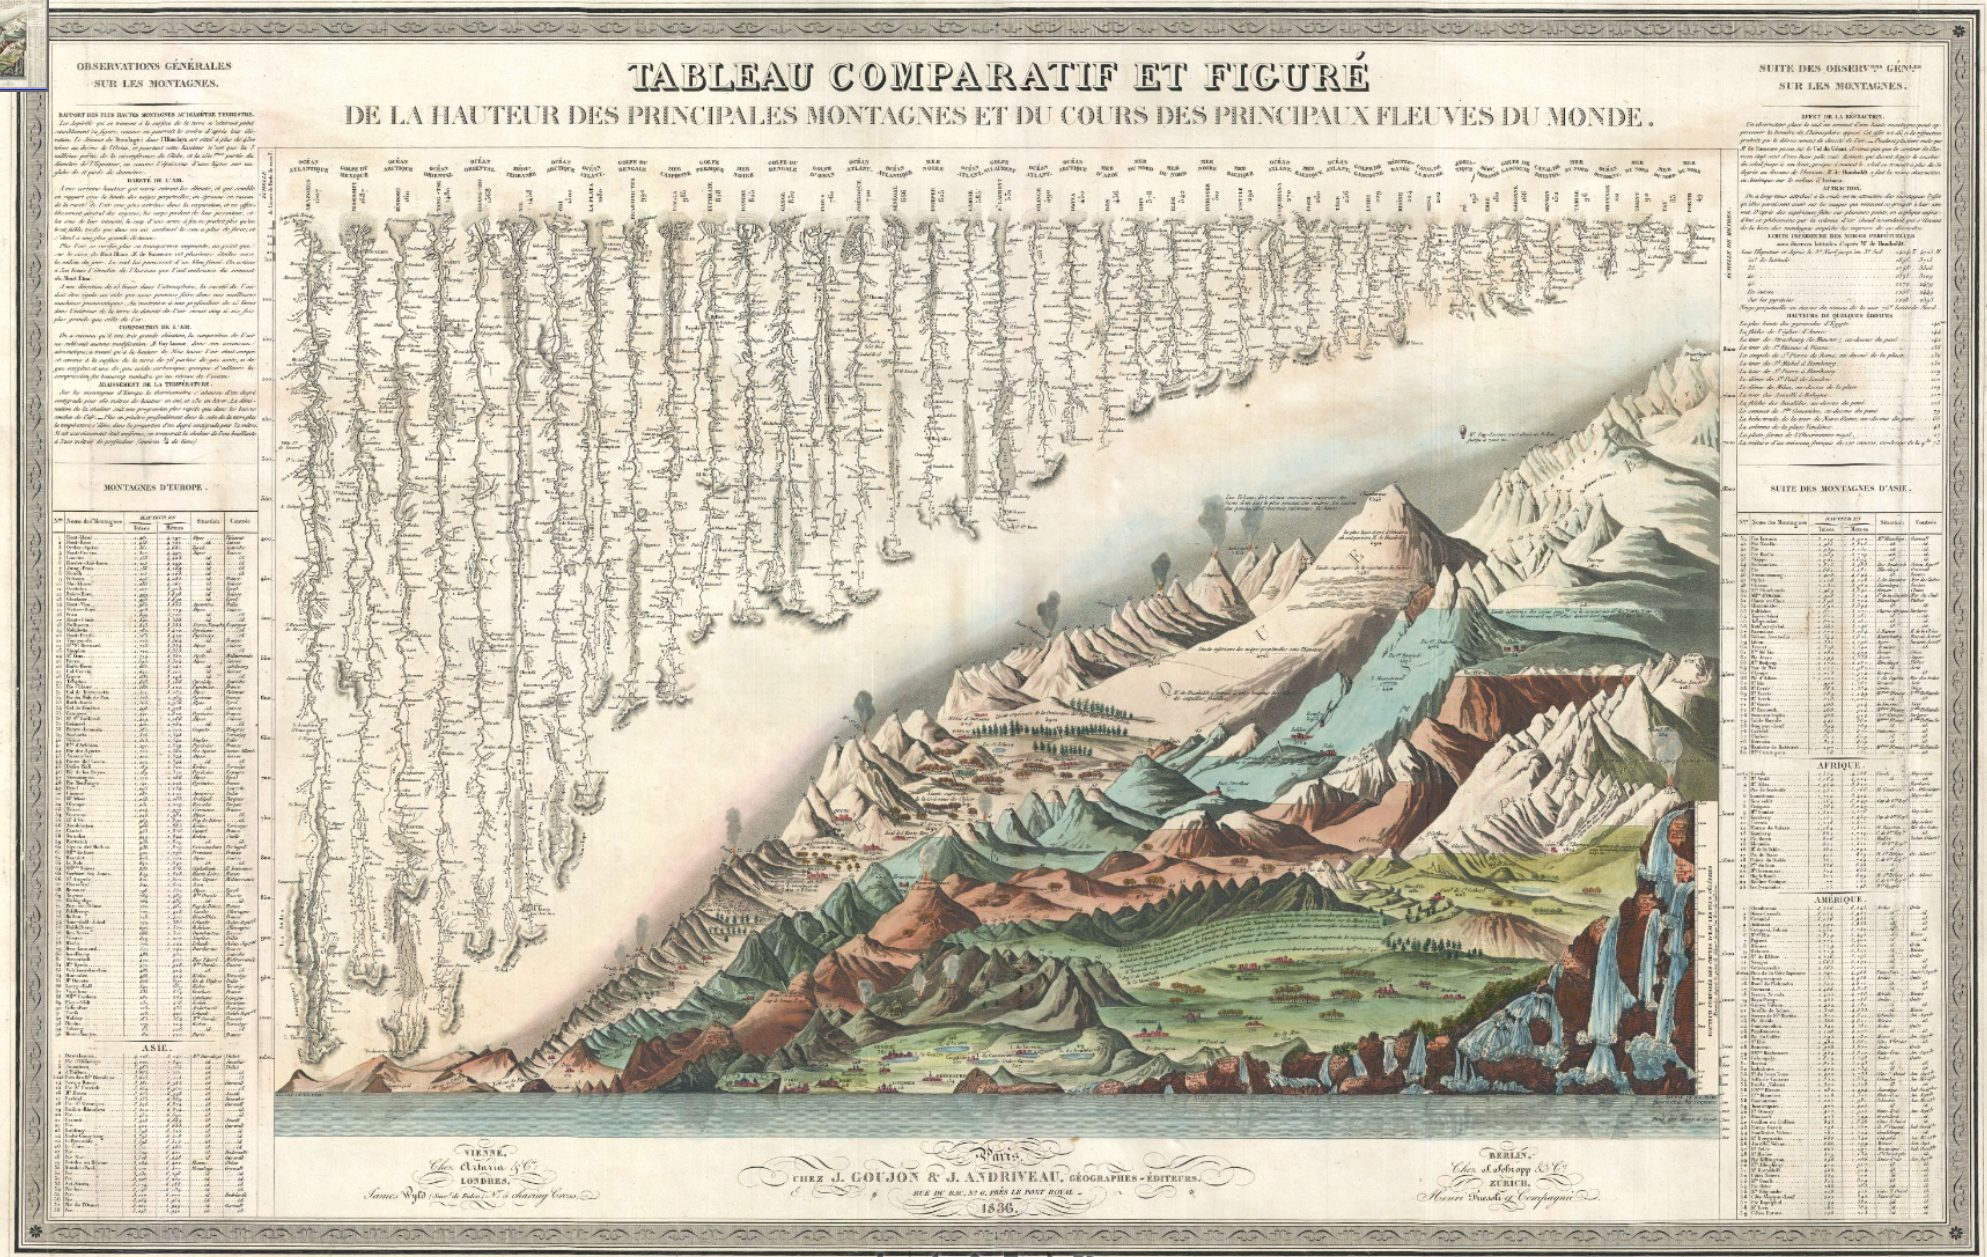
Goujon and Andriveau, Tableau Comparatif et Figure de la Hauteur des Principales Montagnes et du Cours des Principaux Fleuves du Monde (1836)

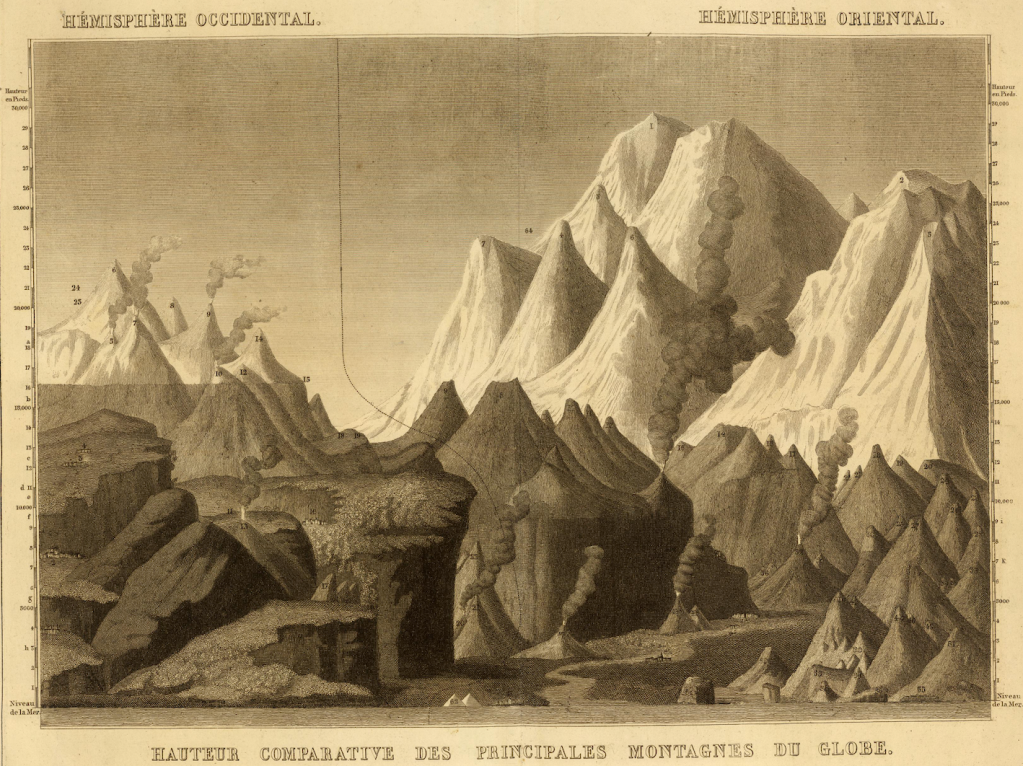
The 1836 expansion of the comparative chart of mountains, rivers, and waterfalls engraved was produced by the prolific cartographic partnership Goujon and Andriveau, and proved particularly popular–meeting a clear demand for the investigation of natural spectacles such as volcanos, whose synchronized explosions are rendered on the visual center of the map that claims one’s visual attention in almost all of its parts, echoing the memory of the global influence of the eruption of Mount Tambora during the Napoleonic Wars, perhaps illustrating a sense of the climatological inter-relations even in a map that abandoned the rendering of accurate geographical relations:  volcanoes almost provided an acknowledgment, almost, of knowledge of the ecological complexity, after actual inter-relations had been abandoned in the name of the economy of map-engraving.

Volcanos

Both include the easily overlooked detail of the balloonist who surveys the landscape. The balloonist seems to be something of the hero of this scene, who has not only entered into the picture but, in one’s imagination, is able to survey the entire expanse that lies below.  His view would be what would look more like a map, even though what we see reflects the range of geographic knowledge that we can collate through our own unsurpassed cartographical abilities.

Leave a comment

Filed under air travel, fluvial maps, mapping nature, natural history, pictorial maps

Alberto Uderzo’s Maps

“All Gaul Was Divided into Three Parts . . . “

The cynicism of the Republican party’s attempt to redraw the electoral map of the United States certainly withdraws from reality:  when you’ve lost a big election, just take a few steps back, breathe deeply . . . and re-write the map.  It’s hard to take seriously the attempt–as if gerrymandering wasn’t recent history.  If votes didn’t materialize the first time, just change the rules of the game:  these are only conventions; why not protect the economic homogeneity of the electoral district to get more votes?  We’ve recently obsessed as a nation with questions of boundaries and drawing firm lines in maps, a pursuit which hasn’t got us that far in international affairs, or anywhere worth being.

If drawing boundary lines in the sand or in Ohio are powerful exercises in power, my favorite case of delineating boundaries for readers is from the popular comic, drawn by Uderzo from 1959, each issue of which began from the stark boundaries of an imagined ancient world:  even without consulting Ferdinand Lot’s Les invasions Germaniques:  La pénétration mutuelle du monde barbare et du monde Romain (1945), the identity of Gaul/France was the recurrent theme of Goscinny and Uderzo’s rendering of the adventures of the blond Gaul Asterix and his band of fellow-villagers as they continue to resist Roman invaders to their lands.  Indeed, the Gaulist conceit of the cartoon series plays with the idea of national and linguistic diversity in the ancient Roman world, imagining a past of fixed territories, clear borders, and national aggression that mirrors our own, or mirrored what would be a clearly defined region of Gaul–as if by a modern boundary line–from which a magic potion allows them to undertake the against-all-odds deviance of one city, not yet fallen to the Roman troops, and to preserve their identity even if they are within the Roman empire.


Fearful Gauls.png

The potent image of Gallic resistance that the comic strip has inspired has spawned theme-parks, stuffed animals, live-action films, and legions–sorry–of admirers, as well as probably having directed the imaginations of more kids to antiquity than any other media.  (So powerful were the connotations of resistance that when Uderzo’s daughter wrote a column for Le Monde in 2009, protesting the sale of the series to the French publisher Hachette Livre, she wrote that it was “as if the gates of the Gaulish village had been thrown open to the Roman Empire,” to give voice to fears that the resourceful cartoon characters discovered in 1959 would be exploited by marketing, as if they would be Disneyfied–a fear Uderzo himself counter-charged was only motivate by greed.


Uderzo’s now-iconic “Map of Gaul” introduces every one of Asterix’s adventures.  But the map becomes a them of a relatively early book in the multi-volume collections that is un-coincidentally entitled Asterix and the Goths.  On the comic book’s cover, the imaginary boundary line that bound Gaul/France was concretized for readers of the strip, as the boundary line between became the stage for action:  Uderzo marked a dashed line (familiar from road maps or national atlases) on the ground, to essentialize differences between France and Germany, if not intentionally to mask how the historical determination was actually more fluid than Uderzo rendered the boundary line between Gaul and Germania for readers, but which the wily Francs were about to invade, even if that meant leaving the flagstones that Roman conquerors had used to pave roads in Gaul.


9780752872636-1

Border of Germania.png

Border to Germania


Historical accuracy or verisimilitude wasn’t exactly the point for the authors or readers of Asterix.  But celebrating a mythistory very much was:  much as our hero stands for the defense of Gaul against the invading Roman Empire, the looming shadows of the helmeted Goths in this image echo the Bismarck-style helmet that date from World War I, and cause our hero to turn his attention from the Roman legions that Obelix stands posed to clobber, reaching for the sword to face a new enemy.  After all, the colors of the map are evident in the land that he defends:  Gaul is green; Germania yellow.  The border marking is clear, and the border sign notes the different fonts used in each land just as the Germans speak in Gothic letters in the speech bubbles in this comic book.

Demarcating regional boundaries was of course not so much a reality for the ancient world, or migratory Goths, as they are in historical reconstructions.  But the comic essentialized France by the gallantry and derring-do of its Gallic ancestors–as the counter-weight and barbaric other of the Goths to the east.  In each adventure, Gallic wiles defied the formal boundaries displayed in the frontispiece in Uderzo’s map of Gaul’s division into three parts in they year 50 BC, where all of Gual is indeed divided, . . . save one town that holds out to the north in Caesar’s time . . .


Gaul 50 BC.png

The regional divisions of Gaul are pseudo-scholarly, if not antiquarian, and the joke of the towns that are revealed, surrounded by Roman camps, by the magnifying glass, is matched nicely by the cracks of the earth caused by the cracks in the Gallic landscape, as if by an earthquake, caused by the aggressive planting of the Roman standard in the south of France, casting more than a shadow over the region’s fertile plains.

There was a something of a tradition of an imagined creation of boundary-lines in Renaissance editions of Caesar’s Commentaries on the Gallic Wars, to be sure, that is echoed in Uderzo’s clever cartographical cartoon.  The insertion of such boundary lines into the landscape is  reflected the increased national segregation of regions in Renaissance maps and national atlases.  They paralleled, to be sure, the fantasy among Germans that the region Tacitus described to the Romans in his Germania revealed the antiquity of the Germanic people.  National maps were popular in France from regional maps from 1550, or the national atlases of Bougereau and others, and commissioned by the monarchy–even if they were far less colorful than Uderzo’s cartoons.


IG6515-2


The notion of the invasions of Goths in a later date was rendered as a cartographical violation of French territory in the great medieval philologist and demographer Ferdinand Lot’s 1935 Les invasions germaniques, an erudite study republished in two years as Les invasions barbares, a work whose cover oriented the work around its central subject–France, in the guise of Francs–despite Lot’s positivistic evaluation of historical evidence.


Lot.png


A subsequent edition of the map was noticeably far more reticent:


invasions_barbares_L25.jpg

But let’s go back to the comic books.  Uderzo’s boundary line in the two-color Asterix map is an actual sequence of dashes, thick dashes, beside a marker which seems to have been drawn in the Gaulish/Roman side–Gaul is predominantly indicated in the sign, and, betraying the question of who wrote/drew it, the presence of Gaul in the Roman Empire is noted as something of a parenthetical afterthought. This is a boundary line for twentieth-century observers of the map, in ways unavoidable when the first comic was printed in 1959:  Asterix is a national hero who brilliantly and craftily defended, after all, occupied Gaul with ingenuity and help from a magic potion. The region’s bounding is totally unlike the tribal distributions that characterized Europe’s peninsula:


Unknown


And so it’s not a surprise that maps are always coyly present as a conceit in Asterix, as well as national identities that the Gallic hero visits with or without his local bard, including not only Spain, England, and Rome itself, but even America.  This fantasy of mapping was part of the fun, as well as part of the creative anachronism.  Why were maps such a recurrent part of the comic, save as guides to narrate the Gaul’s worldly adventures?

Asterix was only something of a semi-serious hero who defended the cultural boundaries of occupied Gaul.  But the defense of occupied Gaul was of course a powerful motif in the twentieth century, and the recurrence of maps in the entire series–from the brilliant  frontispiece that begins each book, and is included below, by way of summation–repeatedly employed maps as the perfect stage for Gallic ingenuity and wit.  The man from Gaul had a certain international fame recognized on the covers of later volumes:


images-1


Well, that combines a map and aerial view, but seems straight out of a classroom map, if not a Michelin touring guide.  But Asterix and Obelix encountered plenty of signs like that of Paris carefully marked on their travels and itineraries across the ancient landscape that looked suspiciously modern in the iconography of their design:


250px-Asterixcover-the_golden-sickle


But the line between Gaul and Germania, or the land of the Goths, is the on-the-ground view of the clear demarcation that existed in the minds of all the Gauls at that time, runs the conceit of the comic book, or, er . . . all except in one town.


images-2

Such is the beauty of maps, and their power as iconic images.  It’s not surprising that such resistance was shown when  Uderzo, who had worked so lovingly and hard to create these characters got slammed in the national press in 2009 by his own daughter for planning to sell the franchise after his own death as betraying a national hero to “the modern-day Romans–the men of finance and industry.”  Uderzo eventually appointed his own assistants to continue Asterix’s adventures.

Unknown-1

Leave a comment

Filed under Asterix, boundaries, Gaul, historical atlas, Roman Empire

Map-Inspired Madness: Mapping the Great White in the Solitude of Ahab's Cabin

The terrifying search for the whale Moby Dick runs almost vertiginously off the known map.  The absence of bearings are particularly apparent in an era of increased map-printing and the growing claims of map authorship, often insecure of the origins or coherence of their captain’s narrative design.  The quest for the elusive Great White takes readers literally off the map, as The Pequod leads readers off of the map, in frequently disorienting ways; the apparently unreliable narrative carries readers on a quest for Moby-Dick into unknown areas less mapped as the almost  primal site of whale spawning, unknown to most, where the craft, itself adorned with whale bones—“tricking herself forth in the bones of her natural enemies,” bulwarks adorned with sperm whale teeth, rudder made from a whale jaw bone, seems to seek to arrive by human artifice, as if to persuade the whale to reveal itself by charms–or be all too similarly cannibalized by its craft. 

As the voyage progresses across the seas, Ahab descends to madness as he falls into maps in his desire for stability and power.  The book is an epic of consciousness, of Shakespearean scale, and a study in a landscape of psychic interiority.   As if conjuring the character of Ahab, on the final flyleaf of a volume of Shakespeare’s works, Melville echoed the words that Captain Ahab deleriously howls as he mock-sanctifies the harpoon he feels destined to kill Moby Dick.  The devlish incantation sums up his monomaniacal absorption, inverting the sacred ritual of baptism of a Christian soul, “Ego non baptizo te in nomine Patris et/Filii et Spiritus Sancti–sed in nomine/Diaboli”–after which Melville added:  “madness is undefinable” in its hubristic drive for “converse with the Intelligence, Power, the Angel.”   If Melville was raised in the austere Calvinist, learning the catechism in the Dutch Reform Church, taught to  “acquiesce in God’s will, no matter how unjust or cruel it might seem,” without recrimination for the divine plan, Ahab’s attempt to conjure the Great White whale moves not by summoning angels or demons but by conjuring his location on maps, as if to trying to conjure the whale by imprecations, charms and talismans.  The charms, we learn in Chapter 100, begin first and foremost in his obsessive reading of nautical charts and maps. Ahab’s mad drive is no where more unbalanced than on his obsessive poring over maps to reveal the location of the whale, as if he might geolocate his position by latitudes and longitudes. Ahab’s investment of maps with mystical powers is almost a clear echo of the Theurgic magic that Melville saw as the belief in his ability to conjure the whale he so obsessively seeks.

Of course, as Melville would remind us, the map is all in the eye of its reader.  Maps, in contrast, provide a sense of stability to Ishmael, and were the basis of historical orientation to the seas.   ‘It is not down in any map; true places never are,’ Ishmael descriptively evokes the mysterious origins of his fellow sailor and companion, Queequeg, whom he praises as “George Washington cannibalistically developed.”   Queequeg hails from the South Seas, and his unknown origins betrays the fascination of unmapped spaces and the allure of being “off” the map.  The sailors’ concern with mapping places haunting the narrator of the novel obsesses the monomaniacal ship’s captain who leads his ship to the same area of the globe in search of the lone whale he seeks to lead an increasingly wary crew.  Melville wrote with a particular sense of spatiousness in a chapter that first tells the story of the Great White Whale–“Moby-Dick” (Chapter XLI)–poses the question of preserving collective knowledge to gain bearings on the location of the White Whale, that suggests the onset of the first mapped knowledge of whale routes.  If providing pictures of  the specter of the whale from from the point of view of the whale-man, the encounter of ships at sea at the start of the hundredth chapter betrays a  desperation to orient his ship on the high seas, but which the conjurer Ahab invests with devilish properties as if they had the Theurgic properties he so diabolically desired.

At the start of the hundredth chapter of the massive narrative, an obsessive Ahab cries hopefully to crews of a passing English ship monomaniacally—“Ahoy!   Hast thou seen the Great White?”   Ahab cries in biblical syntax in desperation to the approaching English ship’s captain and crew, showing his ivory leg to the ship whose captain barely seems to understand him, but improbably turns out to be his twin, having lost an arm last year to the very same white whale:  in a macabre recognition scene, the ships joined the two disfigured by the same whale clink ivory limbs, arm and leg, bound by both how their lives found new orientation after their encounters with the great white whale.  Ahab has prepared to track the whale’s course on a map, however, and in ways not often historicized in the mapping of whales, a sort of hubristic act in the case of the Great White that Ahab tracks, and yet a cartographic image of location of the great white whale’s course that Ahab seems perversely and maniacally determined to be able to conjure by a map–perhaps an intimation of madness. As much as revealing the hubris of such determination, Melville’s description of Ahab’s madness is historicized, in a telling footnote, in contemporary maps of whale routes, whose potential promise, limits, and benefits he would have known well as a man of the seas.   

While legends of sightings are dispersed among whaling ships “sprinkled over the entire watery circumference” in disorderly fashion, each “pushing their quest along solitary latitudes,” sharing knowledge about whales’ locations was prevented given the “inordinate length of each separate voyage” and “long obstructed the spread through the whole world-wide whaling fleet of the special individualizing tidings concerning Moby Dick.”  The sightings of sperm whales of uncommon magnitude provoked rumors and fears of encounters with the whale, as one might expect, even if they were recored at a fixed time or meridian.  For, Melville reminds us again of the unique space of the open seas, “in maritime life, far more than that of terra firma wild rumors abound, wherever there is any adequate reality for them to cling to;” in the “remotest waters” or “widest watery spaces,” whalemen are subject to “influences all tending to make his fancy pregnant with many a mighty birth.”  

Such an expansion of legends of the White Whale on the open seas contrast to the single-minded focus of Ahab’s tracking of Moby Dick, and the certainty that the Captain possesses of his ability to find Moby Dick on the open seas .  Such a fixation is opaque at the book’s start, but is perhaps most manifest in his obsessive desire to track the individual whale by the sea charts kept in his cabin, to which he retires to read each night, and seem to provide the first point of entrance into his psyche–and what Melville calls his “monomania.”  As the ship moves over the seas, Ahab returns often to his cabin to read charts, maps, and logs, as map-reading becomes a keen emblem of monomaniacal fixation–as the belief that maps will help him track the whale that he is committed to kill.  The maps may magnify the sense of monomania, the psychological diagnosis of an undue expansion of mental attention on one object; if repeated reading the maps serves as an emblem of the growth of his fixation despite the survival of his intellect; trying to pursue the whale on charts seems to serve to focus his vindictiveness, as if materializing how the “White Whale swam before him as the monomaniac incarnation of all this malicious agencies which some deep men feel eating at them, till they are left living with half a heart and half a lung.”  Ahab’s fixation on the yellowed charts he unrolled on his cabin table express the monomaniacal tendencies defined in nineteenth century psychiatry of how an inordinate fixation persists in an otherwise rational mind; the fixation on mapping the course of the whale obsesses his attentive mind.  

Is the hope of locating the White Whale by the rutters of past whaling ships and collation of mapped observations an emblem of nourishing an undue fixation of his pathological preoccupation, despite his apparent ability to reason the possible path of the whale’s path?  The extended narrative of the ongoing quest for Moby Dick on which Ahab leads Pequod that fills the content of the novel becomes a sort of psychic profile of the obsessiveness with which Ahab takes the Pequod, and the novel’s narrator Ishmael, to encounter Moby Dick in the South Seas–the site of whale -spawning where the novel culminates.  The retiring of Ahab to the solitude of his cabin matches his withdrawal into his mind and serves to nurse his preoccupations.  What provides a more gripping image of Ahab’s inner psyche than the obsessive attention that he gives to tracking the White Whale by maps?   Ahab retires to consult log-books and charts to cull sightings of sperm whales that almost substitute for an actual map or rutter–and for the trust that sailors might place in maps and charts to guide the ship.  The problem of locating the whale s underscored by mention of the “wild suggestions” of many ships that have given the whale chase of an “unearthly conceit that “Moby Dick was ubiquitous; . . .  had actually been encountered in opposite latitudes at one and the same instant of time;” if”the secrets of the currents in the seas have never yet been divulged, even to the most erudite research,” Ahab seeks to challenge this sense of ubiquity through his obsessive consultation of charts, by following of the outlines of naval courses.  His intensity comes to transform his very brown and visage into a lined map, tracing out courses, so that his forehead comes to resemble a chart; reading maps with such obsessiveness to track his prey seems to remove Ahab’s single-minded pursuit from any oceanic transit, and from the common good of the ship that he commands.

Ahab’s monomania may seem sui generis.  But it is closely tied to the mapping project of Mathew Fontaine Maury and the contemporary project of collating open data on whale migration in Melville’s time, and the promise of investing legibility in a global space of whale migration.  Even more than the bodily injury of the loss of his leg that left him tormented with visions of the White Whale, the obsessive tracking and persistent consultation of charts and maps with other records manifests the idée fixe by which Captain Ahab is obsessed, and indeed the solitary consultation of these charts while his crew sleeps at night stand for the single-minded madness of tracking one whale on the open seas.  The folly of tracking the White Whale on a map embodies Ahab’s monomaniacal pursuit of a way to track its course by a paper map.   So fully does map-reading come to consume both his mind and his body as he ponders charts every night in his cabin, drawing new lines and courses by pencil, and revising them, “threading a maze of currents and eddies, with a veiew to the more certain accomplishment of that monomaniac though of his soul, so focussed on a map that, in a brilliant image, his tormented face even becomes a map, bearing the traces of the pencil lines traced on the charts, as if the subject of his fixation rises to the surface of his skin, so entirely consumed his mind by the conceit of mapping the course of Moby Dick.  The appearance of these self-inflicted lines as if engraved on Ahab’s brow–Melville’s image–echo the captain’s fixation with obsessively tracing multiple marine courses on the charts he keeps in his cabin; the courses that are so intensely pondered seem to rise to lines inscribed on his own skin as if in as a consequence of the imprint that tracing possible courses  of the leviathan has brought.  

The conceit of the tracking of whales on maps appears an emblem of Ahab’s madness, if it almost echoes contemporary techniques of Global Positioning Systems.  The utter hopelessness of locating one whale in an ocean map seems apparent; Ahab has indeed so often red maps to transform himself into a map hoping to locate Moby Dick, and the conceit of mapping whales has filled his mind.  Yet, as the “hidden ways of the Sperm Whale when beneath the surface remain, in great part, unaccountable to his pursuers, . . . the most curious and contradictory speculations regarding them, especially concerning [how] he transports himself with such vast swiftness to the most widely distant points”    Melville presents the problem of mapping the course of whales as one by which the crazed Captain Ahab is increasingly consumed, pouring over charts in the captain’s cabin, increasingly isolated at a remove from the crew including Queequeg and Ishmael, and the fate of his ship.  Although whalemen by their expert knowledge often came to the conclusion after the White Whale so often escaped their capture “Moby Dick not only ubiquitous, but immortal,” the presumption of mapping the course of the White Whale’s course is perhaps the clearest illustration and emblem of Ahab’s hubris, and monomaniac obsession with tracking the whale above the expert knowledge of his crew, as he “led upon the whale’s white hump as the sum of all the general rage and hate felt by his whole race,” so violently did he come to see personified in the whale that had once torn off his leg all evil in the world, and pit himself against it.  Maps provide Ahab with a basis to nourish and expand the “monomania  in him [that] took its instant rise at the precise time of his bodily dismemberment.”  If such a mania began he returned home, stretched in a hammock on his homeward voyage, swaying in a straitjacket in the rocking boat returning across the tranquil tropics, as “his special lunacy having stormed his general sanity,” he obsessed after returning to Nantucket with the one aim of hunting the White Whale.  Monomania had almost fallen out of favor as a diagnosis by 1850, when Melville wrote, but novelists from Balzac to Bronte adopted the image of mental fixation and unhinged rationality that Ahab’s reading of maps convey.  

Nothing in Mellville’s novel is so great an emblem indicating Captain Ahab’s madness than his obsessive consultation of nautical charts and maps of which he is a jealous custodian, and which provide the basis to nourish his determination to locate Moby Dick.  Maps may feed Ahab’s relentless compulsion to track the White Whale.  Ahab’s obsession with maps reflects contemporary attempts to map the open seas:  indeed, the superstitious value of the leviathan held a special place in the “wild, strange tales of Southern whaling,” and the deep sympathy of whaling men for their prey, who they know far better than those naturalists who have perpetuated false legends of their fierce animosity for humans, from Palsson to Cuvier, distorting the actual awesomenes of pursuing any whale tracking the Great White.  

Ahab’s obsessive reading of maps to track Moby Dick seems a figure for his monomania, but reflects an actual mapping project tracking whales on the open seas, which Melville knew well, and a project of mapping the logs of whaling ships in legible cartographic form.  Ahab’s use of maps to track Moby Dick mirrors the cartographical project of Matthew Fontaine Maury, the nineteenth-century Virginian polymath and early hero of open data, who in 1851 sought to map migratory routes of Sperm and Right whales or the benefit of the whaling economy.   If Melville often consulted histories of arctic searches for Northern Whales published from the 1820s, the appearance of an authoritative map of the courses of whales that Maury had accumulated from ships’ logs provided a model that attempted to impose human reason and fixed continuity on a whale’s migrating itineraries and paths, in order best to predict its actual location.

Ahab’s obsessive hope to track the course of the great white whale Moby Dick in the ship the Pequod may mirror the scope and ambition of M.F. Maury’s project–a project that led to one of the odder maps of marine population and migration that appears below, but which is one of the monuments of open data.   For Melville, however, Ahab’s mania seems driven by the hope the map carried for being  able to track  the course of the great white whale that his prey, and to arrive at the moment of confrontation that will in fact never appear on any map.  For unlike the observations Maury graphically collated, the specificity of Ahab’s tie to Moby Dick is not on the map at all.

Whale Chart 1851Maury’s Whaling Map; Norman B. Leventhal Map Center at the Boston Public Library

Ahab’s self-imposed sequestering on the voyage of the Pequod in his cabin, surrounded by a variety of charts, seems emblematic of his single-minded obsession to track the elusive Moby Dick.  It is emblematic of a uniquely obsessive sort of map-reading emblematic of his particular sort of hubris:  as he will never know the true path of the majestic whale, his study of the map symbolizes a contest between the mapping abilities of man and whale.

The private consultation of the map in the the secret space of the captain’s cabin reveals the sharp contrast between the whale as an innate cartographer who migrated across seas and the knowledge of routes inscribed in lifeless nautical charts, and the inability to plot or plan the intense longing for his confrontation with Moby Dick within the range of observations of all whales by traveling whale ships.  But it also offers an amazing fantasia of the reading maps and nautical maps as if they were guides to habitation, and a reflection on the nature of map-reading and the comprehensive claims of encompassing known space within engraved maps, and specifically of the colored charts of sea routes, whaling and sighted whales that the oceanographer Matthew Fontaine Maury produced in the 1850s compiling nautical logs of whaling ships, after having remapped the coastline of the United States from the geodetic Survey of the Coast by the Swiss Ferdnand Hassler, which had tried to fulfill the Jeffersonian dream of a nation facing two oceans, before joining the Confederate cause.

image.png .

We have little sense of the amassing of data that existed in Ahab’s cabin, so much as the intense relation that the captain develops to his charts.  Melville describes how Ahab retires to his cabin to open “large wrinkled roll of yellowish sea charts, spread them before him on his screwed-down table,” ready to set himself to “intently study the various lines and shadings which there met his eye,” and escape into the paths that they trace.  The memorable episode in Ahab’s own cabin focusses attention on how the captain’s obsessive consultation of the maps, as a sort of emblem of his search to capture the whale in them.   Ahab processed information in the map as best he could, and “with slow but steady pencil trace additional courses over spaces that before were blank,” while consulting log-books of previous voyages and noted sightings of sperm whales in a desperate attempt to locate the migratory path of the white sperm whale Moby Dick–whose own route he so obsessively seeks to understand and on which he fixates so obstinately. The reading activity is isolated and isolation, because the map is essentially mute, a second order of spatial knowledge with which he has no literal traffic or exchange, but becomes a way to wrap himself in further isolation from the mammal that communes with the productive fecund waters of the sea.  “While he himself was marking outlines and courses on the wrinkled charts, some invisible pencil was also tracing lines and courses upon the deeply marked chart of his forehead,” as every night, “in the solitude of his cabin, Ahab thus pondered over his charts, . . . threading a maze of currents and eddys [sic], with a view to the more certain accomplishment of that monomaniac thought of his soul.”

Such a collective map of the sightings of whales is both the focus and talisman of Ahab’s monomaniacal will:  both as the transcription of the paths of hidden submarine itineraries, “with the charts of all four oceans before him,” and the hubris of understanding the concealed migratory course of that noble whale with which he is so obsessed and that has long evaded his search.  For Melville confides that “it might seem an absurdly hopeless task thus to seek out one solitary creature in the unhooped oceans of this planet” to many; “But not so did it seem to Ahab, who knew the set of all tides and currents; thereby calculating the driftings of the sperm whale’s food, which whales were imagined to follow; and, also, calling to mind the regular, ascertained seasons for hunting him in particular latitudes; could arrive at reasonable surmises, almost approaching to certainties, concerning the timeliest day to be upon this or that ground in search of his prey.”  The privacy of the consultation of the tables that allow him to try to read this map, and to establish the position of the whale he seeks, becomes the basis for the captain’s obsessive hope to track the progress of the whale, better to interpret its location.

The intensive reading of ocean charts becomes a site of reading that obsesses Ahab as a means to determine and decipher the logic of its movement stand at odds with the description of the sublime nature of the sperm whale, whose own head cannot even be read without wondering at the majesty of the form of the “head of this Leviathan,” truly “an anomalous creature,” impossible to interpret or decipher, whose imposing grandeur is of such “god-like dignity” to defy human interpretation.  As the wonderfully described problem of the legibility of the “plaited forehead” of the Sperm Whale is a living surface that defies interpretation, inscribed with “innumerable strange devices for [its] emblematical adornment,” following not Euclidean mathematics, but rather “pure nautical mathematics,” the mapping of the course of the whale seems to defy tracking by Euclidean tools also defies reading, much as Melville described the sperm whale’s forehead forms a “mystically carved container,” the lines of whose face defy clear reading, as the “bumps on the head of this Leviathan” is a surface whose interpretation “no Physiognomist or Phrenologist has as yet undertaken,” and would challenge the abilities of Lavater–despite his study of animal faces–or Spurzheim or Gall, suggesting the intractable indecipherability of the whale, but whose “sublime aspect” and “added grandeur” Melville attempted, in the brow in which “mighty god-like dignity” is indeed “inherent” in a brow “plaited with riddles,” presenting Lavater’s mark of genius in the depressed crescent at its middle, in a brow “so amplified . . . you feel the Deity and the dread powers more forcefully than in any other object in living nature.”

As the brow of the leviathan remains challenging to be read, any hope of reading the map of the path it takes seems, despite Ahab’s desire and Maury’s map, Melville appears to assure his readers, as futile as a way locating the actual whale Moby Dick, but becomes an obsessing act of tracing, retracing, and location, that becomes Ahab’s obsessive interpretive project in Melville’s novel.  The fantasy of an ability to harness sperm whale as a medium or vehicle for global travel had appeared in the Currier & Ives satire on the California Gold Rush circa 1849, “California Gold,” that conflated value with the huge “Blower” a ’49er placed in a harness to steer his chunk of gold across the Cape Horn, rendering the prospect of laborious journey to California as a fantasy of the domestication of wild mammal put to use as a private frigate:  while the whale’s course was never to be so predictable the Currier & Ives cartoon suggested the appeal to a broad imaginary, a joke on global travel if not the presumptuousness of circuits around continents.


Continue reading

4 Comments

Filed under American literature, data visualization, Herman Melville, Moby Dick, open data

Mapping Knowledge and Mapping Food

Image

What relevance do maps have in a world often organized by database systems that are in themselves often impossible to visualize?  One answer is that the map is not only a visual register of data, but prepares an active correlation of information patterns and raises questions about human relations.  Rather than arranging data, maps show or highlight selective relations between data in graphic form.  Maps do so in ways that generate questions about our relations to space, if not the variety of relations each of us occupy to an otherwise uniform expanse, in order to make space our own; they are as a result particularly useful tools to ask us to consider our sense of place in ways that we might not otherwise find a way to puzzle over and consider, or find a way to concretize.  Although the size of massive database systems escape the kind of an individual, the maps that guerilla cartographer Darin Jensen has solicited and assembled in FOOD: An Atlas raise chart the spaces we organize around through food, and understand place through the intersection of place with how food is produced, exchanged and consumed.

In an age of the unwarranted expansion globalization of food consumption patterns and trade, where the importation and circulation of foods to their consumers often seem shaped by processes irrational in nature, the rationality of the map provides a way to raise questions about how to understand the ways that food sources and substances travel across space both in commercial ways and in raising questions about the efficiency of these systems.   In identifying and rendering a joint database of food production and consumption, we can grasp in an entertaining visual form multiple questions about how we value the place of our food and how food is now valued and exchanged over spaces far beyond the places where it is grown.  We may not know what bacillus of yeast helped the fermentation of the glass of beer we are drinking, even if we prize the origin of our coffee; we can’t visualize or often even know what field of tomatoes provided the basis for our pasta sauce, or the huge range of regions united in the foodstuffs in a plate of school lunch, or where the almonds of northern and central California travel in order to reach consumers from the Central Valley.  The maps in FOOD:  An Atlas provides a range of provocative maps of how food interacts with space that provide a compelling set of questions about our relation to place, and indeed the relation of food to space.  Maps of the global distribution of grains, or of the costs of the same foodstuffs, remind us of how food exists in relation to place, even if food travels globally—as well as the places where food grows.

The compilation is a true atlas of modern life—or of modern tastes for foodstuffs.  The Dutch engraver and cartogapher Abraham Ortelius compiled the first global atlas by sourcing maps from different areas in Europe from his multiple correspondents in the 1560s, obtaining a range of extant cartographical forms of nautical and terrestrial form that he collated in a synthesis of terrestrial coverage that canonically redefined the image of the inhabited world.  Refined and expanded in his own lifetime and after his death, the Theatrum Orbis Terrarum bound these multiple maps obtained from different parts of Europe and vetted in Amsterdam in a single commodity that was immensely popular and, though dedicated to Philip II of Spain, was disseminated over a huge geographic expanse.

The crowd-sourced maps collected in FOOD were sourced in a considerably shorter period of time over the global internet, solicited from cartography listserves and Berkeley classrooms alike, starting from the North American Cartographic Information Society (NACIS) and coordinated through a GIS lab where proposals for mapping were often linked to potential owners of databases, and submitted maps refined for their persuasive visual organization, the transparency of their cartographical iconography and the appeal of their format.  The variety of graphic skills that are applied to map food and food’s distribution are themselves inventive exercises, and suggest the degree of invention that

The crowd-sourcing of the atlas is not only a question of pragmatics, but itself an instance of informational exchange.  On the one hand, Jensen describes how he arrived at “a project of guerrilla cartography and publishing” as the result of a natural desire to make the sort of compilation of maps that “take too long to make,” which led him to “an experiment in doing it faster,” both by relying on crowd-sourcing and local publishing. “It doesn’t have to take two or three years to put out a book or an atlas.”  The anonymity of the crowd sourcing generated a far more imaginatively diverse use of mapping conventions—unlike Ortelius’ interest in universalized norms, they celebrate local diversity of mapping abilities in keeping with the polycentrism of a post-modern age.  Rather than conforming to a single style or aesthetic, each crystallizes specific issues in an individual fashion.  The maps provoke us to consider the relations of place and food, and alter or tweak our relations to the world in mapping the circulation of food wastes, the sites for importing tomatoes for that pasta sauce, or the “food swamps” where junk food constitutes a dominant share of the foods for sale.  Each is brilliant in its own way.  Whereas we know the many authors of the maps that Ortelius collected primarily from his extensive correspondence, as well as the “elencum auctorum” that provided a comprehensive list of the different authors of maps in his atlas and sources that were consulted in its creation, Jensen lists the individual or joint authors of each map–and even invites us to construct our own!

Why create a set of maps of the relations between food and space?  This volume is a way to rehabilitate the use of the map as a way to consider and contemplate relations we construct between place, as well as the product of a local culture of food.  All food is local, even if the world we live in has globalized food as a resource.  The open arguments of maps Darin Jensen and his team assembled in FOOD:  An Atlas provide a collective tool to understand what might be called the irrationality of the globalization of food sources in the transparent and supremely rational language of cartographical forms.  Much as the previous MISSION:  POSSIBLE led us to view one neighborhood in San Francisco in new terms of the distribution of coffee-shops, trees, ethnicities, restaurants, underground gas reserves, parking spaces or sounds, each map in FOOD:  An Atlas provides a distinct corner of the exchange of food as commodities and elegant goods we value for their local origins, as well as celebrating the recent growth in the valuation of the locally produced good.  As Jensen’s map of the Mission noted the rise of artisans in the neighborhood, the mapping of Farmers’ Markets—both in Berkeley and in the United States—offers a view of the rising value of the locally farmed (and even the changing definition of what local farming means) as well as the access and audiences of these markets.  As MISSION:  POSSIBLE provides both a map of a region of San Francisco and a sort of surrogate for orienting oneself in any modern city, FOOD:  An Atlas provides a tool to orient oneself within the global exchange and local production of foods.  The map of areas of urban agriculture in San Francisco that is included in FOOD is a great model of a collective interest in the local production of food in that city, and a sort of template for resisting a growing divorce of food and a local landscape.

To order a copy, visit http://www.guerillacartography.net/home.html

How better to understand the pathways by which select regions of almond-growing enter the chocolate bars sold across our nation, or consider the inequalities of food that dominate the urban and rural landscapes in an era that celebrates famers’ markets?

http://missionpossiblesf.org/

https://www.facebook.com/food.atlas

http://cafarmersmkts.com/

2 Comments

Filed under Abraham Ortelius, crowd-sourcing, Darin Jensen, data visualization, data visualizations, datamaps, Food, Food Maps, Geographical Information Systems, Guerilla Cartography, NACIS, The American Beershed, Uncategorized