Tag Archives: US Civil War

The New Separatism and the Gas-Tax Latitudinal Divide: Tracking the After-Images of Southern Secession across the United States (Part I)

No region is an island, but divides are defined in ways that create a transmitted insularity along what might be called the Gas-Tax Latitudinal Divide that cuts across the United States, bisecting much of the nation along what almost appears a meridian.  Even before the efflorescence of confederate resentment in southern states clear in the 2016 Presidential election, but not at all clearly perceived in recent years, but evident the apparent toleration of the claims of white supremacy and the far right that are rooted in states rights, and, almost perversely, rooted in the limited abolition for slavery and enslavement to expand across territories of the United States titudes north of 36° 30N,–a latitude inherited from the accident of early surveyors’ decision to mark the boundary line between Kentucky and Tennessee.

The latituidinal divide offered both an “objective” basis to extend slavery westward and a fulcrum to guarantee representation of slave-holding and non-slave holding states in the U.S. Congress, a line of apportionment that guaranteed the preservation of local rights of slave-holding, before it marked the secession of the Confederate States of America. The divide has fed a bizarrely enduring discourse on states’ rights in American history that has in many ways colored the complexion of the world, as a repository for the persistence of a reactionary localism in a globalized world, as the initial session of Virginia after Ft. Sumter in the Spring of 1861 was followed quickly by Arkansas, Tennessee, and North Carolina, sectionally dividing the union,–until its disintegration left only the southernmost states defending slavery as an absolute local good.

Confederate States of America
and Claims made by Confederacy

Long after the practice of enslavement was condemned as sinful by evangelicals, and uprooted in European nations, as was the case by 1848, the inner sanctum of the defense of enslavement lay in the preserve of the CSA–a community-sponsored movement to defend enslavement as a local privilege. Indeed, the depth of memories seem to have been provoked by the stripping of symbols of localism and place like the Confederate flag–the emblem of the separateness of the southern identity–a regional identity perhaps exacerbated by a perceived loss of regional identity and afford continued objects to intrusive federal actions, in a symbolism of nobility that recalls a bend dexter with a bend sinister, and haunts even our most present–and apparently innocuous–as mapping the state of the states in data visualizations parse meaning by blocks whose continuity suggests deeply lying fault lines.

images-7

The resistance of localism–and the national drama, indeed, of the attempt to strip the region of its symbol of autonomy–has perhaps not only had a greater impact in how early twenty-first century politics have played out in America, but of the deep presence of the divide of the seceded states across generations.  Can the survival of this divide be mapped? Or will it, more likely, continue to haunt the nation, as in the American Petroleum Institute decided to  map as a way to lay out ostensively objective record of local variations in gasoline taxes around the country, devised somewhat opportunely in 2014, as the United States was poised to run out of federal money to restore roads, and the chatter on gas taxes rose.

American Petroleum Institute

The problem of an alleged discrepancy in tax-rates that the American Petroleum Instituted foregrounded was based on the numbers of cents and decimals–not on percentages, m although the confusion could be excused, viewing the map and its legend without further information, so clearly does it seem to correspond to that blue state-red state divide that has long haunted our social media-saturated spatial imaginaries. If the map was intended to be polemic, and provide fodder to resist calls for calls for raising gas taxes since in counties–the federal tax remaining stable at 18.4 cents/gallon since 1993, the map taps into an ethos of tax revolts by purporting to illustrate an alleged discrepancy in tax-rates along a national fault line.

The divide that the American Petroleum Instituted foregrounded was based on cents and decimals–not on percentages, m although the confusion could be excused, viewing the map and its legend without further information, so clearly does it seem to correspond to that blue state-red state divide that has long haunted our social media-saturated spatial imaginaries. If the map was intended to be polemic, and provide fodder to resist calls for resistance to further hikes in taxes, and suggested the importance of seceding from what it cast, ingeniously in ways, as a sort of necessary secession from higher energy prices–the primary foe of much of the nation, it has seemed for most of the post-Cold War period.

American Petroleum Institute

The spectrum of county taxes is indeed much more complicated, revealing that it hardly makes sense to parse in states, although they reflect how some states have passed laws to restrict emissions of dirtier fuels, as gasoline, and have actively sought to do so, in the western states of California, Washington, and Oregon, by placing a larger tax on gallons of gas, in way that “Gas Buddy,” hardly a friend of the American Petroleum Institute, but a data-miner who seeks to give the lowdown on gas prices: the devious color-ramp depicts the bucolic nature of the southern states when it comes to protecting the price of low-cost petroleum for our engines, and the red-hot far west that seems a danger zone that might as well fall off the map.

The website allows one to map in real time, by a color spectrum seeing to affirm that the grass is greener as deeply as you drive into the traditional region of southern states, where the rights to cheap gas seem to be preserved, and the status quo of cheap gas is maintained: the land where cheap gas prices allow fertile fields to bloom, and environmentalism is out-sourced for self-interest, unlike the red-hot far west, of which all drivers should beware.

The data vis in other words affirms that GasBuddy is looking out only for our best interests, showing at a glance “the best gas price, anywhere,” at a glance. It’s not surprising GasBuddy is a big friend of Google, and has gotten rid of any state lines, as well as environmental costs, as if to reveal the county-by-county free market of gas prices for his online audience, in ways that increasingly seem to register the deep danger to the wallet posed by driving out west. This is the map of the triumph of the free energy market, embraced as the United States has become the biggest natural gas producers in the world and the top producer of petroleum hydrocarbons since 2013, raising hopes of the growing green for gas guzzlers nationwide, who try to laminate highway maps and interstates over the green fields that get only greener descending the Mississippi as one approaches the Gulf coast.

Gasbuddy, Heat Map of Average Real Time Unleaded Gasoline,
August 2019

“Prices” here are not based on taxation alone, but “average prices” suggest the significant differences that exist between regions that indeed depend on commercial trucking, and ensuring low-cost convenience stores and supply chains, but have made a decision to prioritize free commerce at the expense of infrastructure and the environment. If it can be credibly argued that many costs of road maintenance, from snow-clearing to cracked asphalt, may not exist in the warmer climes of southern states, and rural roads are often less trafficked, the strong sense of separatism and defense of local privileges shines through the above map of gas prices, which reveals just how modulated the spread of up to a dollar and a half of the cost of gas/gallon are inflected by differences in gas taxes, although these only vary by a spread of about twenty cents.

Rather than be a post about road trips, the Gas-Tax Map provided an opportunity to excavate its layers, and investigate the underlying relations of a deep-seated stakes of states’ rights discourse that seems to underly the polemic visualization, as much as the proximity to offshore refineries in the Gulf of Mexico.

2 Comments

Filed under Confederate States of America, data visualizations, infographics, Red states v. Blue States, statistical maps

Mapping Slavery in the United States in 1860

In debating the values of data visualization maps, I’ve gone both ways.  The value of maps as specific arguments–and tools of spatial orientation–respond to the value of the selective criteria that cartographers foreground in them, after all.  Less inventive differentiations of spatial distributions “flatten” the map’s surface, and limit their value to the map-reader.  Their arguments are not as interesting, one might say.

The early visualization of this elegant choropleth map employed data from the Census of 1860 it translated into visual form to map the density slave population across the recently seceded Southern states. Long touted as an important strategic tool, the rhetoric of an isolated mapping of the Southern states framed debates about the Civil War with greater  subtlety than current tiresome choropleth maps of “red” vs. “blue states.”  The 1861 lithograph marked the density of slave-owning in pockets by darkening sites of the greatest slave population, perhaps to mask the ownership of slaves throughout the South and point to the defenders of a slave-based economy.

1861 slave population map

If the census provided a basis for Edwin Hergesheimer and Alexander Dallas Bache to create the map, a collaborative government effort as much as an independent enterprise of the commercial engraver Henry S. Graham, the use of statistical cartography prefigured the mapping of social or political trend in the field of human geography.  While the recent German immigrant Hergesheimer created the pro-Union map from figures in the Census after his work on the US Coastal Survey, the translation of the results of the Census into visual form proceeded because the Coast Survey’s Superintendent.

Although a deeply collective project, Bache’s recent success in assembling a team to map the coastal survey gave him a new public profile, and prominence, to back the project of mapping a visual record of data assembled about slavery in Southern States.  The map tellingly reveals Hergesheimer’s deep Liberal opposition to slavery as an institution and the pro-Union belief of supervisors of the eighth national census, but its visual explanation of the origins of secession intentionally focussed attention around slavery debates.  Printed in September of 1861 after hostilities had begun, and ten states had seceded from the Union, it isolated the evil of slavery in the seceded region, and highlighted the centers of slavery’s institution even before slavery became the central issue of the war.

Hergesheimer and Bache were instrumental, too, in adopting the most current techniques of mapping to portray the differentials of slave-owning in the Confederate States just before the South’s Secession.  The half-tone engraving he designed to show slave-holding states in the “Southern States of the United States in 1860” foregrounds discontinuities in the national territory by using figures he derived from that year’s national census.  Known as a “Slave Density Map,” the lithograph exemplifies cutting edge statistical mapping and an artistic use of half-tones to depict the seats of the evils of slavery in seceded regions of the United States in a piece of pro-Union propaganda:  slavery existed throughout the Southern states, but was concentrated “down river” in Mississippi, Georgia, South Carolina and Texas.  The lithograph provided something of a moral map of the region beyond which Lincoln sought to forbid the expansion of the slave-economy.  Printed and sold by the government in wartime ostensibly for the benefit of Union Soldiers, the single-sheet map used half-tones to differentiate relative variations each county’s relative density of slave-holding across the Southern states.   But although the map presents itself as an appeal for wounded veterans of a war in which soldiers were so dramatically injured, its mapmaker aimed not only to raise funds through direct sales but broadly encourage the war effort by illustrating slavery as literally darkening the nation.

With considerable cartographical sophistication in charting variable densities of slave-ownership, the map illustrated striking discontinuities in the nation and  even suggested divisions in the Confederacy at the outset of the war:

Slavery Map 1860

Bache was a deeply moralistic man, as well as a former Lieutenant in the Army who, after graduating from West Point until 1829 designed coastal fortifications  before he rose to head the Smithsonian.  Bache had won national eminence as the head of the United States Coastal Survey, using a team of trained surveyors, several university observatories, and many field assistants to triangulate the coastlines from a base-line near Annapolis.  Based on readings from numerous sighting stations, the map extended west to California and endured through the twentieth century.  After mapping the shorelines of the United States, Bache devoted himself to mapping its islands of slavery.

Most maps made in wartime are valuable strategic tools to orient troops, as much as map vulnerabilities.  But this map was not made for a lack of cartographical records.  (It did not meet a desire for cartographical knowledge, for example, as the many paper maps shipped to Kuwait during the 1990 Gulf War–often incorrectly considered the first war fought by GPS–as 67 highly detailed topographic line maps of the region, some bathymetric, at the incredible scale of 1:50,000.   Incredibly, the Army lacked  accurate maps of Kuwait, and these were quickly prepared during the war based on remotely sensed satellite images.)  Bache’s map had far less apparent strategic use, identifying pockets where a slave-based economy was particularly dense, and all but ignoring physical topography or population centers.  But the map was compelling as an image of the divided nation.  Bache and Hergesheimer designed the map for a civilian populace, using the 1860 census to create a visually compelling distribution that revealed regional disparities in “slave-ownership” and the population identified as slaves to reduce the scope of the confederate secession.

The map provides an image of the nation taking stock of itself, or learning to look at its divisions–a rare thing.  Bache and Hergeshemier’s map of this nexus of the Southern economy was ostensibly sold to raise funds for “Sick and Wounded Soldiers of the US Army,” or veterans, as gothic script in scrollwork crisply notes.  It’s been argued that the map identified possible pockets of resistance, or possible seats of opposition to Union forces.  Lincoln consulted the map after the war, to consider ways to encourage the Southern economy.  But the elegant map roots the struggle of the Civil War in disparities of slave-ownership in the South, to question the fierceness of opposition to the Union, or to show the enemy and stakes in the war.  By starkly differentiating each county’s degree of reliance on slavery by shades of grey, it offered viewers a stark map of racism in parts of the region–if it also perhaps perpetuated racism  unwittingly in directing attention to the suffering of soldiers who could benefit from its sale and not sufferings inflicted by the economic institution of slavery.

legend

But the map also made its point of isolating slave-ownership in select regions of the Southern states, in ways that masked the continuity of slavery across the region.  The remove of the Southern states from the North, and isolation of precise regions where the practice of slavery was most extreme, echoed Bache’s belief in the political uses of science by applied cartography to national needs and for the public good.

It is interesting that Hergesheimer’s design for the map followed Bache’s success in precisely mapping the nation’s shorelines as Superintendent of the Coastal Survey.  The project established Bache’s credibility in large-scale surveying.  The new survey not only used the survey of coastal lines to map the interior, but may have provided Hergesheimer and Bache to turn attention to the occupants of the land as the US Government desired at that point.  The actual survey of coastal lines offered a sort of template to construct the map of slave-holding populations by using nine shades of half-tones to darken regions in differing degrees that created a compelling image of the fractured nation, and minimized the widespread nature of the social acceptance of slavery in seceding states.  The detail of the shore and coastal islands throughout suggests that the US provided not only contour lines for the map, but a template for national coherence–the unstated if implicit subject of the Slave-Holding map, and a central preoccupation of the wartime government.

The map of slave-holders adapted census information to the basic contours of states to map aggregate variations of slave-owning in states.  Although the map is given the strategic value of predicting resistance to the Union troops, it was probably most valuable for its inspirational or hortatory appeal as much as its accuracy.  Bache tried to expand the public functions of cartography in the map by adapting recent statistical methods to compellingly map two different worlds within the same nation.  A career military man and scientist, Bache was a public servant committed to the public utility and good of surveying and meteorology–a counter-part to Matthew Fontaine Maury, the polymath oceanographer and cartographer who served in the Confederate Navy 1861-5 and was Bache’s long-time nemesis:  Maury, whose cartographical interests I discussed in an earlier post, and who had himself hatched the ill-fated scheme for slave-owners to resettle from southern states to Brazil’s Amazon Valley in the early 1850s.  Bache’s map is both a detailed picture of social divisions and an image of a divided nation.  If this unlikely project was impractical, Bache’s map focussed on the seats of the slave-economy in seceding Southern states.

Susan Schulten noted in 2010, in a blog post to which I’m indebted, that Bache’s map shows a striking concentration ownership of slaves on the shores of the Mississippi, where cotton crops dominated, Alabama and the low-lands near South Carolina (which enslaved the majority of its population) and eastern Virginia; she suggested that this snapshot of slave-holding had strategic value to determine sources of greatest resistance in the Confederacy as well as for Lincoln to consider future economic development of the South.  The map must have constituted something like a “news map” for readers eager to understand the actual numbers of slave-owners in the deeper south, and the relative degree to which slave-owning had continued to endure in the Republic.  Parts of the broadsheet provided a strikingly compelling illustration of the locations of slave-ownership and an economy of slavery where Cotton was still King, as much as the Southern states as a whole:

Mississippi

Slavery was widespread in both Charleston, South Carolina, and Savannah:

Savannah and South Carolina

And, similarly, a pointed reliance on slavery around the area of Galveston, Texas:
Galveston

But there are multiple ways to read the project for designing the map.  The image of slave-holding lands provided a victory map for the Union soldiers, who sold it to raise money for their fellow-veterans who remained sick or injured, as if to stake the agenda for a need of remapping the nation, echoing a Jeffersonian idea of the use of surveying as a foundation for democracy.  It was the map by which Lincoln used to follow Union troops as they liberated slave populations, or understand the seats of rebellion, but had huge power in graphically stigmatizing Southern states.  It was also an idealistic statement of the goal of ending slavery in the war effort.

This striking legend that explained the iconography of the map’s nine variations in shading, placing the greatest “free blacks” in large towns:

Legend in Slavery Map

The innovative exercise in terrestrial cartography was also the last attempt to quantify slave-holding in the nineteenth-century, although it integrated public records that were later widely accessible.

It was, sadly, also the final time the Federal Government revisited the topography of slave-holding with similar precision. The failure to remap the same distribution seems one of the more stunning  cartographical silences of the twentieth century.  Bache’s impetus to draft the map might be informed by his long involvement in public education and belief in the public utility of the sciences; he effectively lent  a polemic character to conventions of statistical mapping by exploiting the different gradations of shading available to the engraver to craft a useful piece of early printed cartographical propaganda.

Indeed, its use as a piece of propaganda in wartime may have outstripped its potential as  guide to military strategy.  Lincoln regularly studied the map, according to his portraitist Francis Bicknell Carpenter, who found the president studying the map with considerable intensity in 1864, during the six months when he lived in the White House to paint the portrait “President Lincoln Reading the Emancipation Proclamation to His Cabinet.”  But his inclusion in the image of the choropleth map that accentuated national divisions reflected his interest in illustrating Lincoln’s “statesmanship” and “solid integrity” in bridging the nation.  By his own account, Lincoln had taken great pains to explain to Carpenter both the origins of “his adoption of the Emancipation policy” and his decision to draft the Proclamation from late July 1862, before he put it aside until being sure of military victory.  “I resolved,” Carpenter wrote in his memoirs, “to represent the scene [of Lincoln reading the Proclamation to his Cabinet] without the appliances and tricks of picture-making, and endeavor, as faithfully as possible, to represent the scene exactly as it transpired; room, furniture, and accessories all were to be painted from the actualities.”  Did the room actually include the map of slaves still ‘owned’ in the South?

Emancipation_proclamation-1

Carpenter’s state portrait depicting Lincoln reading the Proclamation to his Cabinet placed the lithograph in a small but a prominent role that most observers would not fail to notice.   As if to illustrate the subject of the recently issued Proclamation, if not the thoughts that weighed on the conscience of the President, the map emerged from behind a chair at the painting’s base.  Lincoln loved the portrait.  The map is the essential subject of his discourse; Carpenter made good use of it to capture the stakes of the Proclamation.  The nine bars of graduated shading in the map stand out among printed books in the group portrait, reminding viewers, both recording a moment of triumphalism and presidential dignity, and suggesting the uphill battle for implementing the Proclamation in the deepest South.  The map speaks volumes:

Visualizing Slavery-Carpenter

It reminds us not only of Lincoln’s hope to transcend social divisions.  Before Carpenter included it to illustrate the grand subject of Lincoln’s address–and Steven Spielberg also used the map in “Lincoln,” behind Daniel Day Lewis’ shoulder–the 1861 lithograph provided a tool to imagine political coherence in a more perfect union, urging men to enlist and others to get behind the war.

2 Comments

Filed under Abraham Lincoln, American history, choropleth maps, Slavery, US Coastal Survey

Map-Inspired Madness: Mapping the Great White in the Solitude of Ahab's Cabin

The terrifying search for the whale Moby Dick runs almost vertiginously off the known map.  The absence of bearings are particularly apparent in an era of increased map-printing and the growing claims of map authorship, often insecure of the origins or coherence of their captain’s narrative design.  The quest for the elusive Great White takes readers literally off the map, as The Pequod leads readers off of the map, in frequently disorienting ways; the apparently unreliable narrative carries readers on a quest for Moby-Dick into unknown areas less mapped as the almost  primal site of whale spawning, unknown to most, where the craft, itself adorned with whale bones—“tricking herself forth in the bones of her natural enemies,” bulwarks adorned with sperm whale teeth, rudder made from a whale jaw bone, seems to seek to arrive by human artifice, as if to persuade the whale to reveal itself by charms–or be all too similarly cannibalized by its craft. 

As the voyage progresses across the seas, Ahab descends to madness as he falls into maps in his desire for stability and power.  The book is an epic of consciousness, of Shakespearean scale, and a study in a landscape of psychic interiority.   As if conjuring the character of Ahab, on the final flyleaf of a volume of Shakespeare’s works, Melville echoed the words that Captain Ahab deleriously howls as he mock-sanctifies the harpoon he feels destined to kill Moby Dick.  The devlish incantation sums up his monomaniacal absorption, inverting the sacred ritual of baptism of a Christian soul, “Ego non baptizo te in nomine Patris et/Filii et Spiritus Sancti–sed in nomine/Diaboli”–after which Melville added:  “madness is undefinable” in its hubristic drive for “converse with the Intelligence, Power, the Angel.”   If Melville was raised in the austere Calvinist, learning the catechism in the Dutch Reform Church, taught to  “acquiesce in God’s will, no matter how unjust or cruel it might seem,” without recrimination for the divine plan, Ahab’s attempt to conjure the Great White whale moves not by summoning angels or demons but by conjuring his location on maps, as if to trying to conjure the whale by imprecations, charms and talismans.  The charms, we learn in Chapter 100, begin first and foremost in his obsessive reading of nautical charts and maps. Ahab’s mad drive is no where more unbalanced than on his obsessive poring over maps to reveal the location of the whale, as if he might geolocate his position by latitudes and longitudes. Ahab’s investment of maps with mystical powers is almost a clear echo of the Theurgic magic that Melville saw as the belief in his ability to conjure the whale he so obsessively seeks.

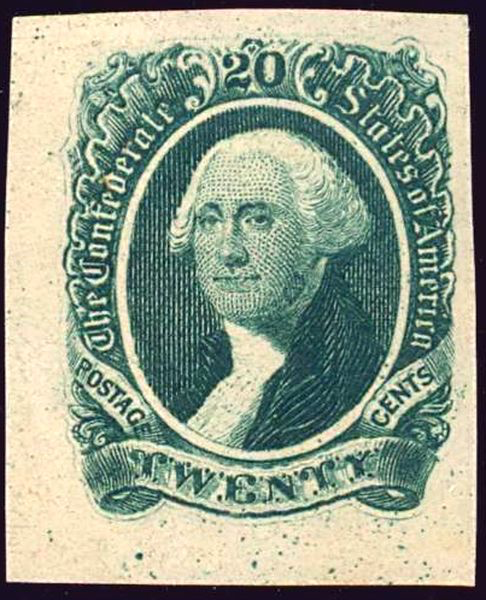
Of course, as Melville would remind us, the map is all in the eye of its reader.  Maps, in contrast, provide a sense of stability to Ishmael, and were the basis of historical orientation to the seas.   ‘It is not down in any map; true places never are,’ Ishmael descriptively evokes the mysterious origins of his fellow sailor and companion, Queequeg, whom he praises as “George Washington cannibalistically developed.”   Queequeg hails from the South Seas, and his unknown origins betrays the fascination of unmapped spaces and the allure of being “off” the map.  The sailors’ concern with mapping places haunting the narrator of the novel obsesses the monomaniacal ship’s captain who leads his ship to the same area of the globe in search of the lone whale he seeks to lead an increasingly wary crew.  Melville wrote with a particular sense of spatiousness in a chapter that first tells the story of the Great White Whale–“Moby-Dick” (Chapter XLI)–poses the question of preserving collective knowledge to gain bearings on the location of the White Whale, that suggests the onset of the first mapped knowledge of whale routes.  If providing pictures of  the specter of the whale from from the point of view of the whale-man, the encounter of ships at sea at the start of the hundredth chapter betrays a  desperation to orient his ship on the high seas, but which the conjurer Ahab invests with devilish properties as if they had the Theurgic properties he so diabolically desired.

At the start of the hundredth chapter of the massive narrative, an obsessive Ahab cries hopefully to crews of a passing English ship monomaniacally—“Ahoy!   Hast thou seen the Great White?”   Ahab cries in biblical syntax in desperation to the approaching English ship’s captain and crew, showing his ivory leg to the ship whose captain barely seems to understand him, but improbably turns out to be his twin, having lost an arm last year to the very same white whale:  in a macabre recognition scene, the ships joined the two disfigured by the same whale clink ivory limbs, arm and leg, bound by both how their lives found new orientation after their encounters with the great white whale.  Ahab has prepared to track the whale’s course on a map, however, and in ways not often historicized in the mapping of whales, a sort of hubristic act in the case of the Great White that Ahab tracks, and yet a cartographic image of location of the great white whale’s course that Ahab seems perversely and maniacally determined to be able to conjure by a map–perhaps an intimation of madness. As much as revealing the hubris of such determination, Melville’s description of Ahab’s madness is historicized, in a telling footnote, in contemporary maps of whale routes, whose potential promise, limits, and benefits he would have known well as a man of the seas.   

While legends of sightings are dispersed among whaling ships “sprinkled over the entire watery circumference” in disorderly fashion, each “pushing their quest along solitary latitudes,” sharing knowledge about whales’ locations was prevented given the “inordinate length of each separate voyage” and “long obstructed the spread through the whole world-wide whaling fleet of the special individualizing tidings concerning Moby Dick.”  The sightings of sperm whales of uncommon magnitude provoked rumors and fears of encounters with the whale, as one might expect, even if they were recored at a fixed time or meridian.  For, Melville reminds us again of the unique space of the open seas, “in maritime life, far more than that of terra firma wild rumors abound, wherever there is any adequate reality for them to cling to;” in the “remotest waters” or “widest watery spaces,” whalemen are subject to “influences all tending to make his fancy pregnant with many a mighty birth.”  

Such an expansion of legends of the White Whale on the open seas contrast to the single-minded focus of Ahab’s tracking of Moby Dick, and the certainty that the Captain possesses of his ability to find Moby Dick on the open seas .  Such a fixation is opaque at the book’s start, but is perhaps most manifest in his obsessive desire to track the individual whale by the sea charts kept in his cabin, to which he retires to read each night, and seem to provide the first point of entrance into his psyche–and what Melville calls his “monomania.”  As the ship moves over the seas, Ahab returns often to his cabin to read charts, maps, and logs, as map-reading becomes a keen emblem of monomaniacal fixation–as the belief that maps will help him track the whale that he is committed to kill.  The maps may magnify the sense of monomania, the psychological diagnosis of an undue expansion of mental attention on one object; if repeated reading the maps serves as an emblem of the growth of his fixation despite the survival of his intellect; trying to pursue the whale on charts seems to serve to focus his vindictiveness, as if materializing how the “White Whale swam before him as the monomaniac incarnation of all this malicious agencies which some deep men feel eating at them, till they are left living with half a heart and half a lung.”  Ahab’s fixation on the yellowed charts he unrolled on his cabin table express the monomaniacal tendencies defined in nineteenth century psychiatry of how an inordinate fixation persists in an otherwise rational mind; the fixation on mapping the course of the whale obsesses his attentive mind.  

Is the hope of locating the White Whale by the rutters of past whaling ships and collation of mapped observations an emblem of nourishing an undue fixation of his pathological preoccupation, despite his apparent ability to reason the possible path of the whale’s path?  The extended narrative of the ongoing quest for Moby Dick on which Ahab leads Pequod that fills the content of the novel becomes a sort of psychic profile of the obsessiveness with which Ahab takes the Pequod, and the novel’s narrator Ishmael, to encounter Moby Dick in the South Seas–the site of whale -spawning where the novel culminates.  The retiring of Ahab to the solitude of his cabin matches his withdrawal into his mind and serves to nurse his preoccupations.  What provides a more gripping image of Ahab’s inner psyche than the obsessive attention that he gives to tracking the White Whale by maps?   Ahab retires to consult log-books and charts to cull sightings of sperm whales that almost substitute for an actual map or rutter–and for the trust that sailors might place in maps and charts to guide the ship.  The problem of locating the whale s underscored by mention of the “wild suggestions” of many ships that have given the whale chase of an “unearthly conceit that “Moby Dick was ubiquitous; . . .  had actually been encountered in opposite latitudes at one and the same instant of time;” if”the secrets of the currents in the seas have never yet been divulged, even to the most erudite research,” Ahab seeks to challenge this sense of ubiquity through his obsessive consultation of charts, by following of the outlines of naval courses.  His intensity comes to transform his very brown and visage into a lined map, tracing out courses, so that his forehead comes to resemble a chart; reading maps with such obsessiveness to track his prey seems to remove Ahab’s single-minded pursuit from any oceanic transit, and from the common good of the ship that he commands.

Ahab’s monomania may seem sui generis.  But it is closely tied to the mapping project of Mathew Fontaine Maury and the contemporary project of collating open data on whale migration in Melville’s time, and the promise of investing legibility in a global space of whale migration.  Even more than the bodily injury of the loss of his leg that left him tormented with visions of the White Whale, the obsessive tracking and persistent consultation of charts and maps with other records manifests the idée fixe by which Captain Ahab is obsessed, and indeed the solitary consultation of these charts while his crew sleeps at night stand for the single-minded madness of tracking one whale on the open seas.  The folly of tracking the White Whale on a map embodies Ahab’s monomaniacal pursuit of a way to track its course by a paper map.   So fully does map-reading come to consume both his mind and his body as he ponders charts every night in his cabin, drawing new lines and courses by pencil, and revising them, “threading a maze of currents and eddies, with a veiew to the more certain accomplishment of that monomaniac though of his soul, so focussed on a map that, in a brilliant image, his tormented face even becomes a map, bearing the traces of the pencil lines traced on the charts, as if the subject of his fixation rises to the surface of his skin, so entirely consumed his mind by the conceit of mapping the course of Moby Dick.  The appearance of these self-inflicted lines as if engraved on Ahab’s brow–Melville’s image–echo the captain’s fixation with obsessively tracing multiple marine courses on the charts he keeps in his cabin; the courses that are so intensely pondered seem to rise to lines inscribed on his own skin as if in as a consequence of the imprint that tracing possible courses  of the leviathan has brought.  

The conceit of the tracking of whales on maps appears an emblem of Ahab’s madness, if it almost echoes contemporary techniques of Global Positioning Systems.  The utter hopelessness of locating one whale in an ocean map seems apparent; Ahab has indeed so often red maps to transform himself into a map hoping to locate Moby Dick, and the conceit of mapping whales has filled his mind.  Yet, as the “hidden ways of the Sperm Whale when beneath the surface remain, in great part, unaccountable to his pursuers, . . . the most curious and contradictory speculations regarding them, especially concerning [how] he transports himself with such vast swiftness to the most widely distant points”    Melville presents the problem of mapping the course of whales as one by which the crazed Captain Ahab is increasingly consumed, pouring over charts in the captain’s cabin, increasingly isolated at a remove from the crew including Queequeg and Ishmael, and the fate of his ship.  Although whalemen by their expert knowledge often came to the conclusion after the White Whale so often escaped their capture “Moby Dick not only ubiquitous, but immortal,” the presumption of mapping the course of the White Whale’s course is perhaps the clearest illustration and emblem of Ahab’s hubris, and monomaniac obsession with tracking the whale above the expert knowledge of his crew, as he “led upon the whale’s white hump as the sum of all the general rage and hate felt by his whole race,” so violently did he come to see personified in the whale that had once torn off his leg all evil in the world, and pit himself against it.  Maps provide Ahab with a basis to nourish and expand the “monomania  in him [that] took its instant rise at the precise time of his bodily dismemberment.”  If such a mania began he returned home, stretched in a hammock on his homeward voyage, swaying in a straitjacket in the rocking boat returning across the tranquil tropics, as “his special lunacy having stormed his general sanity,” he obsessed after returning to Nantucket with the one aim of hunting the White Whale.  Monomania had almost fallen out of favor as a diagnosis by 1850, when Melville wrote, but novelists from Balzac to Bronte adopted the image of mental fixation and unhinged rationality that Ahab’s reading of maps convey.  

Nothing in Mellville’s novel is so great an emblem indicating Captain Ahab’s madness than his obsessive consultation of nautical charts and maps of which he is a jealous custodian, and which provide the basis to nourish his determination to locate Moby Dick.  Maps may feed Ahab’s relentless compulsion to track the White Whale.  Ahab’s obsession with maps reflects contemporary attempts to map the open seas:  indeed, the superstitious value of the leviathan held a special place in the “wild, strange tales of Southern whaling,” and the deep sympathy of whaling men for their prey, who they know far better than those naturalists who have perpetuated false legends of their fierce animosity for humans, from Palsson to Cuvier, distorting the actual awesomenes of pursuing any whale tracking the Great White.  

Ahab’s obsessive reading of maps to track Moby Dick seems a figure for his monomania, but reflects an actual mapping project tracking whales on the open seas, which Melville knew well, and a project of mapping the logs of whaling ships in legible cartographic form.  Ahab’s use of maps to track Moby Dick mirrors the cartographical project of Matthew Fontaine Maury, the nineteenth-century Virginian polymath and early hero of open data, who in 1851 sought to map migratory routes of Sperm and Right whales or the benefit of the whaling economy.   If Melville often consulted histories of arctic searches for Northern Whales published from the 1820s, the appearance of an authoritative map of the courses of whales that Maury had accumulated from ships’ logs provided a model that attempted to impose human reason and fixed continuity on a whale’s migrating itineraries and paths, in order best to predict its actual location.

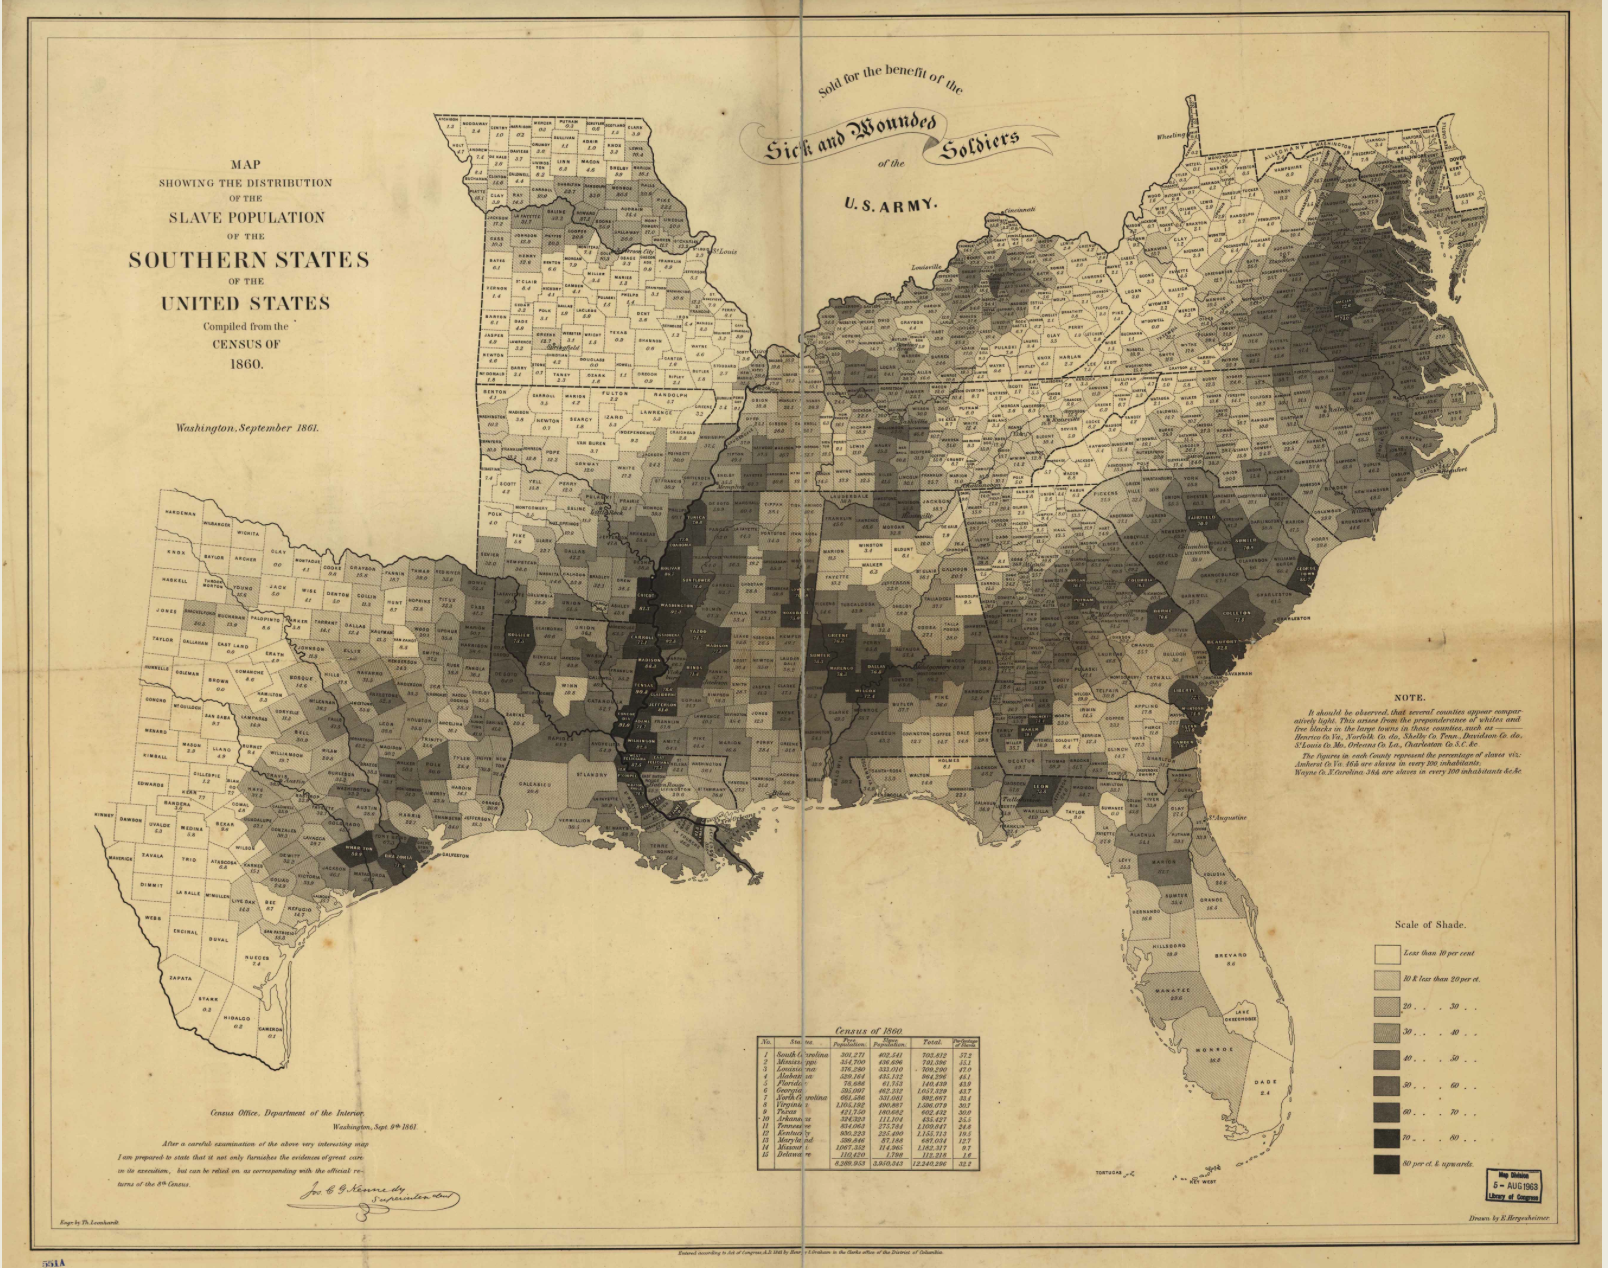
Ahab’s obsessive hope to track the course of the great white whale Moby Dick in the ship the Pequod may mirror the scope and ambition of M.F. Maury’s project–a project that led to one of the odder maps of marine population and migration that appears below, but which is one of the monuments of open data.   For Melville, however, Ahab’s mania seems driven by the hope the map carried for being  able to track  the course of the great white whale that his prey, and to arrive at the moment of confrontation that will in fact never appear on any map.  For unlike the observations Maury graphically collated, the specificity of Ahab’s tie to Moby Dick is not on the map at all.

Whale Chart 1851Maury’s Whaling Map; Norman B. Leventhal Map Center at the Boston Public Library

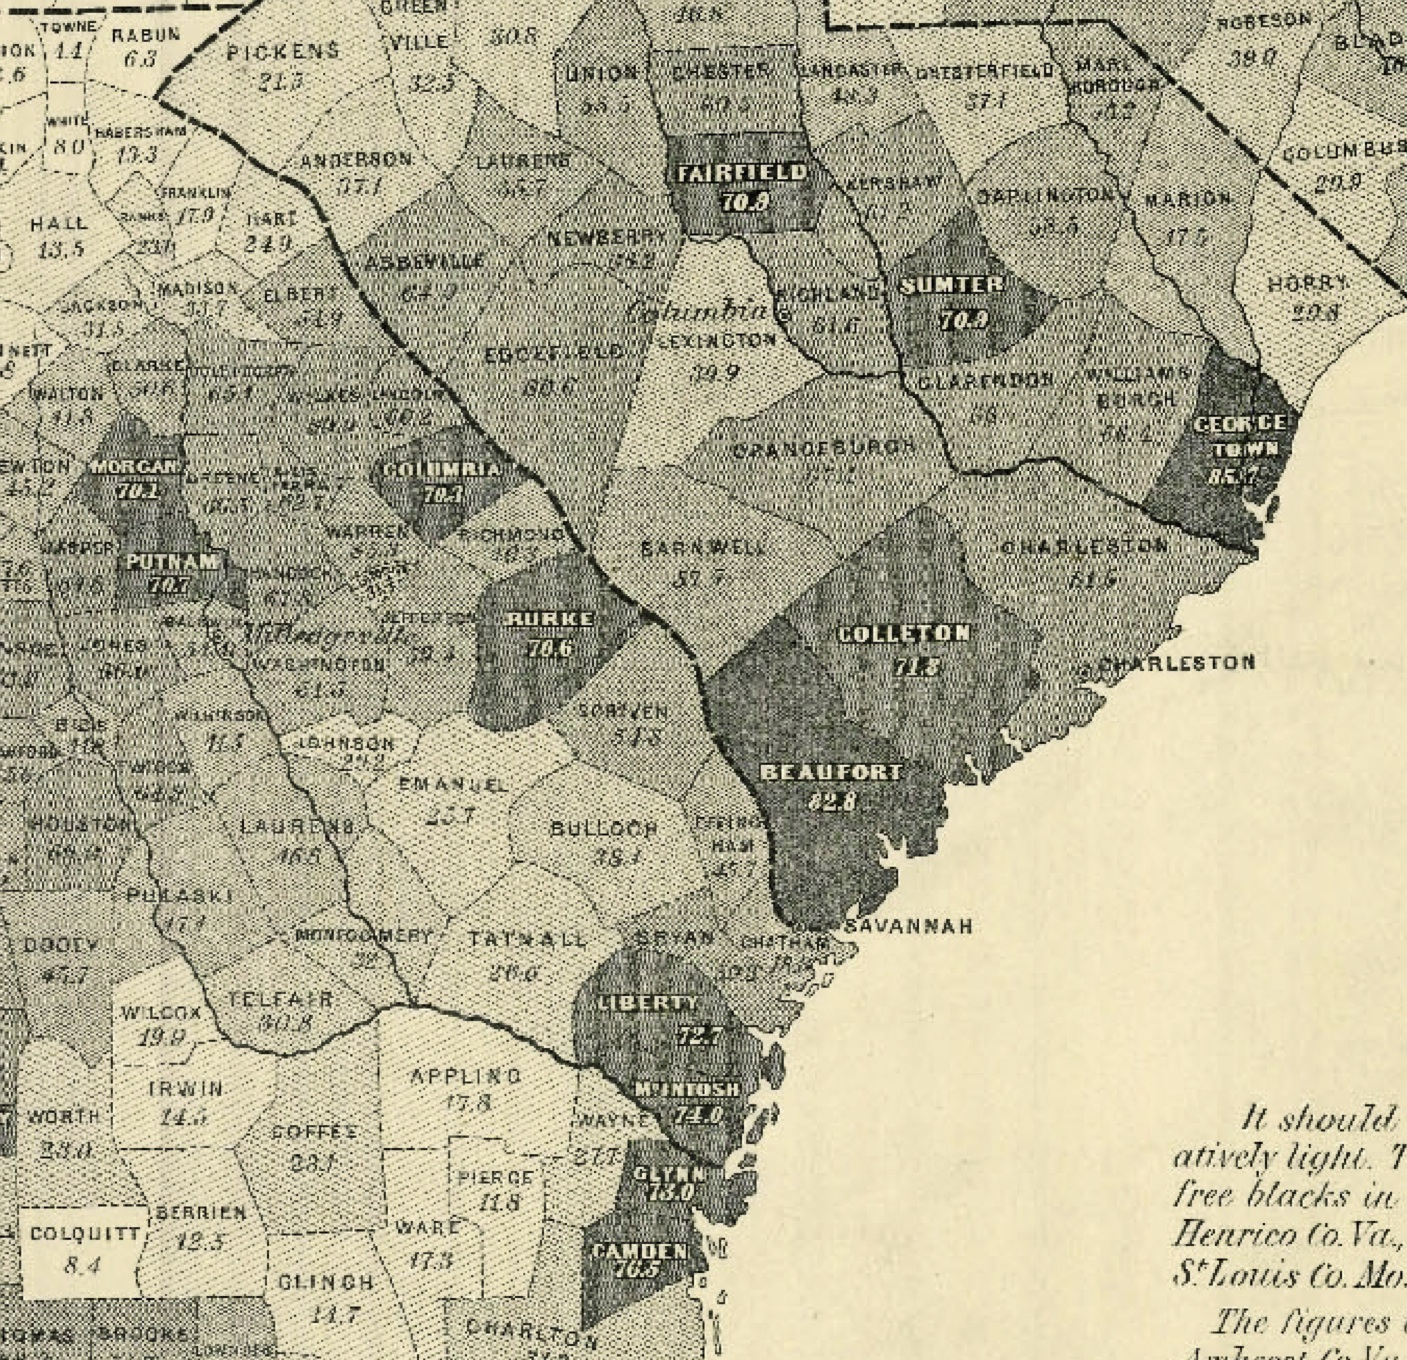
Ahab’s self-imposed sequestering on the voyage of the Pequod in his cabin, surrounded by a variety of charts, seems emblematic of his single-minded obsession to track the elusive Moby Dick.  It is emblematic of a uniquely obsessive sort of map-reading emblematic of his particular sort of hubris:  as he will never know the true path of the majestic whale, his study of the map symbolizes a contest between the mapping abilities of man and whale.

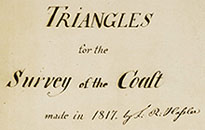
The private consultation of the map in the the secret space of the captain’s cabin reveals the sharp contrast between the whale as an innate cartographer who migrated across seas and the knowledge of routes inscribed in lifeless nautical charts, and the inability to plot or plan the intense longing for his confrontation with Moby Dick within the range of observations of all whales by traveling whale ships.  But it also offers an amazing fantasia of the reading maps and nautical maps as if they were guides to habitation, and a reflection on the nature of map-reading and the comprehensive claims of encompassing known space within engraved maps, and specifically of the colored charts of sea routes, whaling and sighted whales that the oceanographer Matthew Fontaine Maury produced in the 1850s compiling nautical logs of whaling ships, after having remapped the coastline of the United States from the geodetic Survey of the Coast by the Swiss Ferdnand Hassler, which had tried to fulfill the Jeffersonian dream of a nation facing two oceans, before joining the Confederate cause.

image.png .

We have little sense of the amassing of data that existed in Ahab’s cabin, so much as the intense relation that the captain develops to his charts.  Melville describes how Ahab retires to his cabin to open “large wrinkled roll of yellowish sea charts, spread them before him on his screwed-down table,” ready to set himself to “intently study the various lines and shadings which there met his eye,” and escape into the paths that they trace.  The memorable episode in Ahab’s own cabin focusses attention on how the captain’s obsessive consultation of the maps, as a sort of emblem of his search to capture the whale in them.   Ahab processed information in the map as best he could, and “with slow but steady pencil trace additional courses over spaces that before were blank,” while consulting log-books of previous voyages and noted sightings of sperm whales in a desperate attempt to locate the migratory path of the white sperm whale Moby Dick–whose own route he so obsessively seeks to understand and on which he fixates so obstinately. The reading activity is isolated and isolation, because the map is essentially mute, a second order of spatial knowledge with which he has no literal traffic or exchange, but becomes a way to wrap himself in further isolation from the mammal that communes with the productive fecund waters of the sea.  “While he himself was marking outlines and courses on the wrinkled charts, some invisible pencil was also tracing lines and courses upon the deeply marked chart of his forehead,” as every night, “in the solitude of his cabin, Ahab thus pondered over his charts, . . . threading a maze of currents and eddys [sic], with a view to the more certain accomplishment of that monomaniac thought of his soul.”

Such a collective map of the sightings of whales is both the focus and talisman of Ahab’s monomaniacal will:  both as the transcription of the paths of hidden submarine itineraries, “with the charts of all four oceans before him,” and the hubris of understanding the concealed migratory course of that noble whale with which he is so obsessed and that has long evaded his search.  For Melville confides that “it might seem an absurdly hopeless task thus to seek out one solitary creature in the unhooped oceans of this planet” to many; “But not so did it seem to Ahab, who knew the set of all tides and currents; thereby calculating the driftings of the sperm whale’s food, which whales were imagined to follow; and, also, calling to mind the regular, ascertained seasons for hunting him in particular latitudes; could arrive at reasonable surmises, almost approaching to certainties, concerning the timeliest day to be upon this or that ground in search of his prey.”  The privacy of the consultation of the tables that allow him to try to read this map, and to establish the position of the whale he seeks, becomes the basis for the captain’s obsessive hope to track the progress of the whale, better to interpret its location.

The intensive reading of ocean charts becomes a site of reading that obsesses Ahab as a means to determine and decipher the logic of its movement stand at odds with the description of the sublime nature of the sperm whale, whose own head cannot even be read without wondering at the majesty of the form of the “head of this Leviathan,” truly “an anomalous creature,” impossible to interpret or decipher, whose imposing grandeur is of such “god-like dignity” to defy human interpretation.  As the wonderfully described problem of the legibility of the “plaited forehead” of the Sperm Whale is a living surface that defies interpretation, inscribed with “innumerable strange devices for [its] emblematical adornment,” following not Euclidean mathematics, but rather “pure nautical mathematics,” the mapping of the course of the whale seems to defy tracking by Euclidean tools also defies reading, much as Melville described the sperm whale’s forehead forms a “mystically carved container,” the lines of whose face defy clear reading, as the “bumps on the head of this Leviathan” is a surface whose interpretation “no Physiognomist or Phrenologist has as yet undertaken,” and would challenge the abilities of Lavater–despite his study of animal faces–or Spurzheim or Gall, suggesting the intractable indecipherability of the whale, but whose “sublime aspect” and “added grandeur” Melville attempted, in the brow in which “mighty god-like dignity” is indeed “inherent” in a brow “plaited with riddles,” presenting Lavater’s mark of genius in the depressed crescent at its middle, in a brow “so amplified . . . you feel the Deity and the dread powers more forcefully than in any other object in living nature.”

As the brow of the leviathan remains challenging to be read, any hope of reading the map of the path it takes seems, despite Ahab’s desire and Maury’s map, Melville appears to assure his readers, as futile as a way locating the actual whale Moby Dick, but becomes an obsessing act of tracing, retracing, and location, that becomes Ahab’s obsessive interpretive project in Melville’s novel.  The fantasy of an ability to harness sperm whale as a medium or vehicle for global travel had appeared in the Currier & Ives satire on the California Gold Rush circa 1849, “California Gold,” that conflated value with the huge “Blower” a ’49er placed in a harness to steer his chunk of gold across the Cape Horn, rendering the prospect of laborious journey to California as a fantasy of the domestication of wild mammal put to use as a private frigate:  while the whale’s course was never to be so predictable the Currier & Ives cartoon suggested the appeal to a broad imaginary, a joke on global travel if not the presumptuousness of circuits around continents.


Continue reading

4 Comments

Filed under American literature, data visualization, Herman Melville, Moby Dick, open data