Tag Archives: farmers’ markets

Maps for Reframing an Over-Farmed Landscape

Agriculture maps frame the viewer’s relation to a settled expanse and farmed space.  They describe where we get our food, the intensive over-cultivation of regions of the midwest, and chart the changed fertility of cropland that have been the consequence of large-scale industrial farms in recent decades–and offer something of a basis to orient us to their configuration but to calculate their consequences.

Maps offer a palimpsest of our recent reshaping of the rural world and our relation to cultivated farmlands.  As such, they bridge the remove of most Americans from an agricultural world in ways that we have, as shoppers in malls and supermarkets, largely forgotten and moreover distanced ourselves from.  The distance is all too evident in our shopping habits and expectations for the year-round availability of fresh produce–even if we shop in Whole Foods.  Rather than mapping farmlands’ fertility, they try to map the active recreation of the rural as a site of economic activity, as much as an ecological unit:–a recreation underwritten in our current Farm Bill, even though few seem to have familiarity with the extent to which  Department of Agriculture subsidies have informed the geography of farmed lands.  For although nearly 54% of the continental U.S. is devoted to agricultural land–a slightly larger amount than the 40% worldwide–almost 99% of folks in the United States don’t work on farms.  The geographic and conceptual remove of these maps from rural life stands at odd ends with the fact that most policy-making decisions occur across a rural-urban divide.  Indeed, the disconnect between most Americans’ lifestyle and the growing spread of large farms in rural America suggest salutary benefits in perusing the wide range of maps from open data to immerse oneself in the quandaries of sustaining rural productivity in an age of increasing food demand.

For this is how we largely use our land:  world-wide, an area approximating the size of South America is dedicated crop production, and far more—7.9 to 8.9 billion acres—to raise livestock.  If this division does not seem that effective, we might begin from how the devotion of our own landscape to agriculture an effective form of land-use.  For this landscape provides a model for how macroeconomic interests have altered the relation to the agrarian landscape worldwide.  Despite the continued romance of the pastures and crops we produce, the mapping of agriculture productivity is particularly difficult in the failure to define the multiple adversely impacts on national farms–a problem that seems multiplied by the disconnect between most politicians from our agrarian landscape, and, indeed, most concepts of space and our agricultural space–both of which have led to a disquieting hybridization of our political and agricultural space that demands to be untangled.  In an age of data-driven maps, the static images of data visualizations may seem out of date.  The layering of visualizations however challenges viewers to assemble an image of urban-rural relations across the lower forty-eight–by concretely mapping and rendering evident such variables as crops in farms, farms in the land, the folks in the farms and the cities–that can provide a portrait not only of where we are, but of where we’re spending money, and how we might better conceptualize the fertility of the land we farm.

If all maps give visible form to data, maps of our agrarian landscape also create data for their observers in powerful ways.  Agricultural maps of land-use deserve to be examined for their inter-relations, as much as for what they ‘say.’  No single visualization should be taken as an image of the farmed landscape–but rather offer a point of entry into that the forces that shape the landscape and the very contested views of our national cropland, and what might be appreciated as the shifting ‘cropscape’ of an increasingly post-rural world.  (Even if over 90% of the farms in America are small and, for a variety of reasons, family run–96% of farms with cropland are family run, producing some 87% of the total value of crop-production in 2011, according to the USDA’s Economic Research Service, based on data from the Agricultural Resource Management Survey–the landscape is increasingly defined by large agribusiness, and by how such farmers react to a market of global futures as much as national or regional needs.)  The expansion of our agrarian land has been mapped by William Rankin, whose “World Cropland” (2009) provides something of a base-line for the conception of the temporal expansion and intensification of farmed crops.


Agriculture-landuse-2000William Rankin, courtesy Edible Geography


The layered images of farmlands that I consider in this post create a basis for future interactive analysis.  Even without snazzy animations of time-lapse imaging of Google Earth or Google Earth Pro.  By doing so, this post hopes to raise questions about how the relation and use of cropland to American agriculture might be most effectively mapped to would bring greater familiarity with the dilemmas of farming and agricultural practices.  At a time when most are increasingly more unfamiliar with the organization of agricultural life that with the rising of the tides, we are all too ready to view agricultural practices in a purely macroeconomic–rather than environmental–lens.  Although we imagine the agrarian landscape as an unconstrained or open space, the visualizations offer insight into what  might be best be understood as a complex mosaic not only of individual interlocking ecological regions, as this ESRI visualization of the High Plains, Corn Belt, and Great Plains, but a complex economic dynamics it conceals.  For despite its accuracy, and the differences between bioregions and eco regions, the unified landscape indeed conceals the divides created by the now dominant (if warped) view of each eco region as a source of crops on a global market–a view that has informed the rural landscapes over the past twenty to thirty years, from corn belt to the wheat fields to High Plains.


ESRI Ecoregions


For as much as map nature, the division and conceptual of agricultural space in America is effectively under-written by the world market’s orientation to its products, rather than to the individual farm as a unit of farmed land.  There has been something of a cognitive re-mapping of the national agrarian space, not only in terms of the needs of local bioregions or the diverse needs of bioregions that distinguish the alleged uniformity of agrarian expanse, that turns around the greater significance of cropland as a term of economic value, based on the extraction of grain or grasses from the land, distinct from the management of agriculture.  The change in focus–and indeed of conceptual mapping–might allow us to look at the very same verdant terrain in Moscow, Idaho in markedly different ways, even before we’ve begun to map the variety of local crops.


Moscow, ID


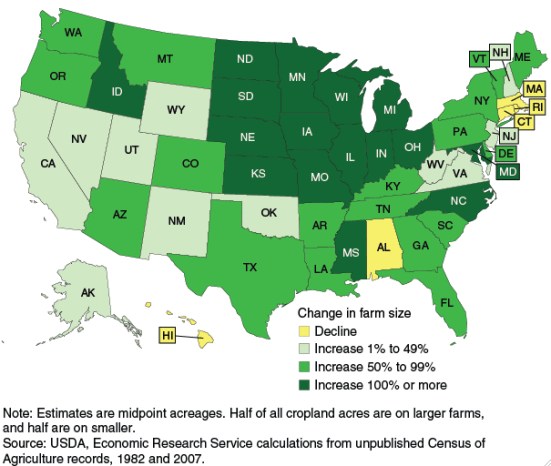
The increased extraction of goods from crop lands–from corn to ethanol to silage to switchgrass–instills a view of the commoditized landscape, more familiar from contemporary images from real estate maps of land-value than to the locally or spatially situated sense of agricultural land in a specific landscape.  The  shifting nature of the farm has altered the agrarian landscape in recent times:  despite some debate on the future of the family farm, the deceptive average stability of the size of farms has masked the rapid expansion of small farms that has paralleled an even greater expansion of large agribusiness.  The consequent conversion of most farming acreage to cropland of far larger farms has created quite new processes of food production:  if the mean size of a farm is 234 acres, most cropland is on farms of over 1,000 acres, and over a third on farms of over 2,000 acres.  We have seen a very recent massive increase in the sizes of farms in the corn belt and northern plains–two areas where they have more than doubled in acreage and productivity, no doubt partly in response to agricultural technologies, fertilizer, and farm-seeding, as well as to the reclamation of grasslands.


Decline of Small Farms


Something of a tipping point may have arrived in the expansion of farm size in these regions of the central United States, and the power of the economic investments behind them:  the ecology of the landscape threatens to become replaced by the commodities we extract and map in them.  By mapping the dedicated mass of biological production across regions of the country, we can se the warping of the nature of land-use that we have perpetuated in recent years, as the practice of fresh farming has become overwhelmingly concentrated in pockets of high-scale production, whereas we abandon most land to consumption in shopping malls or residential tracts, and confine a density of large-scale farming to parts of Iowa, Illinois, and North and South Dakota, and Arkansas–and one pocket eastern Florida, California and Washington.


map_biomass_crop_residues

A similar change might under-write, in multiple senses, the reframing of the agrarian landscape of the United States as a source of investment rather than view it as a single or united landscape:  provocative data visualizations of farmed land in the United States suggests that we have long ago passed a similar sense of tipping point.  Data visualizations are supple tools to chart notions of cropland and pasture are less rooted in place and space, and mark the results of viewing the farms in extractable units–corn or animal feed or soybeans–that shift agrarian wealth from the fertility of the lands and bounty of a region, into a map of value and investment, and often of intensive production, fertilization, and even GMO crops.

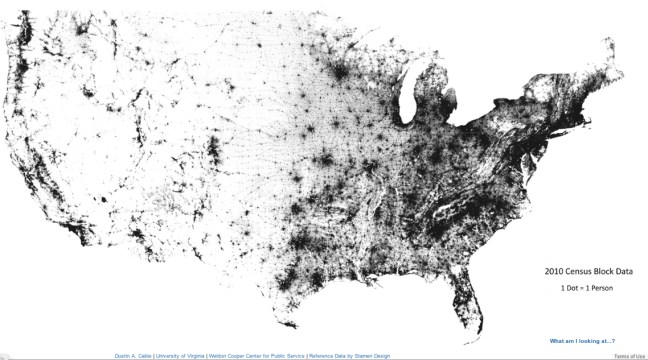
There is something paradoxical or perverse about using data visualizations as a record of landscapes, and the end is not to aestheticize data visualizations as cognitive tools–although the visualizations offer quite provocative by their colors schemes alone:  the images by which the conversion and farm management of the region has created offer interesting images to meditate on both the construction and the future of crop lands, and relative coherence of the concept as a viable construction of the agrarian space with which we live and to which we are deeply attached in ways that cannot only begin to be mapped.  Such visualizations of the continuous forty-eight are a useful place to begin to visualize the transformation of cropland, because their qualitative depth presents such compelling pictures of the community and of how its inhabitants use its land.  Take, for example, how Dustin Cable’s mapping of Census Data by one dot per person, on Stamen design’s base-map of the nation, affords a clear division in population just west of the Mississippi River.

Census Block gaping hole west of Miss

1.  Cropland, increasingly located in the less inhabited region between the High Plains and west of the Mississippi, has been shaped by the devaluing and reframing of cropland in terms of how much can be extracted from investment.   Even in the face of new stressors on agricultural land-use, from rural out-migration to the decline of the family farm to the decline of hospitable local environments, and the government under-writing of agribusiness and large farms:  crops are valued have combined to create a new agricultural landscape and concomitant foodscape that was more often linked to a macroeconomic context, in place of questions of how food can get to the marketplace.  The expansion of transportation has effectively removed what food we eat from where we live for most.

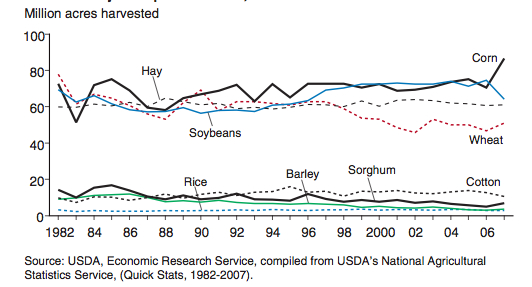
By reconsidering the range of forms of mapping farms and the use of farmlands, we must consider the landscape of farming in which we increasingly live, even if our food rarely derives from it. US farming incomes have appreciably risen since 2010-11, attracting some financial markets, but the dynamics of farming are too often based on models of extraction, rather than of nurturing the local landscape.  As the production of corn has increased, since 1980, 400 percent, soybeans 1,000 percent, and wheat 100 percent, as US Secretary of Agriculture Tom Vilsack has noted, largely based on agricultural technologies and machines, including GPS seed drills, combines, and tractors, the mapping of farms have relied on being under-written by tax dollars to the tune of 30-50% by government agencies that have less regard for the mapping of farmlands.  If crop insurance has helped to increase productivity some 50% since 1982, the expansion of farming technologies have shifted attention from the ecosystems and landscapes:  cropland used for crops declined almost uniformly by about 50% since 1982, especially in the Northern Plains, and land-use for crops by 13%–at the same time as the amount of land dedicated to pasturage markedly increased.  Corn, soy, wheat, hay, cotton, sorghum and rice traditionally constitute the bulk of farmed land; corn, soy, and wheat remain the largest cultivated crops, but the production of corn has peaked.

Millions of Acres

The range of visualizations of the changing face of farming and consequences of the emerging landscape or foodscape have neither been fully calculated or understood, and, even in an age of continuous LandSat photographs of the nation’s land cover, is challenging to map.  The proliferation of maps of farmlands, from Landsat images of cropland to the expanse of regional farms, suggest a compelling illusion of coverage and expanding food production that may offer a less reliable guide to an actual landscape being devoured by agricultural machinery:  if our agricultural policy is intended to bolster the strength of its remaining crops, policy has changed the landscape based on macroeconomics more than on-the-ground decisions, often ignoring place and space as construction with  monocrops such as corn, soybeans, or grasses that are far from demand-based.  The scarcity of water for irrigation in large part need to take stock of irrigation practices in such intensively farmed lands, in the hopes to “provide a better accounting of water use, cropland productivity, and water productivity.” The consequent proliferation of satellite-based remote sensing of farmlands provide an archive and a mirror of land use that may evoke the fear of a new form of agrarian surveillance–albeit one to encourage agreed best-practices of water conservation–but rather offer a feed-back loop to survey the recent transformation of the landscape that the reframing of national farmlands has wrought.

The striking concentration of farmed acreage in the central ten to eleven states has created a quite dramatic imbalance between the demand for agricultural subsidies and desire to control wasted water that has been so sharply contested it is difficult to agree on among elected legislative representatives.  Is it possible that special interest groups might gain greater sway in the manipulation of maps to chart future agricultural policy?


Farms in America


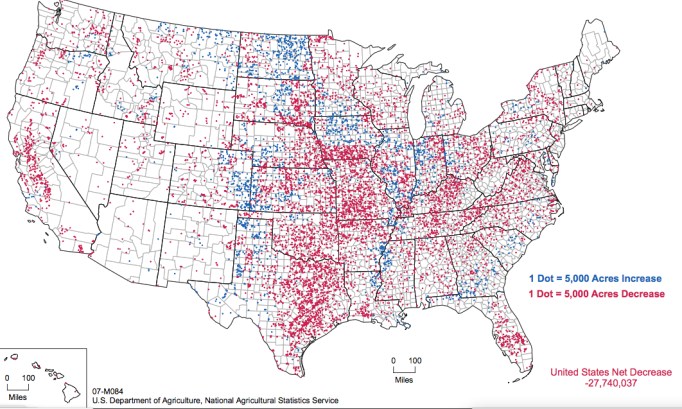
It is striking that during the period of just 2002-7, the acreage devoted to farmlands intensified in those central states, even as the nation saw a dramatic reduction in agriculture’s spread.


Change in farmed acreage 2002-7


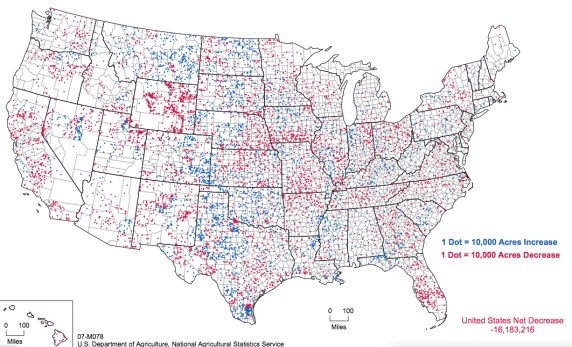
The identical period was marked by a decline in farmed cropland acreage across the entire nation that exceeded 27 million acres, a loss apparently predominantly located in the central United States, as well as California’s Central Valley and the rural South, from Louisiana to central Florida and West Virginia:


Declining Cropland USA 2002-7


As of 2007, concentrations of those farms operated either by families or individuals were uneven in the very same regions of the central states, and in the north-central states dropped to less than 75 percent.


Farms Operated by Families or Individuals--2007.

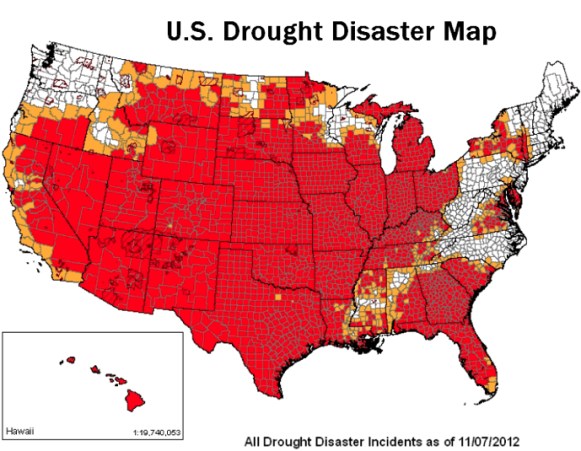
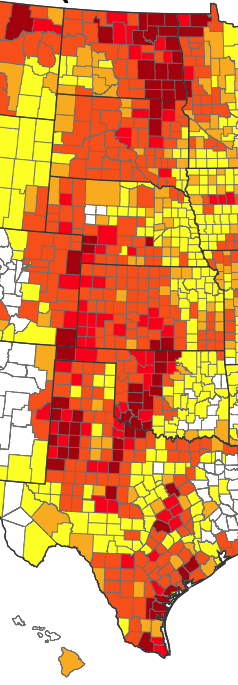
At the same time, national drought placed undue pressure on farms to maintain their profitability, as this map of the counties affected by drought through 2012, compiled by the USDA’s Farm Services Administration–and who are compelled to take up drought insurance–seems to make clear.

Primary and Contiguous Counties of Drought, USDA FSA


2.  Maps of agricultural production reveal the increasing remove of an agricultural landscape of the nation from its cities, and from large urban areas–and indeed concentrated in a relatively restricted region of the central United States.  Of the 2.3 billion acres in the United States given to agriculture, in 2007 just under one-fifth were dedicated to crops (408 million, or 18 percent)–a number that had decreased by some 34 million acres over 2002-2007.  The claim to map the comprehensive changes in land-use and land-cover in the coterminous United States from 1973 to 2000–the broader goal of the professional paper–by local surveys and satellite imagery and remotely sensed data–begins to document and explain many of the deeper changes in contemporary land-cover change, to which this post returns below.

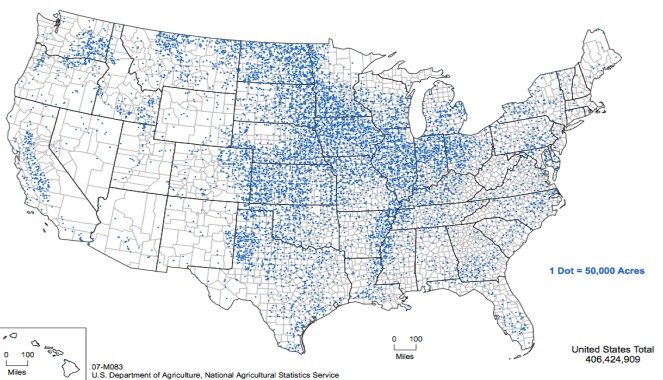
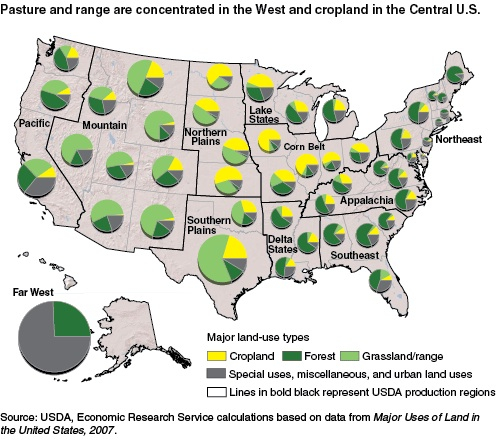
The composition of farmlands in current years suggest a marked concentration in cropland.

Cropland in USA (2007)

13sept_feature_macdonald_photo

The notable concentration of cropland at a remove from urban markets (noted in grey sectors of wheels in the above data visualization) and at a remove from population concentrations defines something like a belt of government subsidies that sustain large regions of agriculture–often of monoculture crops–that are abstracted from actual patterns of habitation.  It is impossible to map how this concentration of cropland came about from a disinterested point of view, but data visualizations offer a fragmented view of some of the narratives by which the landscape has been and is being shaped, and the distorted notions of place and space that they generate:  the visualizations suggest a range of narratives about the effectiveness of agricultural subsidies,  the foodscapes created in the rural United States, shaped through the changing relation of farming as an extraction of value from the landscape, rather than as a response to local economic needs.  The shifting optic that stresses the relation of the landscape to the national economy has re-framed the landscape’s fertility.

Rather than providing a coherent “map” of the agricultural economy and government investment in farms, data visualizations offer snapshots that provide a sense of multiple narratives that shape the relation to the new rural landscape.  The somewhat fragmented picture they offer present several narratives about how we’ve come to regard the farming of the land, and present questions of how to unite or reconcile the varied and discordant narratives we’ve come to tell about our tutelage of an agrarian landscape and how to best meet its needs. And they don’t add up to a collective image of a landscape that is designed to be habitable over the long term, let alone economically viable.

The problem of all these maps is how to visualize–and conceptualize–or relation to the collectivity of farmed lands that could best take account of their variety.  Indeed, the possibility of mapping the mosaic of agricultural productivity must begin from remapping their relations to regional needs, in ways that are obscured by privileging their relation to commercial products and food markets, as opposed to food needs–or the value of locally produced food.  The multiple mechanisms by which the state and government has chosen to invest in agriculture–and promote the production of certain products on farms, to the exclusion of others–have historically shifted away from  traditionally microeconomic understandings of the farm and rural agriculture to more macroeconomic questions in ways that are difficult to map, but have rewritten one’s relation to the land and the obscured the landscapes that they have begun to change.

3.  The remote-sensing of shifting maps of land cover in the United States is extremely of the moment, and not only for the impact of climate change.  It may be odd to present data visualizations as a landscape, but as indices of both productivity and indebtedness, regional map-based visualizations offer ways of thinking about how the land is seen in ways that have not yet been fully understood.  For if the mapping of rural America and its agricultural productivity are increasingly contested, the landscape .  Maps of farm subsidies offer telling mirrors of the extent of government investment in agrarian expanse.  They provide a sense of the expectations for the value of land-use, and frame the image of productivity one would want to produce:  but they are also the result or end-product of the negotiation of local demands, by tracing an image of the changing face of farmed land riven with debts, subsidies, relative lack of profitability and indemnities, the bulk of which go to larger farms, that expand to make up for the sizable decline in farmed acres.

When we map the huge levels of out-migration that occurred from 1980 to 2000–or from the Clinton years to the Bush years–marked by a decline of the population of the so-called “corn belt” in Nebraska, Iowa, southern Michigan, and Kansas–we can see the changed character of the rural landscape in America, as much as by the huge decline in crop diversity about which I’ve blogged in relation to the expansion of agricultural production that has been fed by agricultural subsidies–monocrops that maps of food reveal as having far less reference to a region or place, at a remove from urban areas of consumption that do not best serve populations.  The shifts in settlement away from the central US were clear long before 2010, but the distribution devised by Dustin Cable maps from that year’s Census maps a starkly blank central and west, into which extend feathery wisps, clinging to roads and interstates, the new rivers of rural settlement.


Dustin Cable's Census Block Data Divide

The long-term but recently drastic population declines from the Great Plains and Corn Belt have been a prominent back story on the remapping of American agricultural diversity, as has the declining revenues and work associated with farmlands, often worked by fewer and growing crops with greater intensity; losses of population in rural regions orient the viewer to the shifting national foodscape, whose image of dwindling population in non-metro areas reveal stressors on the economic structures of rural agriculture, and of the relation between urban and rural lands, or between the expansion of farming to meet the population growth of urban areas.   (This population shift that can also be charted by the expansion of “Heat islands” of “impervious surface area,” paved urban and extra-urban areas, mapped by Landsat images and night-time lighting, that exert disproportionate influence on climate change and remove a sense of urban settlement from agricultural space.)  The loss of populations to some extent mirror the decline of family farms and rise of agribusiness, which tries to meet growing population needs.

rural-pop-loss-map Economic Research Service


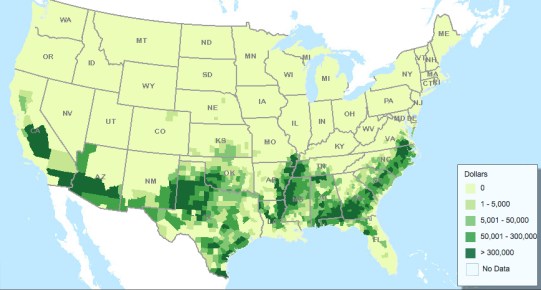
This picture gains another layer of complexity once we consider the infusion of government subsidies to agriculture in the very same states–subsidies inflating monocrop cultivation that have created a new map of the country’s farmlands, over the decade dominated by the previous Farm Bill, and created a new and unprecedented level of indemnity and indebtedness in farms that are now considered as cropland, but often face too little water to be productive.  While funds were distributed, they were concentrated in the same area where economic profits declined, and family farms shuttered–and an overall decrease in cropland nationwide was offset by increasing amounts of land dedicated to pasture and grasslands, according to the 2011 USDA ERS report.  There is a tortured logic of dedicating increased land to corn and silage as animal feed:  since it takes 10 to 14 pounds of grain-based feed for a cow to gain 1 pound of flesh; subsidizing animal feed is an outrageously uneconomic way to produce our food supply–although the international market for American meat is high.

subsidies-map499


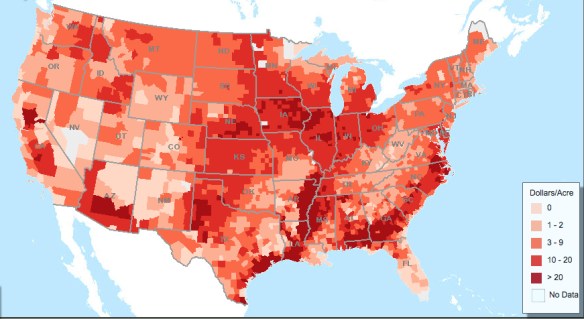
Many of the same farms and acreage of farmlands are enrolled in federal crop insurance, changing the complexion of farms and character of government subsidies for land and increasing fear of their indemnities–and an increasing amount of farms enrolled in insurance programs nationwide, but especially dense in areas where state farming programs are established.


Acres Enrolled in Crop Insurance--2007

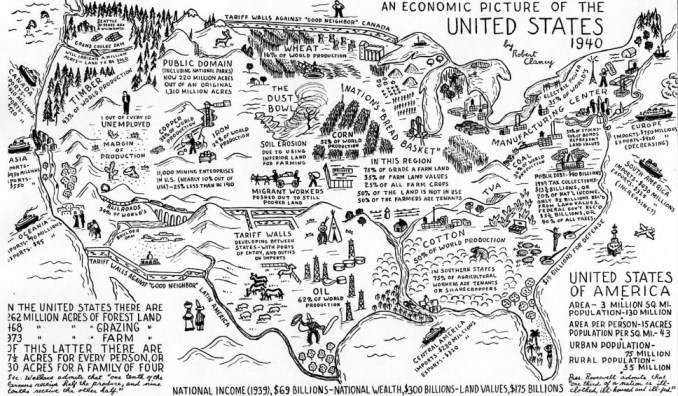
4.  What are the reasons for this investment, aside from the desire to keep the local economy afloat in hard times?  Despite the relatively restricted regions of intensive planting of subsidized crops, we remain tied to the mindset of a picture of the nation’s economically productive landscape as it was imagined circa 1940, when one-third of the world’s production of corn came from the central states, and half of the farmers in the central United States were tenant farmers:


An Economic Picture of the US 1940


The current agrarian landscape has sharply diverged from one where 62% of global production of oil was located, 52% of the entire world’s corn was harvested and Grade “A” farmland existed across the Midwest. But the attempt to invest money in the landscape to bolster its production of economically desirable products that might perpetuate this image, even at the expense of local farms and rising levels of indemnity.  Protectionist legislators have continued to write into and perpetuate in our most recent national Farm Bill, although that landscape no longer exists, even if it struggles to support the image of a fertile range of grazing and farm land in the “Nation’s Bread Basket” in a land where subsidies are crucial and indemnities endemic, and local ecologies often overlooked.

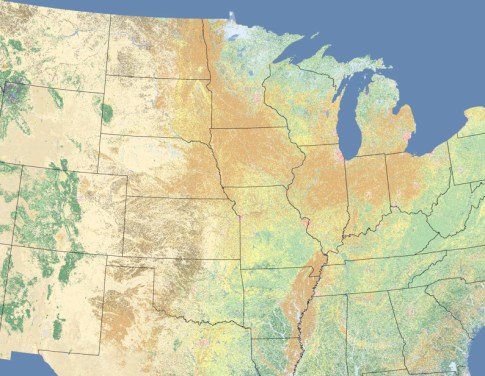
The more restricted areas of cropland, combined with the recent expansion of federal subsidies to certain areas, regions, and crops reflect the relative constraints of crops within the national land cover–whose row crops are measured below across the coterminous United States–can be traced from 1992 to 2006, with special attention to relations of row crops (light brown), pasturage (yellow) and shrub lands (tan) in the central states–noting the tortured logic of dedicating cropland to animal feed if it takes 10 to 14 pounds of grain-based feed for a cow to produce but 1 pound of animal flesh.

Midwest Landcover in Tan row crops

1992 Landcover icons

Row Crops 1992 v. Pasture and Shrubland

The Multi-Resolution Land Characteristics Consortium from 2001 reveals deep inroads of grasslands–with a slightly changed color-scheme–at a stunning spatial resolution of thirty meters, using remotely sensed Landsat Enhanced Thematic Mapper+, to differentiate land cover, and show an expanding northwest and midwest, even if the changes are slightly exaggerated by a stronger color spectrum–in which it almost seems that the physical remove of these row-crops from agrarian needs creates its own internal economy of production that has altered how cropland is conceived across the central states.

Landcover 2001 mapUSGS Land Cover Institute (LCI), 2001

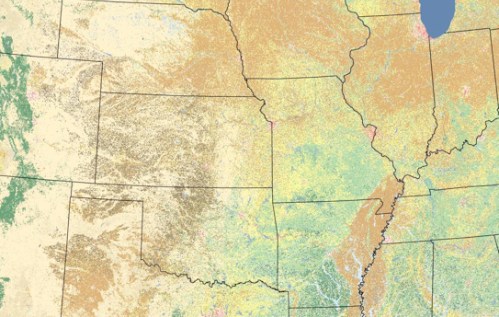
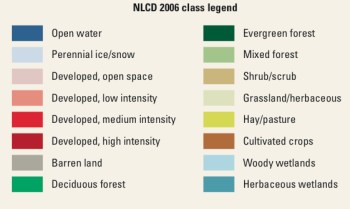
The 2006 wall-to-wall land cover database, although it groups crops collectively, shows increasing inroads of pasture (yellow) and grasslands (lightest green) and slightly diminished cropland:


Land-Cover 2006

NLCD 2006 Legend

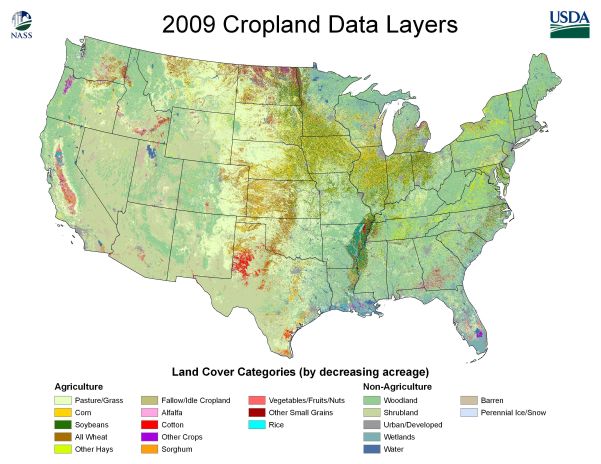
It might be compared to the highlighting of pasturage in a lighter almost neon green in this USDA map of cropland layers of 2009:

cropland-2009-us


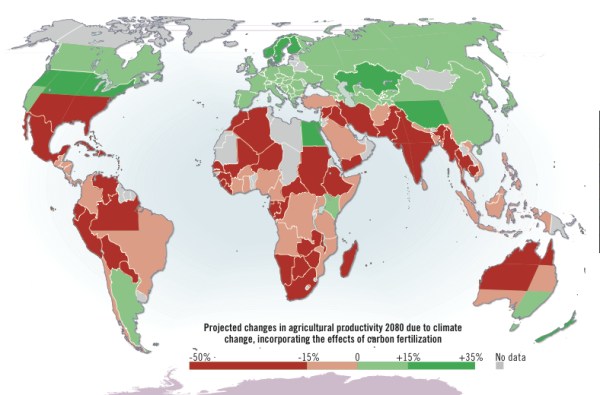
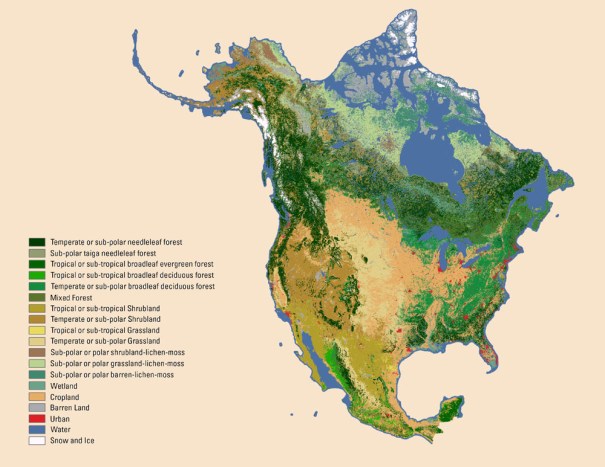
5.  The increased incursion of grasslands, pasture, and silage into the cropland in the cover layer conceals the deeper changes in the organization of agricultural expanse–but also masks the sort of crops that are growing in each region–including the expansion of corn and soy.   Given the complexity of processing these groundcover maps, a sequence of data visualizations might reveal as a radically changed landscape both of government intervention and of expanding monocrops.  As a point of contrast, however, the North American Land Change Monitoring System monitored the land cover of all North America in 2005, using Moderate Resolution Imaging Spectroradiometer (MODIS) to reveal the far greater expansion of cropland to the north–an area projected for greater future productivity of crops such as wheat, due both due to lower rising temperatures and the expansion of arable land for growing wheat, canola, and barley in all Canada by 15%  in a 2008 United Nations’ Environmental Program map based on predicted “increased temperatures, precipitation differences and . . .  carbon
fertilization for plants,” while American productivity of crops is predicted to drop some 15%-50% on account of the impact of climate change.


agricultural productivity, projected


The image of arable land above the 48th parallel indeed seems much more expansive, anyways, and even far more fertile with crops today–not only due to a different structure of state subsidies, but also to different agrarian practices, and a high-speed rail dedicated to transporting grain to across the country.


2005 North American Crop Land

The relatively restricted cropland in the United States was balanced by, oddly, an expansion of land dedicated to agribusiness crops that were less dedicated or directed to the dining table, and to an increasing mountain of investment in ostensible farmlands.

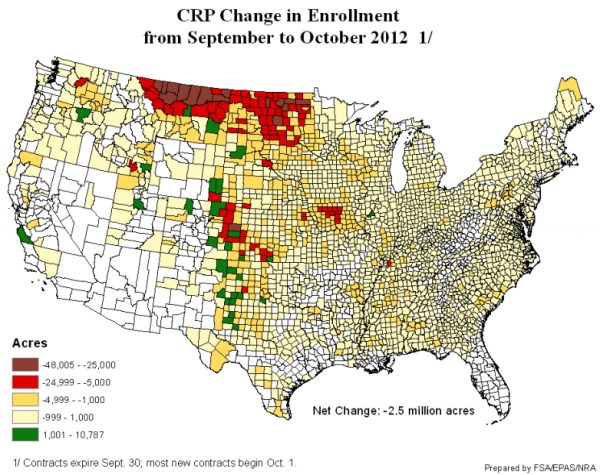
There is some evidence for the bad effects of the unmitigated expansion of row-crops in the landscape of the central United States.  For the area of American cropland include a conversion of a substantial amount of land–2.5 million acres–from the Conservation Retention Program to the growing of soybeans and corn in North Dakota and Montana, creating some total plantings of some 97 million acres on formerly CRP lands since 2007, largely to the benefit of large agribusinesses who employ monoculture plantings, with a huge impact on the local landscapes.

Conversion to Cropland:Corn

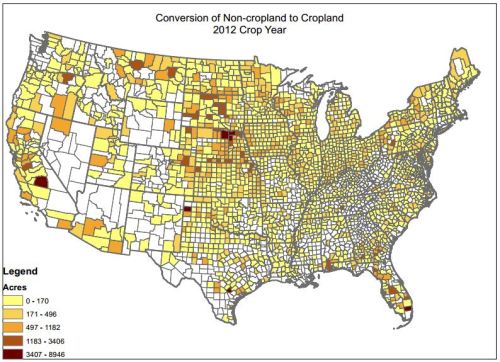
The distribution across the country partly reflected a new “map” of how agriculture gained USDA appropriations to expand the growth of crops that might not necessarily meet food demand.  Although the investment in agriculture lumps subsidies, disaster relief, crop insurance premiums, and conservation programs in an area effectively costs the nation; questions of such spending are perhaps too significant to be determined by guidelines of a single Farm Bill.  In this map, farms have increasingly met needs for feed, fuel, and fiber, even while using less cropland to do so–and the design for subsidization was warped through the different agribusiness and corporate interest groups that may well have led legislators to concentrate resources in specific legislative districts, with limited  investigations of their long-term effectiveness.  Despite a massive conversion of nearly 400,000 acres of grasslands into cropland in 2012 alone, such “sod-saving” provisions in the Farm Bill are difficult to secure; states so notorious in converting grasslands to agricultural interests–like Florida, Nebraska, or South Dakota, and Iowa–to be known as “Sodbusters” seem indebted to the promise of jobs that big ag might secure.

cropland-conversion-map

A similar logic seems to play out in the receiving of agricultural subsidies to encourage the development of farmlands, most often with an eye to farm futures rather than local needs.

Sumner-Eddyville-Miller FFA Chapter (1)_thumb

farm-web-g

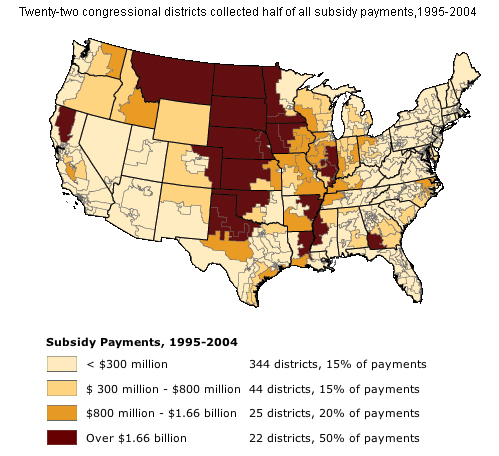
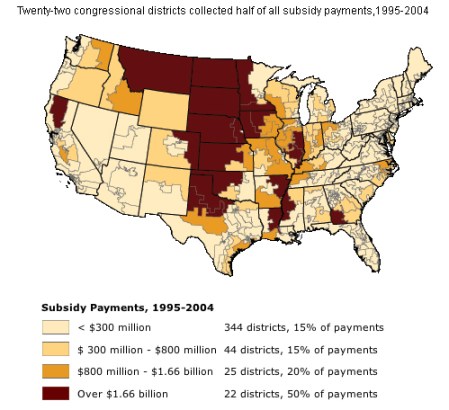
As a result, states are not directly subsidized–or farmers, for that matter–but the Department of Agriculture allocates funds to districts, creating a new map of the economy, as much as a map responding to needs of crop-cultivation or food-needs, based on this map of subsidies collected in bulk by some twenty-two congressional districts in the decade 1995-2004.

subsidies-map499 with payments

6.  Such representations reflect the realities of the shifting agrarian landscape.  They offer resources to refine our picture of the land by delineating varied concentrations of national resources by government investment.  These representations of agrarian landscapes serve as a gauge to negotiate our relations to reality, as much as to measure them, placing into visual relief how we project value onto agricultural landscapes without attending to the specificity of their character–and tend to link value to the continued economic productivity of rural lands in ways that deny local changes.  This even extended to the conversion of much “highly erodible land” (HEL) into cropland for moneys from 2008-12, often to intensify the farming of subsidized corn and wheat, filling areas from Montana to Texas that are centered in what was once a Dust Bowl devastated by persistent drought.

2008-2012 acreage of eroded land to crops

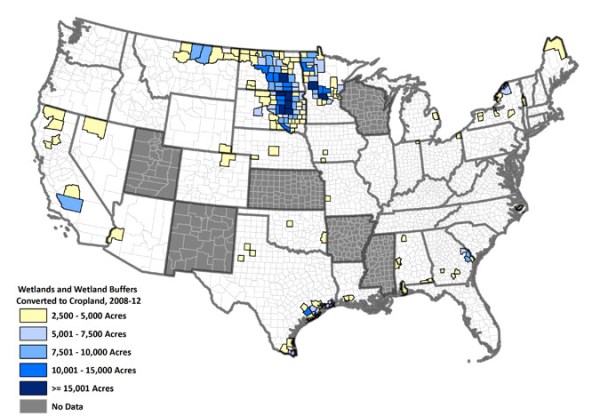
This occurred even as large numbers of wetlands, also important wildlife habitats of their own, and wetland buffers, were were also being converted to cropland in many of the same regions of the Dakota prairies, Montana and Minnesota, adding up to a loss of far over 15, 300 acres each year from 2001 to 2011–most (60%) in order to plant corn and soybeans.

Wetlands to Croplands

The individual county costs for such conversion of such acts of bad agricultural stewardship averaged, in the case of counties loosing wetlands, $10.1 million, and in counties of highly erodible lands $5.8 million–four and two and a half times the national average respectively.  And particularly notable seems the expansion of conversions of either both wetlands and highly erosive lands (framed in violet), or either wetlands (framed in sky blue) or erosive lands (framed in light green) both in Montana, upstate and western New York state, Texas and in northern California, suggesting a diffusion of bad practices of land-reclamation at much cost.

Raw_Idem_Map_revised

Farming Subsidized Corn

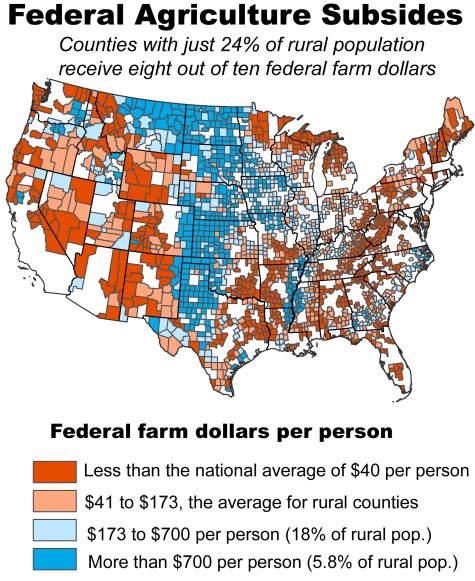
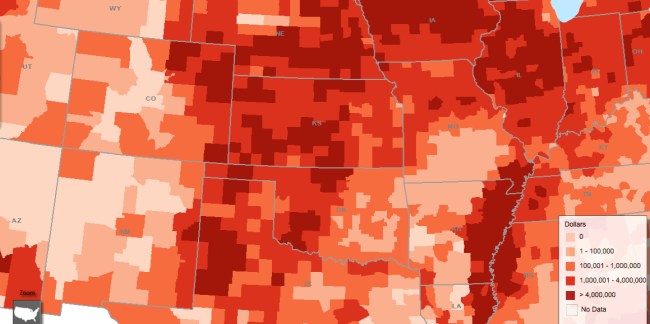
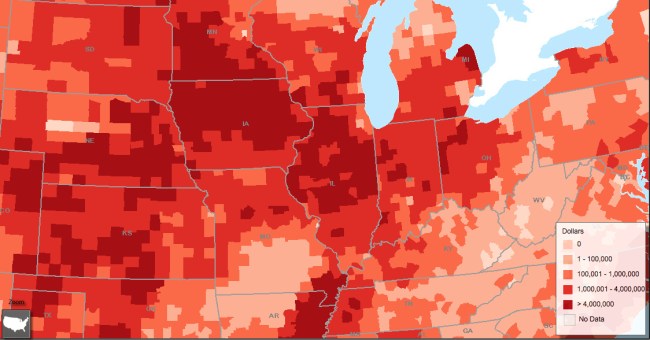
7.  How much does this actually cost the government?  And is this level of investment and subsidization financially sustainable?  If one filters data and divides subsidies per inhabitant of rural regions,  the largest six programs of USDA funds pump debt to diminished rural populations at astounding rates; if farming remains less profitable, it has gained and retained legislators’ ears for continued support for subsidizing crops as corn in areas of low population–dominated by agribusiness.

Federal Agriculture Subsidies


Despite the typo, the map displays an astounding concentration of relative farm dollars in North Dakota, South Dakota, and Nebraska–as  Kansas, the southernmost state shown in the below map of subsidized farms in local counties, and bright blue Montana in the upper left.


CENTRAL US FARM SUBSIDIES


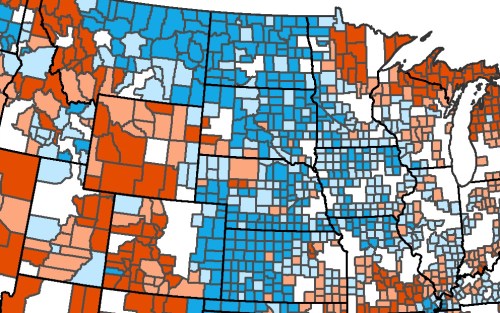
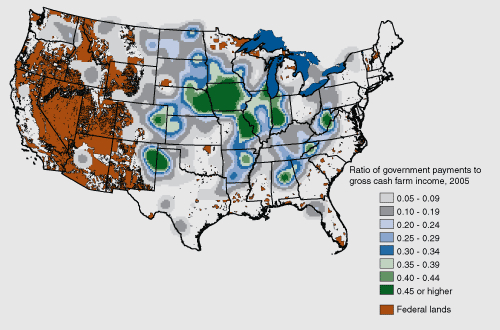
The limited profitability in many of the very same regions–and indeed the focus of profitability only in states of the corn belt such as Iowa–suggest the deep economic constraints about such macroeconomic policies, and the limited success of farm income in many of the same regions in 2005–even as governments have shifted their investments to larger farms–with under 30 percent of farms receiving commodity program payments in a typical years.  Indeed, the shift in the allocation of funds to farms with higher incomes and higher-income households has encouraged commodity-related programs–like grain sorghum, wheat, oats, or soybeans–that are removed from real food needs, and creates a picture of radical imbalance for the smaller farm, privileging “high value crops” in a macroeconomic sense, in ways that were often removed from actual farm income in many regions outside of Iowa, Nebraska and select parts of Missouri and Texas in this map of 2005.

CropSubsidyMap

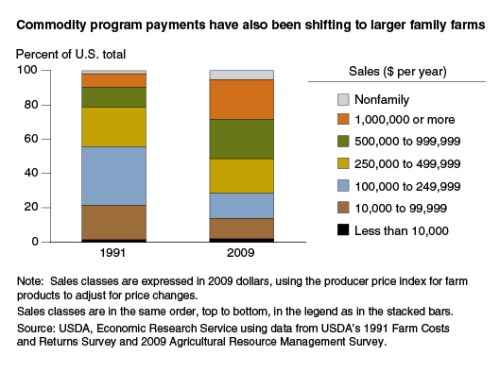
The shift to larger farms whose incomes actually far exceed average household income in recent decades created a new dynamic of regional and rural investment that has privileged a food trade removed from local needs or a variety of foods, and considerably increased the percentage of non-family farms in ways that seem poised to increase over future decades.

shift to larger farms

Are the results even profitable?  The level of indemnity is striking.  There is not only considerable variation in crop indemnity nationwide, but evident intensity in regions of greatest population loss that are relatively removed from metro centers:

INdemnities as of 2010


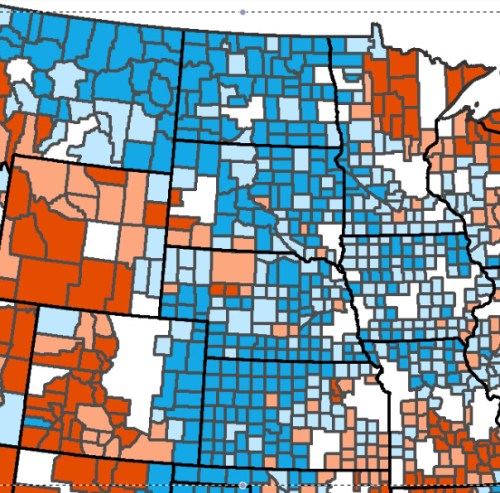
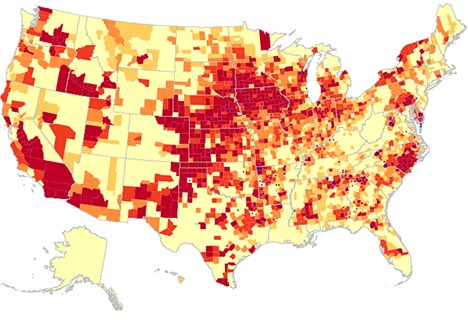
The patchwork strip of heavy indemnities of over $10 million per county, designated in dark brown, that run across the center of the country in 2010 (and are particularly concentrated in North Dakota, Nebraska, Colorado, Kansas, Oklahoma, and Texas–all big foci of federal farm expenditures) raises question of the allocation of farm dollars in any Farm Bill, and indeed how to encourage local best practices with federal policies.  Can such levels of indemnity be fiscally justified as a food policy?


Indemnities of over 10 Million:county

How do they indeed distort the sort of food policy that the government might want to encourage?  The question of best managing the balances of investment in the continued productivity of farmlands may have been too long framed in macroeconomic terms removed from local markets or best food practices–farm dollars being dedicated to the production of grains not destined to be consumed by human mouths, and whose cultivation imposes increasing costs for limited exchange value.  Are these losses concealed in most maps of investment, and what sort of image of crop production do they effectively produce?

Some of the same states are highlighted in the below, more detailed, map of such direct and counter-cyclical payments–those payments that depend on weather changes or currency fluctuations, rather than cycles of agriculture–emerge in the recent he Farm Program Atlas, mapped for the USDA by Anne Effland, Vince Breneman, David Nulph, and Erik O’Donoghue, mapping variations in the dollars received by local farms in 2009.  (The atlas will be completed through 2012, but this map provides an initial snapshot of where the money goes, county by county.)  It offers  a baseline of a picture of the benefits that the seven largest USDA programs give the nation’s farmers that is likely to be a touchstone in future debates.


DCS map USDA


The fluctuations charted respond to global markets and profits on crops, now removed from the calculus of local, regional, or national needs.  Given that in 2009 corn and soybean prices were extraordinarily high–too high to trigger counter-cyclical payments as well as the direct–they offer an image of direct crop payments.  And the image of direct cropland payments per acre is not in fact drastically different or distinct in its complexion, if it lightens the amount expended in the Northwest, Kansas, and Nebraska:


Direct Payments per Cropland Acre

(If one were to look only at the counter-cyclical payments for that year, however, the rise in prices would make most monies appear devoted to the South for that specific year:

Countercyclical Payments 2009


The different image that this provides of dollars spent in the Southland, however, is effectively a distorting mirror of the continued monies that flow to the acreage in the corn belt and across the midwest.)

If one charts the picture of the proportions of base acreage receiving either direct or counter-cyclical investment in farm dollars, a similar clustering of density emerges specific to the Midwest that suggests the remove of crops either from centers of population–metros–or areas of dense population–and even something of a marked inverse relation to population density:


DCP--Acreage


The below map breaks down variations among individual counties that received dollars in ways that offer something of a mosaic not only of government investment, but a map of the competing interests that defined the future of our land use in states as of great population loss–and increased allocation of dollars/person–like Nebraska, Iowa, and Kansas, suggesting considerable local variations perhaps based on local agitation.


Iowa, Nebraska, Kansas

What this means is not only an increased investment in large agribusiness, but a skewing of investments to areas removed from urban populations in the mosaic of those areas where federal farm dollars are received, and over $700/person of farm subsidies arrive yearly.

Which Counties Get Subsidies?

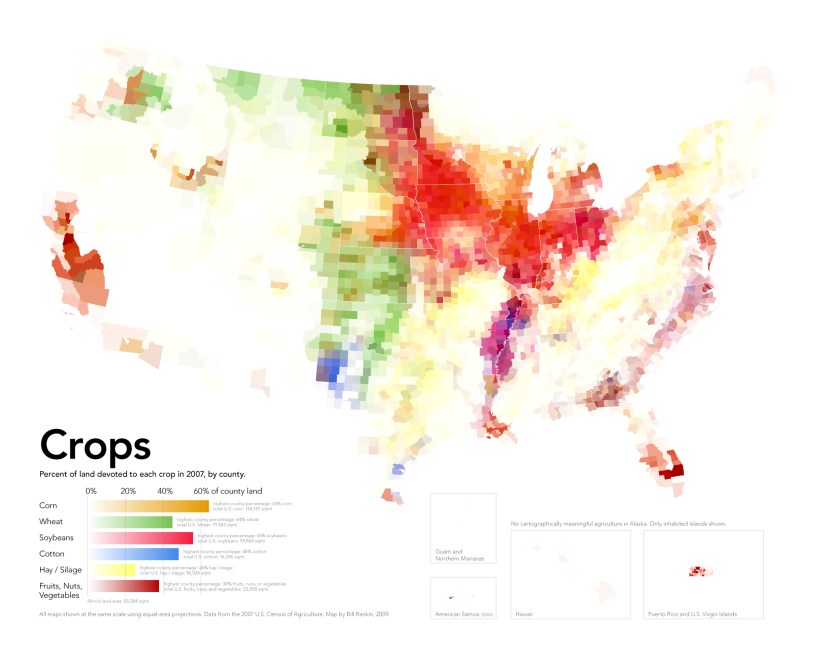
It is the underside, as it were, of increasing “over-specialization” in agricultural production and in the agrarian landscape–and the divorce of that landscape from our changing national foodscape, whose disproportional warping over the years has been described and charted by William Rankin with visual eloquence, revealing in five colors the recent expansion of monocrops in corn (orange), wheat (green) and soybeans (red), destined for agrarian feed at considerable expense both as an investment and a use of land.  Local economies, such as they exist, are sustained by agribusiness–the largest property owners in many of these states, who privilege a uniformity of crop.

8.  The most dangerous implication of this mis-managed mapping of federal investment may lie in the removal of local needs from a sense of what crops are being encouraged or discouraged by the USDA, creating distorted foodscapes evident in how the below map of William Rankin clearly reveals the disproportionate amount of farm dollars dedicated to specific crops–and to practices of monoculture–that are most often removed not only from the food needs of urban areas or urban poor, but run against both good agricultural practices of local variation and environmental health.

crops2007_big

And just to focus on the monolithic intensity of Soybean and Silage in one area, one can see how little of the per capita funds spent by the USDA on agricultural acreage actually reaches the tables of Americans, or might contribute to their dietary health.
red crops

US Government data, relatively recently released, provides a shockingly similar distribution of funds picture of roughly the same area received in subsidies, as of July 11, 2012:

USDA--as of July 11, 2012


9.  The dramatically lopsided geographical distribution that results among farmers’ markets across the nation–those ever-present upbeat small-scale micro-economies of the food trade–is no surprise:  even when providing the select with “fresher” food, such markets are removed from very centers where those subsidies arrive–the inaccessibility of those markets in the major metros to folks on SNAP programs (or food stamps that the farm bill guarantees) is no surprise because it is a sort of niche agriculture in an age of the homogenization of crops, and the withdrawal of industrial agriculture from produce:


v6SNAP_FoodAtlas

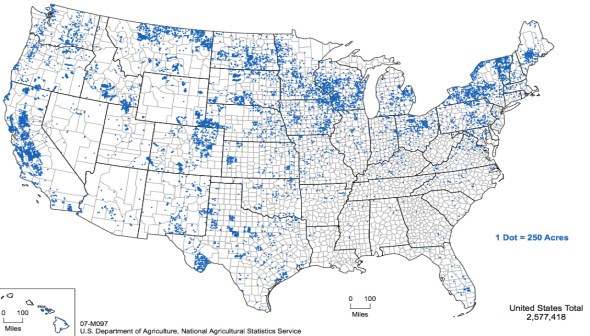
For organic farms largely spread to areas located outside the most intensively farmed acreage in the US by 2007.

Where have the organic farms gone?  Outside of the corn belt, in part, although the clearly cluster in many areas of Wisconsin, Minnesota, Montana and Iowa, but often in the Northeast, Northwest, and Central Valley of California, the great producer of nuts, fruits, and vegetables.

Acres:Organic Farming Prodcution 2007

What happens to larger markets of food when areas of the concentration of fruits such California’s Central Valley face sudden drought?  Just stay tuned.  It’s most likely coming to a food-stand near you.the USDA’s Economic Research Service, using data from the Agricultural Research Management Survey
1 Comment

Filed under data visualization, ESRI, foodscapes, USDA

The Way We Eat Now: the City and the Farms

The impacts of radical over-specialization of agricultural lands in the United States on our food supplies is only beginning to be mapped with the critical eye that it deserves.  With the intense expansion of ‘mega-farms’ jumping some 20% just in the years 2005-7, their expansion of subsidies, and an intensification of the quarter of vegetable production for animal feed, the notion of agricultural stewardship has been replaced by an artificial market and explosion of selective crops.  Is the notion of an agrarian space indeed itself a casualty of this new use of farming in a land of the death of the family farm?  Is this the end of an ideal of cultivable space, or does it push us to seek to imagine a new relation to the land?  It is indeed striking that until fairly recently, the ancient term ecumene or oikumene described the inhabited (or inhabitable) world with reference to those lands able to be used for agriculture or pasturage. 

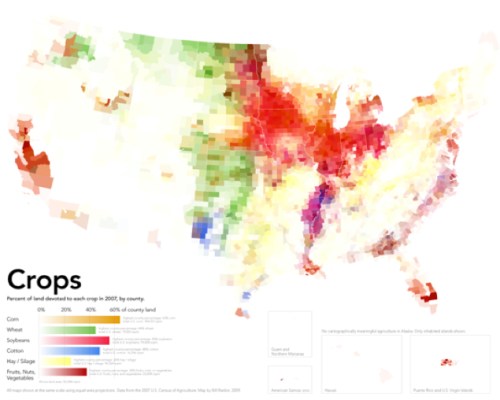
The extreme “specialization of the agrarian landscape” William Rankin recently mapped offers visualization of data from the 2007 Census of US Agriculture:  the maps charts variations in crops and animal pasturage in each county of the country, each of which are colored by the gradations of four to five major crops or farmed livestock in the United States.   The selectivity of farmland use it reveals captures the effects of this expansion and maps the consequence of that dramatic expansion of mega-farming in the Bush presidency of those years, in response to selective subsidies of corn and soy:   the color-coding of individual crops provide a snapshot of the proportion of land devoted to each subsidized crop (soy; wheat; corn; cotton; vegetables and fruits or nuts) that  raise to raise big questions about our limited foodscape and suggest the degree to which farm subsidies inform land-use in desirable ways.

Even more striking than the limited regions of land used for farming in Rankin’s data visualization is the creation of the zones of land dedicated to wheat, soybeans, silage and corn that rarely if at all overlap, where over 50% of county land is dedicated to soy, a solid 40+% is dedicated to wheat, or over 60% to corn.  This is not only a map of agrarian distributions, but a the creation of a new attitude to agricultural space:  indeed, Rankin’s map helps us see the distribution of croplands in the country less as something that occurs on a flat surface, but in itself creates a new familiarity with space, and a relation of our food supplies to space, as much as a form of “geographic” knowledge of how events occur on the map.  For the sequence of maps chart a shift in the American foodscape, where we revise how we imagine agricultural space, and as creating a new notion of our agrarian space, rather than as changes that can be mapped or occur on the two-dimensional distribution of mapped space.

Rankin’s set of three maps of the national foodscape are not historical per se, but suggest a metageographical narrative of how attitudes to land have changed in their spectrum of such scattered colors.  They chart an extraordinary degree of remove from local intake, distribution or demand.  The distortion in this agrarian landscape is of course enabled by a huge transport industry, moving the wheat grown in the central band of the US from Iowa or Nebraska to Oklahoma, corn from Wisconsin to Iowa, to the soybeans so densely grown across South Dakota and Iowa to Indiana and Ohio.  Although continuity and coherence as the central properties of terrestrial maps, an absence of continuity in the concentrations of crop cultivation suggest a skewed relation to the land–the maps undermine the very notions of continuity and coherence that defined maps of national territories–using maps to raise questions about food supplies.  All the silage in across the Eastern seaboard in the country seems to derive from the local profitability of livestock products, show a nation almost drained of agricultural productivity, and relocates fruits and vegetables to ribbons on both coasts.
The consequent de-coupling of food markets from growing habits inverts Thomas Jefferson’s ideal of a yeoman farmer who planted crops for his own needs, out of the conviction that those “who labor in the earth are the chosen people by God.”  The Jeffersonian ideal of stewardship,rooted in a contractual relation of a responsible servicing of the land, rested on “good practices” of land management through rational skills of crop rotation, terracing to prevent soil erosion, promoting the diversification of varied crops, and surveying of land, from advocating a regular seven-year cycle of regular crop rotation that follow corn and wheat with a variety of crops, including turnips, clover, vetch and buckwheat.  He pioneered innovations that would increase the conservation of resources as well as crop yeild, including deep contour plowing, turning the ground far beneath the topsoil, and terracing to prevent soil erosion.  And his quest for variety and diversity for the agriculturalist no doubt encouraged him to introduce eggplants, brussels sprouts, rice, chestnuts, cauliflower, nuts and olive plants to the country–Jefferson imported 170 different fruits and 330 vegetables in the period from 1767 to 1824 to diversify the nation’s agriculture.  Jefferson was vigilant in advocacy of agricultural stewardship and famously wrote Washington with dismay in 1793 that “we can buy an acre of new land cheaper than we can manure an old one.”

William Rankin’s three data visualizations map the remove of what we eat from where we grow, or where we grow and what food we buy, suggests the imposition of an artificial remove of growing and husbandry from urban life–creating a gap between the country and the city so great that we cannot say where the country is.  In mapping the geographical remove of crops from cities–and of cultivation and animal husbandry from centers of population, Rankin has charted the results of a dysfunctional division of land-use, in which the map transforms the territory, and almost precedes it, as the areas zoned for harvesting by agribusiness divorce local needs of populations from the large-scale farming and animal husbandry, not only fostering a lack of a uniform food-harvesting mosaic, but a super-regional specialization, as this map of the crops that are grown in individual counties reveal:  the disorienting nature of individual to food, and individual to agriculture, that results removes the production of crops from local demand or a topography of need.  Indeed, there seems little clear integration of the sites of growing vegetables or crops to a national market in local terms, as questions of national demand and pricing drive the redistribution of crops into what seem “hot-spots” of production, whose intensity of cultivation tries to keep up with the national need with an intensity that their concentration is unable to effectively sustain in the future.

The pronounced discontinuities in the maps of food specialization reveal a deep disconnect between food production and consumption, and the limited understanding of how reliant we’ve become on an unequally pronounced distribution of such basic needs as growing crops or raising chickens.

Rankin's Map of Crops

In this map, Jefferson seems to meet Baudrillard:  the maps does not simulate a world of rending to the land with clear coherence, uniformity, or indeed boundaries, but visualizes a range of databases that reveal the imbalance by which we try to create the illusion of a land of plenty in an era of few farms.  This map undermines the security of a healthy nation, beyond reconsidering the pathways or quality of food, to force one to ask how the foodstuffs produced in these spaces could be high quality.  Reading the map will salutarily ward of any temptation to naturalize this self-evidently artificial division of land-use, or naturalize the imbalances of select crops in regions– the six colors used in the map are, indeed, almost always distinct from one another in the above map charting variations in degrees of crop specialization.  The map is a  metadata visualization, and absence of any attention to continuity in the agrarian structuring of the land, disrupts the continuity of the iconic image of the map.

Like Jasper Johns’ 1961 Map, which re-inscribes the encaustic splattering of primary colors that distance the map from its iconic status:  the surface of Rankin’s maps distance observers from the nation, rendering unrecognizable the form of the territory, abstracting the surface of the map by revealing an uneven uniformity instead of a united whole and focussing attention on the unwarranted density of selective agricultural concentration on specific crops.

800px-Jasper_Johns's_'Map',_1961

If maps don’t define and distinguish national sovereignty, but are a range of widely diffused simulations, we need an actively deconstructive map to assemble our disjointed foodscapes.  The dramatic isolation of foci of planting of wheat, soy, and three intense pockets of cotton, the absence of vegetables from most crops across the nation is a reminder of the separation of how we inhabit the nation from agrarian land-use:  citizenship is disconnected from stewardship, or the illusion of stewardship is no longer possible to perpetuate in relation to the land that no longer exists as a coherent territorial entity.  The remove of crops from local use, and the injection of subsidies to promote specific crops in Midwestern states, but also in the Northwest and South, created intense pockets of over-intensification that with the growth of megafarms has produced, despite the temperate nature of the continent.

2012-hardiness-zone-map

Perhaps these distortions of agrarian landscapes is an effect of the markets being driven by international prices, or if a radical specialization is striking for its remove from what we eat, even if not all have heads of leafy lettuce and arugula salads on their tables:  crops like wheat and soy are farmed in mass in select places for massive milling and repackaging; local food needs are met by importing across the nation, if not scattered boutique farms or “farmers’ markets” that are not run by farmers but franchised, or run by men who drive hundreds of miles with diesel gas in order to perpetuate the illusion of a close relation to the fruits of the land to folks living on asphalt pavement and tar.  We use food to create our own illusions, drawing from mythologies of agrarian responsibility that history provides.

Thomas Jefferson rooted democracy in the relation of the citizen-farmer and his land, metaphorically equating that relation to the fabric of the nation:  “the greatest service rendered any country is to add a useful plant to its culture,” he argued, equating individual agricultural stewardship as a “service to the nation” that is “worth more to them than all the victories of all the most splendid pages of their histories.”   When Jefferson preached the gospel of the agriculturalist, farmers were central to a nation’s needs both for feeding the nation and as stewards of the nation’s agrarian wealth, rather than white-color workers or professionals.  And so he valued agriculturalists’ expertise in crop rotation, fertilizers, and agronomy as remedies to the perils of land-abuse and erosion of lands, and located the preservation of the wealth in the countryside and the value of good, arable land.  The concern that led Jefferson to increase the diversification of vegetables as fundamental to the nation’s health led the horticulturist Luther Burbank in the early twentieth century to perfect crops able to sustain disease and blight, by hybridizing fruits, vegetables, and legumes by cross-pollination in strains of increased tolerance–if not genetic diversity.

When Burbank redefined performance of crops by their productivity and survival rates, he redefined plants and vegetables as a malleable resource subservient to man, though without encouraging an over-specialization similar to what we see in today’s foodscape.  Burbank’s shift in the significance of the vegetable in the world underlies, in some fashion, the metageography of the current over-specialization spatial distribution of crops Rankin maps, as it removed proximity of the place of cultivation from the growing of crops, and removed crops from the local market place.  Rankin’s beautifully detailed land-use maps chart the radically uneven nature of the specialization of our agrarian landscape’s distinct fracture lines.  To judge by the deep pockets of specialization in Rankin’s maps by the variations in anima populations in individual counties, the thinning of farms extends not only over the deserts, but across most populated regions.  This over-mapping of different types of husbandry reveals a virtual segregation of chicken, sheep, and cattle, with other areas left curiously blank, in need as much of importing foodstuffs across county lines, despite the thin distribution of cows for pasture, and a large welling across the midwest and southern Eastern seaboard of pigs.

The image suggests a set of deep imbalances and a surprising disconnect between areas and a patchwork redistricting to meet and accommodate national demand in specific regions.  The thin distributions of light violet colors conceals pockets of intense specialization with a clustering of pigs and turkeys, but suggests the extremely rare grouping of a variety of meats by mapping the ranges of density in practices of animal husbandry across the nation.

animals2007_medTogether with other maps which were solicited and edited by Darin Jensen in FOOD: An Atlas, a project broadly discussed in two earlier blogposts, Rankin’s metageography is oriented to imagining relations between food and the land.  The maps discussed in earlier blogs were data visualizations, and less informed by GIS, and bore the trace of the cartographer’s hand.  But this map is in no ways removed from being an intervention on cartography as an art, if it is based on “big data” as a structural metadata visualization of variations in local databases.

The data distribution of crops, animal livestock, and the profits of farming registered in the Census of Agriculture reveals not only strikingly constrained areas for active agriculture, but the geographic remove at which farming stands from food needs.  It presents  a clear-eyed critical view of the benefits of locally sourcing food by inviting us to shift our relation to the currently lopsided nature of national practices of cultivated space, but also suggests the distorted nature of food map created by the limited intense cultivation of crops and husbandry of animals in select areas.  I’m interested in both the maps and the questions of human geography that the distribution of food in them raises:   during the growth of agribusiness and consequent pronounced localization of livestock, slaughterhouses, and tending of animals, and map an increased remove from the sources of our food.  With a lack of available local food, indeed, food is not only less nutritious, but removed from place in the manner that Jefferson had insisted.  In such a landscape of specialization, “No major city could ever source all of its food from local farms–not even those close to major agricultural areas.”  Not only are few farms profitable, but those areas farmed are farmed with an intensity of agribusinesses more market-driven than linked to local economies.

Indeed, the apparently unprecedented concentration of mono-crops–wheat and soybeans; corn; cotton–creates a disjointed landscape both removed from local needs and plugged into a national (and international) market and in which much feed goes to livestock–though, as we’ll see, in which livestock is not so profitable.  This maps reflect on the consequences of how constrained farmlands shape a collective geography that leaves consumption curiously disconnected from production, which faces markets that the individual farmer cannot understand, and indeed are more subject to international prices and agricultural protectionism than to actual needs.  The regional saturation of essentially businesses of food production reflects not only a death of local agrarian farms, but the impossibility of local crop variation in a landscape of regional concentration for foreign markets, animal feed, and available land.

These attitudes might change, if we accept how Rankin’s radical cartographies reveal the narrow divisions we’ve imposed on our agrarian landscape.  But they delineate deep challenges of our national foodscape from even Burbank’s era of a range of resistant potatoes, peas, corn, and various pitted-fruits, including plums.  No longer does agricultural needs of a territory shape the contents of the foodscape, and maps lose their reference to a fixed territory, but map a disconnect:  Baudrillard would note that the notion of a territory does not in fact survive the map.  The map might suggests some links between our distorted agrarian landscape to the political landscape, and not only in the government subsidies that many crops receive to grow at a distance from urban populations, or the diversion of water to allows intense crop cultivation of regions like the central valley.  From a nation of farmer-citizens in a Jeffersonian mold, our “red” v. “blue” state electoral topography may mask deeply market-driven divisions in agrarian resources.

The data visualizations suggests the little attention we dedicated as a society to the role of land to food, or to the path from farm to table; the intense cultivation of crops, vegetables, and pastured meat to restricted pockets of the country practically ensures the remove of our food from a provenance or site of origin.  Rankin’s maps provoke us to map our own individual relations to the origins of our food, and trace their path back from sites of cultivation to our tables.  His maps delineate the broader challenges of our national foodscape;  maps may enjoy limited authority or exclusive purchase to represent or contain such abstractions as the nation, state, or nationality, but provide a way to disrupt a world of simulations, where the territory does not precede the map.  Jean Baudrillard famously asked pointedly whether the nation’s authority can survive that of the map:  the coherence of the United States as a food-producing nation can’t easily functionally survive the unsustainable practices agribusiness has dictated, even if the market can sustain it for now.

The objective disassembly of a national space raises questions of the compatibility of current practices of land use are even compatible with a national space.  Indeed, rather than map the relation of food to population, one could argue that the map mirrors one of uneven agricultural subsidies, as much as food demand or land cost, and illustrates the bloated landscape those subsidies are creating in place of agricutlural variety:

indemnity by county

This can also be illustrated in relation to animal husbandry by mapping the local density of factory farms across the nation:

20101202-factory-farms-US

Rankin’s maps are of land-use reveal the effects of such subsidies for large farms in their “disjointed and lumpy space[s] of specialization;” they reveal a surface of farming where “few areas where different commodities are grown side by side” and radical concentration of cattle and livestock in specific areas, despite their thin distribution in the country as a whole.  The rather lopsided topography of sourcing meat and centering husbandry in massive compound farms suggests a sort of anonymity of their origins, less than healthy and less than nutritious, and suggests a mental familiarity with erasing the origin of foods, rather than considering the relation of food as a “good.”  The economic intense over-specialization to some extent ensures the virtual anonymity of  paths most foods take from where they grow to the table or the supermarket aisle.  This notion of food whose path from farm to table is devoid of specificity raises questions about as knowledge of the ability to distinguish food, as well as how its freshness is radically reduced in a system reliant upon quick transport. 

As agribusiness replaces the good household practices of individual agriculturalist moving foods from limited sectors of over-cultivation, subsidies define circumscribed areas of crops and animals–here mapped by the specialization of crops or the density of livestock in each county–and limit their profitability.  With the exception of some crops in the Midwest located near to cities or towns, in fact, a radical concentration of agriculture removes the individual’s dining room table from growing practices. Take, for example, the location of soybeans, marked by red, in some regions of the Midwest, that define a relation to the commodity outside the food that is actually consumed:

red crops--tghe sites of soy

The dramatic disruption between farms to urban foods and divide between local food-supplies and consumers to reveal a deep shift in our connection to the land.

While fundamentally data constructions, these maps give new sense to the materiality of the map, by providing a visualization not of expanse but suggesting some of the ill-effects of our own division of land-use.  Lest we naturalize the divisions created by this specialization of land-use, they map the stark divisions of  the origins of the food we eat poses compelling (and pressing) questions about the best way we might provide nutritious food to urban populations, and if we can economically sustain the current landscape of intense specialization of agricultural work.  One irony of this division of the agrarian functions is the illusion we are  healthy to invest one or two crops to one expansive region.  Indeed, this illusion masks dangers in segregating crops in the landscape and a fracturing of our relation to our food.  The widespread naturalization of one state or region as the center of corn or wheat, potatoes, vegetables, nuts, or cheese conceals an implicit consent to the current culture of specialization has segregated the production of meats, wheat, corn, cotton or grains in only place, in ways that effectively naturalize an impoverished practice of agricultural rotation:  by imagining certain states as lands of corn, wheat, or soy–as if crops were indigenous to a landscape–that erases the natural variety of an ecosystem by rendering it unrecognizable.

No clear sense of a landscape that provides nourishment for the nation remains, as agricultural “space” is itself dismantled as a uniform concept in relation to the nation.  Rankin’s cartographies map the extreme variations in the dedication of land to the intense cultivation of foods, plant and animal, and we might re-examine the silent segregation of an agrarian landscape through its consequent perils.  The database from the USDA that he has used reveal a concentration on crop monocultures and an agrarian centralization, à la Charles Taylor, of crop production.  Hopefully, we can use them to take stock of whether this is healthiest way to feed our cities and urban populations–to segregate or actually remove most cropland from sites of urban population.  As agribusinesses have concentrated the cultivation of wheat in a band in the central states stretching in regions colored bright green,  corn and soybeans in the yellow and red northern midwest, and fruits and nuts, the result is an increase in the remove from which our cities are nourished.  Populations stand at a remove not only from the sources of food, but of the most nutritious choices of food.

The high degree of scary fragmentation of US agriculture reveals a heightened specialization of food-sources between corn, wheat, soy, and nuts or vegetables.  The isolation of pockets of food production reveal an intensity of artificial over-specialization often removed from a national demand:   the segregation of centers dedicated to agricultural production from centers of urban life suggests a divide between city and farm.  Even more significantly, perhaps, than the divide mapped in electoral-map chloropleths between ‘red’ and ‘blue’ states, the severely localized distribution of crops maps a huge divide in expectations among Americans for freshly grown food possible of being sustained, and to the landscape of food-availability; while the food landscape cannot provide a deterministic explanation of party affiliation or patterns of registration, the distribution may map populations’ selective distribution in areas with greater access to locally grown food supplies–or their resistance to the  remove and distance from crops and an agrarian economy.

That is no doubt perhaps overly optimistic, given the huge role of agribusiness in structuring the landscape of food use, together with the subsidies of foods that they receive:  the monocrop concentration of corn, wheat or soybeans is conducive to bulk harvesting for sugars or bread, and shipping, if not to their redistribution from select centers of packaging.

Unknown

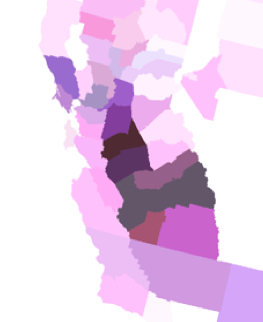
But the sad (unhealthy) result is a remove of most populations, or at least huge proportions of them, from the sources of their food. The existence of such a selective resettlement is less clear than the dysfunctional image it suggests of a fractured relation to the agrarian landscape about which it’s hard to wax poetic.  The rare concentration of fruits, nuts and vegetables in California, densest in the Central Valley and farmlands of Northern California, are the only dense areas of their dense cultivation, save Southern Florida, based less on climate or topography than on their remove from coastal cities, and seem to provide the only dense region of vegetable harvesting in much of the nation.

What does this tell us about the state of California?

How can one imagine this disjuncture of agrarian space from the national space?  The classical poet Virgil idealized the relation of Rome to its landscape and countryside in the era of Augustus, providing a topos of the idealization of landscape’s tranquility as the result of harmonious good government.  And it’s helpful to cite Virgil’s praise of the wealth of agrarian diversity in the Italian peninsula, too, because they provided a model of the metaphorical cultivation of a proto-national space.  When one looks at Rankin’s weird maps of a disrupted foodscape, where over half the country is without crops and blank whitespace; they’re as removed from Virgil’s bucolic agrarian ideal as they are from Jefferson’s–indeed, those two are far closer to one another than we can see in how we’ve divided the nation into zones of soybeans, silage, and wheat that only occasionally overlap.  There’s a huge contrast the dissonances in the food landscapes that Rankin mapped above to Virgil’s famous encomia of the productivity of the Italic landscape in his Augustan Georgics, where he evoked the transformation of a rocky Italic landscape through the benefit of Senatorial edicts and decrees to a land of “abundantly growing crops” and “sacred home of the olive groves,” now dotted with “many wondrous cities,/That so much toil has built” whose crops were “abundantly rich;”  the land, tended by the best techniques of animal husbandry and of agricultural practices, provided the ground to cultivate wheat, barley, spelt and vetch in alteration with Egyptian lentils “in accordance with the Gods.”

That bucolic image of the productivity of the land that is fostered by Senatorial decrees and oversight of a diverse but homogenous space stand in sharp contrast to the segmentation of pockets of subsidized divisions in an agrarian landscape subject to intense monocultivation that is to large extent both largely sponsored by agribusiness, and largely removed urban areas or demand.  Tending the Italic landscape drove wealth to the “tot egregias urbes,” so remarkably diverse and bountiful, of the recently united peninsula Augustus ruled–and whose relative riches outshone any other region in the world.  The current landscape of specialization has so narrowly concentrated to focus agrarian productivity into scattered agrarian blocks of a zoned farming industry that dramatically disconnected itself from urban areas–and reveals a disconnect of city and farm so stark one could scarcely imagine a tie between the two.

Agrarian diversity?  Well, the new space is just complicated to manage or understand.  We know it’s unwise to concentrate corn and wheat in one area with soybeans, as if they were a large monocrop, because this exposes them to disease; the concentration of fruit and nuts in pockets of the entire country is even more irrational.  The placement of production of crops at a remove from populations produces less nutritious food, and generates more waste.  Equally difficult to sustain is the containment concentrations of livestock animals in select pockets of beef for slaughter, whose concentration is likewise removed from areas of urban concentration.  Despite small areas of cows lightly scattered for use in pasture for milking across most of the country, concentrated centers of butchery define the country’s food map.  Something like one-third of arable crops are given to land animals, but the segregation of high-density livestock farming from local agriculture suggest a challenging foodscape which might be considered more creatively, even if there is never much animal harvesting in the desert:

Drive down Highway 5 to Los Angeles past centers of slaughter and beef production.  The extreme variation is stunning when one approaches the cattle farms in California’s Central Valley, and even more scary is how characteristic this is in our agrarian landscape, rather than an  extreme fragmentation of land-use for livestock:

Califronia Animal Density

Consider the localization of livestock in deep purple gradations in Rankin’s  chlorpleth reveal a national segregation of zones of butchery limiting availability of freshly butchered meat:

Central Valley animal production

What does this say about our relation to space?  Let’s look at the crazy topography of intense pockets of “cattle compounds” and “chicken farming” that might not be called husbandry which make a broad mosaic of meat processing centers in the poorer counties of the American South:

American South

This snippet is barely recognizable as a map, of course, or a record of space. Remember the pretty staggering numbers that the deep purples reveal in this key:

Animals-Legend

Mass-farming of course unprecedentedly removes food from its consumer, and removes the very idea that this need not be the case.  The inhumanity of concentrating chickens in the Southern United States is one concern; the remove of chicken farms from urban areas or human consumption is poignant: it finds counterparts in the chicken-farms of the Central Valley and Imperial Valley in California, which are something like a hub in the West Coast save from those in the northwest.  But at their highest points of concentration, we have managed to concentrate an amazing 70,000/sq mile.  (Cattle are densest in the Midwest, where we find 700 cows/sq mile at the densest parts; fewer turkeys are raised, but the greatest concentrations of 5,500/sq mile seems downright unhealthy.)   Leaving aside ethical morality, the map posits questions of food safety:  intense centralization of animals and consequently of feed supplies increase risks of contamination as well as exposing them to greater threats of disease.  With the trends to global warming, the dangers of locating agriculture in fixed areas of intense over-cultivation are even more pronounced.

Such data visualizations offer a database which easily slips from the eye.  While these maps don’t overlap, they suggest a joint-access data visualization that might offer a useful planning device.  They reveal mono-crop cultivation and intense concentration of the value of animal or agricultural products that impoverish the project of agriculture in much of the country and seem to reduce the value of either crops or the production of animal products in most US counties in the absence of their intensification.  More striking, perhaps, is the small degree which farming maps to value across the entire nation, uniting both animal and vegetable products, and the huge wholes of agricultural profitability in over one-third of the nation.  We supplement these gaps through the massive importation of foods, vegetables, and produced foods.  But the fact that it is rare for vegetable-growing to bring in a profit through most of the northeast suggests a topography of agriculture that few wold suspect; the profits are limited to the rich green areas dominated by the crops of soybeans and corn, as well as wheat, that are similarly scarily removed from many population centers. Despite the comforting green that leeches down the path of the Mississippi River, ; meat seems only profitable in Oklahoma and parts of the old South, sites of large concentrations of cattle- and chicken-farming.

Agricultural Value Map.rankin

The washed-out nature of large areas of this map suggests the low aggregate market value of product made in those regions; there is a surprising density in few counties where animal products provide profitable earnings.  This is, to be sure, but one sector of the economy; but it maps an important one:  the divides Rankin maps not only poses questions of how we see our land, or use resources but of how we imagine the remove of farmed land to a vital urban space–and indeed how economically removed agrarian practices have become from urban consumers across most of America.
crops2007
The lopsided  geography of land value creates an uneven distribution we all tacitly know but don’t acknowledge.  It is also a basis of land-use that is not economically sustainable.  One take away from Rankin’s series of visualizations of the discrepant distribution of agriculture is that at a time when we dedicate increasing attention to the construction and planning of urban space, rural agriculture might be better planned in concert with urban concentrations, and not only for reasons of health but as a matter of public policy.  We often need a map to reveal the artificial nature of what we naturalize.  All three data visualizations suggest that we’ve left agriculture to market forces alone, in ways that might not plan for future development; imagine the maps as overlapping public access databases we might use to orient ourselves not only to space, but to a more sustainable relation to the agrarian use of the land.  The needs for such a shift in orientation are not only for health, but economic:  it’s not possible to prognosticate from a map, but we can use the visualizations to raise questions about what would be the effects of climate change on districting agricultural land-use to specific sectors and types of crops;  the concentration of corn strains in one area, moreover, raises possibilities of adverse influences in the food chain of GMO strains, much as the concentration of both animal livestock feeding raises specters of tainted meat supplies.
The limitations and constraints of agribusiness are imposing, if familiar.  There has been some local pushback.  Discomfort with these constraints undoubtedly informs the recent retrenchment of urban gardening and even urban rooftop gardening across the urban United States.  Much as the growth of farmers markets may have encouraged or initiated widespread interest in centers of urban agricultural use within an urban landscape, as if to react to the marked remove of food-availability–as much as fresh food–from urban space, and the poor nutritional qualities of food that result.
What can we make of the local attempts to bridge the town and the country, either in the preserves of the new spaces in cities created at farmers’ markets, or the growth of urban agriculture?  I’ve gestured to the attempts to map both in Oakland in some previous posts.  Around New York City, a previously isolated urban space is surprisingly permeated by active green space.  The Parks Department in fact only owns less than half of the almost 500 community gardens measured by GROW NYC and Green Thumb in 2009, with sites to volunteer noted in blue beside urban greenspaces:
Community Gardens NYC region
How many are open to cultivation?  Over 20% of those highlighted in yellow are dedicated to edible plants:
over 20%
Or the similar emergence of community gardens in Portland:
portland gardens

The growth of San Francisco’s roof-top gardens, which was so quick in 2008-11 that the city changed its entire zoning code to permit urban agriculture from expanding in all neighborhoods of the city, led to a Renaissance of urban gardening, despite the relatively close access of the neighborhood and city to fresh food markets, not to mention an insatiable demand for local food:

Mapping the economy of rural-urban relations is a big project for the future, but perhaps it is even more difficult to plan to do so given the investment in a model of land-use that cannot yeild many positive long-term returns.

Leave a comment

Filed under Big Agra, croplands, Cultivable Land, data visualization, factory farms

Mapping Knowledge and Mapping Food

Image

What relevance do maps have in a world often organized by database systems that are in themselves often impossible to visualize?  One answer is that the map is not only a visual register of data, but prepares an active correlation of information patterns and raises questions about human relations.  Rather than arranging data, maps show or highlight selective relations between data in graphic form.  Maps do so in ways that generate questions about our relations to space, if not the variety of relations each of us occupy to an otherwise uniform expanse, in order to make space our own; they are as a result particularly useful tools to ask us to consider our sense of place in ways that we might not otherwise find a way to puzzle over and consider, or find a way to concretize.  Although the size of massive database systems escape the kind of an individual, the maps that guerilla cartographer Darin Jensen has solicited and assembled in FOOD: An Atlas raise chart the spaces we organize around through food, and understand place through the intersection of place with how food is produced, exchanged and consumed.

In an age of the unwarranted expansion globalization of food consumption patterns and trade, where the importation and circulation of foods to their consumers often seem shaped by processes irrational in nature, the rationality of the map provides a way to raise questions about how to understand the ways that food sources and substances travel across space both in commercial ways and in raising questions about the efficiency of these systems.   In identifying and rendering a joint database of food production and consumption, we can grasp in an entertaining visual form multiple questions about how we value the place of our food and how food is now valued and exchanged over spaces far beyond the places where it is grown.  We may not know what bacillus of yeast helped the fermentation of the glass of beer we are drinking, even if we prize the origin of our coffee; we can’t visualize or often even know what field of tomatoes provided the basis for our pasta sauce, or the huge range of regions united in the foodstuffs in a plate of school lunch, or where the almonds of northern and central California travel in order to reach consumers from the Central Valley.  The maps in FOOD:  An Atlas provides a range of provocative maps of how food interacts with space that provide a compelling set of questions about our relation to place, and indeed the relation of food to space.  Maps of the global distribution of grains, or of the costs of the same foodstuffs, remind us of how food exists in relation to place, even if food travels globally—as well as the places where food grows.

The compilation is a true atlas of modern life—or of modern tastes for foodstuffs.  The Dutch engraver and cartogapher Abraham Ortelius compiled the first global atlas by sourcing maps from different areas in Europe from his multiple correspondents in the 1560s, obtaining a range of extant cartographical forms of nautical and terrestrial form that he collated in a synthesis of terrestrial coverage that canonically redefined the image of the inhabited world.  Refined and expanded in his own lifetime and after his death, the Theatrum Orbis Terrarum bound these multiple maps obtained from different parts of Europe and vetted in Amsterdam in a single commodity that was immensely popular and, though dedicated to Philip II of Spain, was disseminated over a huge geographic expanse.

The crowd-sourced maps collected in FOOD were sourced in a considerably shorter period of time over the global internet, solicited from cartography listserves and Berkeley classrooms alike, starting from the North American Cartographic Information Society (NACIS) and coordinated through a GIS lab where proposals for mapping were often linked to potential owners of databases, and submitted maps refined for their persuasive visual organization, the transparency of their cartographical iconography and the appeal of their format.  The variety of graphic skills that are applied to map food and food’s distribution are themselves inventive exercises, and suggest the degree of invention that

The crowd-sourcing of the atlas is not only a question of pragmatics, but itself an instance of informational exchange.  On the one hand, Jensen describes how he arrived at “a project of guerrilla cartography and publishing” as the result of a natural desire to make the sort of compilation of maps that “take too long to make,” which led him to “an experiment in doing it faster,” both by relying on crowd-sourcing and local publishing. “It doesn’t have to take two or three years to put out a book or an atlas.”  The anonymity of the crowd sourcing generated a far more imaginatively diverse use of mapping conventions—unlike Ortelius’ interest in universalized norms, they celebrate local diversity of mapping abilities in keeping with the polycentrism of a post-modern age.  Rather than conforming to a single style or aesthetic, each crystallizes specific issues in an individual fashion.  The maps provoke us to consider the relations of place and food, and alter or tweak our relations to the world in mapping the circulation of food wastes, the sites for importing tomatoes for that pasta sauce, or the “food swamps” where junk food constitutes a dominant share of the foods for sale.  Each is brilliant in its own way.  Whereas we know the many authors of the maps that Ortelius collected primarily from his extensive correspondence, as well as the “elencum auctorum” that provided a comprehensive list of the different authors of maps in his atlas and sources that were consulted in its creation, Jensen lists the individual or joint authors of each map–and even invites us to construct our own!

Why create a set of maps of the relations between food and space?  This volume is a way to rehabilitate the use of the map as a way to consider and contemplate relations we construct between place, as well as the product of a local culture of food.  All food is local, even if the world we live in has globalized food as a resource.  The open arguments of maps Darin Jensen and his team assembled in FOOD:  An Atlas provide a collective tool to understand what might be called the irrationality of the globalization of food sources in the transparent and supremely rational language of cartographical forms.  Much as the previous MISSION:  POSSIBLE led us to view one neighborhood in San Francisco in new terms of the distribution of coffee-shops, trees, ethnicities, restaurants, underground gas reserves, parking spaces or sounds, each map in FOOD:  An Atlas provides a distinct corner of the exchange of food as commodities and elegant goods we value for their local origins, as well as celebrating the recent growth in the valuation of the locally produced good.  As Jensen’s map of the Mission noted the rise of artisans in the neighborhood, the mapping of Farmers’ Markets—both in Berkeley and in the United States—offers a view of the rising value of the locally farmed (and even the changing definition of what local farming means) as well as the access and audiences of these markets.  As MISSION:  POSSIBLE provides both a map of a region of San Francisco and a sort of surrogate for orienting oneself in any modern city, FOOD:  An Atlas provides a tool to orient oneself within the global exchange and local production of foods.  The map of areas of urban agriculture in San Francisco that is included in FOOD is a great model of a collective interest in the local production of food in that city, and a sort of template for resisting a growing divorce of food and a local landscape.

To order a copy, visit http://www.guerillacartography.net/home.html

How better to understand the pathways by which select regions of almond-growing enter the chocolate bars sold across our nation, or consider the inequalities of food that dominate the urban and rural landscapes in an era that celebrates famers’ markets?

http://missionpossiblesf.org/

https://www.facebook.com/food.atlas

http://cafarmersmkts.com/

2 Comments

Filed under Abraham Ortelius, crowd-sourcing, Darin Jensen, data visualization, data visualizations, datamaps, Food, Food Maps, Geographical Information Systems, Guerilla Cartography, NACIS, The American Beershed, Uncategorized