Category Archives: data visualization

On the Ethics of Mapping and Mapping of Food: a 5-part blogpost

250px-Annibale_Carracci_The_Beaneater

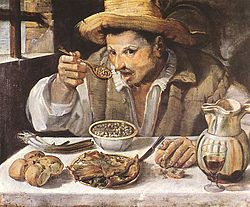
Annibale Carracci, “The Bean Eater,” circa 1583-85

Captured at the very moment he is poised to bring cucchiaio to mouth and taste the spiced beans he is set to enjoy with bread, green onions and wine, the hungry if iconic “Beaneater” or “Mangiafagioli” captures the early modern appetite. It is tempting to map the goods on his table as a record of subsistence. Caught in the act of devouring spoonfuls of lunch by the late Renaissance Bolognese painter Annibale Caracci, the anonymous portrait has become an icon of local food and a snapshot of culinary history from early modern Italy.  Literally engaged in the moment of pleasure of joining food to his body, poised above his plate mouth open, spoon raised, the Beaneater shows the contents of the spoon to the viewer by a perspective of an odd but undeniable intimacy.

The Beaneater’s expectant stare engages us to consider his soup of beans–more than the rolls of bread or glass of wine, or the bunched scallions below his wrist, as a moment of pleasure on which we as viewers concentrate.  For as much as the personhood of the Beaneater, food is undeniably its subject, and his food–the spatial specificity of eating in late sixteenth century Italy.

The image of eating is celebrated enough to provide the cover of cook books, and compelling because it is rooted in a specific place:  it reveals a joy in  the simple pasta of beans, onions, bread, and wine, immersed in the Mediterranean economy of oil that defined cuisine in northern Italy and Rome around 1590.  The painting, which indulges the Caracci family’s taste for painting everyday life, from butchers to fish-sellers, may belong to a genre of the performative nature of eating, but is so iconic as one of the earliest images of the simplicity of the so-called Mediterranean diet–and condenses a map of the food habits that defined class behavior, or social strata in cities–and the pleasure of local, familiar food.

The image became iconic unlike Caracci’s other images of butchers or later images of fish-mongers bas the template for the Sicilian artist Renato Guttuso’s classic illustration of Italian eating, which was the cover of Elizabeth David’s Italian Food (Penguin 1965)–a series of books on regional cooking that preserved food as local and fresh, in ways associated with Alice Waters and, in Europe, the Slow Food movement.  The image is an icon of local eating, where vegetables, oil and wine engross bean-eater absorbed in consuming local Roman food.

Guttuso

Guttuso’s images of earthy, sun-drenched vegetables of Sicily evoked a strong tie to place that David presented to English readers; the cover of her book echoed Guttuso’s rendering of earthy qualities of local cuisine, in ways that seemed to give a fresh awareness of the stuff of foods, and their origins, for a postwar country waking up from packaged rations and voyaging abroad, and eager to discover its own cuisine.

italian_food
5498444402_77abf9746e_z

Maps help untangle how highly personal eating habits and practices relate to place.  In the winter, we buy and eat blueberries and grapes from Chile, tomatoes from the Netherlands, garlic from China, or just don’t know from where the multi-sourced food that arrives in confected packages was grown.  Mapping food supplies, food circulation, and the economics of its price forces us to come to relate food to place–and follow the routes food travels as it reaches our plate, teaching us how food systems mediate our relation to the space where it is grown.

The call to action to “vote with our forks” reflects not only a desire to eat good food, but to appreciate the origins of grown food, from its cultivation to practices of animal husbandry, and a call for responsibly to map the food on our plates.  It raises possibilities for historical maps of shifts in food supplies, of understanding the first airlifts of tomatoes from Dutch greenhouses, or the economy by which fish are flown around the world–in the hope of reclaiming an awareness of mapping food, this blogpost discusses the ethics and benefits of rendering food cartographically.

1.  The project of mapping extends far beyond enjoying local cuisines–that’s a great thing, but mapping is here a critical project.  The volume aims to achieve a re-mapping of our relation to the land in understanding the routes by which food arrives in our refrigerators, kitchens, and plates.  As we search for maps to excavate or understand how food ties us to a basic relation to the land, it’s not surprising that food-mapping, as much as food-writing, is a way to call to attention the problematic estrangement of food from place in contemporary life.  For maps of food prices and growing regions attempt to preserve a clearer relation of food to place and to help understand how complex our relation to food has become.

The maps compiled in FOOD:  An Atlas–discussed in my first post in this blog–raise a number of thought-problems about the relation of food to place. Each attempts to preserve and privilege local notions of our relation to food as we are starting to situate traffic in food within an age of the global circulation of goods.  It is the ideal gift for fans of farmers markets, and to those interested in taking back their relation to food.  The interest in mapping food starts from mapping the sources of the food we eat, but advocates a new ethics for mapping food to understand our relation to space.  In a series of crowd-sourced maps of different scale that are grouped thematically, they image eaters’ relations to regions and the mediation of local to global in foods.  What is compelling about this “atlas” is how each of the maps subverts the universalizing authority of the map by privileging access, availability, and the distribution of food and by asking us to start to remap our own relation to networks of food supply.

The maps were drawn to create a living geography that mirrors a geography of food through questions of local availability and exchange, as well as by mapping food consumption:  they reveal how all food exists in a network that links us to place.  The mapping of food is a necessary extension of writing about food if we are going to take seriously what place and location mean in our food supplies.

2.  Food has long been mapped.

Food tastes define regions; the resources of food are often mapped to define the integrity of geographic areas, patterns of transhumance, and geographic divides. Take, for instance, an early historical map of the divide between the consumption of oil and butter in early modern Europe, of the sort used as critical tools to understand the material basis of civilizations by members of “the Annales school” of French historiography, and exemplified by the work of Fernand Braudel, who sought to illuminate the “deep structures” and rhythms of a Mediterranean mapped by vines and olive groves.

The division was seen as as basic to the nation, rooted in north-south divides, and presented as easily able to orient oneself to as by a compass, even if more likely through regional themed restaurants, bistrots, and cookbooks–as if geography underpinned destiny, even allowing for multi-ethnic tolerance and a myth of national coherence in the pentagram that seems to capture the European divide of Mediterranean and on-Mediterranean cuisine on a simple index exactly corresponding to national départments, even if it suggests a shaded spectrum as much as a firm geographical divide.

To be sure, this generalizes in part the divisions in France to understand the divisions in European consumption at large, separating the Mediterranean economies into vegetal and animal fats.  One might compare the amount of disposable money spent on vegetable oil versus butter, to reveal the mythic divide of the “butter line” in France, an image that was perpetuated in school textbooks ten years ago as a sharp culinary divide that smacked of the persistence of localism in the nation, if not lines of national fracturing:  the north is the land of butter, school kids learn, even if it fades into the orange-hued Mediterranean south the land of oil through a fuzzy land of light green, where butter only slightly dominates households’ grocery bill.

consommation de beurre et d7huile

Knafou, Géographie:  Les hommes et la Terre (1997)

The map echoes with deep structures of fat use and food preparation that structure the land, as uses of sweet butter or salted butter distinguishing each départment of la France, along less clear north-south divides, although the lack of serious gradations of color in this map where many reveal fairly equal divides are betrayed by the stark chromatic divides that preserve regional fracture lines:

image-8

But it also used maps to delineate a lived space that expanded beyond the experience of its actors, their emotions, and relations to life.  The nation may be a culinary map, of sorts encouraged by cookbooks on “French Cooking” the combine culinary divides,

BenSanders_FranceFoodMap

but the tradition of local distinctions of food tastes in départments, even with increasing geographic mobility, is reflexive, and belts have been mapped between the uses of butter, margarine, and oil, that may map more complex and fluid divides in food use, in this 2012 map of what presents a picture of  greater regional complexity to map readers.

butter:margarine:huiles veg, in 2012

In Francophone fashion, the Annaliste maps statistical divides as learning aids that exploit the objectivity of cartographical accuracy as a scientific foundation for historical inquiry.  Rather than map routes of historical exchange or structures of daily life, they map agronomic foundation of political cataclysms or events s  to draw distinctions that are not viewable to actual participants, rather than the finer grain of local variations.  Such a map of butter and oil maps the habits of consumption and reliance on fats to draw a line of difference that distinguish and demarcate the Mediterranean, but  have an odor of essentialism that perpetuates the naturalization of differences.  These lines of division return along different latitudes:

europedivides

What’s lost in drawing such crisp lines of division is the meaning of local.   We privilege lines of regional and national differing as explanations of difference, without looking at how meaning was made on the ground, even as these maps seek to reveal the coherence of deeper structures from the “folds of the Mediterranean” to the proportion of arable lands.  A related if distinct danger in mapping food differences is that we elide consumption and production, or view the economies of production and consumption as a unit, rather than examine the choices available in a market that could reveal how populations relate to a complex global market of food.

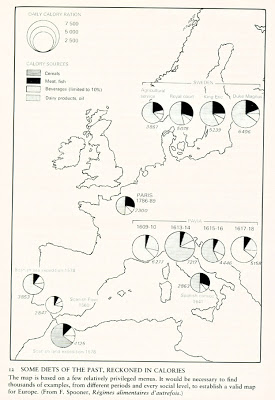
The Annaliste maps made sense as a way to understand the distribution of goods or the distribution of resources in a map of zones of caloric intake:

CaloricIntake1600b-2

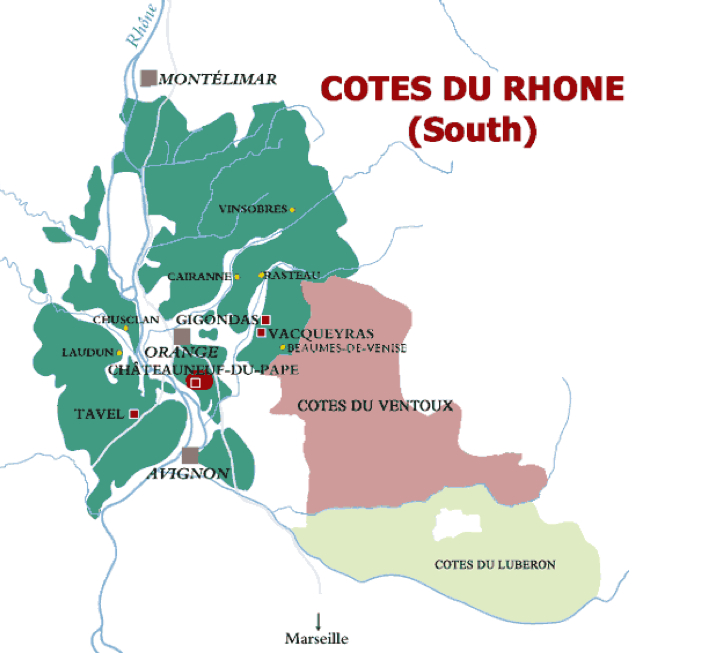
Of course, when one thinks of how French map food, one thinks of terroir as a championing the authority of local wines:

Cotes du Rhone
Region of Bordeaux

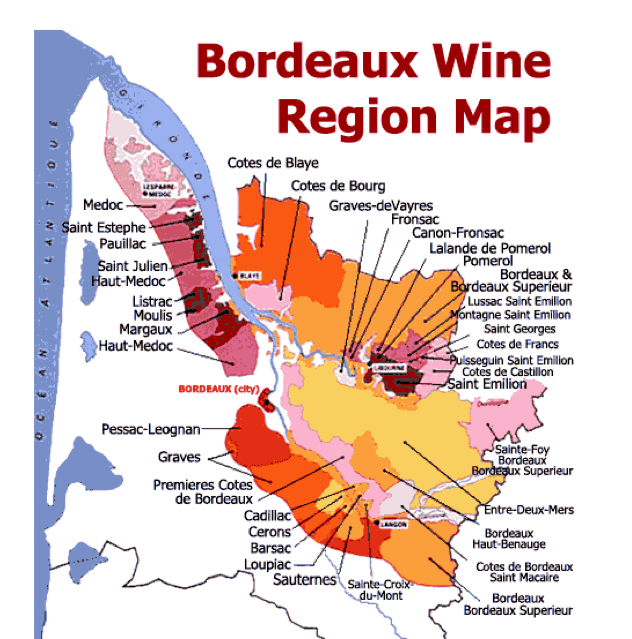
Maps such as the above value place, location, and authenticity.  But authenticity is a scarce commodity, and food maps look far more strange as food choices are mediated by the vagaries of a food economy, responding often to the availability of disposable income, scarcity, or market forces.  We have seen a recent rise of islands of awareness of food and islands of distinct eating patterns and even archipelagoes.  Such islands are created or emerge near to fresh produce growing areas, or farms, as farmers’ markets arrive in cities with the promise of “fresh” food grown in a “local” way–if not in the cities where the markets occur, but in farms that promise sanctioned growing practices–and access to a sense of place in our plates.  To be sure, the creation of farmers markets in cities can be active ways of reclaiming pubic spaces as sites of sociability and exchange, and probably are tied to the ‘greening’ of urban space associated with projects of urban agriculture of the sort that has also begun to be mapped.

But there is a way that the issues staked out in these maps engage the globalization of food consumption, the mediation of foods in the urban marketplace, where food is removed from place and eating removed from the places of growing food, consumers lack a clear set of tools for remapping one’s relations to food, as there is of restoring a sense of place to one’s dining plate.  “Place” is not understood in terms of cuisine, however, but geographic specificity:  as wine is regionally grown, coffee beans or honey are sourced, linked to “origins” that we’ve lost sight of in a global marketplace, and high-end markets promise to recapture a specific place of origin–presumably one cleaner than the spaces in which we live–and a sense of authenticity that we used to look for in local cuisines or while traveling.

3.  Maps draw our attention to the local through the maps in FOOD:  An Atlas.  

For the maps that it includes focus an eye on the manner it maps how food travels over space through an ethics of cartographical representation.  The open-sourcing of maps for this volume suggested an attempt at recovering a transparency in understanding the sources of food, and removed the project from a single authorial bias.  There is indeed a shared pleasure of providing different maps of food sources, and at revealing exchanges in a variety of food products in different cartographic formats and conventions.   The many maps of modern practices of food consumption clarify our current (confused) relation to the land in relation to questions of the just access to food and food supplies in ways that mirror a new concern with food and social justice activism, by revealing the value of a new ethics for mapping food.  Such an ethics of mapping were raised by the late Brian Harley in the early 1990s, when he called for guidelines in formulating principles to help formulate maps that are themselves made to support moral or ethical judgments.

The geographer Brian Harley was preoccupied (he seems always to have been preoccupied by something pressing in the meaning of maps) by an ethics of mapping and the ethical nature of the questions that mapping practices inevitably raise.  He raised a set of questions in the spate of short articles that preceded his untimely decease including:  what are the ethics of cartographical practices? could a more ethical cartography exist? can we move from “what map is good?” to “what map is just?”  Isn’t the problem of map making not only in preserving standards of cartographical illiteracy in an age of the rise of automated and computer-generated cartography (Google Earth?), but in a failure of attending to the ethics that are concealed in the universalizing project of mapping and the interested nature of any map?  It would be unjust not to map sites of toxic waste, and to pretend that they didn’t exist or were not worthy of consideration.

To do so would be to indulge in the cartographical illusion of mapping a sanitized relation to space.

map

Familiarity with such questions might explain the interest generated in maps of food.  They present our relation to the land, or map how food mediates that relation to the land.  They recognize that our relation to the land is mediated in maps, how we eat food is also a way to construct or relation to place.  The gathering in one book of a set of particularly inventive means for mapping our relation to place pioneer a new iconography to map food that questions the uniform distribution of space in maps, and our relation to what we eat.

Beyond being maps of the appropriation and distribution of food, the maps found in FOOD pose questions of the justness of mapping that recap how social justice has become a concern in food supply and policy.  This makes food-chains and consumption the perfect focus for  Harley’s focus on making the map “a socially responsible representation of the world.”   Harley was troubled by the historical Eurocentric value of cartographical projections, but concerned with the need to bridge practical commitments to precision, accuracy, and exactitude with questions of the morals of cartographical representations that moved beyond the pretense or illusion of objectivity.  His concern with ideological naturalization might begin from how mapping oceans as bright blue concealed environmental impact of industry on water-safety, and universalizing one blue concealed variations in clean water supplies by creating the illusion of abundance; created a misleading uniformity in soil-qualities; how USGS maps omitted sites of toxic waste.

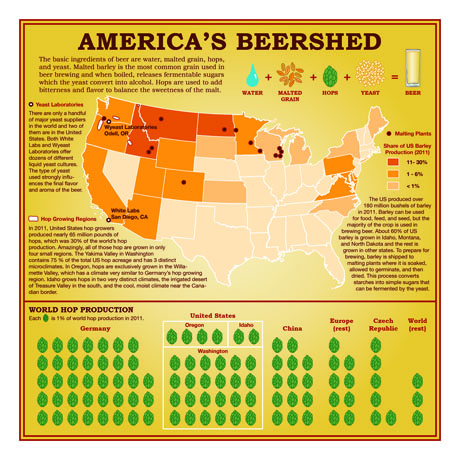
Harley’s concern partly echoed worries that the majority of information imparted to students is removed from ethics, and concern that the aesthetic or perceptual questions of mapmakers needed to be returned to an awareness of the moral judgments made in cartographical design.  This concern is evident in the search for a new iconography of mapping in FOOD to reveal the implications of how food circulates in the modern world, removed from caravans and naval routes, but suddenly dictated by market forces and global exchange:   the concept of mapping the transaction of food supplies illuminates the all-too-easy naturalization of a relation to food.  There is a danger to forget discrepancies in the availability and scarcity of fresh food; lest we forget this, witness the urban “food swamps” where more junk food is sold than fresh produce.  We might forget where tomatoes come from, viewing them as located only in a grocery:  yet witness the established routes of the importation of tomatoes across Europe, where crops move and circulate along routes removed from natural settings.  And witness the uneven distribution of major crops in the United States.  We can learn more about our food, and increase awareness of its sources, by continuing to map where our food comes from by reading how foods are distributed in maps, rather than letting maps naturalize our relation to space.

Harley’s concerns with such an ethics of cartography no doubt began from keen historical awareness of the basis in maps as the English Ordnance Survey with military needs, or the uses of mapping in processes of colonialization in South Asia or the naturalization of Apartheid in the former South Africa, downgrading or erasing informal black settlements in maps; this cartographical distortion suggested either the illegitimate nature of their claims to space or lesser place within the consciousness of the maps’ intended audience:

south african towns and townships

These maps of South Africa distorted the social landscape of townships in ways that masked actual size of settlement towns, making it impossible to locate the settlements or place them in collective knowledge, and granting greater prominence to a network of white settlements which the maps treat as more historically permanent and hence more legitimate.  Such maps are perhaps inherently conservative to a dangerous degree, as they retained “white” cities as the most important for their users, erasing the stability or permanence of settlements–or presuming that no user would be interested in locating them in the map.

Harley’s consternation at the dilemmas of mapping led him to challenge mapping as primarily mathematical and note that it was fundamentally illusory in how it  re-described the world.  In calling for a more “self-critical, socially sensitive, politically street-wise approach to the practices of map making and the objectives of cartographical activity” Harley hoped that cartographers could “recapture control over the morality of the map” in ways that exercised moral judgment, rather than “being relegated to becoming a robotic arm of an institutional or commercial patron” (Harley 1991).  Although he devoted less attention to the consumption of maps or the levels of literacy of reading maps, focussed as he was on the construction of maps and the contexts in which they constructed a social reality, Harley valorized the literacy of reading maps as a way that ethical statements could be made by mappers.  He was particularly concerned lest the makers of maps unintentionally become instrumental in undermining an ethical relation to the landscape in which we live–and perpetuate a simulacrum restricting our relations to social space as well as to agrarian place.

4.  Harley’s work has usually been read in relation to critical deconstruction, have the rise of the moral cartographer.  Many of Harley’s critics have called him optimistic (or utopian) for hoping that maps could change our attitudes to social space.  But perhaps it is not so utopic at all in an age of globalism.  Since Harley asked that we consider the moral benefits of mapping the world in a new way, and how questions of social justice can be endorsed by cartographers, the proliferation of GoogleMaps have distorted or make misleading links between places, and their totalizing claims to objectivity have revealed their flaws or limited reliability.  Crucial to Harley’s call for an ethics of cartography was a refusal to accept only official data that might obscure or silence local variations and local meanings:  we have seen a range of new mapping forms in recent years that call attention to the overlooked, from maps of superfund sites to Crow and Lodha’s Atlas of Global Inequalities (2011; http://ucatlas.ucsc.edu/index.php).

These maps use the familiar cartographical certainties to define monolithically uniform spaces in relation to each other, without much fine grain for local differences and, despite their illuminating observations of inequalities, sacrifice relations to place to draw and reveal stark contrasts in national GDP.

gdp_ppp_1980
gdp_per_cap_2000

The losses of the erasure of local meanings was central to Harley’s call for a new ethics of cartographic practice, engaging not only the conventions of mapmaking that create stark hierarchies of meaning and prominence, but the iconographies by which distributions were noted.  Harley was particularly preoccupied that the increasing institutionalization of technologies of Geographic Information Systems and automated cartography would  omit a local relation to the landscape–and indeed promote a uniform mode of mapping often   insensitive to local social or environmental issues.  But the malleability of the computer-generated statistical map has created the opportunity for expanding the map as a critical tool in Crow and Lodhi’s Atlas, so that questions about global relationships can be readily viewed across space and time with iconic power.

A more seriously revisionist approach might play off of our familiarity with the significance of cartographic icons or even color schemes.  One example of engaging the familiar color-schema of maps that have dominated the media in recent election cycles to create a new map of meaning in our political divides lies below.  This map re-appropriates the stark red-blue division in its syntax, re-presenting how we understand the divisions between red and blue states not in terms of ethnicity, race, or the voting tendencies of segmented pie charts of the population.  We can understand this stock division by mapping underlying social practices, as revealed this map of the prevalence of bookstores versus churches across states:

Bookstores versus Churches

The mapping of the prevalence of bookstores generally follows patters of urban settlement–the places most likely for a bookstore to occur that would be economically viable, to be sure.  Although a telling snapshot of American, the map may not hold as bookstores dwindle or become less economically feasible in more states; one might be tempted to  extrapolate that with the greater likelihood of the closure of bookstores, as Amazon and online sales expand, the expansion of red states threatens–but the map is a tool to reveal social practices, rather than a map of the characteristics that determine a population.

The statistical map reveals how the occupants of each region view space, however, and the sorts of spaces in which they chose to live.  And we can see that there is no such thing as a homogeneous red or blue space, or a clear map between, as Zook and Graham put it, faith and reason.  The density of bookstores or churches in each place is divided by a national average, we can map a propensity for lifestyle choices, rather than the actual decisions or actions of a given population.

This sort of a map as an ethical intervention, in other words, by revealing the complexity of a landscape and asking us to relate it to the sort of landscape in which we live or want to live, rather than draw clear divisions based on statistical averages or means.  We should have maps of food that allow us to know what foods we chose to eat, and what foods are most available in our environment–or the agrarian environments or marketplaces from which the food we eat derives.

5.  The maps in the self-published curated collection FOOD: An Atlas are all inventive uses of cartographical iconography to illuminate the local by mapping local meanings and currencies of food.  They offer provocative templates to examine our own relation to food.  The editors reveal their commitments to food justice activism, mapping eating habits over space to reveal how constraints of economy, availability, and attitudes to food inform discrepancies of food consumption.

Does the density of farmers’ markets in Berkeley whose vendors are required to sell food from a minimum of ten mile radius reveal a geographic pocket that will encourage new attitudes to food?  does the actual access of the produce sold at farmers’ markets provide an index into local attitudes to changing patterns in the consumption of food?

v6SNAP_FoodAtlas

Does the way that the food industry draws with surprising ease from a range of geographic sources create a new sense of how we relate food to place?  It is particularly compelling to view a map of how regions protect or safeguard local food specialties in the European Union, protections no doubt militated in part to protect local economies:

PDO-PGI-TSG_v2.2b - transp copia

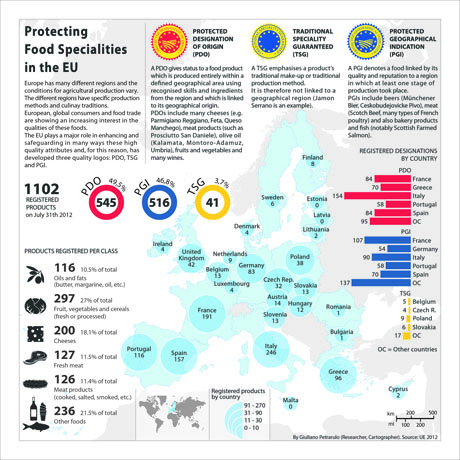
It is in some way an act of resistance and a way of framing spatial knowledge to assemble a new “map” on a regional plate.  Take the time, in other words, as you eat, to map the origins of the food that shows up on your plate.  If you’d like to do so with more precision, or are uncertain of the origins of what you eat, feel free to use a handy program as a guide, at http://www.thefoodmap.org/

Or, if possible, please do consider ordering a copy of the atlas, http://www.guerillacartography.net/home.html

There will be an informal collective publication party for the book of maps and an ongoing discussion about its February 17 release party at Smilodon Plaza outside McCone Hall at the University of California at Berkeley: Food: An Atlas Release Party.

Where: Smilodon Plaza at McCone Hall** University of California Berkeley, California

When: Sunday, February 17, 2013 11:00 a.m. – 5:00 p.m.

 This even being long past, for an absolutely free download of the maps in the atlas, click here…

1 Comment

Filed under data visualization, early modern Europe, Food, foodscapes, national divides

Map-Inspired Madness: Mapping the Great White in the Solitude of Ahab's Cabin

The terrifying search for the whale Moby Dick runs almost vertiginously off the known map.  The absence of bearings are particularly apparent in an era of increased map-printing and the growing claims of map authorship, often insecure of the origins or coherence of their captain’s narrative design.  The quest for the elusive Great White takes readers literally off the map, as The Pequod leads readers off of the map, in frequently disorienting ways; the apparently unreliable narrative carries readers on a quest for Moby-Dick into unknown areas less mapped as the almost  primal site of whale spawning, unknown to most, where the craft, itself adorned with whale bones—“tricking herself forth in the bones of her natural enemies,” bulwarks adorned with sperm whale teeth, rudder made from a whale jaw bone, seems to seek to arrive by human artifice, as if to persuade the whale to reveal itself by charms–or be all too similarly cannibalized by its craft. 

As the voyage progresses across the seas, Ahab descends to madness as he falls into maps in his desire for stability and power.  The book is an epic of consciousness, of Shakespearean scale, and a study in a landscape of psychic interiority.   As if conjuring the character of Ahab, on the final flyleaf of a volume of Shakespeare’s works, Melville echoed the words that Captain Ahab deleriously howls as he mock-sanctifies the harpoon he feels destined to kill Moby Dick.  The devlish incantation sums up his monomaniacal absorption, inverting the sacred ritual of baptism of a Christian soul, “Ego non baptizo te in nomine Patris et/Filii et Spiritus Sancti–sed in nomine/Diaboli”–after which Melville added:  “madness is undefinable” in its hubristic drive for “converse with the Intelligence, Power, the Angel.”   If Melville was raised in the austere Calvinist, learning the catechism in the Dutch Reform Church, taught to  “acquiesce in God’s will, no matter how unjust or cruel it might seem,” without recrimination for the divine plan, Ahab’s attempt to conjure the Great White whale moves not by summoning angels or demons but by conjuring his location on maps, as if to trying to conjure the whale by imprecations, charms and talismans.  The charms, we learn in Chapter 100, begin first and foremost in his obsessive reading of nautical charts and maps. Ahab’s mad drive is no where more unbalanced than on his obsessive poring over maps to reveal the location of the whale, as if he might geolocate his position by latitudes and longitudes. Ahab’s investment of maps with mystical powers is almost a clear echo of the Theurgic magic that Melville saw as the belief in his ability to conjure the whale he so obsessively seeks.

Of course, as Melville would remind us, the map is all in the eye of its reader.  Maps, in contrast, provide a sense of stability to Ishmael, and were the basis of historical orientation to the seas.   ‘It is not down in any map; true places never are,’ Ishmael descriptively evokes the mysterious origins of his fellow sailor and companion, Queequeg, whom he praises as “George Washington cannibalistically developed.”   Queequeg hails from the South Seas, and his unknown origins betrays the fascination of unmapped spaces and the allure of being “off” the map.  The sailors’ concern with mapping places haunting the narrator of the novel obsesses the monomaniacal ship’s captain who leads his ship to the same area of the globe in search of the lone whale he seeks to lead an increasingly wary crew.  Melville wrote with a particular sense of spatiousness in a chapter that first tells the story of the Great White Whale–“Moby-Dick” (Chapter XLI)–poses the question of preserving collective knowledge to gain bearings on the location of the White Whale, that suggests the onset of the first mapped knowledge of whale routes.  If providing pictures of  the specter of the whale from from the point of view of the whale-man, the encounter of ships at sea at the start of the hundredth chapter betrays a  desperation to orient his ship on the high seas, but which the conjurer Ahab invests with devilish properties as if they had the Theurgic properties he so diabolically desired.

At the start of the hundredth chapter of the massive narrative, an obsessive Ahab cries hopefully to crews of a passing English ship monomaniacally—“Ahoy!   Hast thou seen the Great White?”   Ahab cries in biblical syntax in desperation to the approaching English ship’s captain and crew, showing his ivory leg to the ship whose captain barely seems to understand him, but improbably turns out to be his twin, having lost an arm last year to the very same white whale:  in a macabre recognition scene, the ships joined the two disfigured by the same whale clink ivory limbs, arm and leg, bound by both how their lives found new orientation after their encounters with the great white whale.  Ahab has prepared to track the whale’s course on a map, however, and in ways not often historicized in the mapping of whales, a sort of hubristic act in the case of the Great White that Ahab tracks, and yet a cartographic image of location of the great white whale’s course that Ahab seems perversely and maniacally determined to be able to conjure by a map–perhaps an intimation of madness. As much as revealing the hubris of such determination, Melville’s description of Ahab’s madness is historicized, in a telling footnote, in contemporary maps of whale routes, whose potential promise, limits, and benefits he would have known well as a man of the seas.   

While legends of sightings are dispersed among whaling ships “sprinkled over the entire watery circumference” in disorderly fashion, each “pushing their quest along solitary latitudes,” sharing knowledge about whales’ locations was prevented given the “inordinate length of each separate voyage” and “long obstructed the spread through the whole world-wide whaling fleet of the special individualizing tidings concerning Moby Dick.”  The sightings of sperm whales of uncommon magnitude provoked rumors and fears of encounters with the whale, as one might expect, even if they were recored at a fixed time or meridian.  For, Melville reminds us again of the unique space of the open seas, “in maritime life, far more than that of terra firma wild rumors abound, wherever there is any adequate reality for them to cling to;” in the “remotest waters” or “widest watery spaces,” whalemen are subject to “influences all tending to make his fancy pregnant with many a mighty birth.”  

Such an expansion of legends of the White Whale on the open seas contrast to the single-minded focus of Ahab’s tracking of Moby Dick, and the certainty that the Captain possesses of his ability to find Moby Dick on the open seas .  Such a fixation is opaque at the book’s start, but is perhaps most manifest in his obsessive desire to track the individual whale by the sea charts kept in his cabin, to which he retires to read each night, and seem to provide the first point of entrance into his psyche–and what Melville calls his “monomania.”  As the ship moves over the seas, Ahab returns often to his cabin to read charts, maps, and logs, as map-reading becomes a keen emblem of monomaniacal fixation–as the belief that maps will help him track the whale that he is committed to kill.  The maps may magnify the sense of monomania, the psychological diagnosis of an undue expansion of mental attention on one object; if repeated reading the maps serves as an emblem of the growth of his fixation despite the survival of his intellect; trying to pursue the whale on charts seems to serve to focus his vindictiveness, as if materializing how the “White Whale swam before him as the monomaniac incarnation of all this malicious agencies which some deep men feel eating at them, till they are left living with half a heart and half a lung.”  Ahab’s fixation on the yellowed charts he unrolled on his cabin table express the monomaniacal tendencies defined in nineteenth century psychiatry of how an inordinate fixation persists in an otherwise rational mind; the fixation on mapping the course of the whale obsesses his attentive mind.  

Is the hope of locating the White Whale by the rutters of past whaling ships and collation of mapped observations an emblem of nourishing an undue fixation of his pathological preoccupation, despite his apparent ability to reason the possible path of the whale’s path?  The extended narrative of the ongoing quest for Moby Dick on which Ahab leads Pequod that fills the content of the novel becomes a sort of psychic profile of the obsessiveness with which Ahab takes the Pequod, and the novel’s narrator Ishmael, to encounter Moby Dick in the South Seas–the site of whale -spawning where the novel culminates.  The retiring of Ahab to the solitude of his cabin matches his withdrawal into his mind and serves to nurse his preoccupations.  What provides a more gripping image of Ahab’s inner psyche than the obsessive attention that he gives to tracking the White Whale by maps?   Ahab retires to consult log-books and charts to cull sightings of sperm whales that almost substitute for an actual map or rutter–and for the trust that sailors might place in maps and charts to guide the ship.  The problem of locating the whale s underscored by mention of the “wild suggestions” of many ships that have given the whale chase of an “unearthly conceit that “Moby Dick was ubiquitous; . . .  had actually been encountered in opposite latitudes at one and the same instant of time;” if”the secrets of the currents in the seas have never yet been divulged, even to the most erudite research,” Ahab seeks to challenge this sense of ubiquity through his obsessive consultation of charts, by following of the outlines of naval courses.  His intensity comes to transform his very brown and visage into a lined map, tracing out courses, so that his forehead comes to resemble a chart; reading maps with such obsessiveness to track his prey seems to remove Ahab’s single-minded pursuit from any oceanic transit, and from the common good of the ship that he commands.

Ahab’s monomania may seem sui generis.  But it is closely tied to the mapping project of Mathew Fontaine Maury and the contemporary project of collating open data on whale migration in Melville’s time, and the promise of investing legibility in a global space of whale migration.  Even more than the bodily injury of the loss of his leg that left him tormented with visions of the White Whale, the obsessive tracking and persistent consultation of charts and maps with other records manifests the idée fixe by which Captain Ahab is obsessed, and indeed the solitary consultation of these charts while his crew sleeps at night stand for the single-minded madness of tracking one whale on the open seas.  The folly of tracking the White Whale on a map embodies Ahab’s monomaniacal pursuit of a way to track its course by a paper map.   So fully does map-reading come to consume both his mind and his body as he ponders charts every night in his cabin, drawing new lines and courses by pencil, and revising them, “threading a maze of currents and eddies, with a veiew to the more certain accomplishment of that monomaniac though of his soul, so focussed on a map that, in a brilliant image, his tormented face even becomes a map, bearing the traces of the pencil lines traced on the charts, as if the subject of his fixation rises to the surface of his skin, so entirely consumed his mind by the conceit of mapping the course of Moby Dick.  The appearance of these self-inflicted lines as if engraved on Ahab’s brow–Melville’s image–echo the captain’s fixation with obsessively tracing multiple marine courses on the charts he keeps in his cabin; the courses that are so intensely pondered seem to rise to lines inscribed on his own skin as if in as a consequence of the imprint that tracing possible courses  of the leviathan has brought.  

The conceit of the tracking of whales on maps appears an emblem of Ahab’s madness, if it almost echoes contemporary techniques of Global Positioning Systems.  The utter hopelessness of locating one whale in an ocean map seems apparent; Ahab has indeed so often red maps to transform himself into a map hoping to locate Moby Dick, and the conceit of mapping whales has filled his mind.  Yet, as the “hidden ways of the Sperm Whale when beneath the surface remain, in great part, unaccountable to his pursuers, . . . the most curious and contradictory speculations regarding them, especially concerning [how] he transports himself with such vast swiftness to the most widely distant points”    Melville presents the problem of mapping the course of whales as one by which the crazed Captain Ahab is increasingly consumed, pouring over charts in the captain’s cabin, increasingly isolated at a remove from the crew including Queequeg and Ishmael, and the fate of his ship.  Although whalemen by their expert knowledge often came to the conclusion after the White Whale so often escaped their capture “Moby Dick not only ubiquitous, but immortal,” the presumption of mapping the course of the White Whale’s course is perhaps the clearest illustration and emblem of Ahab’s hubris, and monomaniac obsession with tracking the whale above the expert knowledge of his crew, as he “led upon the whale’s white hump as the sum of all the general rage and hate felt by his whole race,” so violently did he come to see personified in the whale that had once torn off his leg all evil in the world, and pit himself against it.  Maps provide Ahab with a basis to nourish and expand the “monomania  in him [that] took its instant rise at the precise time of his bodily dismemberment.”  If such a mania began he returned home, stretched in a hammock on his homeward voyage, swaying in a straitjacket in the rocking boat returning across the tranquil tropics, as “his special lunacy having stormed his general sanity,” he obsessed after returning to Nantucket with the one aim of hunting the White Whale.  Monomania had almost fallen out of favor as a diagnosis by 1850, when Melville wrote, but novelists from Balzac to Bronte adopted the image of mental fixation and unhinged rationality that Ahab’s reading of maps convey.  

Nothing in Mellville’s novel is so great an emblem indicating Captain Ahab’s madness than his obsessive consultation of nautical charts and maps of which he is a jealous custodian, and which provide the basis to nourish his determination to locate Moby Dick.  Maps may feed Ahab’s relentless compulsion to track the White Whale.  Ahab’s obsession with maps reflects contemporary attempts to map the open seas:  indeed, the superstitious value of the leviathan held a special place in the “wild, strange tales of Southern whaling,” and the deep sympathy of whaling men for their prey, who they know far better than those naturalists who have perpetuated false legends of their fierce animosity for humans, from Palsson to Cuvier, distorting the actual awesomenes of pursuing any whale tracking the Great White.  

Ahab’s obsessive reading of maps to track Moby Dick seems a figure for his monomania, but reflects an actual mapping project tracking whales on the open seas, which Melville knew well, and a project of mapping the logs of whaling ships in legible cartographic form.  Ahab’s use of maps to track Moby Dick mirrors the cartographical project of Matthew Fontaine Maury, the nineteenth-century Virginian polymath and early hero of open data, who in 1851 sought to map migratory routes of Sperm and Right whales or the benefit of the whaling economy.   If Melville often consulted histories of arctic searches for Northern Whales published from the 1820s, the appearance of an authoritative map of the courses of whales that Maury had accumulated from ships’ logs provided a model that attempted to impose human reason and fixed continuity on a whale’s migrating itineraries and paths, in order best to predict its actual location.

Ahab’s obsessive hope to track the course of the great white whale Moby Dick in the ship the Pequod may mirror the scope and ambition of M.F. Maury’s project–a project that led to one of the odder maps of marine population and migration that appears below, but which is one of the monuments of open data.   For Melville, however, Ahab’s mania seems driven by the hope the map carried for being  able to track  the course of the great white whale that his prey, and to arrive at the moment of confrontation that will in fact never appear on any map.  For unlike the observations Maury graphically collated, the specificity of Ahab’s tie to Moby Dick is not on the map at all.

Whale Chart 1851Maury’s Whaling Map; Norman B. Leventhal Map Center at the Boston Public Library

Ahab’s self-imposed sequestering on the voyage of the Pequod in his cabin, surrounded by a variety of charts, seems emblematic of his single-minded obsession to track the elusive Moby Dick.  It is emblematic of a uniquely obsessive sort of map-reading emblematic of his particular sort of hubris:  as he will never know the true path of the majestic whale, his study of the map symbolizes a contest between the mapping abilities of man and whale.

The private consultation of the map in the the secret space of the captain’s cabin reveals the sharp contrast between the whale as an innate cartographer who migrated across seas and the knowledge of routes inscribed in lifeless nautical charts, and the inability to plot or plan the intense longing for his confrontation with Moby Dick within the range of observations of all whales by traveling whale ships.  But it also offers an amazing fantasia of the reading maps and nautical maps as if they were guides to habitation, and a reflection on the nature of map-reading and the comprehensive claims of encompassing known space within engraved maps, and specifically of the colored charts of sea routes, whaling and sighted whales that the oceanographer Matthew Fontaine Maury produced in the 1850s compiling nautical logs of whaling ships, after having remapped the coastline of the United States from the geodetic Survey of the Coast by the Swiss Ferdnand Hassler, which had tried to fulfill the Jeffersonian dream of a nation facing two oceans, before joining the Confederate cause.

image.png .

We have little sense of the amassing of data that existed in Ahab’s cabin, so much as the intense relation that the captain develops to his charts.  Melville describes how Ahab retires to his cabin to open “large wrinkled roll of yellowish sea charts, spread them before him on his screwed-down table,” ready to set himself to “intently study the various lines and shadings which there met his eye,” and escape into the paths that they trace.  The memorable episode in Ahab’s own cabin focusses attention on how the captain’s obsessive consultation of the maps, as a sort of emblem of his search to capture the whale in them.   Ahab processed information in the map as best he could, and “with slow but steady pencil trace additional courses over spaces that before were blank,” while consulting log-books of previous voyages and noted sightings of sperm whales in a desperate attempt to locate the migratory path of the white sperm whale Moby Dick–whose own route he so obsessively seeks to understand and on which he fixates so obstinately. The reading activity is isolated and isolation, because the map is essentially mute, a second order of spatial knowledge with which he has no literal traffic or exchange, but becomes a way to wrap himself in further isolation from the mammal that communes with the productive fecund waters of the sea.  “While he himself was marking outlines and courses on the wrinkled charts, some invisible pencil was also tracing lines and courses upon the deeply marked chart of his forehead,” as every night, “in the solitude of his cabin, Ahab thus pondered over his charts, . . . threading a maze of currents and eddys [sic], with a view to the more certain accomplishment of that monomaniac thought of his soul.”

Such a collective map of the sightings of whales is both the focus and talisman of Ahab’s monomaniacal will:  both as the transcription of the paths of hidden submarine itineraries, “with the charts of all four oceans before him,” and the hubris of understanding the concealed migratory course of that noble whale with which he is so obsessed and that has long evaded his search.  For Melville confides that “it might seem an absurdly hopeless task thus to seek out one solitary creature in the unhooped oceans of this planet” to many; “But not so did it seem to Ahab, who knew the set of all tides and currents; thereby calculating the driftings of the sperm whale’s food, which whales were imagined to follow; and, also, calling to mind the regular, ascertained seasons for hunting him in particular latitudes; could arrive at reasonable surmises, almost approaching to certainties, concerning the timeliest day to be upon this or that ground in search of his prey.”  The privacy of the consultation of the tables that allow him to try to read this map, and to establish the position of the whale he seeks, becomes the basis for the captain’s obsessive hope to track the progress of the whale, better to interpret its location.

The intensive reading of ocean charts becomes a site of reading that obsesses Ahab as a means to determine and decipher the logic of its movement stand at odds with the description of the sublime nature of the sperm whale, whose own head cannot even be read without wondering at the majesty of the form of the “head of this Leviathan,” truly “an anomalous creature,” impossible to interpret or decipher, whose imposing grandeur is of such “god-like dignity” to defy human interpretation.  As the wonderfully described problem of the legibility of the “plaited forehead” of the Sperm Whale is a living surface that defies interpretation, inscribed with “innumerable strange devices for [its] emblematical adornment,” following not Euclidean mathematics, but rather “pure nautical mathematics,” the mapping of the course of the whale seems to defy tracking by Euclidean tools also defies reading, much as Melville described the sperm whale’s forehead forms a “mystically carved container,” the lines of whose face defy clear reading, as the “bumps on the head of this Leviathan” is a surface whose interpretation “no Physiognomist or Phrenologist has as yet undertaken,” and would challenge the abilities of Lavater–despite his study of animal faces–or Spurzheim or Gall, suggesting the intractable indecipherability of the whale, but whose “sublime aspect” and “added grandeur” Melville attempted, in the brow in which “mighty god-like dignity” is indeed “inherent” in a brow “plaited with riddles,” presenting Lavater’s mark of genius in the depressed crescent at its middle, in a brow “so amplified . . . you feel the Deity and the dread powers more forcefully than in any other object in living nature.”

As the brow of the leviathan remains challenging to be read, any hope of reading the map of the path it takes seems, despite Ahab’s desire and Maury’s map, Melville appears to assure his readers, as futile as a way locating the actual whale Moby Dick, but becomes an obsessing act of tracing, retracing, and location, that becomes Ahab’s obsessive interpretive project in Melville’s novel.  The fantasy of an ability to harness sperm whale as a medium or vehicle for global travel had appeared in the Currier & Ives satire on the California Gold Rush circa 1849, “California Gold,” that conflated value with the huge “Blower” a ’49er placed in a harness to steer his chunk of gold across the Cape Horn, rendering the prospect of laborious journey to California as a fantasy of the domestication of wild mammal put to use as a private frigate:  while the whale’s course was never to be so predictable the Currier & Ives cartoon suggested the appeal to a broad imaginary, a joke on global travel if not the presumptuousness of circuits around continents.


Continue reading

4 Comments

Filed under American literature, data visualization, Herman Melville, Moby Dick, open data

Mapping Knowledge and Mapping Food

Image

What relevance do maps have in a world often organized by database systems that are in themselves often impossible to visualize?  One answer is that the map is not only a visual register of data, but prepares an active correlation of information patterns and raises questions about human relations.  Rather than arranging data, maps show or highlight selective relations between data in graphic form.  Maps do so in ways that generate questions about our relations to space, if not the variety of relations each of us occupy to an otherwise uniform expanse, in order to make space our own; they are as a result particularly useful tools to ask us to consider our sense of place in ways that we might not otherwise find a way to puzzle over and consider, or find a way to concretize.  Although the size of massive database systems escape the kind of an individual, the maps that guerilla cartographer Darin Jensen has solicited and assembled in FOOD: An Atlas raise chart the spaces we organize around through food, and understand place through the intersection of place with how food is produced, exchanged and consumed.

In an age of the unwarranted expansion globalization of food consumption patterns and trade, where the importation and circulation of foods to their consumers often seem shaped by processes irrational in nature, the rationality of the map provides a way to raise questions about how to understand the ways that food sources and substances travel across space both in commercial ways and in raising questions about the efficiency of these systems.   In identifying and rendering a joint database of food production and consumption, we can grasp in an entertaining visual form multiple questions about how we value the place of our food and how food is now valued and exchanged over spaces far beyond the places where it is grown.  We may not know what bacillus of yeast helped the fermentation of the glass of beer we are drinking, even if we prize the origin of our coffee; we can’t visualize or often even know what field of tomatoes provided the basis for our pasta sauce, or the huge range of regions united in the foodstuffs in a plate of school lunch, or where the almonds of northern and central California travel in order to reach consumers from the Central Valley.  The maps in FOOD:  An Atlas provides a range of provocative maps of how food interacts with space that provide a compelling set of questions about our relation to place, and indeed the relation of food to space.  Maps of the global distribution of grains, or of the costs of the same foodstuffs, remind us of how food exists in relation to place, even if food travels globally—as well as the places where food grows.

The compilation is a true atlas of modern life—or of modern tastes for foodstuffs.  The Dutch engraver and cartogapher Abraham Ortelius compiled the first global atlas by sourcing maps from different areas in Europe from his multiple correspondents in the 1560s, obtaining a range of extant cartographical forms of nautical and terrestrial form that he collated in a synthesis of terrestrial coverage that canonically redefined the image of the inhabited world.  Refined and expanded in his own lifetime and after his death, the Theatrum Orbis Terrarum bound these multiple maps obtained from different parts of Europe and vetted in Amsterdam in a single commodity that was immensely popular and, though dedicated to Philip II of Spain, was disseminated over a huge geographic expanse.

The crowd-sourced maps collected in FOOD were sourced in a considerably shorter period of time over the global internet, solicited from cartography listserves and Berkeley classrooms alike, starting from the North American Cartographic Information Society (NACIS) and coordinated through a GIS lab where proposals for mapping were often linked to potential owners of databases, and submitted maps refined for their persuasive visual organization, the transparency of their cartographical iconography and the appeal of their format.  The variety of graphic skills that are applied to map food and food’s distribution are themselves inventive exercises, and suggest the degree of invention that

The crowd-sourcing of the atlas is not only a question of pragmatics, but itself an instance of informational exchange.  On the one hand, Jensen describes how he arrived at “a project of guerrilla cartography and publishing” as the result of a natural desire to make the sort of compilation of maps that “take too long to make,” which led him to “an experiment in doing it faster,” both by relying on crowd-sourcing and local publishing. “It doesn’t have to take two or three years to put out a book or an atlas.”  The anonymity of the crowd sourcing generated a far more imaginatively diverse use of mapping conventions—unlike Ortelius’ interest in universalized norms, they celebrate local diversity of mapping abilities in keeping with the polycentrism of a post-modern age.  Rather than conforming to a single style or aesthetic, each crystallizes specific issues in an individual fashion.  The maps provoke us to consider the relations of place and food, and alter or tweak our relations to the world in mapping the circulation of food wastes, the sites for importing tomatoes for that pasta sauce, or the “food swamps” where junk food constitutes a dominant share of the foods for sale.  Each is brilliant in its own way.  Whereas we know the many authors of the maps that Ortelius collected primarily from his extensive correspondence, as well as the “elencum auctorum” that provided a comprehensive list of the different authors of maps in his atlas and sources that were consulted in its creation, Jensen lists the individual or joint authors of each map–and even invites us to construct our own!

Why create a set of maps of the relations between food and space?  This volume is a way to rehabilitate the use of the map as a way to consider and contemplate relations we construct between place, as well as the product of a local culture of food.  All food is local, even if the world we live in has globalized food as a resource.  The open arguments of maps Darin Jensen and his team assembled in FOOD:  An Atlas provide a collective tool to understand what might be called the irrationality of the globalization of food sources in the transparent and supremely rational language of cartographical forms.  Much as the previous MISSION:  POSSIBLE led us to view one neighborhood in San Francisco in new terms of the distribution of coffee-shops, trees, ethnicities, restaurants, underground gas reserves, parking spaces or sounds, each map in FOOD:  An Atlas provides a distinct corner of the exchange of food as commodities and elegant goods we value for their local origins, as well as celebrating the recent growth in the valuation of the locally produced good.  As Jensen’s map of the Mission noted the rise of artisans in the neighborhood, the mapping of Farmers’ Markets—both in Berkeley and in the United States—offers a view of the rising value of the locally farmed (and even the changing definition of what local farming means) as well as the access and audiences of these markets.  As MISSION:  POSSIBLE provides both a map of a region of San Francisco and a sort of surrogate for orienting oneself in any modern city, FOOD:  An Atlas provides a tool to orient oneself within the global exchange and local production of foods.  The map of areas of urban agriculture in San Francisco that is included in FOOD is a great model of a collective interest in the local production of food in that city, and a sort of template for resisting a growing divorce of food and a local landscape.

To order a copy, visit http://www.guerillacartography.net/home.html

How better to understand the pathways by which select regions of almond-growing enter the chocolate bars sold across our nation, or consider the inequalities of food that dominate the urban and rural landscapes in an era that celebrates famers’ markets?

http://missionpossiblesf.org/

https://www.facebook.com/food.atlas

http://cafarmersmkts.com/

2 Comments

Filed under Abraham Ortelius, crowd-sourcing, Darin Jensen, data visualization, data visualizations, datamaps, Food, Food Maps, Geographical Information Systems, Guerilla Cartography, NACIS, The American Beershed, Uncategorized