
All maps encode narratives, and we turn to maps to spin narratives about the nation every election cycle. But the rebirth of federalism from 2015 changed the division between red and blue states on the map, and created a deep resentment toward Washington, D.C. The birth of a division between “red” and “blue” states which emerged in the late 1980s has been revised as several states have started to melt purple, and others shift their demography. But that creates its own narrative of nationhood: increasingly, from 2000, “red” states came to describe the national political geography, far more than, say, regions of the “South” or “Northeast” could hope to do, or that the “West” once did.
To be sure, recent threats–or concerns–that supporters of Donald J. Trump in the 2016 Presidential Election would not support the decision of the nation might serve to remind us of just how important the unity and bridging of regional divides is after a presidential election–if only to repair the rifts that might have been particularly pronounced in our current political campaigns, no doubt as the campaigns have become more extended and increasingly conducted in rallies and over televised conventions, and voters more ready to demonize their candidates’ opponents on social media. Trump’s request to monitor election booths to prevent voting fraud may have encouraged fear of fraud in the nation unlike the recent past, but revealed a deep disturbance as to the trust in common institutions, no doubt reflecting the lack of a common news source. The increased skepticism as to the authority of the results of the election may seem a bizarrely clever ploy–given the guarantee it created of silence as to the apparent results of the election that Trump later won–but the seeds of doubt the charges seemed to create were most able to find an audience in southern states, in part as such deep doubts existed about the proprietary nature of a white, male identity.
The unpacking of the regional identity of the Gas Tax Latitudinal Divide provides an interesting instance of the transmission of identity across time–even despite the clear lack of qualitative local detail that the map of regional anti-federalism provides. The access that maps offer to narratives widely vary from the itinerary to the abundance of topographic maps. But data visualizations as that of gasoline taxation provide a problematically pronounced thin description of expanse, the relative opacity of whose surface is difficult to enter, and whose past is more difficult to excavate. Such visualizations focus so closely on mediating the immediate short-term, stripped of narrative context, and removed from history, one can ignore the divide they reinstate over memories of earlier divides. But when one examines the continued adoption of voting rights restrictions in the United States, the echo of political legacies in the land as to the role of government–and its openness to the participation of all citizens–is especially evident in the stipulation in the Voting Rights Act that certain states cannot change election policies without oversight from the Attorney General, and that longstanding legacies of voter exclusion warrants continued federal oversight of voting laws.
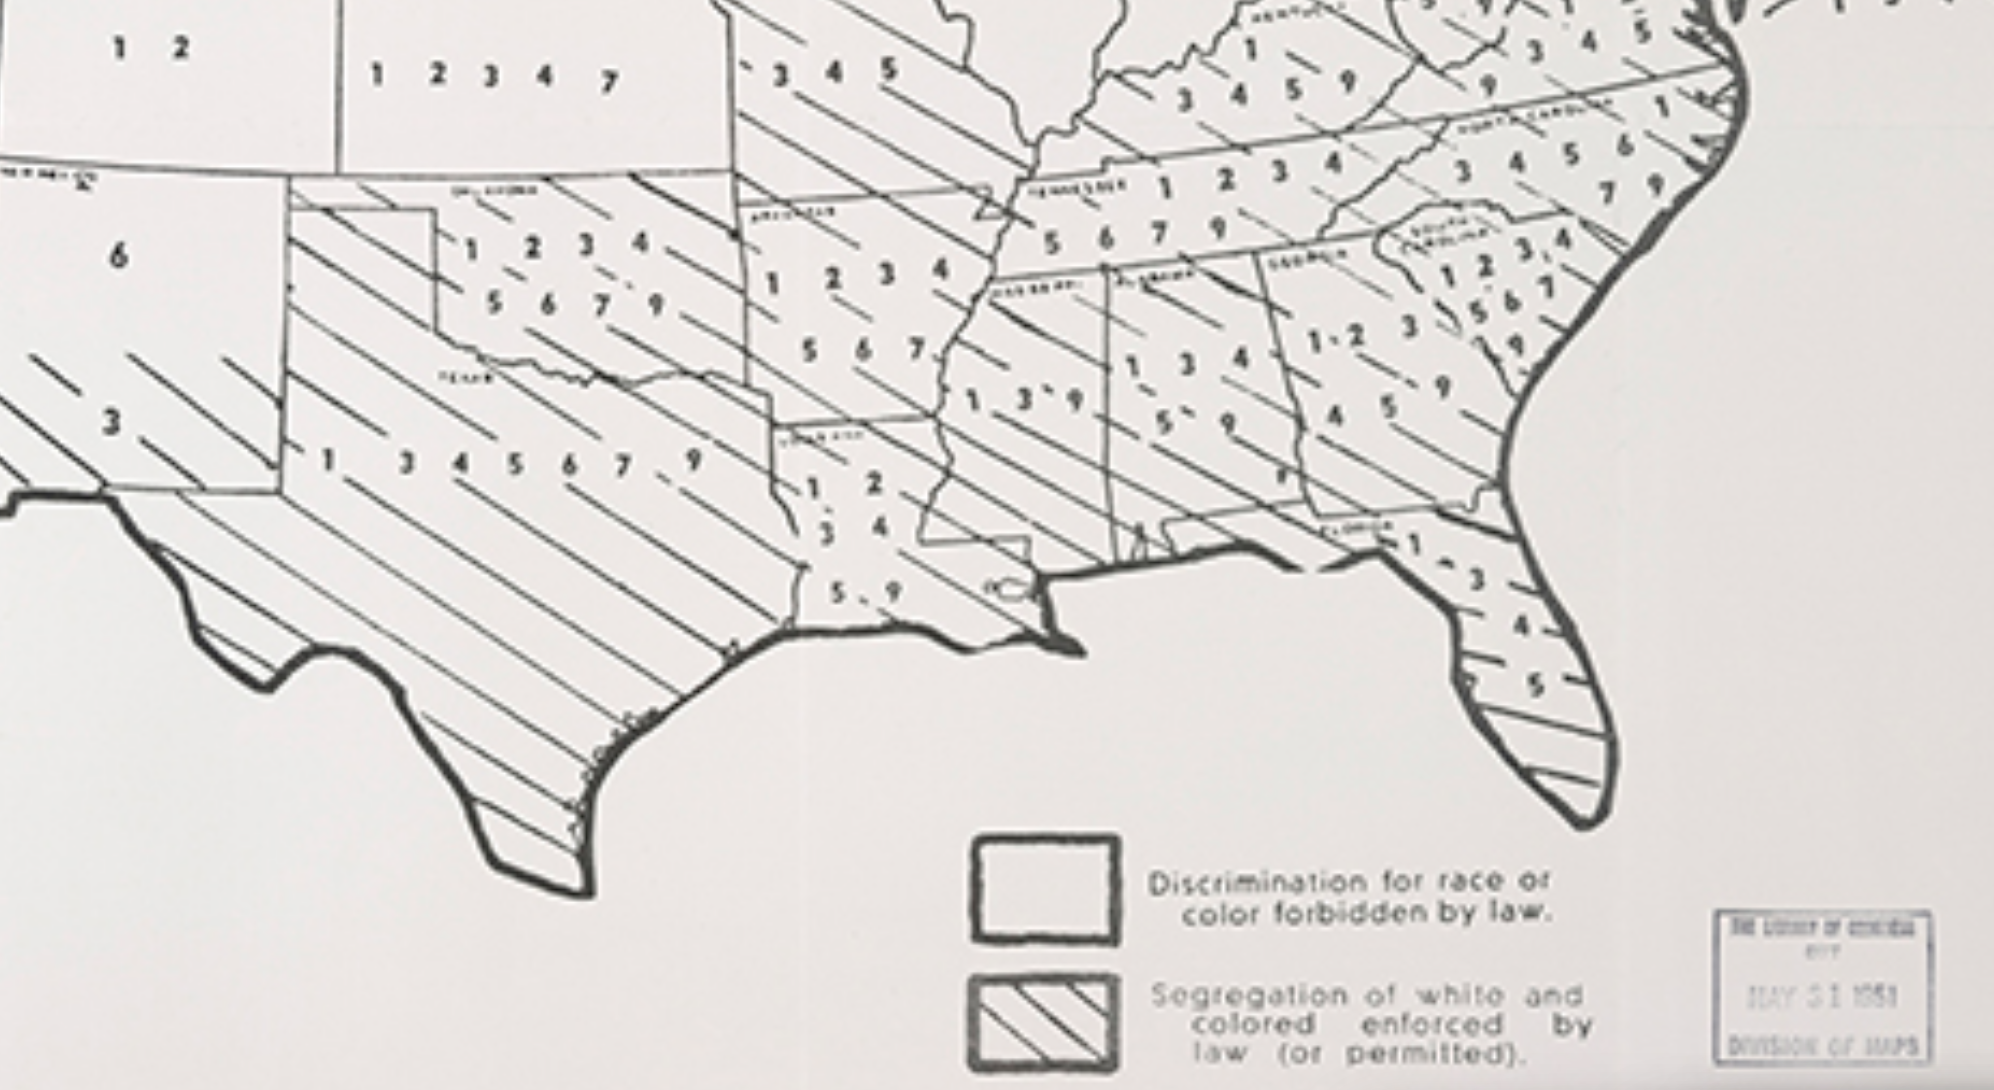
As it stands, the vacation of the fifth section of the VRA has led to a new fault-line in the country about where restrictions on voting have been introduced in the 2016 election, with dangerous consequences in our notion of what sorts of exclusion from the voting booth are enshrined in local laws. But the divide was very present to the segregation laws on the books in the United States as late as 1949, when an early attempt to take stock of the continued segregation of the Southern states was mapped for the benefit of readers in Edwin S. Newman’s Law of Civil Rights and Civil Liberties: A Handbook of Your Basic Rights.

from The Law of Civil Rights and Civil Liberties: A Handbook of Your Basic Rights
The preponderance of separate voting and indeed of institutionalized segregation south of the parallel 36°30’N that divided once seceded states suggested a coherent code of conduct, not completely separate from the diffusion of policies of segregation in the rest of the union but concentrated in the southern states as enshrined in the law–as it had remained in Arizona and much of New Mexico close to the southern border.
from The Law of Civil Rights and Civil Liberties: A Handbook of Your Basic Rights
It is perhaps no surprise that many of the states that have recently introduced such new restrictions can be mapped onto those states where voting registration was not only less uniform, but lay below 50% in 1964–states including Alabama, Georgia, Louisiana, Mississippi, South Carolina, and Virginia, as well as parts of Arizona and North Carolina. The introduction of new restrictions in the area that lies south of what might be call the divide of the United Sates along the lines of political secession when the nation split along the parallel 36°30’N. For among the multiple divides that maps of the United States so often mask, the continuing salience of the divide of slave-owning states, a divide that long animated national electoral maps, the parallel is made particularly evident in the history of national data visualizations.

To be sure, the data visualization of disparaties in local taxes of gasoline provides the clearest way to place in evidence the increased economic and political polarization that has emerged over the past three decades. But doesn’t the growing reliance on infographics and choropleths–those convenient snapshots of the political and socioeconomic status quo–also manipulate the viewer to focus on an explicitly short-term image of the country’s divisions, tailor made, as it were, to suit the very rhetoric of polarization that our political parties have openly curried and engaged? Indeed, the location of six states whose voters face new voting restrictions in the current election–the first ever held in fifty years without the full protections of the VRA. The limited notion of government that such restrictions presuppose is in a sense an ugly scar, not often visible in the symbolic unity of the national map. Of the eleven states with highest African American turnout in 2008–when Barack Obama was elected President–six have adopted restrictions on voting rights since 2010, including Georgia, Mississippi, West Virginia, and South Carolina, in an apparent systematic if not reflexive effort to retract access to the ballot box and restrict participation in public elections of national import.
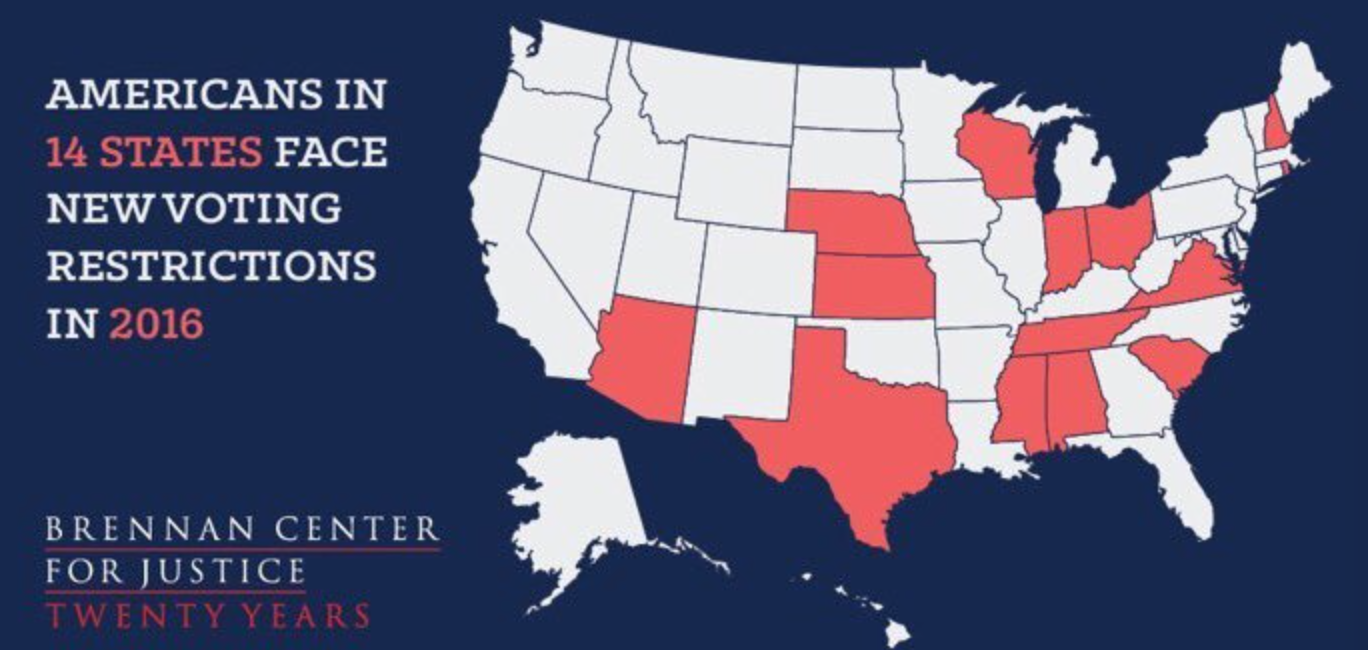
The enactment of strict voter ID laws in much of the nation, expected to curtail or repress turnout of in blacks, asian Americans, and latino communities, in what seem attempts to repress voting rights and take advantage of the disadvantaged by excluding the votes of many. The clustering of new voting restrictions in the southern United States–broadly construed as Texas, Mississippi, Alabama, Tennessee, South Carolina, Florida, and West Virginia–suggests that the very discriminatory practices that southern states adopted which led to the Voting Rights Act to prevent states from changing voter laws in ways that excluded minorities from the vote–most often by adopting Voter ID, cutting back on voter registration, prevent on-site registration, and pre-registration–threateining to disenfranchise a half a million minority voters.
We were struck by seeing this divide resurrected in a “gasoline tax map” by ExxonMobil blogger Ken Cohen, or in the rather stark divide among states where children are more likely to be raised in a two-parent family–a divide that also runs across our divide into “blue” and “red” states, but contains a striking latitudinal divide according to Census data–a divide that is particularly cautionary, given the benefits children gain from being raised in a household of two parents–and the steeper economic inequalities fostered by the predominance of single-parent households.
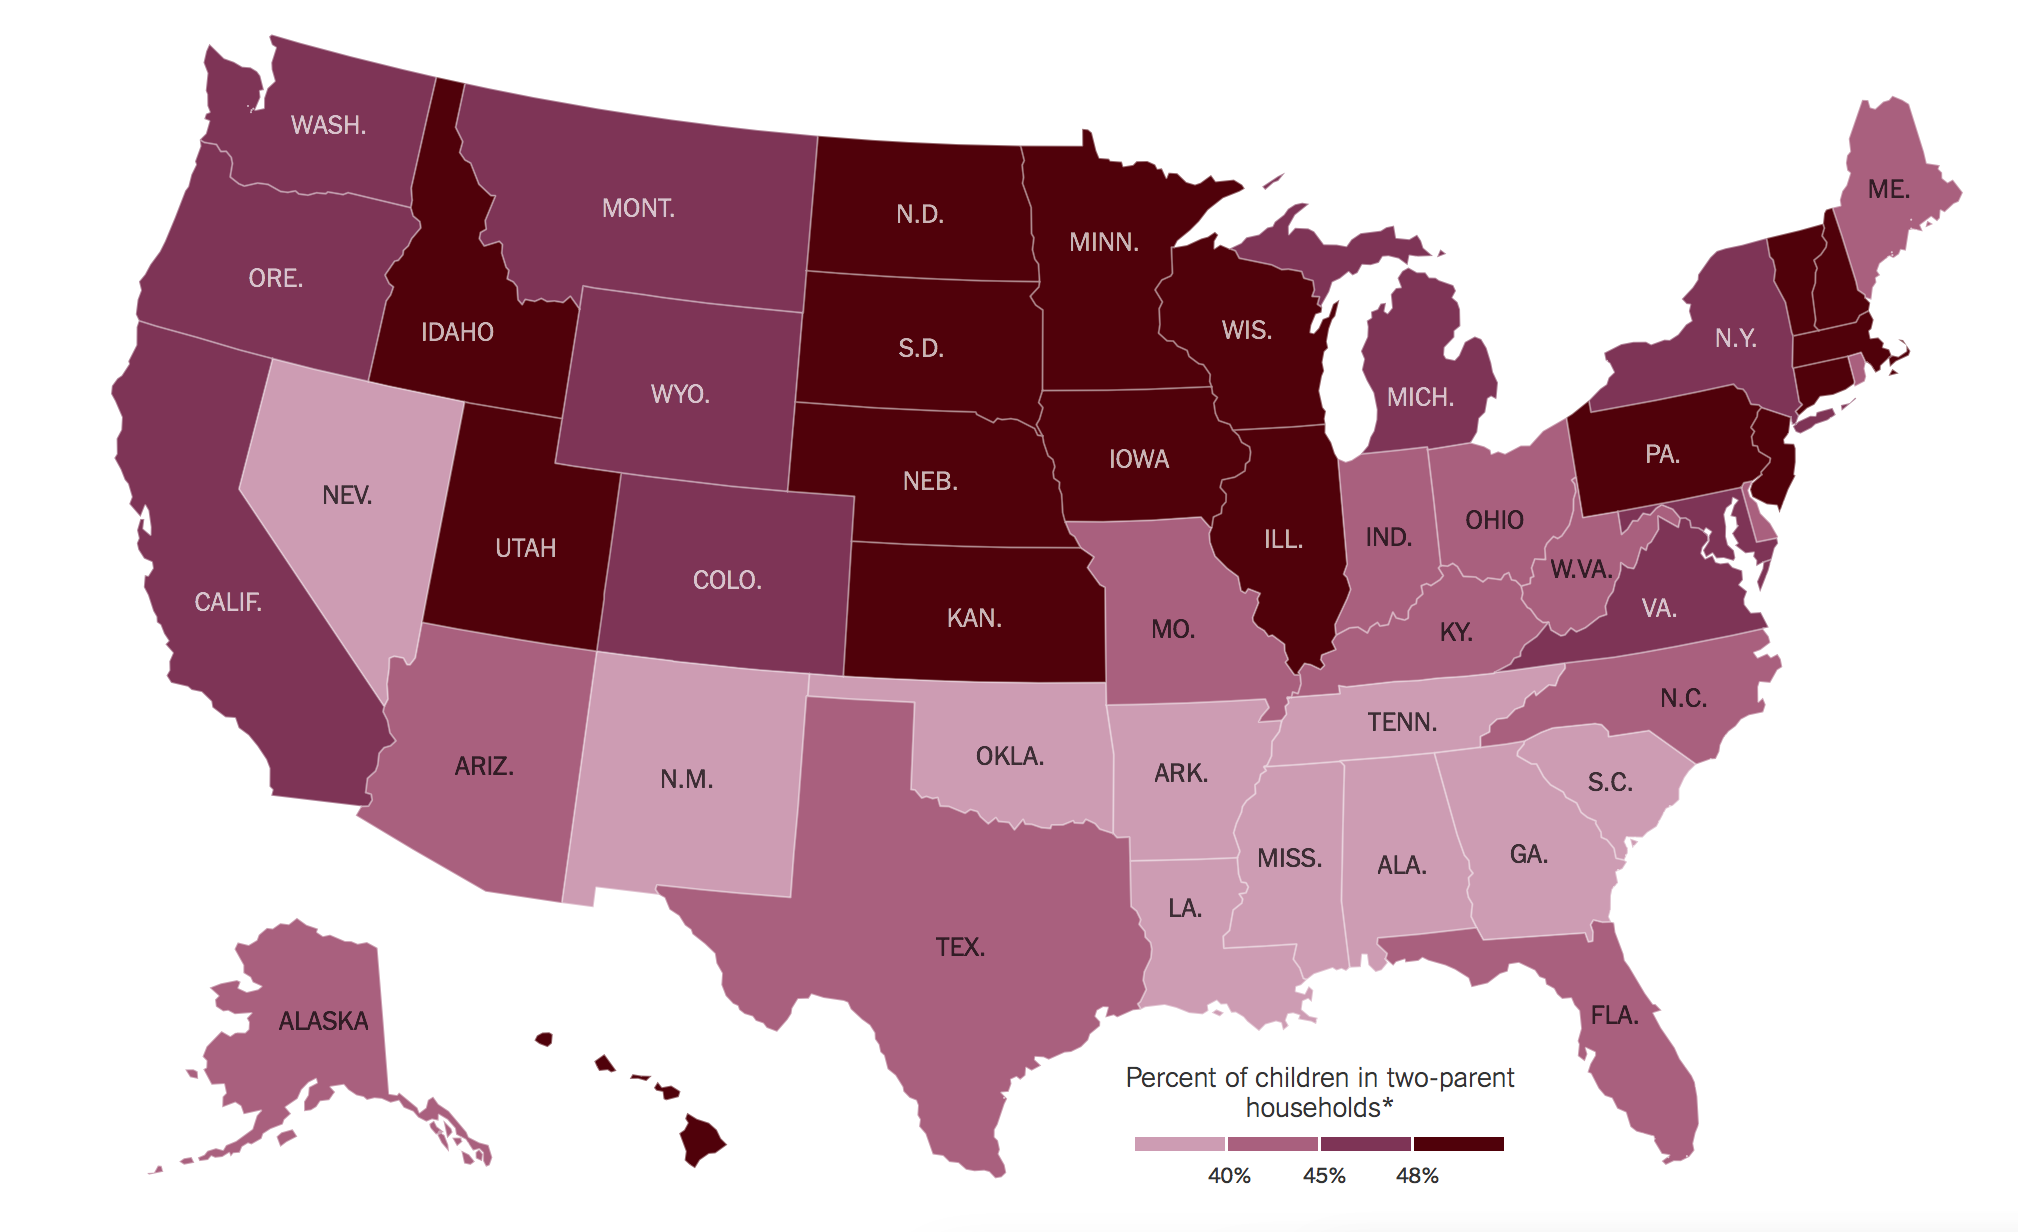
It is striking that such inequalities are present in an area of such historically steep social inequalities.
To be sure, the country is as politically divided as it has been since the Civil War in recent decades, due both to rising income inequality and to the overlay between money and politics across the country–and the increasing drift to the right of the states-rights no-tax pro-industry Republicans. Data visualizations that materialize this division, such as the recently-mapped Gas Tax Latitudinal divide, an almost oppositional division of the country by local levels of gasoline taxation, exemplifies how a vision of the present seems to blind us to the past–and to the divide of the country during the Civil War that it seems intentionally to evoke, even as it does so while erasing the historical memory of the division of the country during the Civil War, and the question of states’ rights that the Civil War was fought to resolve. The current currency of a map that rematerializes such divides, however, and the very picture of an oppositionally divided nation that it insidiously naturalizes and perpetuates. For the data visualization functions by naturalizing divisions on any issue as if they were inscribed upon the land, and gives an irrefutable evidentiary value to the very claims whose existence they chart.
Is the evocation of a degree of opposition that previously surfaced in the Civil War reveal an after-echo of earlier social and political divides, or does it reflect the distinct political priorities that shape the political topography of the South? For the division of much of the nation along a deeply etched parallel 36°30’N has been forgotten by the condescension of posterity, as we forget the salience of its transmission in regional memory.
1. The stark divergence that the data visualization records seems to show how local interests trump the collective. Its oddly straight divide obscures disturbing inequalities that cut across America, however, and distract viewers from the actual inequalities which have been with us for some time. And it makes us wonder what other lines cut, similarly, across the country, even as it seems to suggest the arbitrariness of an imposition of taxes at the pump above its seemingly randomly chosen boundary. The rhetoric of the visualization of the almost latitudinal divide in a “gasoline tax map” by ExxonMobil blogger Ken Cohen shows taxes descending below 40 cents/gallon below the thirty-seventh parallel as if to naturalize a division that might as probably reflect a line of Vitamin D insufficiency that seems specific to the states that lie below the same meridian, whose apparently arbitrary definition conceals the deep significance with which the line was invested in the formation of the United States. For the Gas-Tax divide raises almost unconscious visions and memories of how different levels of the collective that is our country can coexist on each of its sides–and raise a question of what sort of clear division exists along that line that makes a tax of 40 cents per gallon such a significant division of the nation that it might be poised to replace that between “red” and “blue” states. The visualization below, as mapped by a blogger for Exxon Mobil, compels us to examine the depth that this apparently purely conventional divide has long held in American history, and indeed to try to unpack the persistence of the division along the deeply etched parallel 36°30’N as a divide of national significance, not forgetting the extent of its significance, in a manner often masked by the symbolical and formal coherence of a national map.


Wikipedia
Is it possible that we are increasingly becoming a nation of readers that has come to accept the relative inequities that data visualizations inscribe, and in need of bringing a deeper skepticism to interpret the stark geographical divisions that they inscribe? For the authority of the organization of the lower forty eight states in the union that the Gas Tax map seems to perpetuate take the variable of attitudes to a Gas-Tax as evidence of the inequity of an imposition of a specific tax to make a polemic point, but erase the deep divisions it defines in a landscape that the map invites viewers to see as otherwise undifferentiated, but suggests something like a crease in the map of the United States whose memory stubbornly persists among its residents.
The continuity of a bounded region is the implicit subject, to be sure, of any map, and any disruption or divide calls attention to itself as disturbing the otherwise harmonious surface that a map offers to the world. But the manner that data visualizations invite us to make pronouncements based on a division of hues or an oppositional palette invite its viewers to leap to pronouncements about the variable mapped, even as it seems to empty that division of historical meaning. All too often, the data visualization works by removing individuals from the history of the habitation of the country, or of the inhabitants of the land, by not inviting us to tell their story, but to present itself as a sufficient statistical record of how the land is inhabited. As one form of condescension of posterity, much lamented by E. P. Thompson, the data visualization seems to remove the land from the lens of the past.
The difficulty of the autonomy of the visualization as a register erases its status as an argument, investing itself with the objectivity of a map, and removes it from the redolent memories that its flat colors seem to mask.

Jasper Johns, Map (1961)


Ferguson, MO, not Fergusson, MI. Thanks.
That was an embarrassing error–sorry for not carefully proofreading.