
Afterward: Re-Examining the Divided Vote in Henry Gannett’s Map as an Image of the Nation
The electoral drama of 2000, when the emergence of a swath of red states reified the Republican victory in especially iconic terms, created a visual rhetoric of division that is particularly insidious. In contest, the mapping of the popular vote after the Civil War responded to a specific localized crisis in the country’s chorographic representation. By giving the spatial distribution of the popular vote for the 1880 election in readable form, Gannett explained the problematic electoral divide–a divide far more salient and problematic than most other periods of the blurred lines of the red-white-and-blue airbrushing of the lower forty-eight that Professor Sparks devised, and that reveal a crisis in political representation–as well as chart the depth of the after-image of Secession in the era of Reconstruction. Their close proximity to the aftermath of the war led them to create a clear mirror of the political debates of Reconstruction and in the years before the 1880 election that Republican candidate James Garfield won, but by barely claiming a razor-thin majority of the popular vote, that the statistical battery of the distribution he had at hand caused him to produce a compelling explanation of the vagaries of an electoral system much of the nation’s voters didn’t fully grasp or comprehend–especially since the results of previous 1876 election had been inverted not by the electoral institution but by the Senate’s compromise.
Gannett acted as something of a medium of reflecting deeply-held opinions in inscribing the electoral differences across the United States. Acting like the cartographical conscious of the divided nation, he mapped how the translation of popular to electoral votes restored a coherent if deeply fragmented sense of community–although one that also provided a basis for future after-images of a divide. For Gannett set out to create such a statistical map that explained the Republican victory in ways that could be readily digested by a larger audience, to be sure familiar with territorial maps as illustrations of the continuity of the new country, but less sure of how to reconcile that very continuity with the obstinate divisions between political parties who divided around issues of Reconstruction and slavery that the war had provoked.
Political polarization has not only characterized the American political landscape for some time. The division that began in quite different guises, however, in the aftermath of the Civil War, that pale before the recent divide between Republican and Democrats. The divisions in the popular vote of 1880 were so stark to lead Gannet to come to terms with their divisions. He preserved in cartographical terms a record of the divided nation that would readily explain the Republican victory in ways that could be readily consumed, that provided a compelling record of the after-image of the divided polity for an audience whose familiarity with maps of political unity was only relatively recently developed.
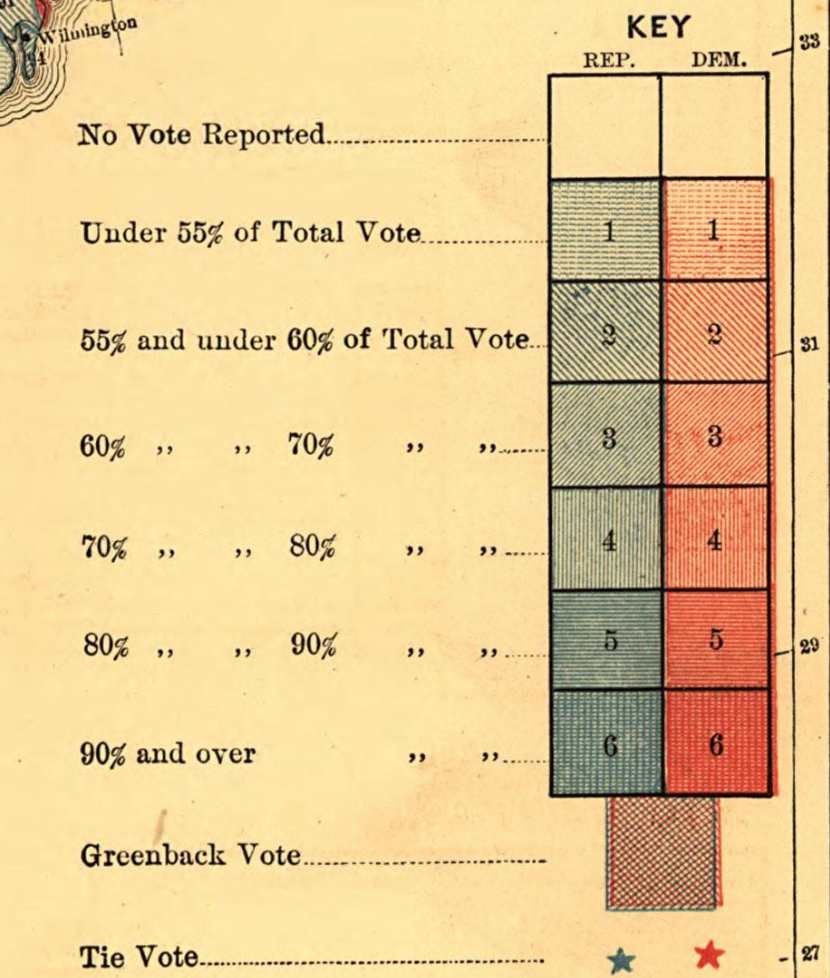
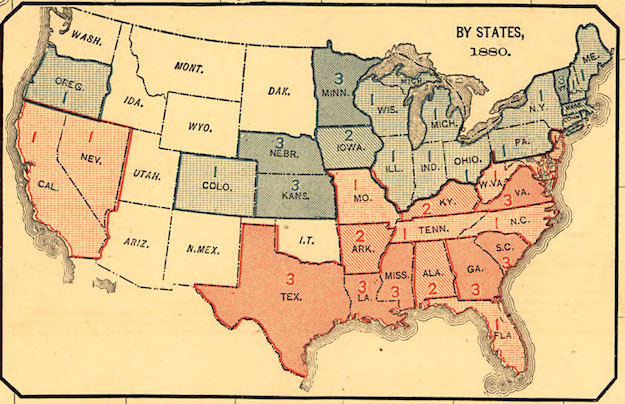
The intensity of given counties’ deepest opposition to the Republican platform that advocated Reconstruction as even more intense than Republican support was in much of the north: although the map is, most prominently, a record of the rejection of secession, and election of a Republican president–Garfield–so used are we to seeing such topographies of opposition in the most recent electoral maps, we almost reflexively detect a steep opposition in counties across Arkansas, Texas, Louisiana, Alabama, Mississippi, and Georgia as well as Virginia: the divide immediately catches the viewer’s eye, and data “speaks clearly” to the viewer, given the sophisticated ways that Gannet, as the Superintendent of the Census, used tools of line engraving to calibrate the intensity of voting preference–Republican or Democratic–to map a topography of preference in his map six deepening hues of red, ranging from light pink to deep carmine, or from baby blue to deep azure, saturating counties different colors to reveal the intensity of their inclinations in a stunningly clear topography of majoritarian divides whose modernity immediately strikes us as considerably refined parsing of the popular vote by color coding the proportional distribution of the vote per county for his readers.

Library of Congress
Library of Congress
Library of Congress
The United States was effectively redrawn, in the redolently patriotic topography of red, white, and blue that both respected local variations even as it recognized a landscape of continuing political differences. In ways that use of the artifice by which electoral maps can resolve the outcome of contested Presidential contests, the map proves something of an emblem that can be glossed so as to unite the country even after he most bitter divides. The post-civil war divide during Reconstruction occasioned what Schulten calls “the ancient map that invented Red and Blue states,” as an economic way to describe the different levels of support of each party, and the limited rootedness of that support across geographic divides.
It also reveals the increasing authority of data sciences and statistical mapping as a means of understanding and distilling a complex moment of political change–we can excuse her for dating ‘ancient’ from the burst of statistical maps of early big data in the late nineteenth century, when statistical geography tried to reconcile the big data with the need for images of national unity, although if they offer an early precursor of the hunger for data, they remain distinct from the less refined skills of visual discrimination that were used in early twenty-first century computer-assisted graphics, and the recent proliferation of their explanatory force. While the Gannett map reflects the authority of the engraved map as a form of understanding the nation in the mid-nineteenth century, based on new techniques of lithography, to clarify pressing questions of continued national coherence, the fad for the data-visualization–an artifact with deep roots in the nightly news–provoked a search for the selective criteria that best summarized national divides which effectively removed the nation from its past.
Questions of wrestling with American identity from a deeply historical perspective had arisen during Reconstruction because the Republican party had allied its anti-slavery platform as preserving the integrity of the nation and as the centenary provoked historical perspectives on national identity; the measurement and digestion of recent historical events in graphical guise, Schulten reveals, provides an early form of the info graphic, adopting recent techniques of shading in color lithography to process the popular vote of 1880 in which nine million Americans had voted, and the victor, Republican James Garfield, drew only 7,000 more votes nationwide than his Democratic opponent. For Schulten, the innovative statistical map of such fine resolution newly “enabl[ed] Americans to visualize the spatial dynamics of political power”–or an election’s results–as it “more systematically measured” election returns, “showing a nation organized not according to railroads and towns, or mountains and rivers”–mapping the vote across counties at a fine grain that invited viewers to navigate and note salient divides in the political landscape that was still haunted by Secession.
The map provided a basis to materially render a political divide in ways that materialize the electorate’s distribution. Gannett’s map is also striking for how it registers something of an “after-image” of succession, as much as it preserved an image of national unity. The map offered an image of representational democracy–in which an election could be determined by but 7,000 votes, or shifts in several counties in New York State–in other words presents a new problem of unity, and of Republican dominance after the Civil War. The map responded to significant uncertainty about the continued integrity of a nation by a Republic president after the election–the cartoonist Thomas Nast seems to have foreseen their electoral victory in a comic news map, representing a sturdy behemoth elephant that would carry the nation, but which obscured its eyesight, piercing Maine and California to balance the midwest on its broad back: “The Republican Animal Will Carry It,” Nast foretold in a brief legend–the prolific political cartoonist who had long despaired at Republican compromise with the south was displeased by Garfield, but resisted commentary and conceded that the elephant was laden with the map it would carry, and drew few more cartoons about the election.

Gannett let statistics speak eloquently in graphic form to explain how the narrow election translated into electoral victory. The spatial dynamics his map reveals itself presents a detailed after-images of former slave-holding Southern states–in the continued intensity of popular opposition to the Republican candidate. Although the narrowness of the margin of victory Garfield won in the popular vote–still the smallest in American history–translated into a handy electoral college victory, the map revealed the continued dominance of opponents of the Republican party in the south, here gauged by the intensity of their opposition: the two-color chart reveals not only the intensity of deep carmine distrust of Lincoln’s Republicans, but calibrate the intensity of opposition county by county, as if to document the efficiency of the suppression of the votes or voice of many former slaves and free African Americans, now enfranchised by the Fifteenth Amendment–save those Republican redoubts where they were possibly more effectively mobilized by those blacks who had returned to the South during Reconstruction.
The divisions that then defined the electoral landscape still held clear marks of Southern secession, traces apparent in the fields of crimson bridge the symbolic and empirical. In an age of digital mapping and data visualizations, readers are often invited to tease out as lines fracturing the political landscape. The local variations in the voting patterns, Gannett sought to show, clearly translated into blocks of red in the electoral map he prominently inset in the large national map at its foot, revealing how the nation seemed broken into two competing constituencies. The map has special resonance in light of the narrowly resolved election of 1876. Indeed, the map came tacitly seems to come to terms with the divided electorate in that presidential contest, between Democratic Senator Samuel J. Tilden and Republican Rutherford Hayes, where the vast majority of Southern states had voted against Hayes and for Tilden, as in 1880, but rather than leaving the vote to Congress, Gannet’s tabulation of the vote with precision elegantly resolved a narrow popular vote, but served to explain the spatial distribution resulted in a clear winner.
The map offers an early precursor of the recent divide between “Blue” and “Red” states, Schulten noted, but serves to illustrate not only a divide but the resolution of a divided electorate through the political process. The map appears to resolve a newly opened chasm within the electorate, and to hope to resolve that gap in ways that readers could process as they ordered out the county-by-county tendency of the bitterly contested popular vote that determined a race that seemed as if it could go either way as the popular vote was tabulated–and which staged a drama that demanded resolution in a more conclusive cartographical form.
Library of Congress
The clear variations in a something of spectrum of light blues and light pinks that was so specific to Gannett’s map was interestingly not retained in the inset map of electoral votes–at first sight Minnesota and Vermont were deepest blue, and Texas, Louisiana, Mississippi, Georgia and South Carolina deep red, but this only suggests the distribution of electoral votes by shading states in graduated tones to show the popular vote in the synoptic fashion that we have become most familiar, if only because electoral votes are counted by the state as a whole.

Library of Congress
The divisions of the country by political preference were, in the end, less accentuated than its unity. Republicans had cast themselves as the party of saving the union in 1876, and the preservation of the Union remained on the front burner of American political culture during the divisive presidential election of 1880, which was in ways a contentious repeat of the resolution of a country divided by Reconstruction. As US Census Superintendent, Gannett devised the project of compiling a highly detailed county-by-county account of the distribution of the national popular vote of 1880 whose publication was designed to overcome division by registering the depth of votes for the Republican candidate, Garfield, that made his victory–if actually as narrow as that of his predecessor, Rutherford B. Hayes, itself resolved only by the electoral college–a form of affirming the electoral system as well as a persuasive statistical synthesis, presenting the results of the electoral map in ways that viewers could readily process.
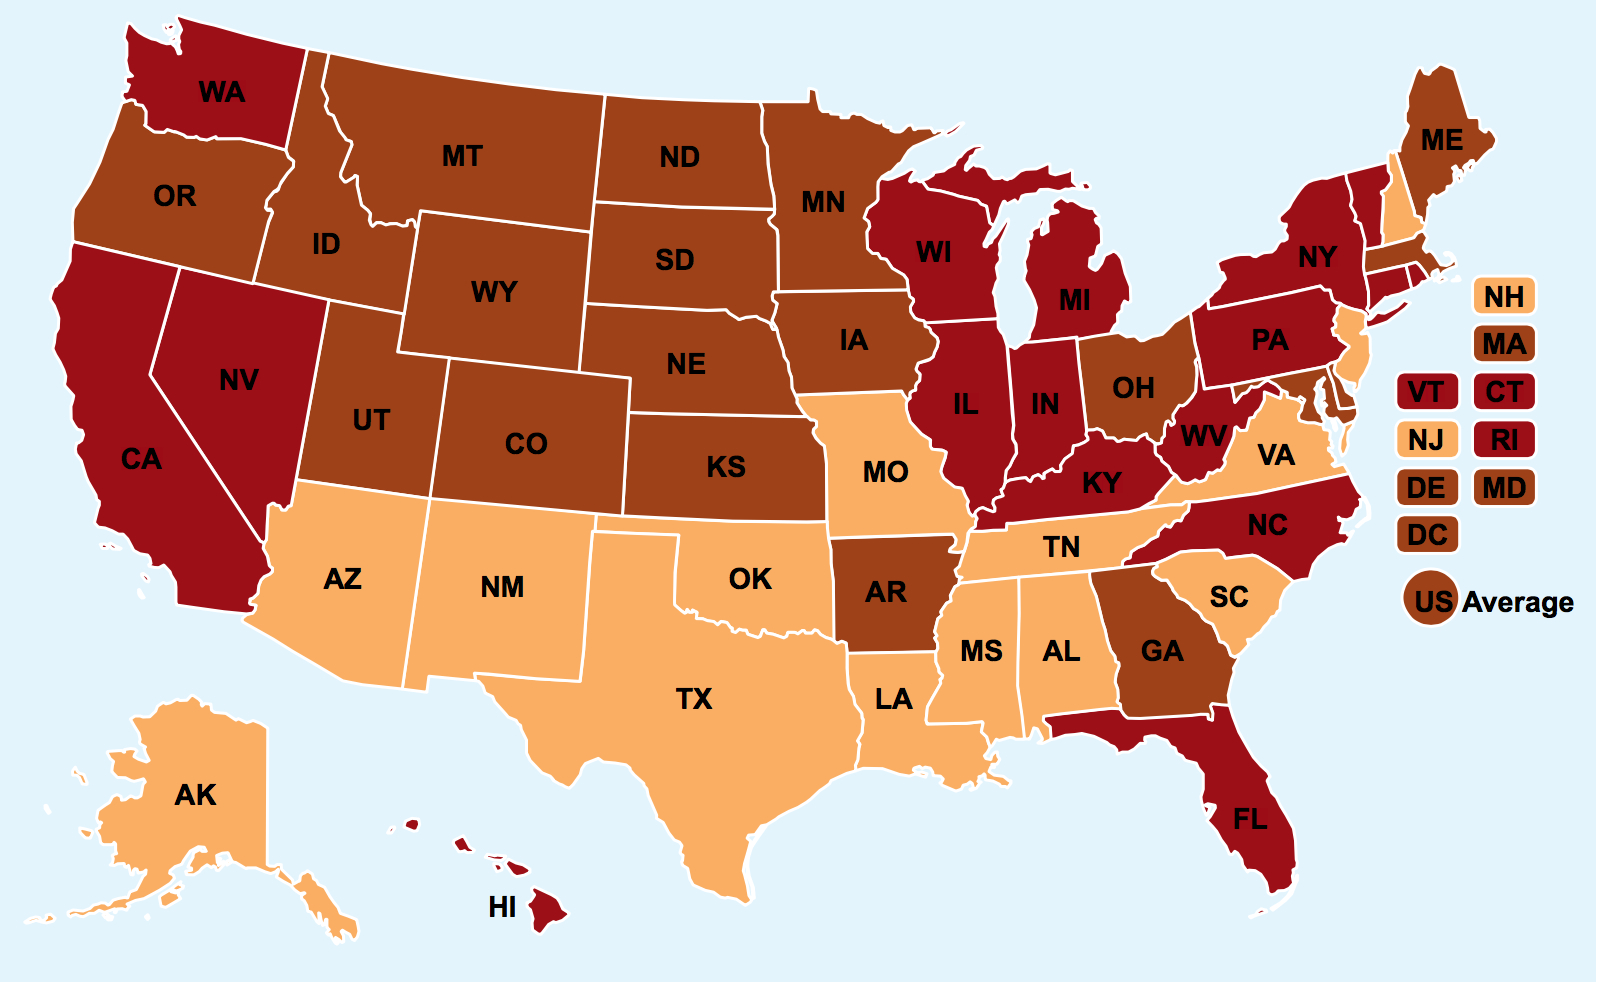
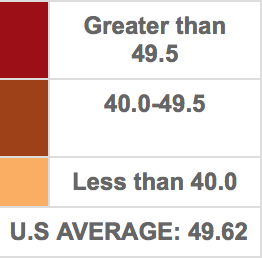
It has to provoke pause that a similar latitudinal divide across the United States continues to haunt the mapping of distinct local levels of taxation on as quotidian a commodity as gasoline by similar forms of shading. For the gas-tax latitudinal divide not only maps questions of taxation; the status of taxing gas taxes maps a region marked by federal suspicion: the divide in states’ boundaries registers deep continuities in attitudes toward the political acceptability of introducing a further local taxes that would hamper access to what is taken as a marketplace right. And the picture of a deep divide that the presidential election of 1880 created as sharply defined precedent as any to trace through the stark shift in public priorities and notions of good government revealed in the Exxon-Mobil gasoline tax map not only “explains a lot” about the United States, as American Petroleum Institute blogger Ken Cohen offered, but traces a continued after-image of secession. Discussing the haunting of the info-graphic with a removed divide that seems uncannily present in the map itself, will be the subject of a set of future posts in this blog. For the demographic divides that the map instated left the union haunted by stark divides that at times seem burned into our collective consciousness. Maps bear traces of the collective experiences with which entire nations wrestle in the modern era, where big data offers the basis to take the temperature of national unity.
The recent election in Scotland, to be sure, suggests less of a trace of the past in its distribution of the popular vote or a continued mark of an electoral divide in the UK’s political culture. With thirty-two of thirty-two reporting, the referendum of 2014 reveals less of a divide than an uneasiness of self-segregation, or uncertainty of autonomy, despite a clear vote around Glasgow.
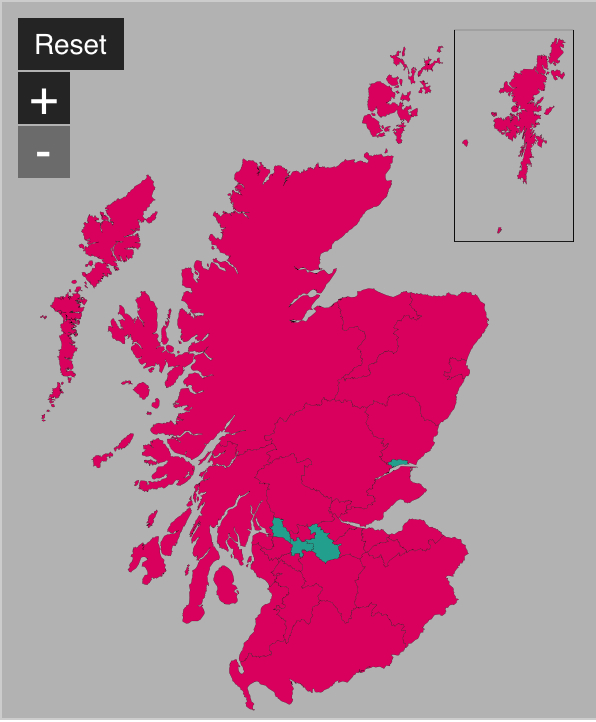
BBC
Despite longstanding notions of Scottish separatism, in addition to the difficulties of rejecting the continued benefits of union, and the promise of its institutions, the absence of a separate political culture or perhaps of an existing after-image of separatism on which separatists could draw to mobilize their cause.
The fear that the tax-resisting California Drivers’ Alliance has stoked to mobilize against a hidden gas tax set to take effect in 2015, as part of the state’s efforts to expand the cap-and-trade program, is promised to be poised to put the squeeze on drivers who find themselves at the pump of up to 76 cents per gallon, as if this were an entirely unwanted and unwarranted imposition on consumers–a point on which the Wall Street Journal readily agrees might prompt “an immediate jump in prices at the pump” onerous to the poor, to raise needed funds for carbon permit auctions. The rise of this pro-industry if non-partisan community-based movement is based on a similar rhetoric of fear–evident in the forecasting of a loss of jobs that would result of some 18,000–justifies itself on the charge of failing to protect consumers in a similar rejection of representational democracy that has not heard the “pleas of California drivers who will be hurt by higher fuel prices” as if it would only create a “slush fund” for politicians disconnected from their constituents’ needs and are intent on curtailing public debate. The basis of separatism has less of precedent in the state, however, where there is less recognition in a deeply “blue” state of a discourse of local autonomy and self-interestedness, and far less currency or symbolic capital of mapping the state as an entity apart.
Anyone who has made it this far and seeks more on the visualization of national unity in Gannett’s 1880 map can continue here; and is invited to look at Susan Schulten’s exemplary website, a companion to Mapping the Nation. For those with an appetite to consider of the survival of the Gas-Tax Latitudinal divide in recent info-graphics betraying an after-image of the divide Gannett first commemorated, do look here.


Ferguson, MO, not Fergusson, MI. Thanks.
That was an embarrassing error–sorry for not carefully proofreading.