Tag Archives: Denis Wood

Hearing Through Maps: Mapping London’s Hidden Waterways

We do well to see through maps, Denis Wood enjoined, urging us to detect the “human landscape” that lies superimposed upon the land in maps, and uncover the ways that the landscape has been changed–and orient ourselves to those changes that have been wrought by the “huge arrogance” that “we can name and we can claim.”  Maps demand to be interpreted by scratching their surfaces, aa task of uncovering how one might best “see through them,” to explore the landscapes that lie underneath the layer of words that lies on their beckoning if often all too opaque surfaces.  To take stock of how maps work by asking us to go about imagining the landscape that lies beneath those words is a way of uncovering their arguments about territories.  

The linked map invites readers to explore its surface, in web-based maps of the London Sound Survey by using links to explore soundscapes that would otherwise lurk beneath cellulose surfaces.  Web-based maps such as Sound Survey of London’s waterways offer modes of remapping the known environment of the city:  and the choice to map the riverine network that is rarely seen in London by the conventions of Harry Beck‘s almost universally recognized diagram of its Underground.  

The image offers an apt way to invite viewers to excavate audible aspects of the city absent from a drawn map, in a truly phenomenological map of the circuit of hidden waters beneath London. If subways are often noisy, the sounds that the Survey has compiled offers a somewhat synesthetic compilation of the hidden waterways that might be seen as corresponding to metro stations, less as a disembodied circuit–as Beck’ map–than as the subsurface lying underneath the engineered world. Beck’s map sanitized the subways in streamlined fashion to attract Londoners to the Underground, readers are asked to explore the waterways that emerge only in its parks, bridges, and channels linked to watery paths which we rarely see which run under and about its surface before they enter the central artery of the Thames.  

Rather than by mapping the  city’s space in reference to its individual  streets or intersections, but by placing the rivers of the Survey maps waterways’ sounds in ways that recuperate their perhaps forgotten presence.  Wood remapped the lived community of Boylan Heights so that is not only as a place in Raleigh, North Carolina, but charting the “metabolism” of the community in maps of the light street lamps cast, lit jack o’ lanterns placed on porches at Halloween, paper routes Wood ran with a tightly knit cohort in his youth, or “squirrel highways” of aerial wires, which collectively serve to unpack the often invisible ways of “how it works.”

Halloween in Boylston Heights

One might compare to this set of maps the ways in which maps in the London Sound Survey invites readers to enter an overpowering pointillist accumulation of local details, and similarly serve to map a setting in which everything sings–or at least we can enter its audible surface at distinct points.

The question of what axes indices and axes might be adopted to best orient readers to the ways that the place works are ingeniously organized by the Sound Survey through the colored lines and stops of the transit map that Harry Beck proposed for London’s Underground in 1931, a network-map whose revolutionary simplicity seems to have been devised when the draftsman in its Signal Office, Beck adopted paths of circuits to map the intersecting pathways of the Underground at a time when the city needed to encourage less traffic in its streets:  the powerful success of Beck’s map shifted Londoners’ attitudes to urban space.   A rewritten version of the familiar iconic network of the London Underground appropriately provides the syntax to uncover the hidden network of non-tidal streams, brooks, creeks, pools and channels that run, partly exposed, partly underground, around the river Thames.  Territories are less the question in the map of London’s waterways, which progress from trickling streams to waves slapping against the locks of the Thames.

Soundmap after Beck

London Sound Survey, Waterways 

The result is to conjure not a mythical, lost London, as did James Shepherd Scott’s 1884 History of London, a work concerned to show “the origin and growth of the present condition of the suburbs” of what was the “largest city of the world,” but which began with the tabula rasa of “London Before the Houses”–with two streets running about marshy region in a network of rivers–but to remind us of a watery network that still lives under the city’s paved streets–even though it also echoes Scott’s illustration in recreating a London that is now lost to the senses for most readers.

11168289233_4959c605b9_c

If Scott’s map served as the frontispiece for a volume that described the city whose growth has been “very rapid in modern times,” and “an ever-widening tract of country covered by the buildings of a city already so large that it is equalled by no other in the world” (1), the cosmopolitan metropolis is excavated in the map of the London Sound Survey.  While Scott mused that “as the houses advance, the natural features are obliterated,” and, at the conclusion to his list of changes, “the brooks no longer run” (2), the survival of the brooks and streams as vital parts of a living landscape are documented in the qualitatively detailed survey’s sounds.

In charting paths of the waterways hidden even to London’s own inhabitants, the sound map is especially successful in charting the dissonance between the forms of symbolization and lived experience–and by doing so through the conventions we immediately recognize as indicating London.  While imitating or offering a cartographical homage to the Underground map, the surface of the map is punctuated with sonorous glimpses of the lived space of London today–offering actual stops where we can pause to hear a sound file of a minute or so of the water that trickles between it can be heard from the surface, in evanescent moments the symbology of the map cannot hope to record created by rivers, feeder streams or brooks, and canals.  Each “stop” is an observation station–to perceive or note the gurgling of a brook over a weir near Wimbledon or follow the course of the Brent through a culvert and along a viaduct, beside ambient noise of work, honking geese, and quacking ducks.  That the rivers don’t exist makes the map a recuperation of how London lives beside the water today, and to attune oneself to its changing  environment in which the tributaries of the Thames are more often trickles than rapidly flowing streams.  While dismembering Beck’s circuitry, the paths of rivers, streams, and waterways that flow into the Thames are something of a melancholy look at a world we have lost, but also a snapshot of their survival in an urbanized environment.

The cartographical poetics of the Sound Survey map are immediately recognizable.  By adapting the iconic conventions Harry Beck pioneered in his immensely popular modernist mapping of the circuits of metropolitan transit in his 1931 Underground map, the map needs no identification of where it is–London–and provides something of a counterfact of an image that today is separable from the city, despite its considerable influence as a model of mapping transit networks.  The map’s almost-universal influence on how metros are mapped in urban landscapes has not altered the distinctive iconography of the Underground map:  its conventions establish a quite different perspective than orienting readers to its built underground, however, as it used similar streamlined conventions and colored lines to trace the paths water takes in London’s built environment.  The conventions invite readers to explore the topography of where water rises to the surface of the urban space:  by clicking at the site of any “stop,” to link to audio clips along the indicated waterway, marked, as trains, by curving colored lines almost identical Beck used to diagram the city’s Underground–yet rather than create a unified network, they trace currents that flow into the Thames–the river that runs through London, and sole point of external reference in Beck’s now-classic modernist map of the London Underground.

Ian Rawes has long recorded London sounds to preserve its sensorial world; the map of waterways allows us to enter aural environments at parts of the city by a smattering of precise sensations of water passes whose collective accumulation overcomes its readers:  while mapped as if a site of imaginary metropolitan stops, the stops are in fact spots where waterways aside from the Thames are audible to city-dwellers, as if to synthesize insider’s knowledge how the urban space overlays an unseen web of currents, exposing them in a map as Beck foregrounded the space of transit lines to orient urban travellers.

underground_map_beck

Harry Beck’s original map of the London Underground (1936 version)

When London Sound Survey mapped the city’s hidden urban waterways, it used data from observation stations to revisit formerly overlooked spaces where water emerged, at least aurally, in the city.  These sites are rarely mapped, but the interactive audio files allow users to hear sounds of a watery web which one might have earlier recognized.  Each observation site appears evanescent moments at scattered sites in the city, but reveals, as a sort of historical base-line, the levels at which water flows through multiple sites in the built environment.  The website gestures the organic notion of the flows of circuitry in the Beck map–now iconic–around the flow of the Thames, and perhaps, by orienting itself to the Thames River, so different in its smoothness than the hyperactive transit maps of Japan Rail in Tokyo, whose integrated circuit seem spectacularly stripped of reference to physical landmarks or phenomenological relation to the world.

JR new.jpg
Integrated Circuit.png
tokyosubway2011j

When Ian Rawes sought to encode over 1,500 discrete recordings in the London Sound Survey but in plotting the courses of the audibility of otherwise-hidden waterways plots, the Survey organized what seem curiously subjective perspectives to map what can be heard at different sites in the space of a single map of the hidden streams that run through the metropolis; the act of apprehending the submerged underground network is pleasantly reorienting, focussing our attention on where they reappear and intersect with birdsong, dripping waters, passing individuals, or local sounds of construction and transport in the city:  the discrete sites assemble, collectively, both a map and an aural environment that most maps)cannot capture.  Each discrete sound seems impermanent, but  also suggests, collectively, the ways water briefly reappear in a built environment, as rivers, streams, and canals enter lived life in ways not detectable on an actual map. At each “stop,” we enter an observation-station where Rawes recorded the ambient sounds around waterways.

1.  The resulting mapping of the soundscape of London’s waterways offers a multiple points of entrances to soundscapes outside the city’s built environment. The permanence of the pathways of canals, rivers, and underground waterways rightly map of the sounds of the system of waterways as intersections with a riverine underground.   Explicitly designed as an “auditory tribute” or homage to the circuit-like color-coded design of Harry Beck’s modernist map which clarified complex pathways of the tube for commuters earlier only “about as legible as a bowl of spaghetti” for its riders.  Beck’s draftsmanship elegantly schematized the pathways of London’s Underground to allow their legibility in an icon not only of urban transit but accessibility, but of the city itself:  at a time when the city’s subway had become so geographically far-flung to be a challenge to condense to a legible fashion, the map effectively persuaded commuters of the ease of navigating its totality, while living in its suburbs, by mapping the pathways of its trains by angles at increments of forty-five degrees to increase their legibility, and foregrounding its interchanges.

Ian Rawes cleverly adopted the diagram first designed to promote a readily legible record of commuter rail, by straightening out their course and contracting the distances at regular intervals to allow aural access to sound files through a web-based interfaces.   Whereas Beck’s intent was to expand the utility needed in a transit map for audiences in ways that riders to navigate its multiple lines that was readily appreciated by riders, Rawes’ map is an opportunity for noticing the overlooked, and invite them to follow the paths with which waterways intersect with other lived environments.  The cooing of pigeons and drips of water under the Greenway bridge at “Channelsea” off the Lea complements the hum of traffic overhead, as if an epiphany of the evanescent; the passing train near the Roding at “Alders Brook” suggests a moment watching passing urban traffic on a viaduct, as the trickle of water at “Paddington Basin”–not Paddington Station–almost concealed by the loud whirr of air-conditioning units and an intermittent power-saw from a nearby construction site.  The Brent flows under the observation station “Greenford Bridge” pierced by the referee’s whistle at an amateur football game mixed with players’ cries.  The registration of lived experience sets something of a watermark on the sounds of London circa 2012.

The physical expanse of Rawes’ aural map is an a propos homage Beck’s diagram.  The soundscape map reveals the similar permanence of overlooked waterways that link to the Thames.  By collating short sound-files at points where they emerge from the built environment, preserving a uniquely personal reaction to place of the sort that often eludes city maps.  Where Beck preserved a mental image of the sites at which access to the London Underground was permitted, at a user’s click, a range of ambient sounds peek through the observation points noted by the stubs with which Beck rendered Underground “stops” in his iconic map.  Beck’s map was immediately popular among commuters as a way to re-render the urban space.  It has since gained such sustained popularity as a model for similar subway systems–it encouraged urban expansion in Sydney (just eight years later) and encouraged Beck to submit maps for other cities’ transport systems in future years.  Indeed, the image has become so a successful a symbolic rendering of London’s space for its conventions of colored lines and combining of circular hubs of interesecting lines with stubby stops to orient access to London’s underground.  By using the streamlined circuit-like conventions by which Beck had oriented riders to the expanding Underground and navigate their commutes, Rawes recuperated the lost sounds of the city’s waterways as if to remind readers of the distance at which they stand from them.

The Underground map was, of course, famous as a remapping of urban space, as much as an icon of London.  The diagram placed stations at a remove from actual distances or locations, but replaced an image of the actual geographical relations in the city by highlighting their routes on clearly colored paths that run in uniform lines  to prominently render interchange stations, filtering out any reference to the city’s physical topography save a quite schematic rendering of the Thames; the image was quickly affixed to every station on account of its highly readable ways by which it oriented city-dwellers and allowed them to gauge the crucial question of the number of stops–rather than the actual distances–to their destinations. If Beck’s map collapsed space, the map of waterways orients readers to the transit that water took across its expanse, in ways that seem irrelevant to spatial geography.  Beck straightened the river’s course in the name of clarity in his diagram, in line with the straightening of trains’ routes for readers to allow them to better visualize routes of travel and the exchanges they would need to make.

Such is the conceptual clarity and considerable staying power of Beck’s diagram to navigate London’s underground makes it in fact quite difficult to view the actual pathways taken by Underground trains–yet Beck’s system of reference remains so powerful a symbolic form to conceptualize London’s Underground that it is disorienting to be presented with the actual courses train lines truly take in the city.  As a symbolic form of what Rudolf Arnheim called “visual thinking,” the diagram encouraged Londoners to take to the Underground as a way to navigate their commutes or daily travels with such success that an actual groundplan of the interface between the individual lines and the city’s space seems disorienting in how it reveals the meandering pathways that train lines actually take, the actual sinuous curves of the Thames, and the apparent failure of trains to turn at increments of 45° along their true courses.

Beck's lines mapped on London

We are far more ready to map the familiar transit lines displayed in a reference key and shown in the maps by pronounced paths of colors, as a network that existed as if autonomously from the city, to better find what he called its interchange stations.  The notion that the network was made up of discrete lines proved immensely influential in all later transit maps.

REference

Beck’s Original Reference Key (1931)

For Beck’s crucial insight of simplifying the courses of trains by mapping subway lines in increments of forty-five degrees allowed riders to imagine the paths of trains as a network independent from the street map. It has been expanded, accommodating the multiplication of transit lines reflecting the city’s explosion:

London_Underground_Overground_DLR_Crossrail_map.svg


Beck’s streamlined routes of the diagram offered Rawes a quite fitting medium to map each waterway’s aural settings at observation points.  Each “station” presented readers with a chance to look under the map to hear the sounds that peer out from it, at a click:  linked sound files map unmapped–and perhaps often forgotten–waterways from the River Lea, Wandel, Roding, the New River, Brent to Beverly Brook.   Rawes’ legend link multiple listening stations, linked on a similar spectrum of color-coded lines to orient viewers, even if each sound-file disperses one’s attention to the city’s surface in way that are wonderfully unlike the fixity of Beck’s coherent system–the map individuates specific points where readers can descends to join not the Underground lines, but watery courses below an inhabited surface.  Each waterway is assigned a uniquely colored path that approximates the hues of the current Underground, and are given the names of the actual waterway, transposing the natural and the man-made.

legend of rivers in map

London Sound Survey, Waterways (Legend)

Beck’s diagrammatic streamlining of the Tubelines provided an apt set of conventions quickly identified with underground transit routes of built conveyances.  He used them to chart hidden points at which the constellation of urban waterways intersect with the city’s lived environment.  The resulting soundscape map situated the emergence of waterways in the city.  The result is to suggest the points at which an otherwise hidden network of waterways reveal themselves in the soundscapes of docks, bridges, marshes, creeks, reservoirs and parks that we so often consider the built city to have replaced.

Pushing this avenue of investigation, Rawes invites readers to revisit and investigate a hidden network of waterways running under the city that are hidden from the familiar map’s surface.  In a metageographical terms, Rawes’ sound-map acts as a comment on the folly of conveying an actual level of continuity to the quite specific sites where water appears to be heard, and the relation of the transit of water in the city to the historically built means of transit–from traffic to the sounds of footsteps, joggers, walkers, the drone of airplanes, industry, or as well as ambient birdsong–and allow the unique poetics of an imaginary landscape to emerge that results from the situation of London’s actual hidden waterways.  To be sure, the role of the cartographer is as a disinterested observer–Rawes preserved this role, it seems–but offers archivally dated sound files of each place that the reader can savor in one-minute clips.

2.  The river, of course, runs through it.  The London Sound Survey of Waterways present a palimpsest of urban topography.  The location of the individual urban soundscapes offer a counter-map to urban space, exploiting the ways in which online maps invite us to go beyond this reading of the imaginary in an eery way.  By linking the mapped space of the city in an almost joyously synesthetic fashion with urban sounds, the sound survey of London’s waterways provides a way of tracking urban experiences around is hidden waterways, suddenly bringing them to the surface from the very tools of mapping London that are perhaps the best known.  By inventively embedding sound clips of tickling rivers, birdsong, traffic, droning of substations, cries of gulls or terns, trains, and even boats on the Thames, we see the city in new ways that recreate a map with an almost subjective intensity that is almost always inherently absent from a map’s face. Suddenly–unlike the original–we find the waterways of the inhabited city peeking into the stylized format of Beck’s transit map, as the submerged riverine paths are given a prominence most dwellers of the city ignore.

Beck’s diagram of the Underground intentionally abandons scale or correct proportions for regularity and apparently straight lines in his own schematic rendering of waterways.  Beck’s aim was to produce a quite stylized format to grasp facilitate urban communication and both plan and recognize routes of commutes.  The immediate success of Beck’s formal innovation of how to mediate he underground to its passengers of course now offers not only an icon of London, but served to helpfully map the city’s physical space, even while the diagram sacrificed exact spatial correspondence or measurements:  indeed, many visitors to London are regularly reminded to disregard the plain distortion of the Underground map, much as visitors to New York may need to be reminded that the walking distance between apparently nearby stops is greater than the map implied.  Beck diagrammed the Underground as a record of routes of transit not corresponding to their spatial organization.  Rawes invested similar regularity to the waterways that fed the River Thames, which he gives a prominence in his map, to which each of the waterways linked, though few have commerce with one another:  if Beck streamlined the Underground lines, Rawes “Beck-ified” London’s waterways to better distinguish a network of streams hidden from public view and register their sounds, often overwhelmed by ambient noise.

In appropriating the conventions Beck pioneered for London’s Underground, the course of the city’s hidden but barely heard waterways are mapped to suggest the hidden streams running under the city, and bodies of water from canals to brooks to rivers with which the city’s inhabitants rarely recognize.  Rather than orienting viewers to the course of London’s rails, the map tracks waterways and reservoirs–the natural life and urban life–over which were built roads and buildings and the tube itself–and reducing the Thames to something like a mere geographical marker.  The sounds of the city, not only of its inhabitants, is meant by Ian Rawes to offer something of a more accurately embodied record than a map could offer in words and drawing, or might otherwise go overlooked.  (Despite the clearly modernist–almost futurist–rationality of Beck’s diagram, its circuit-like nature is notably less evident in the 1931 map Beck designed, which gives less prominence to a Circle Line, because it was primarily intended to carry folks to the city’s centers from outlying regions.)

London-Underground-Maps-009

Harry Beck’s 1931 “Underground Map,” courtesy London Transit Museum

Beck’s diagram of the Underground nicely lends its recognizable structure to tracking the submerged waters of the rivers in ways that one can explore their relation to city sounds.  Sounds are removed from the graphic purity of Beck’s modernist design.  A barely concealed aspect of Rawes’ homage to the draughtsman who designed the Tube Map is no doubt that Beck symbolized the Thames to appear innocuous in the Underground map–orienting viewers to the paths of rail-lines of commute that link London’s previously quite discrete neighborhoods, but which echoes the apparent straightness and gently curved lines of laid track, and, reduced to a  light blue abstraction, recedes into the visual background of the mapped field and is, in fact, no longer an obstruction to movement. In Beck’s map, the Thames’ pale blue almost sinuous curves are only as a sign of spatial reference.  In sharp contrast, the River Thames is ever-present as one approaches at different basins or boatyards, the irregularity of the canals and lesser rivers are shown as similarly stylized lines on which the viewer can use to click at a range of sites–rather than stops–to find a range of epiphanies manqués that underscore the incompleteness and selectivity of the map–or any map at all.

In the Sound Survey of London’s waterways, the ways that Beck translated the network to terms passengers might best negotiate relinquished geographic accuracy, but became a basis to negotiate the city’s geography:   the presentation of the clickable map of urban soundscapes of water offers a counter-map of the city, and allows the online viewer to indulge in the multiple dimensions of the natural settings in which the track of the city’s Underground was built–and the sites of confluence of natural and man-made in today’s city.  If Beck’s image was quickly affixed to every station as a shared model for orienting city-dwellers to trace their paths of commute, the success 1931 printed map provided a framework whose popularity has endured, because of its remove from the city’s lived landscape, its interchange stations set against a blank white background to ensure its greater legibility by commuters.  There is something truly telling in that the map was commissioned to reduce the intolerable and untenable density of foot-traffic on London’s streets.

underground_map_beck

Victoria and Albert Museum, “Underground Map” (1936)

3.  The sounds on which one click fill the diagram of waterways with an immediacy unfamiliar to maps.  In way that transforms viewers’ relation to the city, Rawes’ counter-map re-purposes the stylized simplicity of the lines of transit to show the proximity of the waters to urban settings:   the map focusses on waterways relegated outside the underground in Beck’s diagram.  The insight of preparing a set of lines that oriented viewers to how lines link to one another–more than the urban streets above–to suggest the autonomy of the system into which Londoners’ entered, as limiting the lines of rail to angles of forty-five degree increments, indeed oddly naturalized the streams that commuters would ride along and across the Thames:  Rawes organized his record soundscapes on rivers that followed as they entered its path.

The urban observation points, if rendered by Beck’s symbolic conventions, offer a distinct system to orient oneself to the map’s surface–in far less pointedly utilitarian ways.  While Beck’s map presented cues by which the train-passenger can orient themselves to the landscape of London in tacit fashion, in order to better orient themselves to its non-exact spatial scale, the city is absent from the diagram.  One function of the map is to place oneself in a close proximity to the water–on bridges, by viaducts, on a quay, by a lock–that can rarely, if ever, be recreated in a static map or web-based map, as well as to a complexly variegated aural environment of birdsong, workmen, planes,  and passersby.  Viewers of the London Sound Survey can be immediately transported, by one click, to relate to the city’s space in distinctly news ways–and a wonderfully synesthetic manner that few maps are able to offer, inviting a perceptual world into the map that defies its oculocentric organization as a surface that is only scanned.

By clicking at a toponymy quite unlike that of Beck’s classic map, one enters a sonorous site whose power almost asks one to resist the city as a cohesive collective and focus on moments of the transcendent.  For we are struck by a barrage of closely observed sense-based observations, on a gamut of individual sounds cumulatively overwhelming as site-specific perceptions of London’s canals, rivers and streams so as to reveal a “sweet inland murmur” that echoes the revelatory manner that the Romantic poet William Wordsworth evoked, while returning to its banks of the River Wye that he had often remembered as “a landscape to a blind man’s eye.”  Wordsworth’s elegant formulation of the sense of transport as he stood “by the sides/ of the deep rivers, and the lonely streams” led him to apostrophize the “sylvan Wye,” whose sounds seem a form of local transcendence, as a place of blending perception and creation–a pastoral whose “tranquil restoration” lies not only in the perception of waters “rolling from their mountain springs,” but a recognition how at their sound “the picture of the mind revives again.”  Could a map offer similar restoration?

One does not perhaps feel the same ecstasy sort of transport Wordsworth had described at each minute of sound, but all transport us to another place, and to conjure the flow of water beneath the map.  Each station force one to sort out the flood of discrete sense-based perceptions that one registers with immediacy;  Wordsworth described being overcome by the sublime of “sensations sweet,/Felt in the blood, and felt along the heart” in Lines Written a Few Miles Above Tintern Abbey (1798).  The sensations its sounds and sights provoked he knew well, were re-felt as he saw it again as if for the first time.  Although few observation stations in contemporary London offered the opportunity to “hear the mighty waters rolling evermore,” individual “observation stations” offer points of ingress to hone in on places absent from Beck’s map, to access a similar “sweet inland murmur” of waterways and city sounds.  In an age of global warming and the recession of ocean waters, and when the water levels of major rivers have dropped worldwide, it is not that one arrives at a redemptive sublime beneath the map of Wordworthian proportions by listening to the sounds of London’s waterways, or takes stock of being newly attuned to one’s past memories of a sight and placebut that the lived city appears, through the sounds, to one’s mind.

As the names of pseudo-stations in the Sound Survey’s version of Beck’s map provide names linking to Rawes’ sound files, auditory perception is linked to place through the magic of the map in ways that seem a sort of local sublime.  Clicking on stations not only orient readers to place, but transport readers to a mental image of a glimpsed landscape, if in pointillist fashion:  each offers a revelation of the traces of the waterways that fed the Thames or canalized water in the city.  The salient waterways and canals are suddenly made evident, and able to be traced, below what we usually consider the city’s physical plant.  And as the reader encounters equivalents of the “sad music of humanity,” the cries of adults and footsteps of passersby, moving both in and out of the water that flows around the city and birdsong about its canals, rivers and streams:   the “stations” conjure the sounds urban inhabitants might have once recognized, navigating its rivers as they run through and reappear in parks, channels, reservoirs and zoos.

The poetics of the soundscape map seems truly Wordsworthian:  the click of a cursor offers readers the opportunity to revisit the city’s waters, and by revisiting the sonority of settings around the city take stock of their changing relation with its actual environment, but create images of place in the mind’s eye.  While the relatively rapid adoption of the iconography of the “Underground Map” situated rail-riders in London in ways that rapidly habituated them to a new understanding of its expanse, the sounds of waterways access a hidden set of sensations London.  One hears the ducks and gulls that circle above the West Reservoir in North London with a chill, as the roar of traffic recedes, listens to the overlooked but immediately recognizable appearances of sounds of water and nature in the built city.  (The textual descriptors that appear after clicking on each “stop” catalogue the impressions, but cannot fail to capture their experience.  The sounds of coots chasing one another at “Welsh Harp” suggest that Beck’s map, and the project of cartographical modernity, has been directing our attention to the wrong things all the time.)  When one clicks on the sound survey of urban estuaries, rendered at points as if rail stations or stops on the underground, lived moments pierce through the familiar symbolic surface of the map, as lived experience breaks through it surface, as if the offered points of entry ways to an underground station; a click transports one beneath the map, in ways that seem to break through the symbolic surface in ways that remind us of the distance between mapping and the aural environments the mapmakers recorded.  The ecstasies of “dizzy rapture” calls our attention to the often unnoticed flow of waters about the built city, and aural particulars of the environment that escape almost all maps, as “every common sight” delivered seems chanced upon, and as a moment “present pleasure” “upon the banks/Of this fair river” was recast as actually “Apparell’d in celestial light.”

Is Wordsworth in fact an apt reference for the sort of transport that the designers of the Sound Survey Map intended, rooted less in actual spatial itineraries than the sort of reflection on water, place, and perceptions that Wordsworthian poetics had invited readers to focus their attention?

wye-valley-hills-wide-1600x900

River Wye

The intense barrage of imagery Wordsworth’s 1798 poem is evoked in the sound map Rawes designed in 2012.  For the density of detail in Rawes’ recordings suggest the illusion of rendering continuity in a map–and preserves the immediacy of the reality that lies beneath any map.  The counter-symbolization of London’s cityscape in the sound map offers inverts the near-absence of the Thames in Beck’s map, altering the streamlined simplicity of the Tube Map’s circuitry, as it dismembers the circular pathways of interlinked trains to a web of discretely noted rivers and waterways, and suggesting the irregularity of the river’s bends.  Rather than marginalize the Thames as the sole route of water, a wide strip of a set of parallel blue lines, almost external to the mapped system of metro lines, waterways are indeed the system mapped for the London Sound Survey of waterways, Beck’s iconography, tongue-in-cheek, as a way to trace waterways that expand from the Thames as they reveal its feeders:

Soundmap after Beck

The pathways taken by water in London are rendered by the standardized conventions to order the aural environments of the birdsong, bubbling brooks, or the dripping water in London’s creeks and minor rivers effectively pierce the smooth and streamlined diagram of Beck’s modernist circuit-like symbolization of the Underground.  They allow us to engage with the sound world that Beck’s map intentionally omits:  one hears rushing water of the River Lea at “Pickett’s Dock”; faint cries of seagulls at “Camden”, before a train intrudes as it enters Euston Station (not on the map); bird song that arrives from the aviary of the “London Zoo”, with a magpie chattering, adult coots heard in the Reservoir at “Welsh Harp”; “Paddington Basin” (not station) is dominated by the sounds of air conditioning units and powersaws–and puts the sound of trains, traffic, footsteps, human cries, or construction that are heard in the background, as if intruding into a sound environment, as well as being part of it, allowing one to imagine a landscape peeling away layers of history with insouciance for viewers lucky enough to click there.  At a click, an aural experience of the lived world of the city emerges from the map as if leaks out of the surface that Beck’s iconography leaks out from the map’s surface.  Each small sound clip transports one to a sense of place that unfolds in one’s imagination with a physical clarity that is altogether absent–and indeed banished–from Beck’s more utilitarian (and sterile) transit map.  The sound clips transport one to specific sites, rather than allow an infinite number of itineraries to be traced by multiple users, but allow one to explore the city’s aural dimension through a visually and symbolically similar map.

The map invests discrete moments of specifically noted times with new meaning as a collection–and suggest less of an inhabited city than ambient sounds most city-dwellers in London be apt to neglect, which would undoubtedly never be noticed if they had not been recorded.  Indeed, the transient sounds of a world filled with water offer a sense of tactile contact with the place described, through a map, that at the same time, unlike a map, suggest the evanescent nature of place, and its fragile beauty.  At this point, the map is a map, but it is also a portrait more intensely immediate than any map can be:  in the medium of the internet, the immediacy of this map lies in its non-visible parts, which take one down passageways unable to be depicted on paper.  Once one gets rid of the cellulose embrace the interface, the flimsiness of the static designation of place–even the not so well-known places in the Sound Map of London’s Waterways.  As Mutton Brook flows nearby “Hampstead Gardens”, one seems to be knowing the place with a far more acute immediacy than any name could offer.  As one clicks the map, the sounds recorded on specific dates acquire a timelessness.  And one experiences, after repeated clicks, an eery impression that the selected sounds seem chosen so randomly to make one aware of the omission of any information in a map–and the mechanized nature of the possibilities of interaction that the map offers.  This argument may press the notion of the poetics of cartography to a further degree than the London Sound Survey intended, but it hardly seems a coincidence.

In listening to these sounds, one can suddenly recuperate the ambient sounds that stand at odds with the overwhelming aural experience of the underground, long a deafening roar and clang-and-clatter.  We listen, in a focussed and almost Zen fashion, to the rasping of grasshoppers, magnified to be louder than surrounding traffic, at “Tottenham Marshes”, or the birdsong, playing children, and barking dog at “Palmers Green”:   seemingly evanescent local sounds are recuperated, as it were, and offer an entry place to creating an image of each site.  If they seem in constant tension with the totality of the city, showing the foolhardy nature of any hope of truly comprehending a synthesis of the city’s variegated landscape as a continuous expanse, they allow access to meaningful overlays of sound in specific sites.  If reduced to a set of poetic fragments, the city is not only uncomfortably dismantled in the map, reduced to a set of recordings, but the recordings register changing degrees in the presence of water in the built environment and allow us to discover the waterways concealed in most maps.  Through them, we discover space by a completely new toponymy than that which usually appears on maps to better create them by the mind’s eye:  the result is something like a meditation on the poetics of cartographical creation that Wordsworth might have admired, or at least recognized, as a lover of “the mighty world/ Of eye and ear, both what they half-create,/ And what perceive.”

Dual functions of sense-perception embedded in the London Sound Survey of Waterways cannot fail to appeal to the mind’s eye:

[http://www.soundsurvey.org.uk/index.php/survey/waterways/]

Life falls out of the map, in purely auditory form, and map a gap between the map as construction and the lived cityscape.  The minute-long intervals of cascading of water one encounters as one walks beside the Wandle in South London, coots in North London, the Ravensbourne at “Bromley Common”, the faint roar of the Roding at “Woodford”, River Beam at “The Chase”, the trickle of the pools at “Lower Sydenham”, punctuate the monotony of the static form of a printed map, and indeed dramatically shift our perceptions of space:  we hear a car moving, hear voices of adults or children in the background, but these glimpses of the day-to-day offer a sense of the stability of the experiential, in ways that few paper maps can ever do.  We are not actors who determine this environment, than we are passing through it to appreciate it.  Its given names were assigned by humans, but those names, for a moment, actually seem completely beside the point.

3 Comments

Filed under environmental mapping, London, Soundscapes, transit maps, urban environment

The New Separatism and the Gas-Tax Latitudinal Divide: Tracking the After-Images of Southern Secession across the United States (Part I)

No region is an island, but divides are defined in ways that create a transmitted insularity along what might be called the Gas-Tax Latitudinal Divide that cuts across the United States, bisecting much of the nation along what almost appears a meridian.  Even before the efflorescence of confederate resentment in southern states clear in the 2016 Presidential election, but not at all clearly perceived in recent years, but evident the apparent toleration of the claims of white supremacy and the far right that are rooted in states rights, and, almost perversely, rooted in the limited abolition for slavery and enslavement to expand across territories of the United States titudes north of 36° 30N,–a latitude inherited from the accident of early surveyors’ decision to mark the boundary line between Kentucky and Tennessee.

The latituidinal divide offered both an “objective” basis to extend slavery westward and a fulcrum to guarantee representation of slave-holding and non-slave holding states in the U.S. Congress, a line of apportionment that guaranteed the preservation of local rights of slave-holding, before it marked the secession of the Confederate States of America. The divide has fed a bizarrely enduring discourse on states’ rights in American history that has in many ways colored the complexion of the world, as a repository for the persistence of a reactionary localism in a globalized world, as the initial session of Virginia after Ft. Sumter in the Spring of 1861 was followed quickly by Arkansas, Tennessee, and North Carolina, sectionally dividing the union,–until its disintegration left only the southernmost states defending slavery as an absolute local good.

Confederate States of America
and Claims made by Confederacy

Long after the practice of enslavement was condemned as sinful by evangelicals, and uprooted in European nations, as was the case by 1848, the inner sanctum of the defense of enslavement lay in the preserve of the CSA–a community-sponsored movement to defend enslavement as a local privilege. Indeed, the depth of memories seem to have been provoked by the stripping of symbols of localism and place like the Confederate flag–the emblem of the separateness of the southern identity–a regional identity perhaps exacerbated by a perceived loss of regional identity and afford continued objects to intrusive federal actions, in a symbolism of nobility that recalls a bend dexter with a bend sinister, and haunts even our most present–and apparently innocuous–as mapping the state of the states in data visualizations parse meaning by blocks whose continuity suggests deeply lying fault lines.

images-7

The resistance of localism–and the national drama, indeed, of the attempt to strip the region of its symbol of autonomy–has perhaps not only had a greater impact in how early twenty-first century politics have played out in America, but of the deep presence of the divide of the seceded states across generations.  Can the survival of this divide be mapped? Or will it, more likely, continue to haunt the nation, as in the American Petroleum Institute decided to  map as a way to lay out ostensively objective record of local variations in gasoline taxes around the country, devised somewhat opportunely in 2014, as the United States was poised to run out of federal money to restore roads, and the chatter on gas taxes rose.

American Petroleum Institute

The problem of an alleged discrepancy in tax-rates that the American Petroleum Instituted foregrounded was based on the numbers of cents and decimals–not on percentages, m although the confusion could be excused, viewing the map and its legend without further information, so clearly does it seem to correspond to that blue state-red state divide that has long haunted our social media-saturated spatial imaginaries. If the map was intended to be polemic, and provide fodder to resist calls for calls for raising gas taxes since in counties–the federal tax remaining stable at 18.4 cents/gallon since 1993, the map taps into an ethos of tax revolts by purporting to illustrate an alleged discrepancy in tax-rates along a national fault line.

The divide that the American Petroleum Instituted foregrounded was based on cents and decimals–not on percentages, m although the confusion could be excused, viewing the map and its legend without further information, so clearly does it seem to correspond to that blue state-red state divide that has long haunted our social media-saturated spatial imaginaries. If the map was intended to be polemic, and provide fodder to resist calls for resistance to further hikes in taxes, and suggested the importance of seceding from what it cast, ingeniously in ways, as a sort of necessary secession from higher energy prices–the primary foe of much of the nation, it has seemed for most of the post-Cold War period.

American Petroleum Institute

The spectrum of county taxes is indeed much more complicated, revealing that it hardly makes sense to parse in states, although they reflect how some states have passed laws to restrict emissions of dirtier fuels, as gasoline, and have actively sought to do so, in the western states of California, Washington, and Oregon, by placing a larger tax on gallons of gas, in way that “Gas Buddy,” hardly a friend of the American Petroleum Institute, but a data-miner who seeks to give the lowdown on gas prices: the devious color-ramp depicts the bucolic nature of the southern states when it comes to protecting the price of low-cost petroleum for our engines, and the red-hot far west that seems a danger zone that might as well fall off the map.

The website allows one to map in real time, by a color spectrum seeing to affirm that the grass is greener as deeply as you drive into the traditional region of southern states, where the rights to cheap gas seem to be preserved, and the status quo of cheap gas is maintained: the land where cheap gas prices allow fertile fields to bloom, and environmentalism is out-sourced for self-interest, unlike the red-hot far west, of which all drivers should beware.

The data vis in other words affirms that GasBuddy is looking out only for our best interests, showing at a glance “the best gas price, anywhere,” at a glance. It’s not surprising GasBuddy is a big friend of Google, and has gotten rid of any state lines, as well as environmental costs, as if to reveal the county-by-county free market of gas prices for his online audience, in ways that increasingly seem to register the deep danger to the wallet posed by driving out west. This is the map of the triumph of the free energy market, embraced as the United States has become the biggest natural gas producers in the world and the top producer of petroleum hydrocarbons since 2013, raising hopes of the growing green for gas guzzlers nationwide, who try to laminate highway maps and interstates over the green fields that get only greener descending the Mississippi as one approaches the Gulf coast.

Gasbuddy, Heat Map of Average Real Time Unleaded Gasoline,
August 2019

“Prices” here are not based on taxation alone, but “average prices” suggest the significant differences that exist between regions that indeed depend on commercial trucking, and ensuring low-cost convenience stores and supply chains, but have made a decision to prioritize free commerce at the expense of infrastructure and the environment. If it can be credibly argued that many costs of road maintenance, from snow-clearing to cracked asphalt, may not exist in the warmer climes of southern states, and rural roads are often less trafficked, the strong sense of separatism and defense of local privileges shines through the above map of gas prices, which reveals just how modulated the spread of up to a dollar and a half of the cost of gas/gallon are inflected by differences in gas taxes, although these only vary by a spread of about twenty cents.

Rather than be a post about road trips, the Gas-Tax Map provided an opportunity to excavate its layers, and investigate the underlying relations of a deep-seated stakes of states’ rights discourse that seems to underly the polemic visualization, as much as the proximity to offshore refineries in the Gulf of Mexico.

2 Comments

Filed under Confederate States of America, data visualizations, infographics, Red states v. Blue States, statistical maps

The Map is Dead–Long Live the Map!

Participants at the symposium Mapping and Its Discontents debated the benefits of the near-ubiquity of uniform mapping systems sponsored and orchestrated by Google in our lives.  Many of the wonderful papers tried to suggest the benefits that mapping served as alternate ways of making visible the unseen and giving voice to the silenced–but did so with deep skepticism of the dominance of Google Map’s blandly undifferentiated surface, both as a sort of collective erasure of knowledge, and a sinister synthesis of gathering meaning about individuals’ consumption habits.  In this somewhat hopeful symposium, whose speakers urged the audience to go forth and map, Denis Wood offered a skeptical history of mapping as a form of art, focussing less on its craft than on the contexts in which it was read and exchanged–and the historical “explosions” of map making as a tool of state-making.

Although Scott McCloud does trace comics back through cave paintings and the Bayeux tapestry, something we recognize as a comic book it to printing and mass-production of paper in the mid-nineteenth century, the printed ephemera Alan Aldridge and George Perry first identified as antecedents to  the sort of fantastic album art he produced, we don’t see much we would recognize as a map until printing, Wood argues–and that the fifteenth century is a good place to start the history of maps.  But rather than peg the map to the material practices of the production of information, the ways of embodying information and need to embody networks of spatial organization reflect the new need of an emerging modern nation-state–as well, he might add, though he omitted it yesterday, the need to straighten out clear bounds of contact and digest the discovery of new worlds.  (One might object that rather than leave this entity of the “state” so monolithic, dual origins of causation can be seen in the Renaissance, both as a period of contact with new worlds and that gave currency to the creation of newly imagined worlds–the “other Green world” of Harry Berger–as joint ground in the poetics of making, reading, and reproducing the map.)

As longtime interrogator of the power of maps and enfant terrible of the cartographical establishment, Wood’s opening salvo called attention to how print helped differentiate the standardization of shared practice of mapping space from the genealogy, charter, systems of notation, almanacs, calendars, or rolls, maps served to conjure the state to existence in its graphic performance–and to conjure the state, in ways repeated in histories of Japan, Siam, and the United States, as Elizabeth Berry, Thongchai Winichakul, and Martin Bruckner have shown, as a natural object, when it was not before.  Any attempt to naturalize the map either as a depiction of the world’s surface or universalize its documentary function, he noted, including the celebration of the recent democratization of mapping skills that seem to dislodge authority from the map’s form, passes over the map’s role in the state and state formation as a form of spatial intelligence and spatial intelligibility.

We might do well to look for origins, Wood proffered, by asking exactly when it became a slur on a civilization that it does not use maps–or couldn’t read them.  The question was enticing because of how it raised questions of the ties of map making less as an instrumental tool of dominance over space, than a standard of civilization and knowledge–a standard of the sort that Graham Greene evoked in his postwar visit to Liberia, Journey without Maps (1949).  Although Greene’s visit to the colonial outpost was certainly a product of Africa’s partial colonization by European industry, and the end of English empire, his account reflects Wood’s point that maps exists only where social relations call for them exist:  that where talk serves, maps are rare; but that when talk becomes inadequate, alternative graphic forms of communications develop within the state–of which the map plays a central role.  Greene beautifully if parsimoniously evoked the elderly toothless man with whom he shared a boat ride at the end of his 1946 journey who suddenly approached him with a piece of pressing news:  “‘Do you know that in Monrovia they have a map of the whole of Liberia?  I’m going there to see it.  It is in the possession of a family called Anderson.  They have had it for years,'” he says wonderingly, suggesting amazement at the foreign family of colonizers who possess a map of the entire country in which he lives.  “‘Sinoe is marked on it,'” he continues, “‘and Grand Bassa and Cape Palmas,'” repeating what he has been told by others, but never having seen a map of his entire land.  The encounter might well have been invented by Greene, but created a topos for the encounter between the map-literate and native that presumed an eagerness for encountering a map–the map seems a sort of lodestone–that might be either a western fantasy or a deeper discovery of a land where, absent the myth of colonial organization, the residents don’t know maps, or an illustration of deep ties of mapping to the civilizing process delineated by Norbert Elias.

Printing allowed the map to penetrate the lives of people about 1500, unlike other forms of data-keeping:  for the creation of a map that penetrated the lives of ordinary people and readers effectively under-wrote social relations of power in very concrete, linking territory to other things in ways that advanced the making of maps and shifted the role of mapping as an enterprise:  we count only a few thousand maps prior the growth of the nation, but an explosion of the production of maps in the sixteenth and seventeenth century occurred of the sorts of which was never known, and parallels the map’s entry into individuals’ lives to a degree that never occurred earlier–a notion, as Wood long ago argued, of “map-literacy.”

Nations were indisputably the new arenas of this move to mapping, unlike the printed maps that were widely sold in Italian city-states or the Netherlands.  Earlier maps such as cosmological charts, star maps, or property charts of the Babylonian period or in Japan and England had legal purposes, but quite different from large-scale graphic property function in varied places around the world, and without participating in a map-making tradition in projects such as the mapping efforts of Phillip II to create detailed records of imperial possessions in the Mediterranean, or the huge map making projects of Louis XIV and Colbert that are tied directly to the state and to the material recreation of state sovereignty.  (Of course, this raises the question as to why maps first emerged as forms for advancing epistemic claims and embodying places in areas that were less clear as examples of the modern state, like Italian city-states or sites without empires like the Netherlands or whether the imaginative ends of mapping can be separated from their administrative ends.  Wood sees them as being as tightly tied as the sides of the same Moebius strip.)

It is in this arena of the state, Wood forcefully argued, that we can see the inauguration of modern topographical functions from real estate, to prisons, to cellphone use, to voting practices, to states rights, to a point at which we can’t consider life without maps.  The date 1500, far from being one of convenience, is something like a benchmark or velocity point for the new roles that maps began to play and that they continued to assume today–a point of no return, as it were, of the sort Ian Hacking drew to mark the emergence of probability at the date 1660.  Only after 1500, or in later periods, did mapping emerge as a way of life, Wood insisted:  if some fourteenth-century monks drew plans of their monastery, the idea was not widely or even narrowly pursued as a basis for collating evidence, or followed up on in ways that reflect the multiple functions maps came to assume.  There is a bit of utopianism here:  whereas human societies didn’t need maps, and got on well without them before 1200, he argued, noting rights and properties’ specific attributes in other ways,  the map’s discourse-function failed to develop itself as a means to exploit strategic resources and to have operable use and currency.  While he recognized the evidence of the creation of maps in Song-era China within select parts of well-established bureaucracies, only later did maps gain a large discourse-function of operability.   This may be a bit of a slippery logic, but argues that the “map” had new meaning at a certain point as an object of exchange, and that no properties inherent to its design exist save as such an object of exchange.  So much for its formal attributes.

Wood marked the birth of the map that is now perhaps dead  at this sort of a watershed:  in 1400, few used maps; by 1600, maps became inseparable from social functions in a global context that is itself only beginning to be mapped.  The abundance of eighteenth-century maps in China, or in the seventeenth century in Japan, and in Vietnam from the 15th and 16th century, and Mesoamerican and Malay maps in 16th century, are traditions that inaugurated in the early modern state.  Indeed, there is a weight of evidence to shift this change in the growth of European knowledge, and it reflects a massive rise of needs for map making to ensure border control, water management, land reclamation, military needs that just exploded with the state.  If even in Florence, Italy few maps exist from before 1565, Florentine, Neapolitan and Milanese mapping projects all exploded in the sixteenth and seventeenth centuries, as they did in seventeenth century Japan, when thousands of government maps issue in Japan, and maps served to perform the form of statehood.  

What changed, Wood argues,  was that then new political structure of impersonal construction demanded new forms for its embodiment, and gained a propositional function that was absent from earlier map making traditions–a propositional function that was necessitated and called into creation by the state.  He recalled how Martin Bruckner showed how the image of the national map of the United States staked the proposition that there could be a tenable unity among this expansive nation, much as imperial maps of Britain tried to persuade readers on both sides of continent of imperial possession of north american content, as an artifact of state–both of these cases illustrate the new tangibility that the map assumed as a means of calling the expansive relation of the state into existence by the graphic performance of statehood that was newly enacted in the printed map, and which the map served to make legible.  As Thongchai has shown in his work on Siam, maps served to produce the very “geobodies” that become totemic through the map’s presentation of the state, creating a sense of unity not familiar to many, but able to normatize a nascent polity, and to instruct countless participants in the construction of our country–even without a clear idea of citizenship.  The skill of state apparatus lay in bringing routine of state practices to a larger audience, as Valerie Kivelson argues in Russia, down to a lower level of reading–as the map served, both in Japan and elsewhere, multiple function to against the images of other states and other imaginative constructions.  Identical patterns of map-use can be found in these cultures, and, not surprisingly, in the post-WWII state of Israel, founded in part by European Jews:  in each place, maps affirm the state, the state affirms the map, summoning unity from . . . chaos.

The medium of the map and its power as a form of synthesis arises as a new form of narration when other forms of narrative do not suffice–it is both the master-narrative and originary myth of the modern state.  And, indeed, maps have become so powerful to bring objects into being in concrete terms, that it would be impossible to discuss otherwise in a multitude of ways–from the nation to the distribution of electoral politics to the spread of fires to the ozone hole to El Nino.


Footprints of Actively Burning Fires--Google Map

Ozone Loss Map


The credence that maps create by linking subjects of propositions to a specific code enables these new subjects to be discussed, and in linking subjects of propositions like the state to the code inherent in mapping, and to real relations in the world, maps can come to signify the world, and networks of causation within it, as well as prospective statements for its future.  As Wood wrote in an earlier context, “Insisting that something is there is a powerful way of insisting that something is.  Mapped things–no matter how conceptually daunting–possess such extraordinary credibility because they’re capable of propelling into popular discourse abstruse abstractions:  high-pressure cells, El Nino, seafloor spreading, thermohaline circulation.”  Or global warming, or the the expanding ozone hole, earthquake swarms, or the global threats of desertification of arable land.  These curious abstractions enter public debate as concrete terms, if never clearly grasped, based on their cartographical realization.  It is, of course, only because of maps that these very issues can become contentious foci of public debate.


Tracing Sandy--Time Map

Prognosticating hurricane_sandy_map


The map serves double-duty a representation or a cloak, Wood makes clear.  Its two-fold duties are so effective to make creative practices of map making disappear, to make states affirm their role as real things of nature–even as maps obscured their own existence in the reasons of the state itself.   And if it’s hard to imagine that these artifacts as nations or concepts like ozone could come into creation, without the creative functions of the map, the wonder of the map is to link subjects of proposition signified (State) with signifiers constituted by their code–and to signify the world.  This might explain their clear currency as a form of realizing the make-believe, or fantastic, with a sense of actual concreteness by delineating a credible topography with which we can visually interact–especially while reading a text, and in whose creation we can indeed vicariously share, so powerfully creative do they affect their readers.

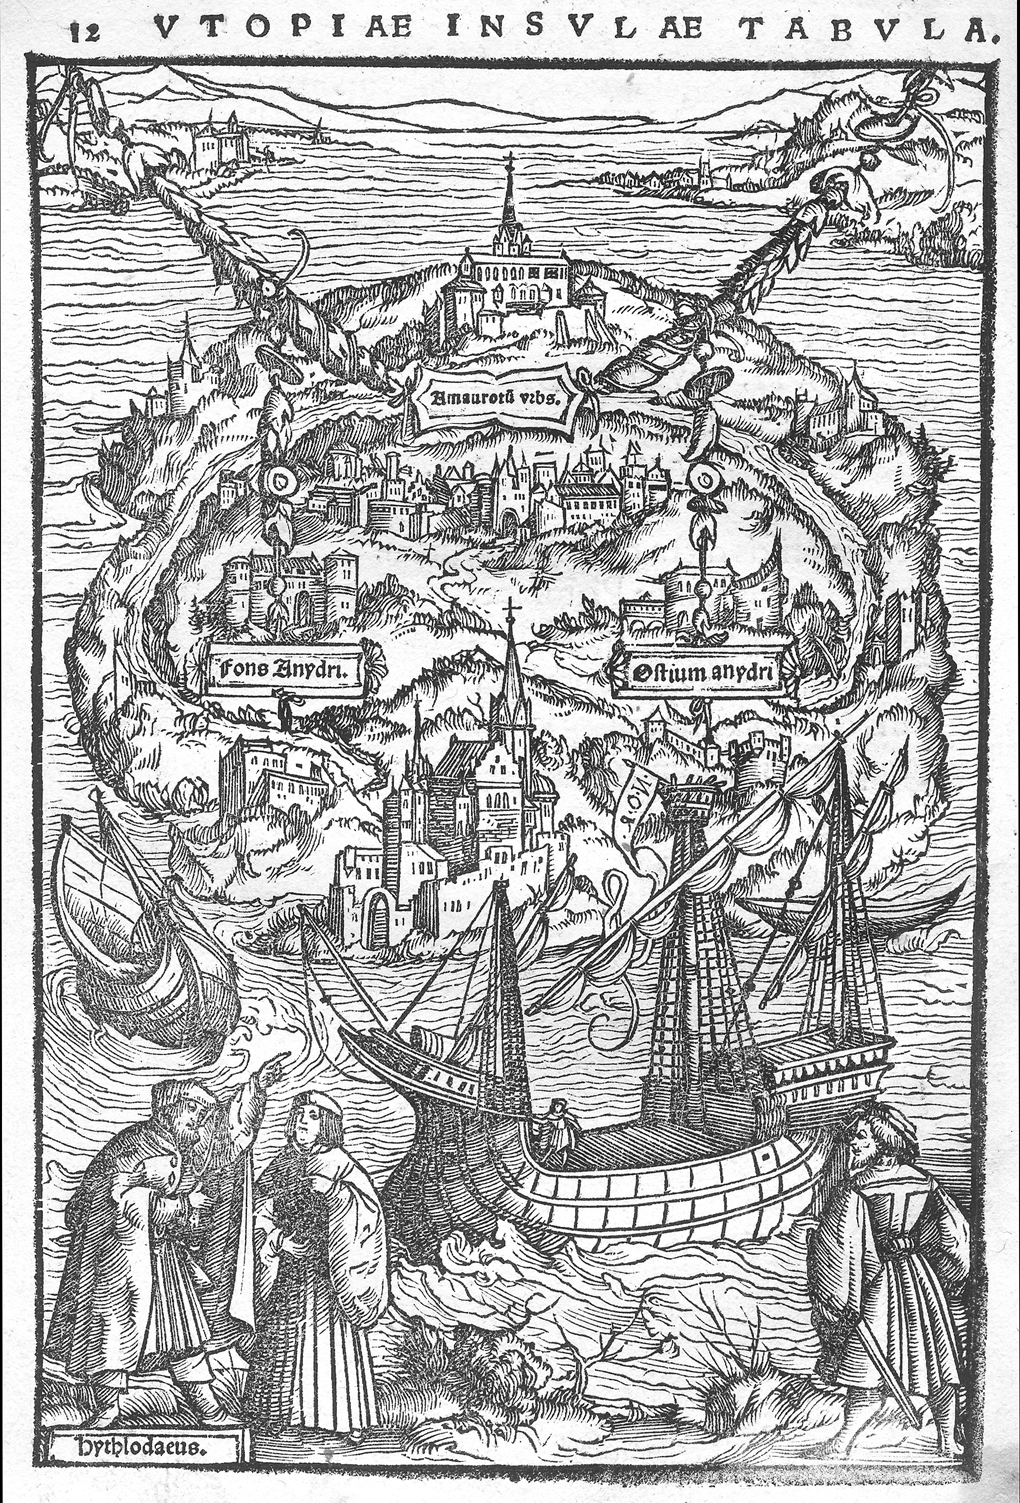
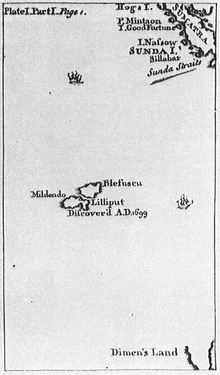
The use of maps to lend credence to propositions in the early modern world led them to embody abstractions from the map of “Utopia” Thomas More pointedly included in his dialogue of the same name, the maps of emotions Mme. de Scudery devised as Cartes de Tendre, or Jonathan Swift’s maps of Lilliput and Blefescu or Gunniland in his “proposal for correcting modern maps,” or–and here we leap centuries–modern ancestors such as Stevenson’s Treasure Island, whose fantastic claims to embodiment in maps extend all the way up to map of Middle Earth–and to those Christopher Tolkein subsequently expanded–whose publication and currency, he argued, led anyone with a computer software applications to make maps from Grand Theft Auto to map art, as map is congenial subject of exhibition.

More Utopia Map

220px-Moll_-_Map_of_Lilliput

Carte de Tendre

But are not these maps playful inversions of the operative roles of maps as tools of state–orchestrated by figures with close state roles, as More and Swift?  The role of middle-range cartographers from E.H. Shepherd to Christopher Tolkein to Jules Feiffer, to trace one genealogy, seems quite distinct.

phantom-tollbooth-map


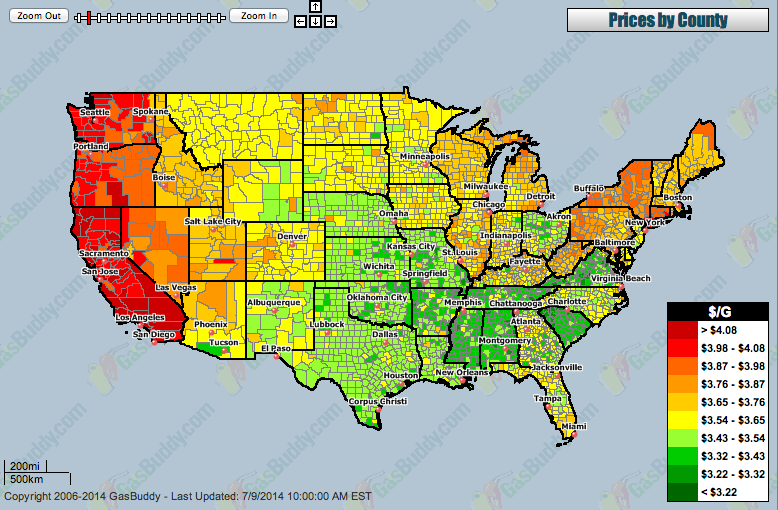
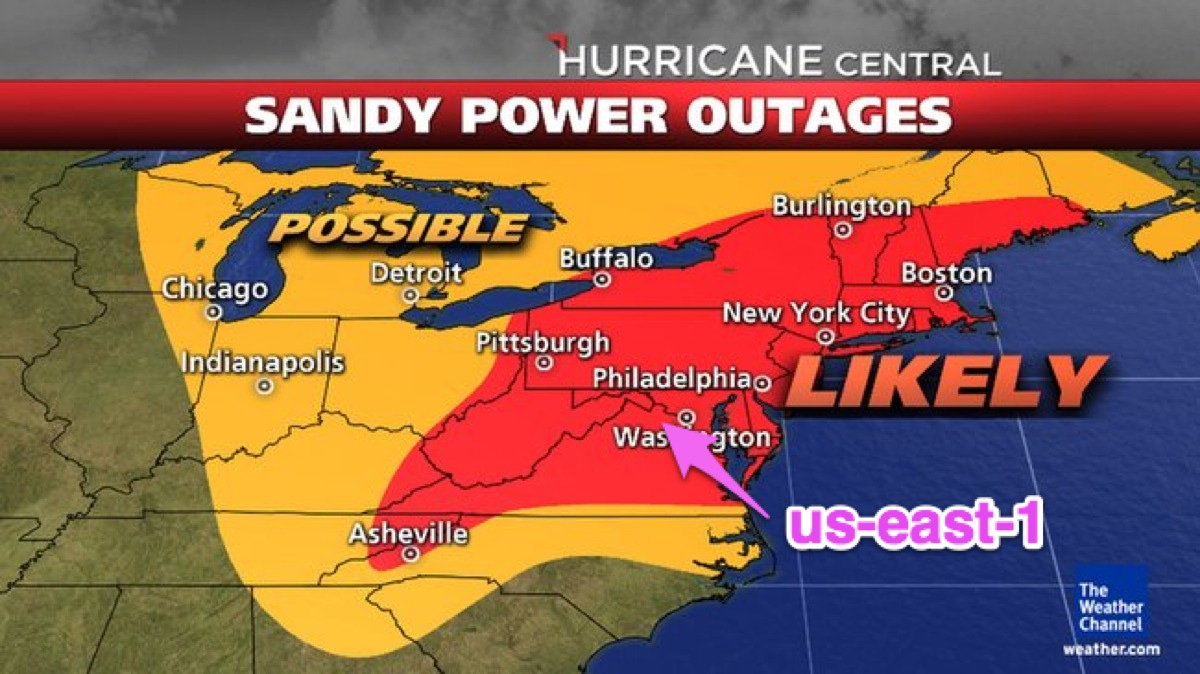
Is the state’s stranglehold on cartography at last weakening, much as Wood asserts, even with the diffusion of mapping platforms and the availability of digital mapping tools?  Wood detects a twilight of the age of the paper map as leading to an end of the dominant role that maps of states once enjoyed as vehicles to view boundaries and confines of state possession and areas of juridical control.  This does not mean that maps are less used by the state.  But that the map is less the gripping tool of engagement whose history he has traced since circa 1500, the magic date from which maps were, he argued, so instrumental in conjuring the subject of the state and so successful in naturalizing its truth claims as part of our world.  This may be curious, because of the proliferation of digitized maps that defines potentially unwieldy concepts–global warming; the ozone hole; hurricane Sandy’s path; plankton algae bloom distributions–that can be latched onto in public debate and, occasionally, grasped.  Or, on a humanitarian level, the sort of crowd-sourced map of deaths in Syria’s civil wars, legibly tracking a succinct geographic table of the distributions of killings, rapes, revenges, and poisonings or the humanitarian disasters of the Syrian refugees whose number has far surpassed two million.

Crowd-Sourced Mapping of killings, rapes, revenges and poisoning

Syriatracker

Syrian Refugee Crisis


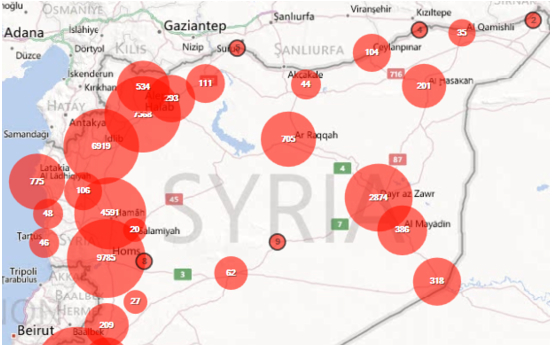
We can also distinguish better and worse attempts to map  tragic humanitarian disasters among these visualizations.

One may, indeed, ask what constitutes the state today–and try to map it–or try to define to the widespread distribution of mapping functions within states.  Wood presented the insanely rising prices of old maps sold at auctions today as making something of a mockery of the idea that states so monopolizes the use of maps that it cannot but illustrate state functions.  But are not these maps, now evacuated of meaning and illusions of power, disquietingly assuming a role, retrospectively, as images of a world where power worked differently, or of an age when the design of maps was performed with such due diligence and care?

But Wood is perhaps too happy to say goodbye to the map.  If this grammar is not that much less operative, is it true that the state’s stranglehold on cartography is now weakening or has weakened?  Or that cartography–and the illusion of the map–has outlived its function as a basis to visualize the nation?  Wood doesn’t find that the state can any longer repeat the trick of naturalizing its own presence through the operations of naturalizing with GIS tools, partly because of their lack of similar persuasive skills.  But if it may be argued that the state has no need for the same truth-claims any more, as they are, somehow, finding themselves to be outdated, that doesn’t mean that the collective power of mapping does not exist outside the purview of the state, and as an activity of resistance and calling into being new information, as several other papers delivered at the same conference by Annette Kim and Rebecca Solnit showed.

But although maps arose in needs of nation state to take on form, and organize its interests, rather than seeing some sort of triumphalism continuing in the use of maps to shore up the nation-state, from Raleigh, NC, Wood doesn’t see the map as doing that good a job even as a tool of surveillance.  And he sees the use of maps to call attention to historical practices, and even to restore historical landscapes, as well as address issues of social justice, as marginal to the disappearance of the map as a tool of state control.  The declining efficacy of the sort of operations that maps were able to accomplish, he notes, seem to have contributed–notwithstanding the omnipresence of maps in our lives–to its declining authority, more than a ‘democratization of mapping’ can be celebrated. But as the functions of state-power also seem to be less clearly visualized–and preserved–by means of maps in an increasingly interdependent world where the concept of the boundaries of a map have less meaning as fabricating a category or signifier out of whole cloth, perhaps the map would enjoy new versatility as a tool outside the rubric of the state that so long sponsored it.

If one can talk about a geohumanities that extends beyond those with digital expertise, who engage in studying and producing the culture, that would depend on understanding of ‘map making’ not only as a practice, but as a verb engages other contexts, and a verb that offers something like a grammar in conversation that is specific to the map as an object, distinct from other accumulations of evidence, as well as appreciating the role of mapping as an art.  If in an age of such widespread collations and ordering of evidence, the paper map–and the official map–is somehow rendered obsolete, even as multiple maps continue to wage authority in ordering our lives.  But the ubiquity of Google Maps can be resisted, if only by making its origins better known, and its the limits of its practices evident.  To be seduced by their objectivity is surely to ignore the continued power that maps still have.  If maps continue to offer such a pleasurable area of exploration in Grand Theft Auto and other media, it seems likely that personal meanings maps afford provide not just diversions in the esthetics of map making, but appropriations of an all too familiar authoritative form to define boundaries of inclusion and exclusion, trace networks of meaning, and give stability to collective entities, even in the age of the slippy maps fabricated by Google that convert declassified satellite photographs to easily downloadable tiles.

Wood’s prognostication of the death of the map seems premature.  Perhaps we, as consumers of digitized information, pay attention to its grounding in geographic reality and its operations, and are also less susceptible to the sequestered codes contained within maps, or the truth claims of a single map’s persuasive form.   Perhaps the map’s near-ubiquity cannot but decrease its authority.  But we do seem to stand at the brink of a future where mapping is ever-present as a form of surveillance; perhaps a society in which power has learned to work in new ways, unmoored from maps to define power and realize or recognize its bounds, but has adopted mapping forms as dispersive ways to organize power claims.  But in this society, maps can gain new power as media to realize networks of which too few seem aware.

Wood suggests that the map is dead, perhaps, as a useful tool of conversion in the arena of state.  If the act of mapping seems less clearly situated in the arena of the state, or less dominated by the state, this does not mean that maps are media that don’t still mystify relations of power.  And if the leaks of Edward Snowden have shown that the state is surveilling us to a far greater extent than ever imagined was the case, Wood found little evidence that that has made so much of a difference, or that that helps states do much of a better job.  The query cannot but arise in response:  did the map ever do that much of a functional job, or only a basis for imagining a state that performed its functions well?  Long live the map, perhaps as a form of counter-mapping.

Leave a comment

Filed under Google Maps, infographics, mapping state interests, maps and state formation, newsmaps