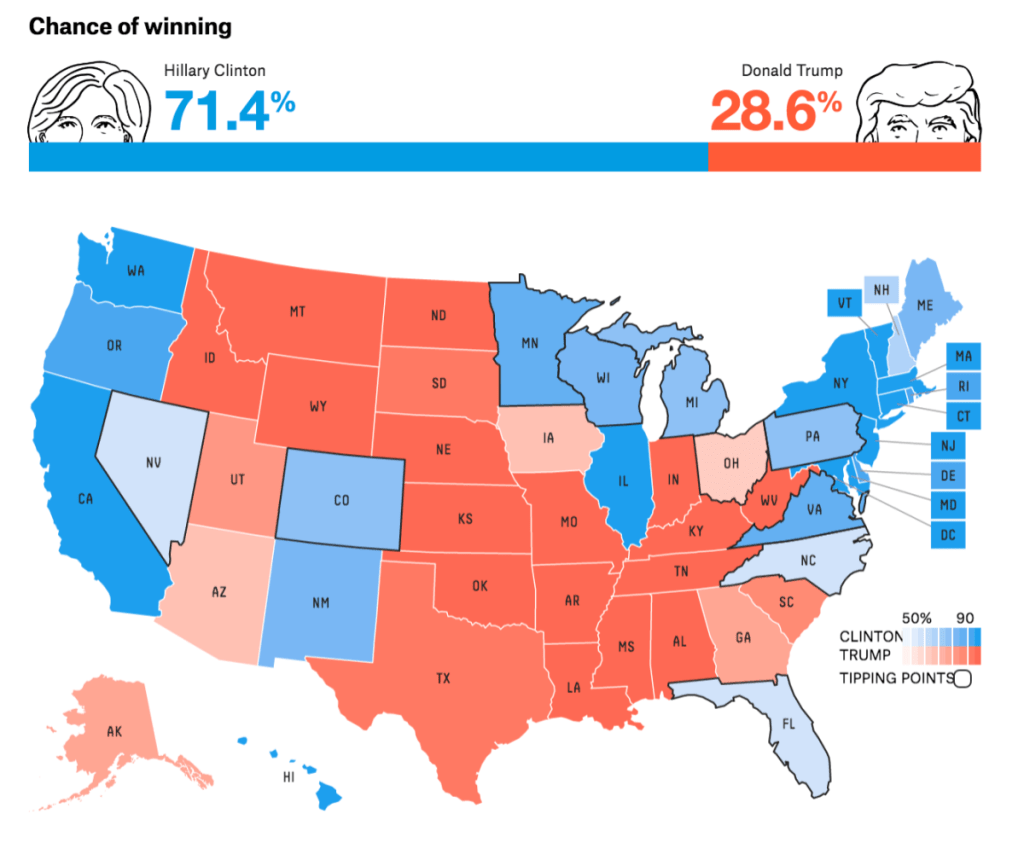
The entry of the data visualizations into the pitched narrative of the Presidential election is not new. If thought to begin in the collective unfolding of the election-night drama on television screens, as the casting of ballots long understood as a collective action of union has prompted a narrative of division, CNN offers a new model to personally intervene on one’s iPhone or android, as if to offer the means to ramp up agency on social media, inviting users to tap on one’s personal screen to build-your-own electoral map, perhaps to assuage one’s heightened anxiety, granting the illusion to allow yourself for entering your own alternative future. Echoing the algorithmic thinking of tallying “pathways to victory” we’d been following to exist the Trump Era with increased desperation, courtesy FiveThirtyEight and others, we imagined scenarios of the electoral constellation that might prepare for the dawning of something like a new age. As different campaigns used maps to assert “multiple pathways to victory,” the statistical likelihood of a victory seemed to suspend agency, in ways that would come to haunt the nation, in the aftermath of the election, as the tally of the vote was questioned in multiple ways, undermining the accuracy of the tally of individual votes, and injecting a degree of suspicion deeply dangerous to democracy–but elevated in the name of ‘transparency.’
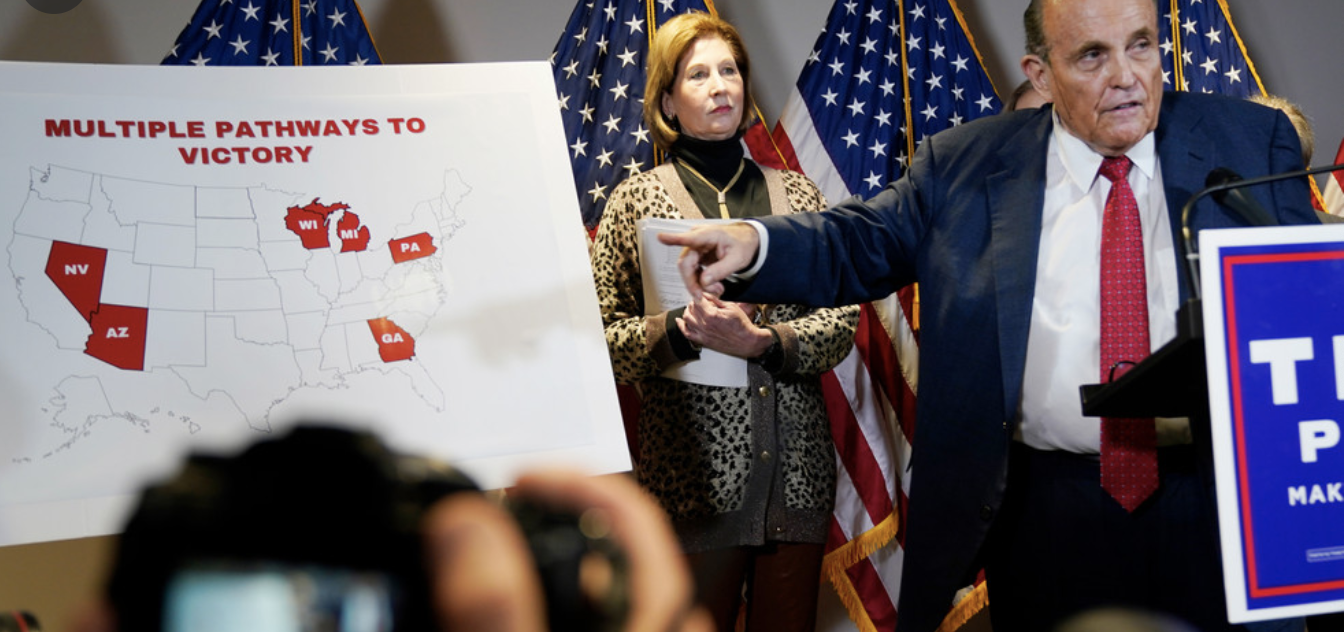
The standard map of the United States became a model for the President’s personal lawyer to present “evidence” by appealing the vote, long after the votes were tabulated, and winner declared, in a new form of aftermath for an election we had never experienced. If the security of paper ballots were put into question by the question of “hanging chads” that demanded hand counts with observers back in 2000, a weeks-long battle that suspended any announcement of a victor in a divided nation, that demanded “optical evidence” of the will of voters, by scrutinizing some 537 votes out of the entire nation in order to determine the victor of the electoral college, and forestall the celebrations of Democrats over the nation who expected that victory was at hand, the aftermath became distilled in 2020 to the contestation of an electoral map, the map that had come to mediate the election, as the President’s lawyer, looking like Frankenstein, returned from the dead, declared the continued existence of “multiple pathways to victory”–the very phrase that Joseph R. Biden’s circle had announced in predicting his victory.
The “post-truth” announcement was not only post-truth, but a dumbed down version of voting before multiple American flags, presenting the states that the map labeled “red” that had voted for Biden to be at basis “red states,” and inevitably destined to fall into President Trump’s column. The news conference that was presented at Republican National Committee headquarters on November, 19, almost three weeks after the election was held, seemed to reclaim states’ electors as if they were enemy territory, as Trump’s legal team insisted that a spate of “irregularities in the voting system” had created numerous bases for serious fraudulence in tallies of the voting process.
November 19, 2020/AP/Jacquelyne Martin
The made-for-TV moment that was designed to circulate online as an iconic image crystallized the post-truth debates about the actual results of the election–a basis for the myth of a “stolen victory” that would continue until the tragically violent insurrectionary invasion of the U.S. Capitol building on January 6, 2021, a readily recognized power play of seizing the electoral map from the networks, denying the role of the media or television networks from making a prediction or declaring the victor, and deciding to gesture to the selective distortion of the electoral map as if it was evidence of the true “map” of the election, as the image of five “battleground” electoral states that the Trump campaign was announcing were the basis of its campaign to Keep America Great or Make It Great Again focussed, in a new use of Cold War rhetoric, on removing “outrageous iron curtain of censorship.”
November 19, 2020
The results of the Presidential election in these states were not particularly close, and did not recall the nail-biter of 2000, twenty years ago, when the inspection of paper ballots by impartial judges provided an unplanned basis for showcasing the legal efforts of moving the election to the United States Supreme Court as a final authoritative arbiter of electoral results.
But if votes in either Michigan or Pennsylvania were hard to say were not conclusive, without either a legal theory or strategy to discard the existing tallies of the election, without disenfranchising hundreds of thousands, the post-truth campaign posited a systematic lack of vigilance of Democrats to play rough and tumble with registered voters and enshrined voting practices, arguing that the norms of voting practices were so systematically violated both in the voting machines themselves, especially paperless touch-screen voting machines that were argued to be open to manipulation, as well as the farming of ballots, and unreliability of mail-in voting practices.
The proliferating basis of instability for the tabulation of votes–the foundation of the democratic process–was argued to be inherently imperfect and corrupted at its root, suggesting the election was stolen. The argument that a small Texas company had made–“Allied Security Operations Group”–posited all software used in Smartmatic voting machines demonized as designed by a corporation with ties to Venezuelan founders: the basis among staunchly conservative activists to push a sense of widespread voting fraud–perpetuated on Newsmax in Dominion voting machines–was launched not by experts, but a myth of fraudulenceWashington Post has tied to Texas businessman Russell J. Ramsland, Jr., Trump advocates would adopt to discredit the outcomes of voting tallies already tabulated in battleground states.
The story of deep skepticism about the outcome of the election was in many ways nourished by the relative indeterminacy of possible outcomes for 2020, all of them hinging on battleground states that would push the electoral college one way or another. If the process seemed to remove the voting systems from the voters, the unfounded conspiracy theory Ramsland endorsed and boosted trotted out the shaky foundations of democratic institutions with readiness to defend the outcome they sought–and seemed to find consolation in an iconic map that painted these “swing” states a uniform red.
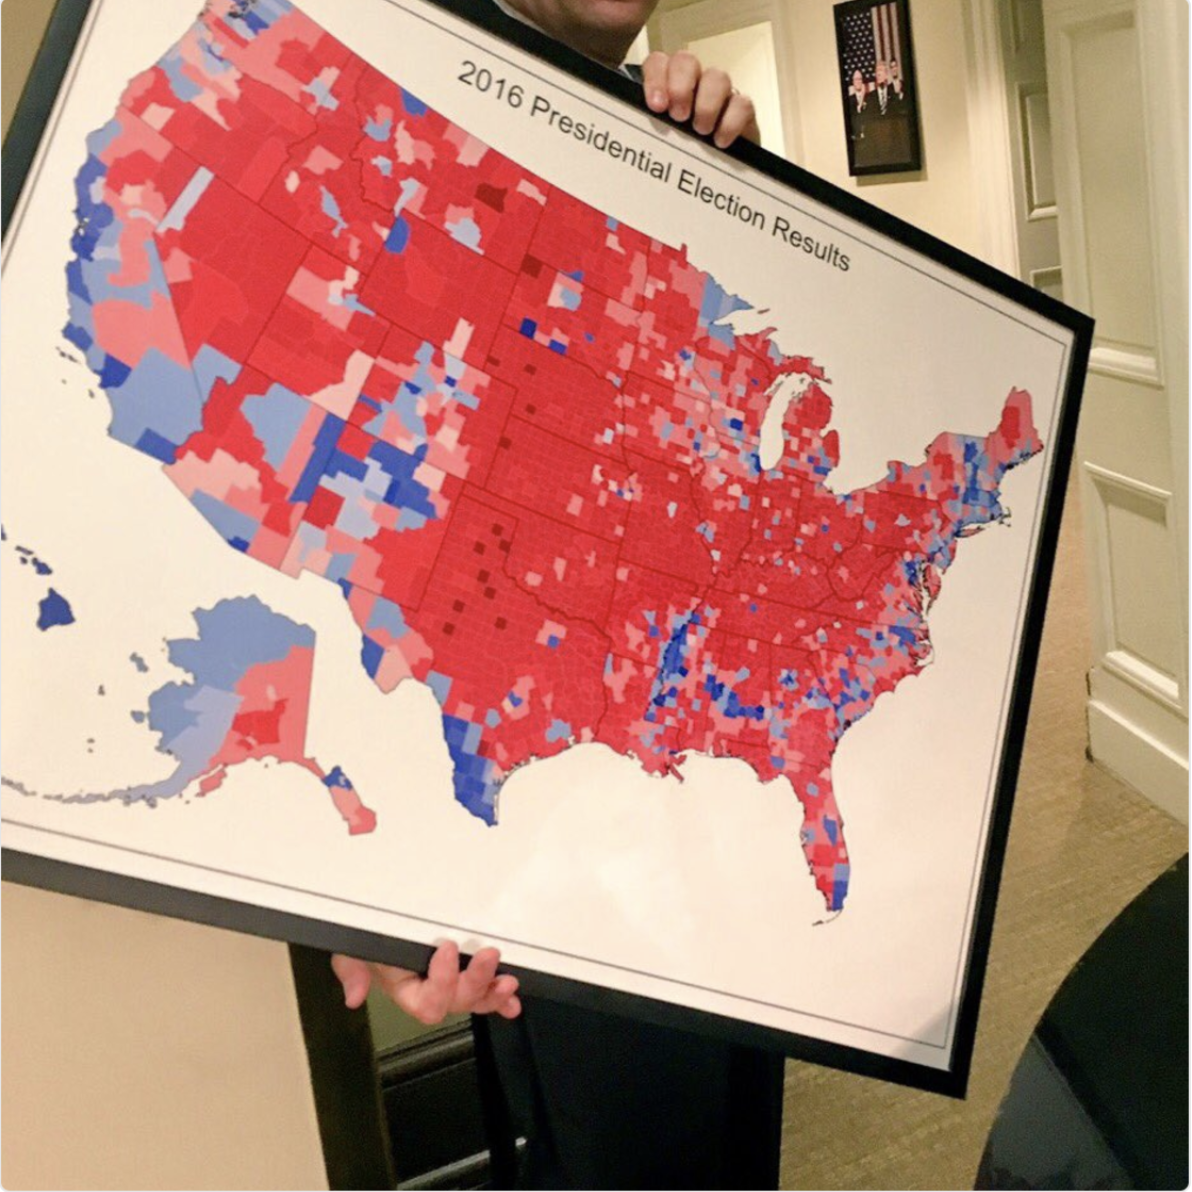
The fetishization of these deeply unstable and diverse states as uniformly “red”–and red as the identity that must be defended against the misinterpretation of magically “reassigned” surplus votes, performed by software in offshore databases run by multinationals, suggested the danger of diminishing the “red map” that Republicans have long dedicated themselves to enshrine–a map that has become so iconic since the 2016 Presidential election to seem like destiny to enter the once-hallowed walls of the West Wing of the White House among other furnishings quite early in the Trump Presidency–
–as if to preserve that magic moment of Election night that was such a surprise on national TV, even if, as has been widely observed far, far beyond this blog, and since Trey Yingst tweeted the image back in May, 2017, the choropleth is far from suited to represent popular consensus or the massive adulation he craves, as it erased the actual presence of voters, in favor of a snazzy graphic, made to shock for TV.
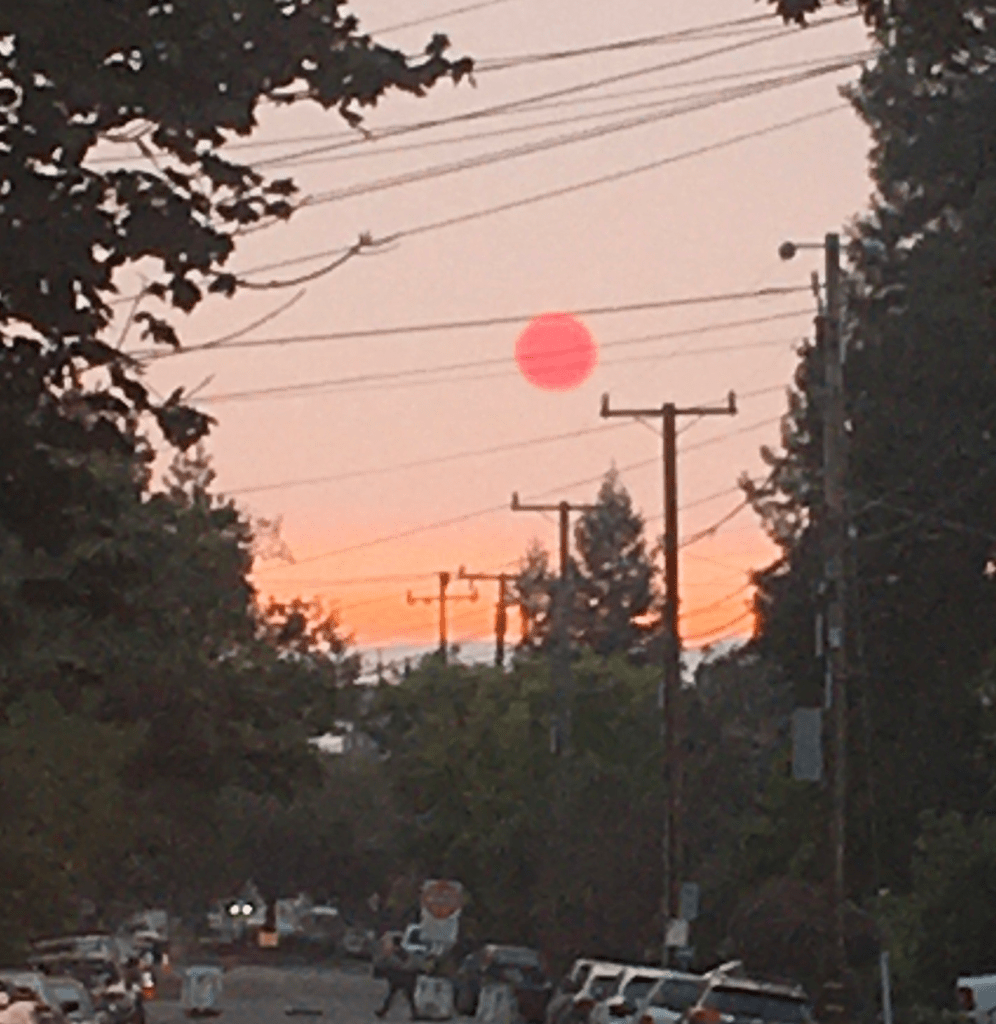
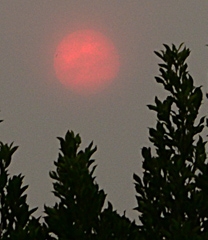
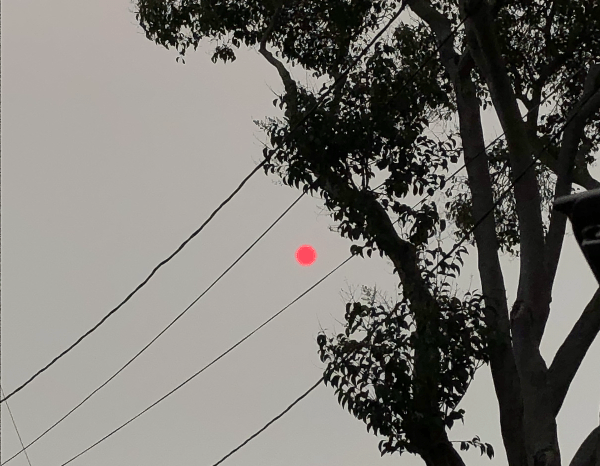
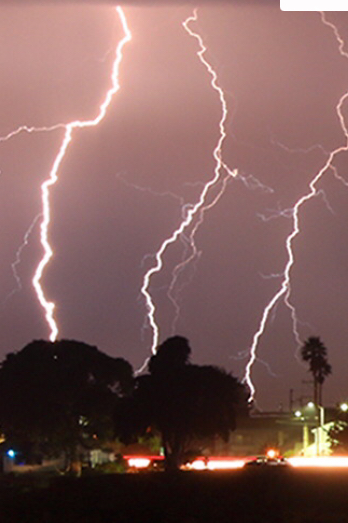
The tracking of local air quality this Fire Season both documents the atmospheric effects of a fire siege of 2020 and provides an eerily contemporaneous way to track the spread of particulate matter from clusters of fires across the western seaboard to be ignited at the end of a long, dry summer in late August. We were not really struck unawares by the dry lightning, but had left forests languishing, not beneath electricity lines–as last year, around this time–but under a hot sun, and high temperatures that we hardly registered as changing the ecosystem and forest floor. This year, the sun turning red like a traffic light in the middle of the afternoon, we were forced to assess the air quality as the blue sky was filled with black carbon plumes that left a grittiness in our eyes as well as in the skies.
October 1, 2020
Confronted with a red sun through pyrocumulus haze, we followed real-time surveys of air quality with renewed attentiveness as an orange pyrocumulus clouds blanketed usually blue skies of the Bay Area, obscuring the sun’s light, suffusing the atmosphere with a weirdly apocalyptic muted light, that were hardly only incidental casualties of the raging fires that destroyed houses, property, and natural habitat–for they revealed the lack of sustainability of our warming global environment.
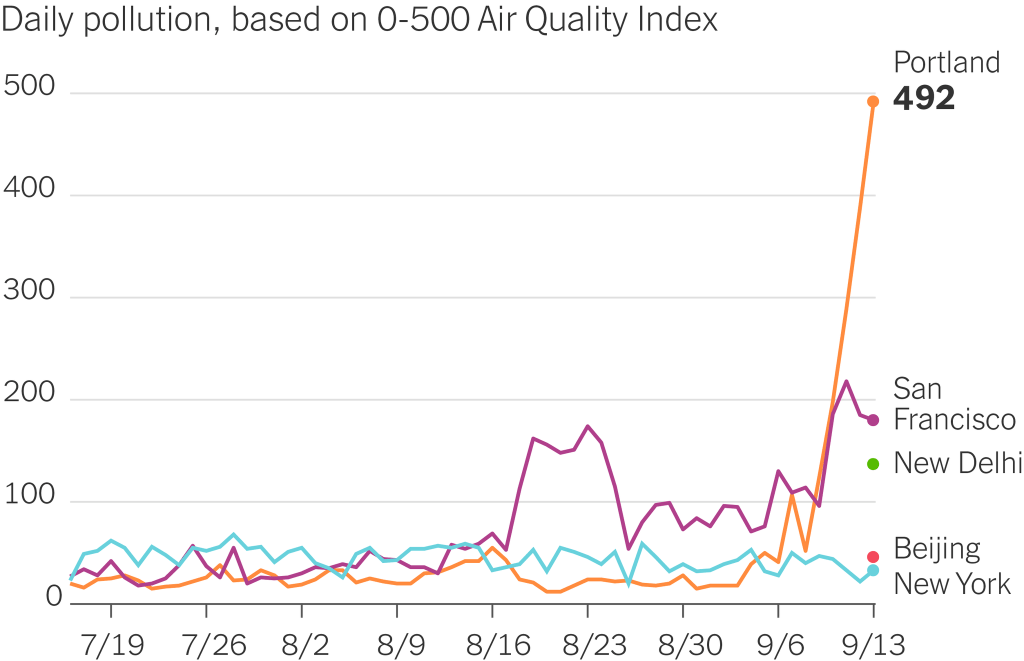
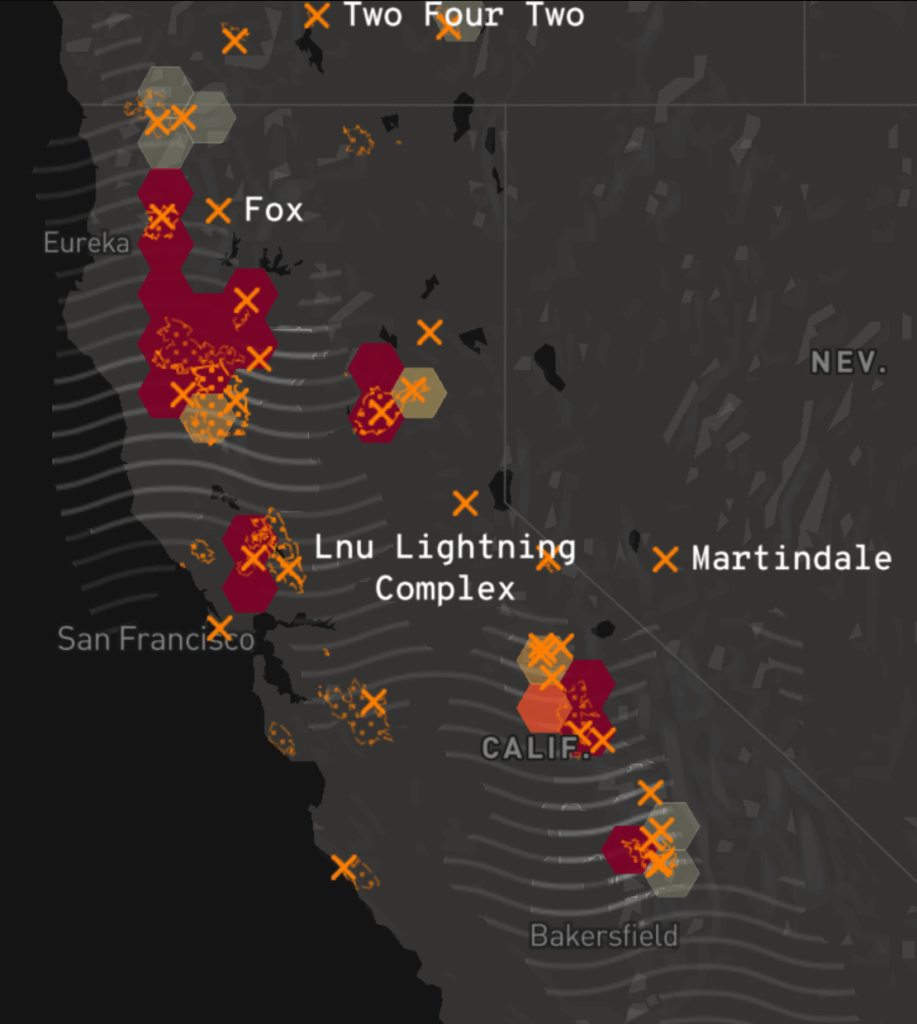
The soot and fog that permeated “clean cities” like Portland and San Francisco came as a sudden spike in relation to the black carbon loads that rose in plumes from the fires, as if the payload of the first bombs set by climate change. The shifting demand for information that evolved as we sought better bearings in the new maps of fires that had become a clearly undeniably part of our landscape was reflected in the skill with which the sites of incidence of dry lighting strikes that hit dried out brush and forest floors, the growing perimiters of fires and evacuation zones across the west coast, and the plumes of atmospheric smoke of black carbon that would leave a permanent trace upon the land, liked to the after-effects of holocausts created by atom bombs by Mike Davis. The measurement of wind carrying airborne smoke emerged as a layer of meaning we were beginning to grasp, a ghostly after-effects of the fields of flams that began from sites of lightning hitting the earth in a Mapbox wildfire map of fields of fire across the states, radiating resonant waves akin to earthquake aftershocks, a lamination on hex bins of the fires that seemed a new aspect indicating their presence in the anthropocene.
The suitably charcoal grey base-map of the state integrates approximate origins of fires, fire spread and greatest intensity of hotspots from satellite imagery courtesy Descartes Labs and NOAA, and air pollution data integrates the fires’ spread across our picture of the state. While human reviewed and sourced, the satellite data embodies the ravages of fire across the state in ways echoed by its black charcoal base map, and reflects the need to develop new visual tools to process their devastation.
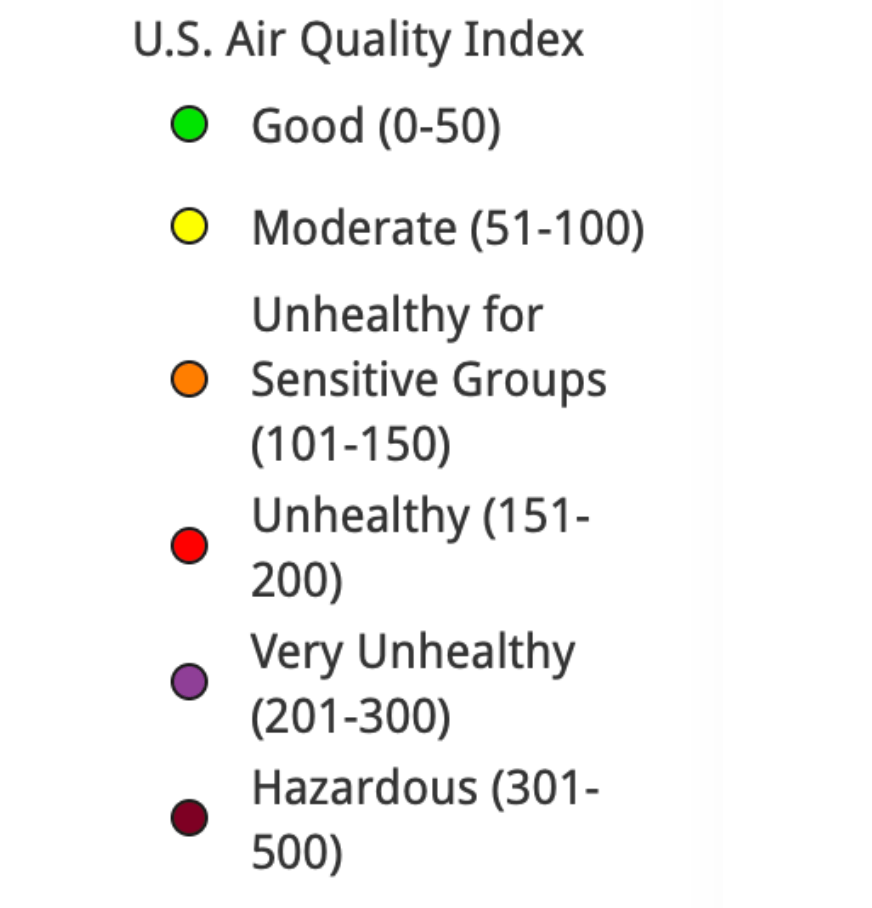
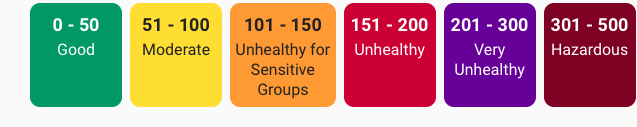
While we began to measure air quality to meet new needs to track ground-level ozone, acid rain, air toxins, and ozone depletion at an atmospheric level, the increased tracking of more common air pollutants since 1990 included airborne particulate matter (PM10 and PM2.5), carbon monoxide (CO), and ozone (O3), we track the effects of wildfire smoke by hourly levels of each at local points, parlaying sensors into newsfeeds as wildfires rage. If stocked with labels of each chromatic layer, are these real-time updates lacking not only legends–but the temporal graph that would clarify the shifting data feeds that lead us to give them the illusion of purchase on the lay of the land we are trying to acknowledge this fire season?
Berekeley, CA October 1, 2020/Clara Brownstein
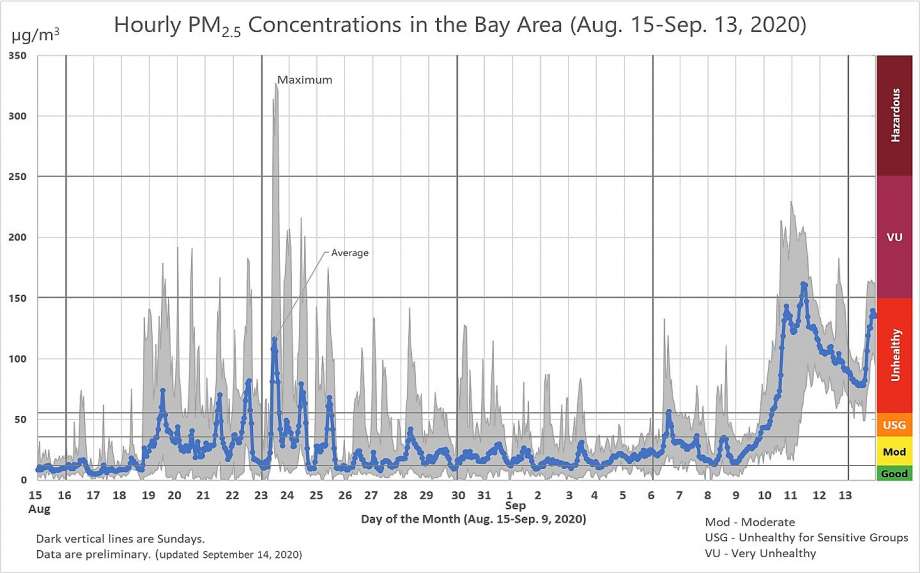
Watching slightly more long-term shifts in quality of air that we breath in the Bay Area, we can see striking spikes of a maximum just after the lighting siege began on August 19, 2020 across much of the state, as air quality decisively entered into a hazardous zone, tracking PPM2.5 concentrations, but entering the worst fifteen air days since registration four times since 1999, when Bay Area Air Quality Management District began reporting the levels of fire smoke in inhabited areas.
Particulate Matter (PM 2.5) Concentrations in Bay Area, August 15-Septmeber 13, 2020/ Bay Area Air Quality Management District
We measure fires by acreage, but the sudden spikes of air quality, while not exceeding the smoke that funneled into the Bay Area during the North Bay Fires in 2017, when the Tubbs and Atlas Fires devastated much of the Wine Country, created a run of high-smoke days, were followed by a set of sudden spikes of the atmospheric presence of particulate matter that we tried to track by isochomes, based on real-time sensor reading, but that emerge in better clarity only in retrospect.
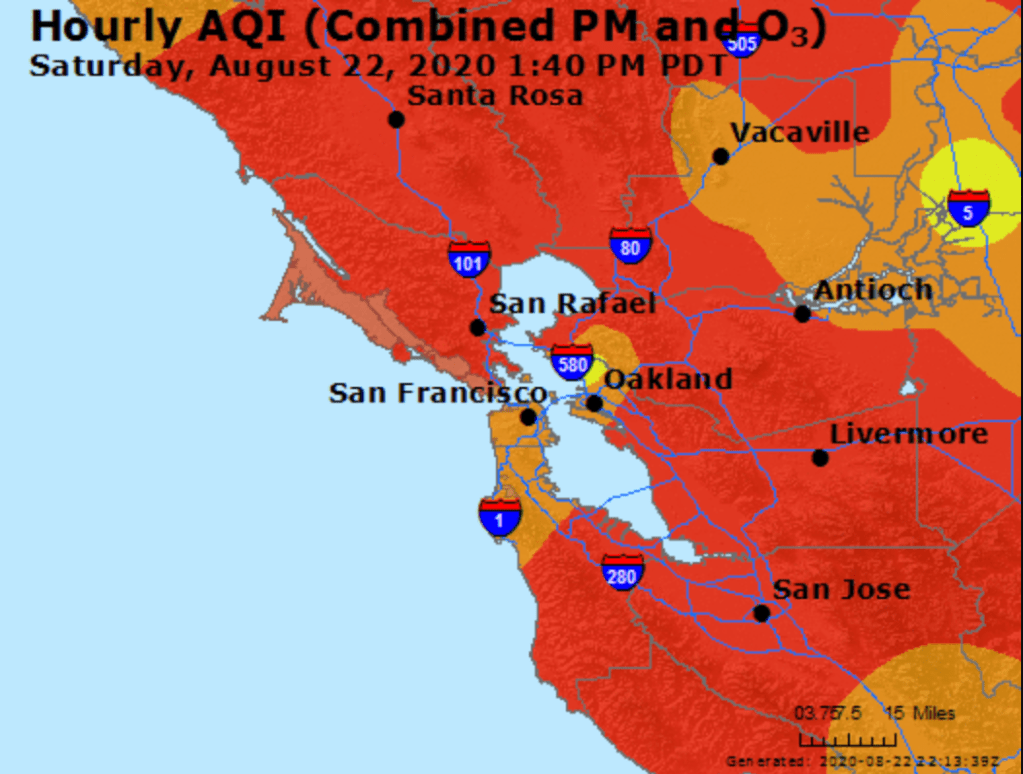
It is true that while the AQI maps that offer snapshots of crisp clarity of unhealthy air might serve as an alarm to close windows, remain indoors, and call off school–
AirNow AQI map in Bay Area after Lightning Fires, August 22, 2020
–as particulate matter spread across the region’s atmosphere. We are used to weather maps and microclimates in the Bay Area, but the real-time map of particulate matter, we immediately feared, did not only describe a condition that would quickly change but marked the start of a fire season.
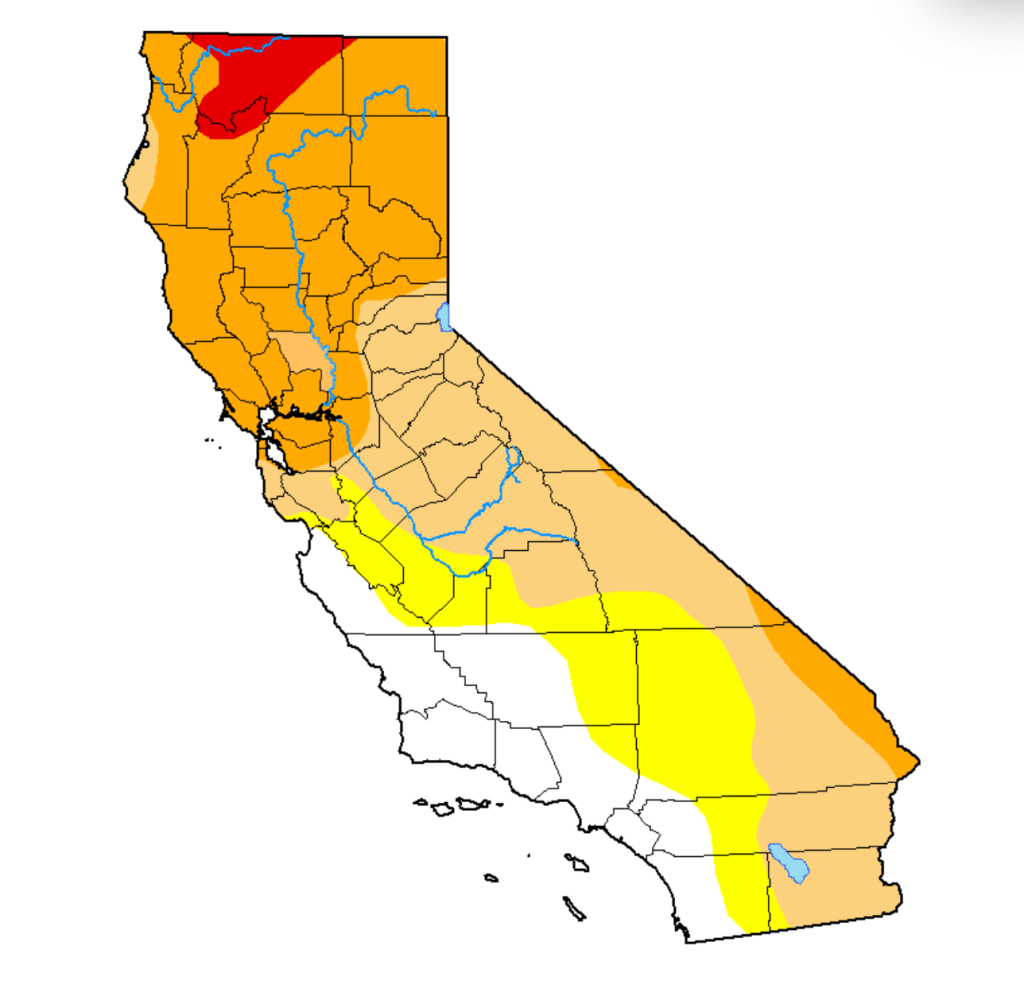
Not only in recent days did the sustained levels of bad air suggest an apocalyptic layer that blanketed out the sun and sky, that made one feel like one was indeed living on another planet where the sun was masked–a sense heightened by the red suns, piercing through grey smoke-cover that had seamlessly combined with fog. Although the new landscapes of these AQI maps generate immediate existential panic, we should be more panicked that while we call these fires wild, they release unprecedented levels of toxins once imagined to be detected as industrial pollutants. The seemingly sudden ways that black carbon soot blanketed the Bay Area, resting on our car hoods, porches, windowsills and garbage bins were not only an instant record of climate emergency, but the recoil of overly dry woods, parched forests and lands as overdue payback for a far drier than normal winter, months and a contracted rainy season that had long ago pushed the entire state into record territory. The lack of soil moisture has brought a huge increase of wildfire risk, not easily following the maps of previous fire history, and persistence of “abnormally dry” conditions across a third of California, focussed in the Sierra and Central Valley–the areas whose forests’ fuel loads arrive carbonized in particulate form.
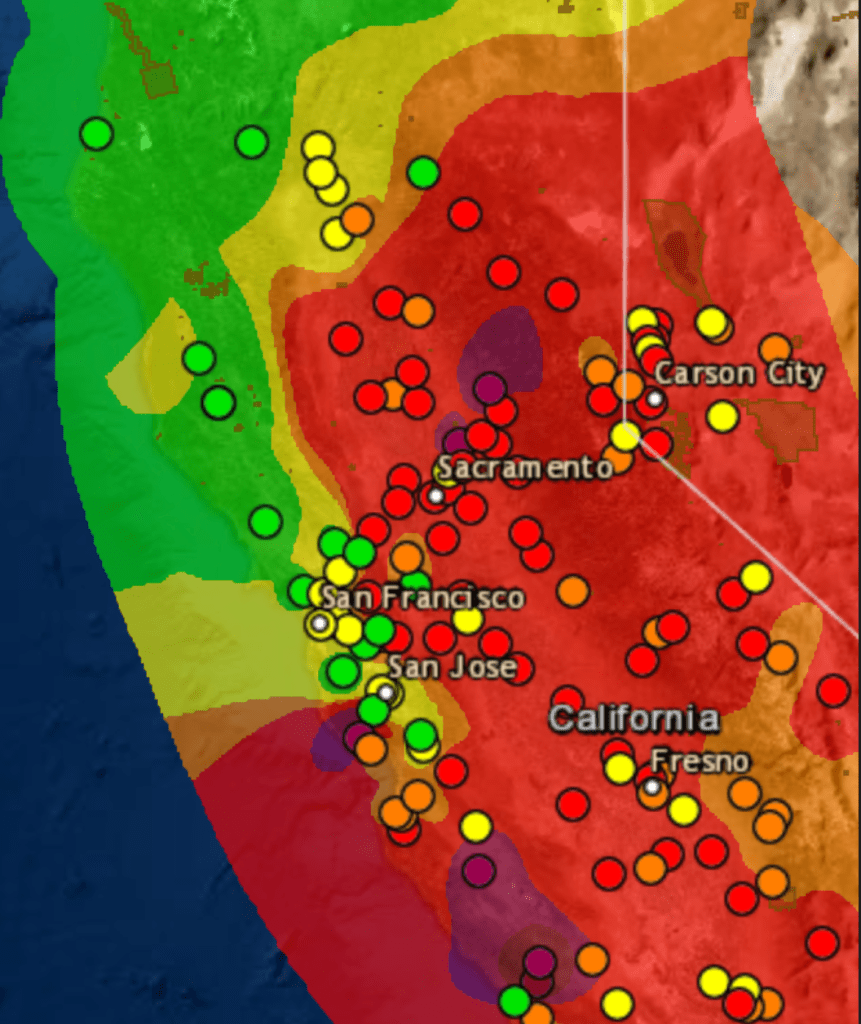
Local monitors of air quality suggest the uneven nature of these actual isochromes as maps–they are reconstructions of what can only be sensed locally, and does not exist in any tangible way we can perceive–but presented what we needed to see in a tiler that made differences popped, highlighting what mattered, in ways that left cities fall into the bottom of the new colors that blanketed the state, in which local sensors somehow revealed what really mattered on August 20: if the “map” is only a snapshot of one moment, it showed the state awash in ozone and PPM.
AirNow/August 20, 2020Air Quality Index
We were in a sort of existential unfolding in relation to these maps, even if we could also read them as reminders of what might be called “deep history”: deep history was introduced by Annalistes to trace climatic shifts, the deep “undersea” shifts of time, on which events lie as flotsam, moved by their deep currents that ripple across the economy in agrarian societies, suggesting changes from which modern society is in some sense free. “Deep History” has to some extent been reborn via neurosciences, as a history of the evolution of the mind, and of cognition, in a sort of master-narrative of the changes of human cognition and perception that makes much else seem epiphenomenal. If the below real-time map was time-stamped, it suggested a deep history of climate of a more specific variety: it was a map of one moment, but was perched atop a year of parched forests, lack of groundwater, and increased surface temperatures across the west: Sacramento had not received rain since February in an extremely dry winter; its inter was 46% drier than normal, and the winder in Fresno was 45% dryer in February. They are, in other words, both real-time and deep maps, and demand that we toggle between these maps as the true “layers” of ecological map on which we might gain purchase.
The levels of dessication of course didn’t follow clear boundaries we trace on maps. But at some existential level, these flows of particulate matter were not only snapshots but presented the culmination and confirmation of deep trends. We have to grasp these trends, to position ourselves in an adequate relation to their content. For the deep picture was grim: most of California had enjoyed barely half of usual precipitation levels after a very dry winter: Sacramento has had barely half of usual rainfall as of August 20 (51%); the Bay Area. 51%; parts of the Sierra, just 24%. And wen we measure smoke, we see the consequences of persistent aridity.
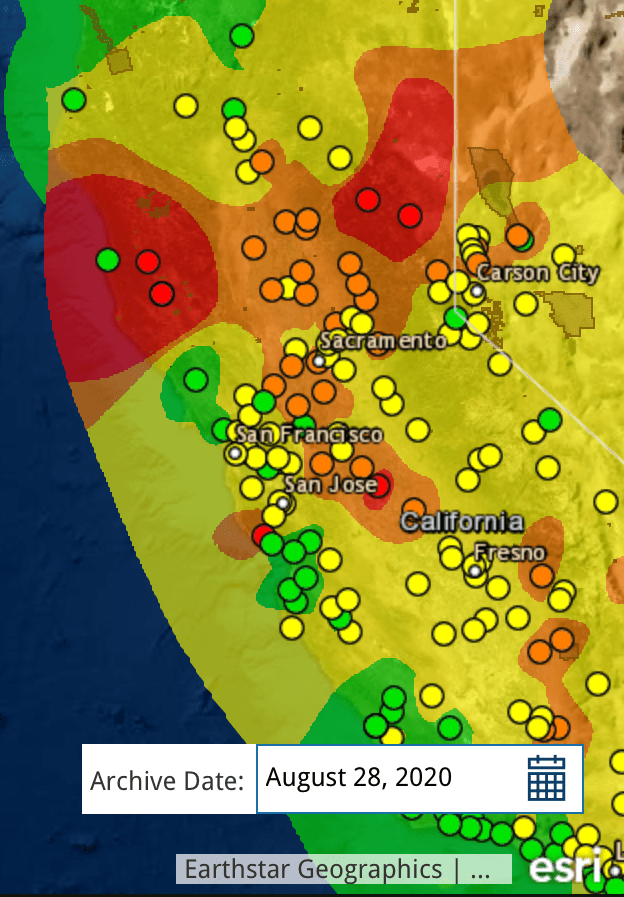
August 28, 2020/AirNowAir Quality Index
These are the layers, however, that the maps should make visible, And while these shifts of particulate matter that arrived in the Bay Area were invisible to most, they were not imperceivable; however, the waves of smoke that arrived with a local visibility that almost blanketed out the sun. Perhaps there was greater tolerance earlier, tantamount to an ecclipse. Perhaps that seemed almost a breaking point.
For almost a month after the first fires broke, following a sequence of bad air days and spare-the-air alerts marked our collective entrance to a new era of climate and fire seasons, fine soot blanketed the state at hazardous levels, leaving the sense there was nowhere left to go to escape.
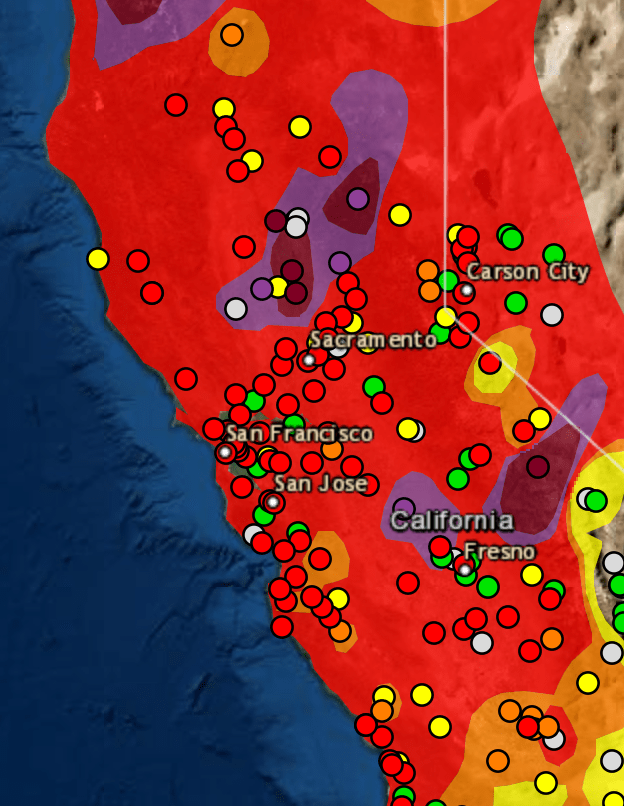
September 13, 2020Air Quality Index
We had of course entered the “Very Unhealthy” zone. If real-time maps condense an immense amount of information, the snapshot like fashion in which they synthesized local readings are somewhat hard to process, unless one reads them with something like a circumscribed objective historical perspective that the levels of PPM5 provides. In maps that are data maps, and not land maps, we need a new legend, as it were, an explanation of the data that is being tracked, lest it be overwhelmed in colors, and muddy the issues, and also a table that will put information on the table, lest the map layers be reduced to eye candy of shock value, and we are left to struggle with the inability to process the new scale of fires, so unprecedented and so different from the past, as we try to gain bearings on our relation to them.
Of course, the real-time manner that we consume the “news” today
militates against that, with feeds dominating over context, and fire maps resembling increasingly weather maps, as if to suggest we all have the skills to read them and they present the most pressing reality of the moment. But while weather maps suggest a record of the present, these are not only of the current moment that they register. Looking at them with regularity, one feels the loss of a lack of incorporating the data trends they depict, and that are really the basis of the point-based maps that we are processed for us to meet the demand for information at the moment, we are stunned at the images’ commanding power of attention to make us look at their fluid bounds, but leave us at sea in regards to our relation to what is traced by the contour lines of those isochrones.
Bay Area Air Quality Management, PM2.5 Concentrations, August 15-September 13, 2020
We can, in the Bay Area, finally breathe. But the larger point re: data visualizations is, perhaps, a symptom of our inflow of newsfeeds, and lies in those very tracking maps–and apps–that focus on foregrounding trends, and does so to the exclusion of deeper trends that underly them, and that–despite all our knowledge otherwise–threatens to take our eyes off of them. When the FOX newscaster Tucker Carlson cunningly elided the spread of wild fires ties to macro-process of climate change, calling them “liberal talking points,” separate from climate change, resonating with recent calls for social justice movements to end systematic racism in the country: although “you can’t see it, but rest assured, its everywhere, it’s deadly. . . . and it’s your fault,” in which climate change morphed to but a “partisan talking point” as akin to “systematic racism in the sky.”
While the deep nature of the underlying mechanics by which climate change has prepared for a drier and more combustable terrain in California is hard to map onto to the spread of fires on satellite maps, When climate denialism is twinned with calls for reparations of social injustice or gun control as self-serving narratives to pursue agendas of greater governmental controls to circumscribe liberties, befitting a rant of nationalist rage: the explanations on “our” lifestyles and increased carbon emissions, only pretenses to restrict choices we are entitled to make, Carlson was right about the depths at which both climate change and systematic racism offer liberal “lies”–especially if we squint at tracking maps at a remove from deep histories, and cast them as concealing sinister political interests and agendas, the truly dark forces of the sinister aims of governmental over-reach in local affairs.
“Structural racism” is indeed akin to the deep structure of climate change if the cunning analogy Tucker Carlson powerfully crafted for viewers did not capture the extent of their similarities. For if both manifest deep casualties created by our society, both depart from normalcy and both stand to hurt the very whites who see them as most offensive. The extent of inequalities of systematic racism as present in our day-to-day life as is the drying out landscape. And the scope of climate change is able to be most clearly registered by the evident in trends of diminished precipitation, groundwater reserves or temperature change that create environmental inequalities, too often obscured by the events of local air quality or maps of social protests that respond to deep lying trends.
To be sure, the tracking of environmental pollutants underlay the national Pollution Prevention Act of 1990, and led to a number of executive orders that were aimed to set standards for environmental justice among minority communities who long bore the brunt of industrial pollutants, from lead paint to polluted waters to hazardous waste incinerators. And, as we are surrounded by racial inequalities that are visible in systematic inequalities before the law, and have lowered life expectancies of non-whites in America by 3.5 years, increasing rates of hypertension, cancer, and systematic disenfranchisement of blacks–these extensive inequalities hurt whites, and hurt society. As Ibrahim X. Kendi perceptively noted, White Supremacists affirm the very policies that benefit racist policies even when they undercut interests of White people; they “claim to be pro-White but refuse to acknowledge that climate change is having a disastrous impact on the earth White people inhabit.” Is there a degree of self-hatred that among Carlson’s viewers that informs Carlson’s frontal attack on climate change and structural racism as myths, more content to blame non-Whites for structural inequalities.
But these inequalities are evident in the differences in air quality that climate change creates. For if the AQI maps tell us anything, it is the absence of any preparedness for the interconnections of fire, smoke, and large dry stretches of a long story of low precipitation that have created abnormally dry conditions–indeed, drought–across the state.
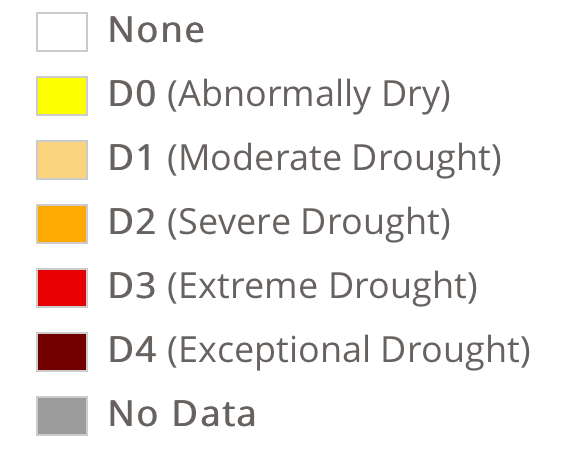
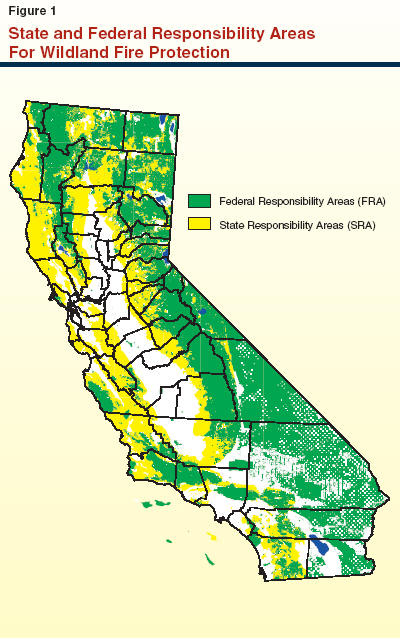
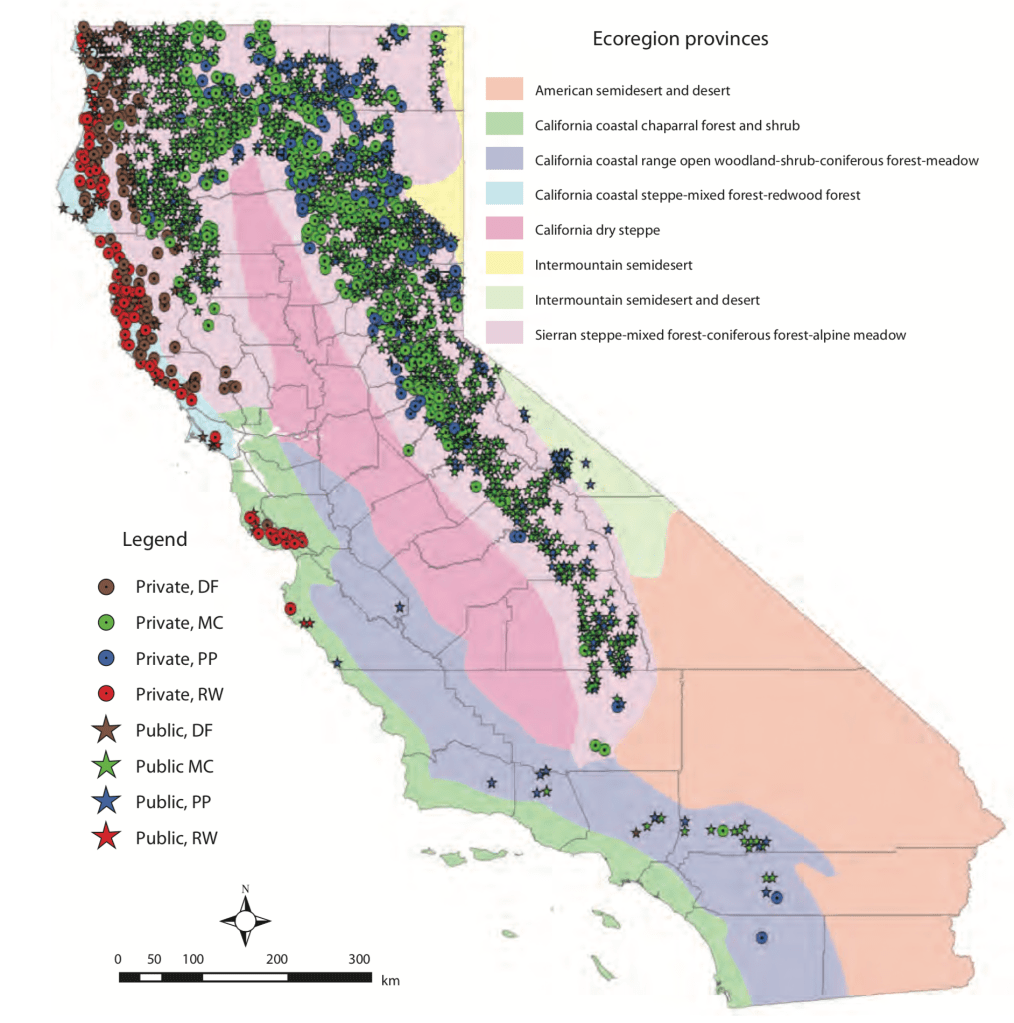
The intensity of severe drought across the conifer-dense range Sierras raises pressing questions of federal management of lands: the moderate to severe drought of forested lands intersect with the USDA Forest Service manage and the over 15 million acres of public lands managed by the federal government manages or serves as a steward.
–that crosses many of the dried out wildland and rangeland forested with conifers and dense brush, a majority of which are managed by federal agencies–19 million acres, or 57%– but with climate change are increasingly drier and drier, which only 9 million are privately owned.
Yet the reduction of Wildland Fire management by 43.98% from FY2020 to FY2021 in President Trump’s budget continued the systematic erosion of funding for the United States Forest Services. As California weathered longer and longer fire seasons under Donald Trump’s watch, Trump made budget cuts $948 million to the Forest Service for fiscal year 2020, after defunding of US Forest Services by reducing mitigating fire risk by $300 million from FY 2017 to FY2019, cutting $20.7 minion from wildlife habitat management, and $18 million from vegetation management–a rampage beginning with cutting USFS research funding by 10% and Wildland Fire Management by 12% in FY 2018! While blaming states for not clearing brush in forests, sustained hampering of managing federal lands rendered the West far less prepared for climate change. As the costs of containing wildfires rise, the reduction of the Forest Service budget has provoked panic by zeroing out funding for Land and Water conservation–alleged goals of the Trump Presidency–and cuts grants to state wildfire plans by a sixth as fire suppression looms ever larger.
By defunding of forest management, rangeland research, and habitat management, such budgetary measures pose pressing questions of our preparedness for the growing fire seasons of future years; stars that denote public land management might be targets for future dry lightning.
We think of earth, wind and fire as elements. Or we used to. For the possibility of separating them is called into question in the Bay Area, as wind sweeps the smoke of five to seven fires, or fire complexes, across the skies, we are increasingly likely to see them as layers, which interact in a puzzle we have trouble figuring out. Indeed, the weirdly haunting daily and hourly maps of air quality map the atmospheric presence of particulate matter by isochrones brought late summer blues to the Bay Area. Blue skies of the Bay Area were colored grey, burnt orange, and grey again as cartoon plumes of soot flooded the skies in a new sort of pyrocumulus clouds that turned the sun red, offering a disembodied traffic sign telling us to stop.
Clara Brownstein/October 1, 2020
Fire season began by remapping the town in terrifying red that registered “unhealthful,” but almost verging on the “hazardous” level of brown, based on local sensors monitoring of ozone, but is also registering a deeper history defined by an absence of rain, the lack of groundwater, the hotter temperatures of the region and the dry air. The map is both existential, and ephemeral, but also the substrate of deep climate trends.
AQI Chart on Saturday, August 22, 2020/AirNow (EPA)
Is fire an element we had never before tracked so attentively in maps? We did not think it could travel, or had feet. But wildfire smoke had blanketed the region, in ways that were not nearly as visible as it would be, but that the real-time map registers at the sort of pace we have become accustomed in real-time fire maps that we consult with regularity to track the containment and perimeters of fires that are now spreading faster and faster than they ever have in previous years. And soon after we worried increasingly about risks of airborne transmission of COVID-19, this fire season the intensity of particulate pollutants in the atmosphere contributed intense panic to the tangibility of mapping the pyrocumulus plumes that made their way over the Bay Area in late August. As the danger of droplets four micrometers in diameter remaining airborne seemed a factor of large-scale clusters, the waves of black carbon mapped in the Bay Area became a second sort of airborne pathogen made acutely material in layers of real-time Air Quality charts.
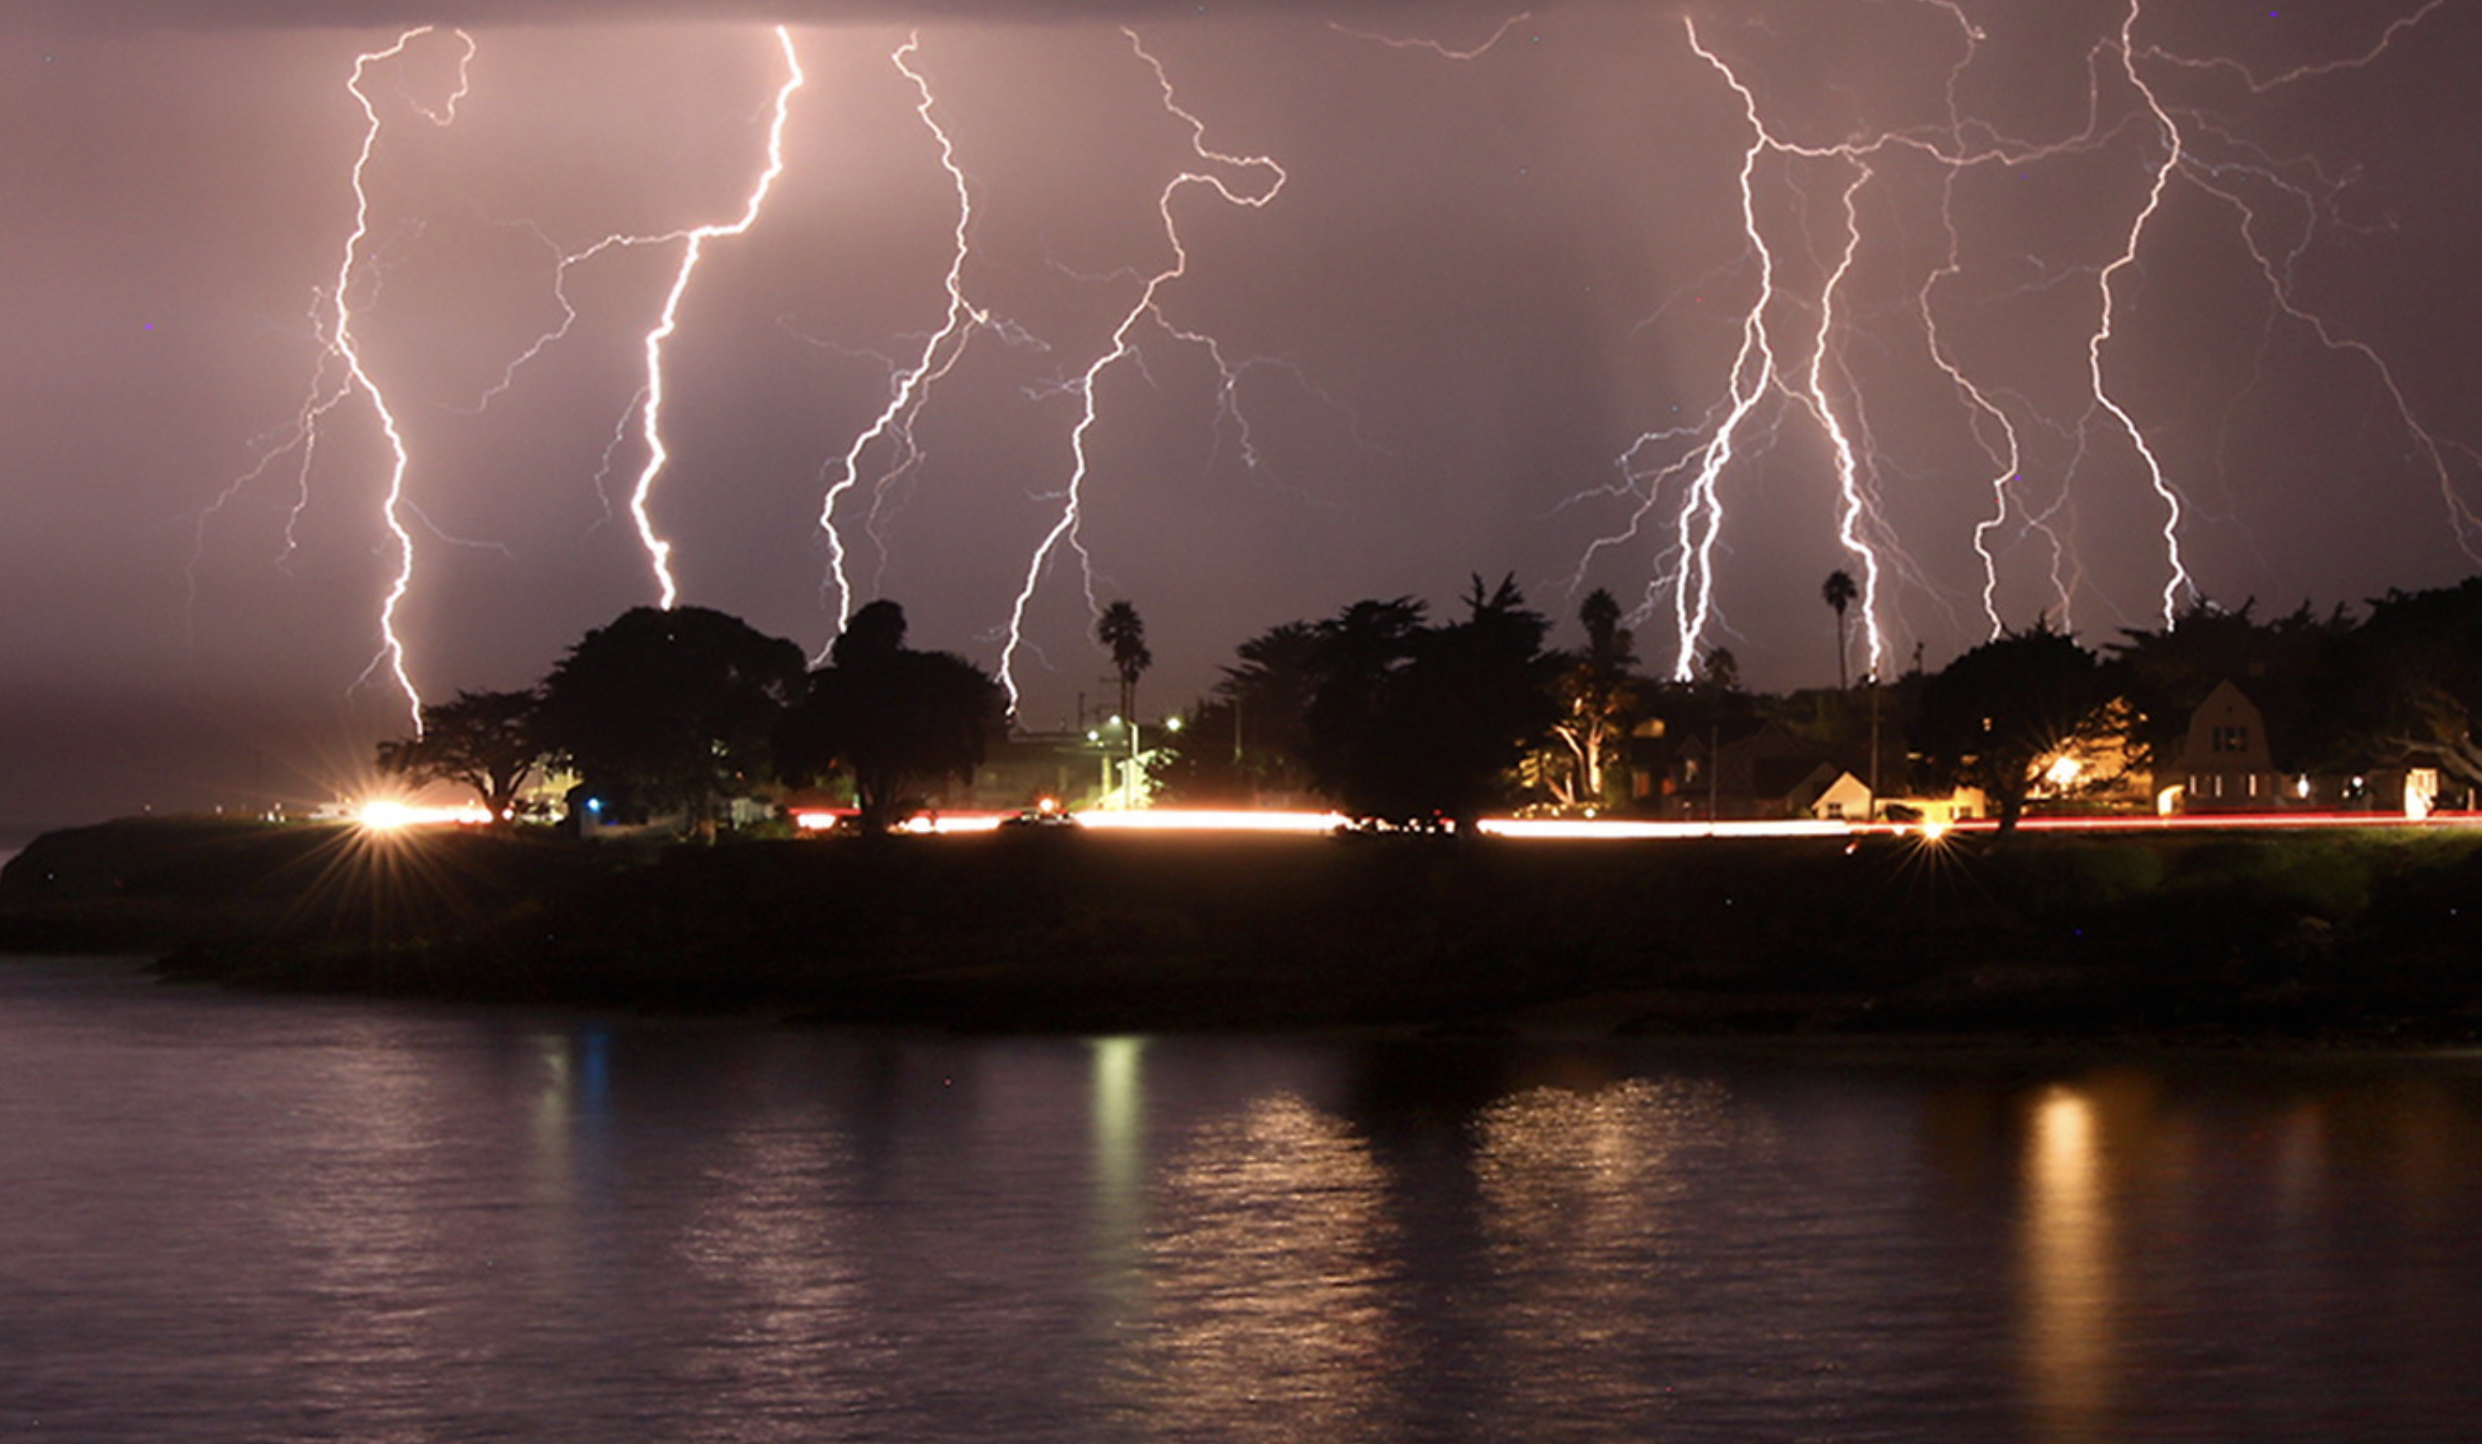
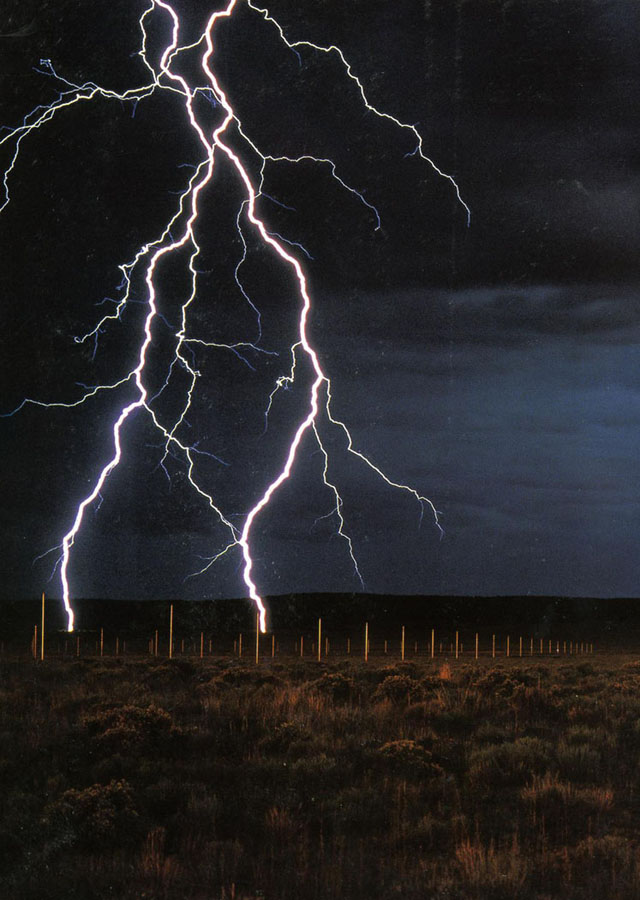
The boundaries of fire risk charts and indeed fire perimeters seemed suddenly far more fluid than we had been accustomed. When we make our fire maps with clear edges, however, it is striking that almost we stop registering the built environment, or inhabited world. As if by the magic of cartographical selectivity, we bracket the city–the sprawling agglomeration of the Bay Area–from the maps tracking the destructiveness and progress we call advancing wildfires, and from the isochronal variations of air quality that we can watch reflecting wind patterns and air movements in accelerated animated maps, showing the bad air that migrates and pool over the area I life. The even more ephemeral nature of these maps–they record but one instant, but are outdated as they are produced, in ways that fit the ecoystem of the Internet if also the extremes of the new ecosystem of global warming–the isochrones seem somewhat fatalistic, as they are both removed from human agency–as we found out in the weeks after the Lightning Siege of 2020 that seemed a spectacle of the natural world that rivaled the art of Walter de Maria in their grandiosity of time-lapse photography–
–the horizontal line of artificial light from Santa Cruz, unlike the images that De Maria created from The Lighting Field, remind us of the overlap between inhabited spaces where conflagrations in the dry wildlands that spread as the fires struck, and in way far less difficult to aestheticize than The Lightning Field set in a desert removed from human population, but was built as an isolated field for time-stop photography.
The CZU complex brought widespread devastation across areas of extra urban expansion in the Santa Cruz Mountains was almost a map that registered the expansion of residences to the very borders of forests. We haven’t ever faced the problem of maintaining and clearing in weather this dry, even if we have mapped the clustering of fires in the wild land-urban interface: but the strikes ignited underbrush lain like kindling, on the boundaries of the raging fire complexes. If the burning of underbrush by fire mitigation squads seeks to create fire lines in the mountainous landscape to create new perimeters to forestall the advance of major fires, working along a new fire line even as what is still called wildfier smoke travels across the nation, far beyond the Bay Area.
While watching the movement of fires that them in inhabited areas like shifting jigsaw pieces that destroy the landscape across which they move. These marked the start of megafires, that spread across state boundaries and counties, but tried to be parsed by state authorities and jurisdictions, even if, as Jay Inslee noted, this is a multi-state crisis of climate change that has rendered the forests as fuel by 2017–for combined drought and higher temperatures set “bombs, waiting to go off” in our forests, in ways unable to be measured by fire risk that continues to be assessed in pointillist terms by “fuel load” and past history of fires known as the “fire rotation frequency.” When these bombs go off, it is hard to say what state boundary lines mean.
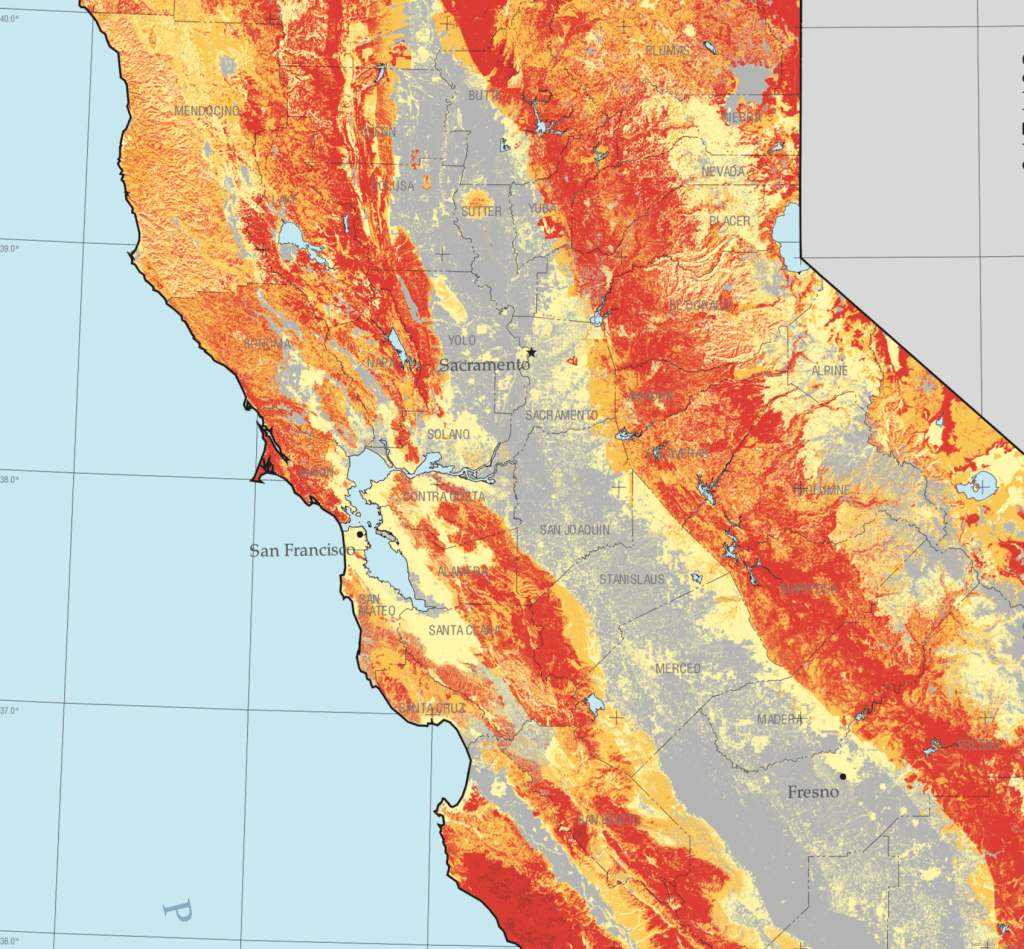
Fire Threat Risk Assessment Map, 2007
If San Francisco famously lies close to natural beauty, the Bay Area, where I live, lies amidst of a high risk zone, where daily updates on fire risk is displayed prominent and with regularity in all regional parks. These maps made over a decade ago setfire standards for building construction in a time of massive extra-urban expansion. But risk has recently been something we struggled to calculate as we followed the real-time updates of the spread of fires, smoke, and ash on tenterhooks and with readiness and high sense of contingency, anxiety already elevated by rates of coronaviurs that depended on good numbers: fire risk was seen as an objective calculation fifteen years ago, but was now not easy to determine or two rank so crisply by three different shades.
Fire Risk Map, 2007
When thunderstorms from mid-August brought the meteorological curiosity of nearly 12,000 dry lightening dry strikes from mid to late August 2020, they hit desiccated forests with a shock. The strikes became as siege as they set over three hundred and fifty-seven fires across the state, that rapidly were communicated into expansive “complexes” of brush fires.
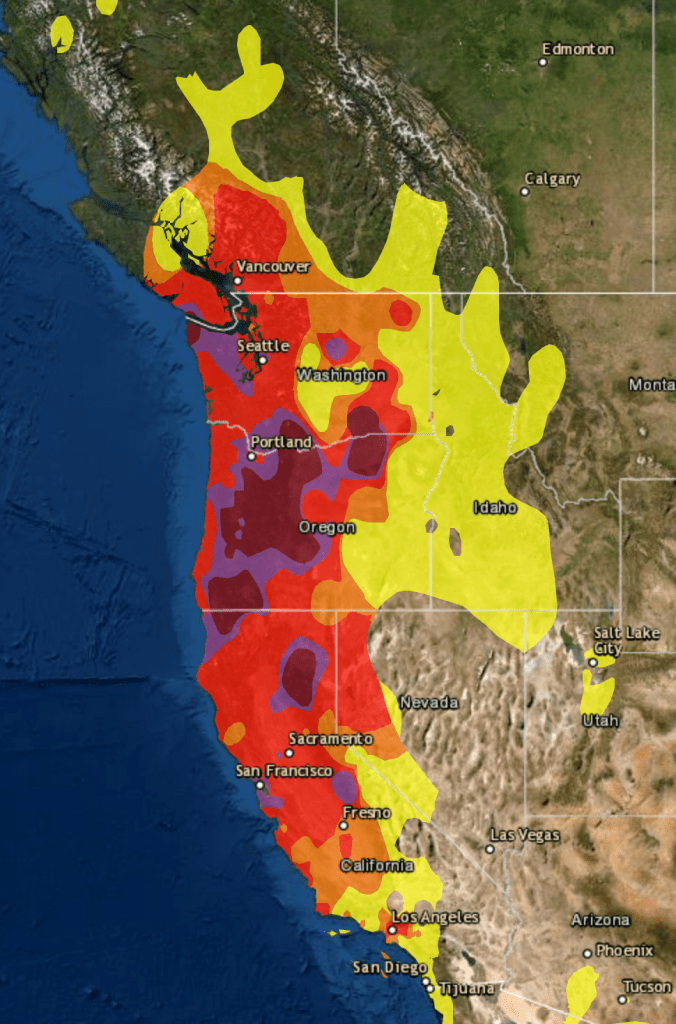
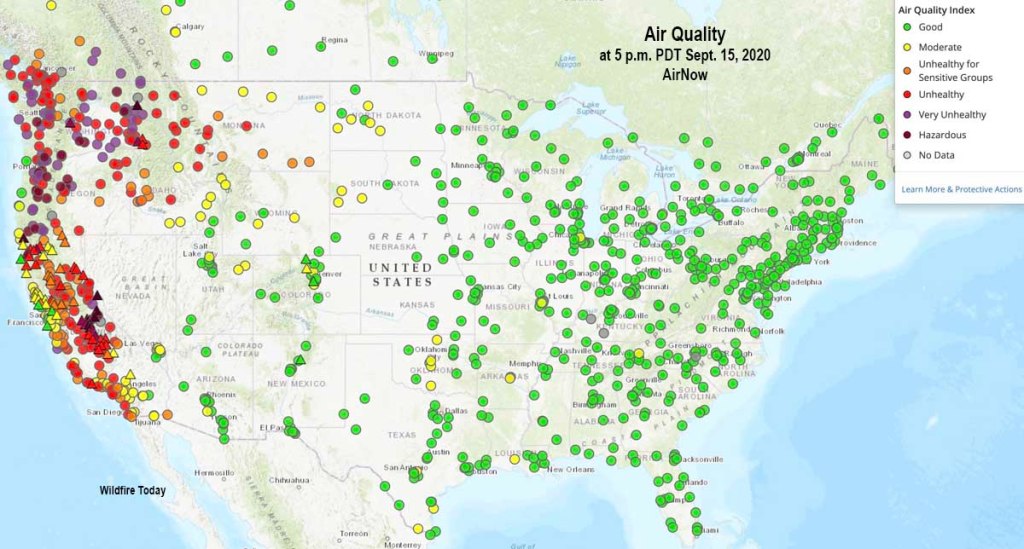
We map these fires by state jurisdictions, and have cast them as such in policy, by borders or the perimeters we hope to contain barely grasp the consequences of how three quarters of a million acres burned up suddenly, and smoke from the cluster of fires rose in columns that spread across state boundary lines as far as Nebraska, and how fire complexes that spread across three million acres that would soon create a layer of soot across the west, eerily materialized in layers of GIS ESRI maps of environmental pollutants, while toxic particulate mater released in plumes of black carbon by the fires cover the state, rendering the sun opaque where I live, in the Bay Area, now Pompeii by the Bay as smoke at toxic levels blanketed much of the state.
They even more serious map, to be sure, was of fire spread: but the maps of air quality set the entire western seaboard apart from the nation, as if threatening to have it fall into the ocean and split off from the United States,–even if the burning of its open lands was more of a portent of things to come, they were a historical anomaly, lying outside the record of fire burns or air quality, if the poor air quality traced the origin of black carbon columns of smoke that would rise into the nation’s atmosphere.
Donald Trump has presented a new notion of the Presidency to the United States: the open claim to be President of only some of the nation, and to have that model of Presidential rule become the standard for political decisions. This policy was not Trump’s own decision: the retreat from any interest in bipartisan governance that had been the basis for American politics for two hundred years began in the pitched nature of pointed acrimony in the United States Senate that erased the decorum and respect among different interests in a model of collective action for over two centuries.
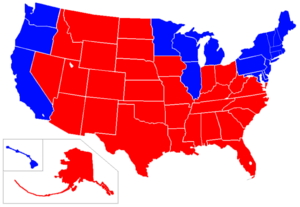
Already by 2011, the nation divided into spectral schema suggesting slight chance of local bipartisan governance, disguising often narrow margins of political victory, despite eighteen states where Republicans controlled both the legislature and governor’s mansion in 2011, some eighteen were split.
Republican States, 2011
While the pitched fervor of some of our national divisions bears the imprint of faith-based movements, they are replicated in the pointillistic logic of the electoral plans of REDMAP–a concerted attempt of regional redistricting. For the reconfiguration of electoral districts has staked out a problem of governance as a strategy of victory that would erode the project of governance, by privileging “states” as an amassing of electoral votes,– rather than positing the coherence of the interests of the nation as a whole. The concept of governance seems fragmented, bolstered by regionalism, states rights discourse, and the cruel new isolationism of go-it-aloneism.
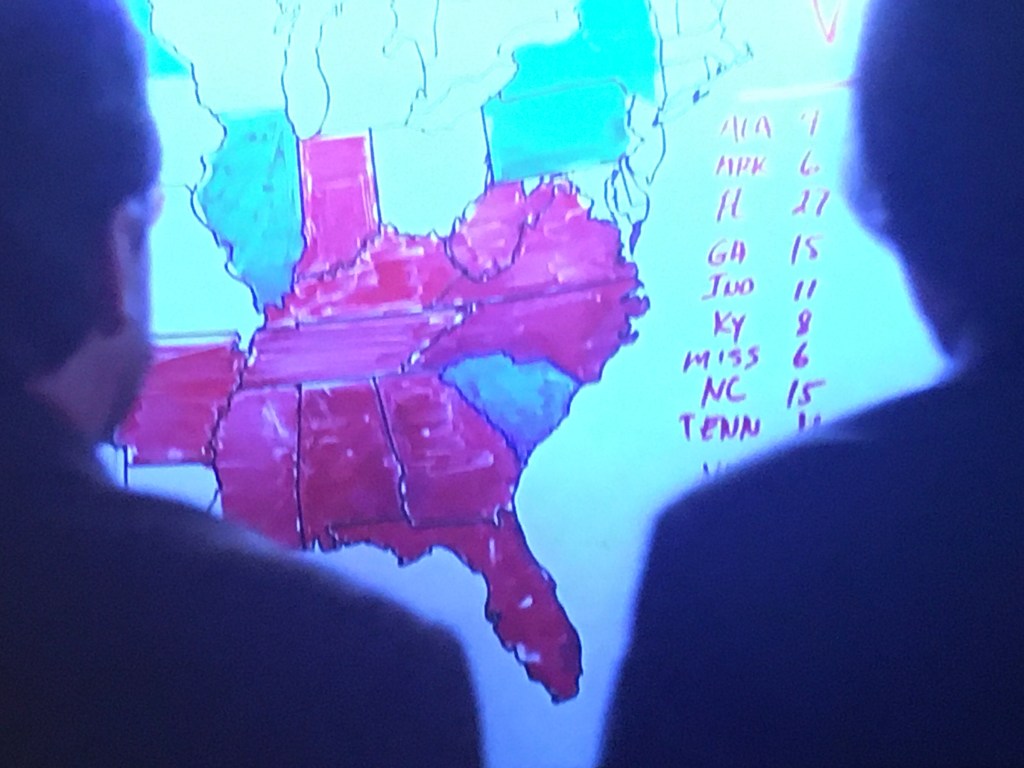
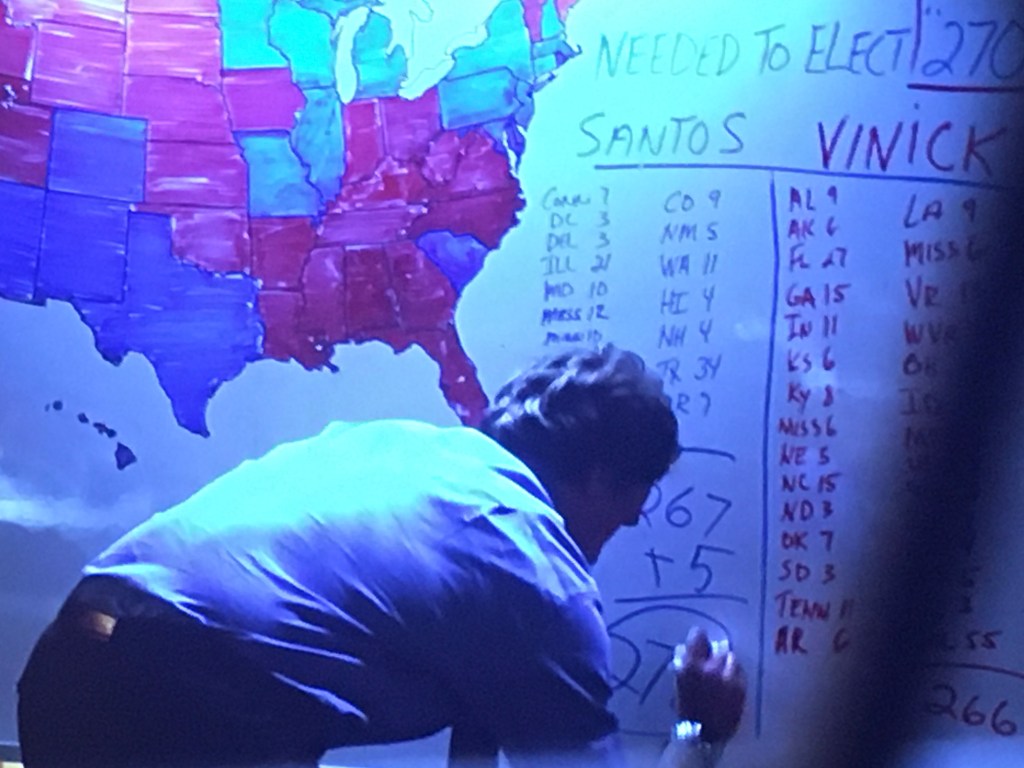
Recast in the optics of the 2020 election as a choice between “darkness” and “light” of truly terrifyingly Manichean proportions, evoking near-apocalyptic scenarios to recast public debate as issues of identitarian self-interest. The divide of states on the 2000 electoral map, which didn’t change much over eight years, enshrined a blue versus red state logic, dovetailing with a deeper plan of retaining electoral control. This was the map was dramatized on election night in a television drama that suggested the contingency of voting preferences, and the election night reveal of the electoral map in the seventh season of The West Wing, in 2006. At a time television newscasters needed to remind their audience states shaded blue sent electors to vote for Democrat Matt Santos (modeled in 2004 on then-Illinois State Senator Barack Obama, who just delivered the nominating speech at another convention), red ones for his Republic opponent, Arnie Vinick–Campaign Director colored a dry-erase board as results were announced.
The West Wing, “Election Night” (April 2006)
Obama provided a model for Santos as a candidate not defined by race, pivoting from race to underlying unity among red and blue states, but the restate-blue state divide was militarized. And when Barack Obama was re-elected in 2012, the Republican state legislators in Virginia, Michigan, Wisconsin, Pennsylvania, and Ohio adopted the idea of ensuring Republican victories by rigging the Electoral College according to the congressional districts that they had redesigned, rather than in bulk, in the hopes to skew the distribution of electors by the congressional districts they had guaranteed would be firmly red, having designed districts that even in what were considered “blue” states had “red” legislatures. m so that districts would be assured that they would not be “outvoted” by urban metro areas would dictate a future.
This gave rise to the logic that asserted the “rural” non-metro regions should reclaim a place at the table by recrafting representational politics to give new meaning to those who increasingly feared–or felt–that their vote just didn’t count but felt that their futures on the line. By redrawing districts, legislatures magnify rural interests outside large metro areas, offering a logic magnifying their political representation through congressional districts as power bases and political divides: not by blue and red states, but by a red republic, in need of its voice. The plan to self-segregate matched a strategy of segregating separate electoral votes from the popular vote worked by recasting electoral districts on party-skewed lines, independent of any geographic shape save benefitting one party, at the expense of another, at violence to the republic. It was echoed in a tactic of political obstructionism that provided the logic for “red” areas to be increasingly opposed to current governmental policy in the Obama administration.
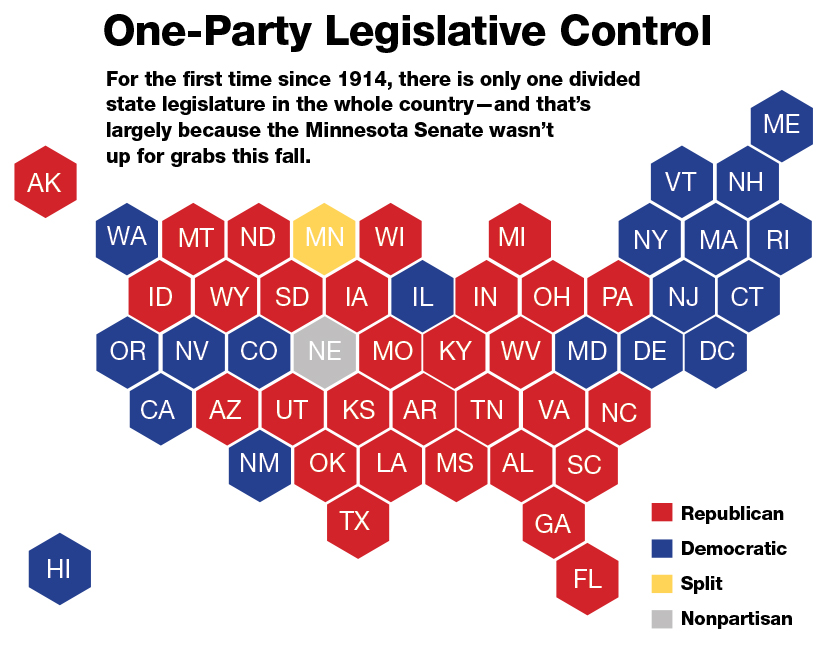
The reduction of debate between parties may have begun on a local level, but metastasized nationally in legislative maps. The rationale of legislative bodies has shifted on local levels from a representational logic of governance to a pitched battle–as only one party wields legislative power in all but one state in the union.
The disorienting nature of an overdetermined power play means that there is not much discussion or debate in the local states, or legislative bodies, but a sectarian consolidation of demographic identity as destiny.
The division of parties cast “red” and “blue” as forms of governance essentialized the color-choices made in news maps as almost existential terms. Indeed, the increased casting of the 2020 Presidential election as a battle between “light” and “dark” was gained distinctly apocalyptic undertones fit for the age of the Coronavirus, mapping the current elections as a referendum of the “future of American democracy” or, for President Trump, a “bright future” and “dark future” whose oppositional terms echo a religious eschatology. Was it any coincidence that the separatist blood-stained banner of the Confederacy reappeared at Trump campaign rallies in 2016, jumping the logic of a chromatic divide into opposing visions that could be understood as a nation divided in war?
Brandon Partin of Deland, FL, releases Confederate Flag For Trump at 2016 Trump Campaign Rally in Kissimmee, FLA/Evan Vucci
As candidates proclaim themselves to constituents as an “ally of light, not darkness,” the choice of the election has turned on the complexion of the nation’s political future in ways that concretize the removal of maps of support of political parties as an existential struggle for the nation’s soul, removed from questions of political representation.
The eery blocks of political division were apparent in the long led-up to the election, as the fracture lines in the nation were only less apparent because of increasing tension as to which way the highly colored states in play would slide, and how the electoral prism would mediate the popular vote.
The notion that a specter of socialism haunts America, to be promoted by the Democratic Party, is the conclusion to a logic of deeply sectarian politics of belonging.
The politics deployed wrenching topoi of danger and difference, in terms not only of grievances, but of a starkly divided landscape that raised the question of the very possibility of political consensus and the pragmatics of political representation. And while rooted in the renewed role of religious zeal in partisan politics, the fervor of opposition to–and defense of reducing insurance for pre-existing conditions–by laws like the Patient Protection and Affordable Care Act–Obamacare–as if they were articles of faith.
Yet as the 2020 election had quickly shaped up into a contest of chromatic separatism–
–the deeply oppositional dynamics of the divided landscape bode deep difficulties in governability.
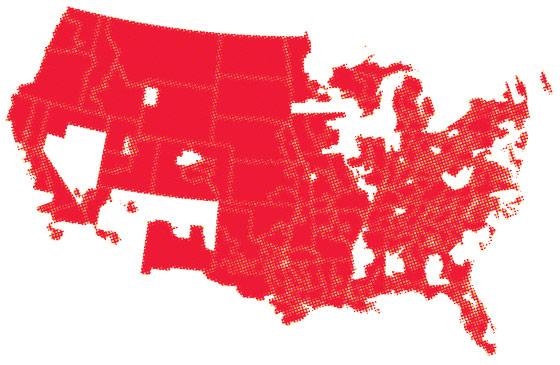
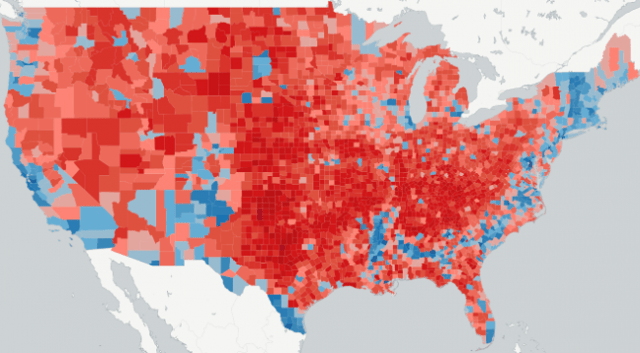
2016 Presidential Election, County by County Voting Predictions
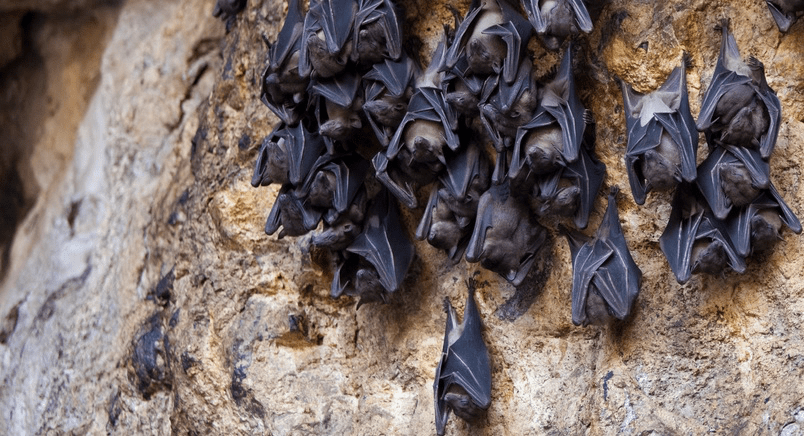
Thomas Nagel queried the possibility humans had to “know what it is like for a bat to be a bat” in a 1974 paper that posed pressing epistemological challenges beyond the philosophical community. Nagel was asking us to consider what was the context in which bats move, and to consider the foreign nature of propositions about the distribution of a network of flying bats to humans’ embodied experience: the winged mammals that may have inhabited the eaves of the philosopher’s old summer house in Connecticut or Vermont–I am guessing–where he rises from his desk to spend the early evening watching bats reel out at dusk as they fly in wide arcs, searching en masse to seek out meals of bugs and gnats at dusk. I imagine this only because there is a sense of wonder and of coming against a mental edge that is impossible to get one’s mind around in those wonderful sentences, “I want to know what it is like for a bat to be a bat. Yet if I try to imagine this, I am restricted to the resources of my own mind, and those resources are inadequate to the task. I cannot perform it either by imagining additions to my present experience, or by imagining segments gradually subtracted from it,” They are worthy of Thoreau, as entirely earnest and committed, and at least as beautifully Latinate.
Asking what it is like for a bat to be a bat suggests a new model for collective action, not bumping into one another by using spatial registers in ways we don’t really know how to map–or to even think we can.
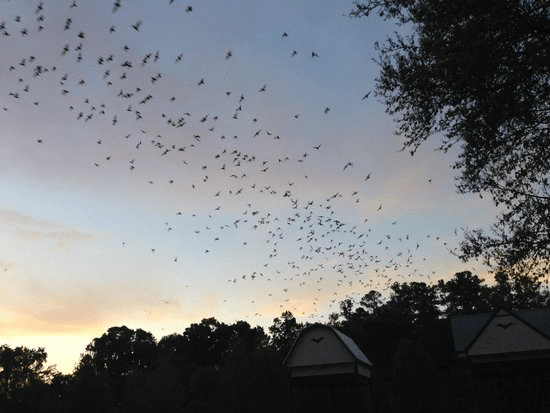
Maybe he was in Florida, near Gainsville, or Tampa Bay, where homes for bat colonies have been constructed that offer them temporary housing–
–watching a bat colony search for bugs and flies at a time when the flying mammals are losing safe natural habitat, displaced by construction and environmental saturation of electric lighting. The instant of inter-species realization that launched an epistemic earthquake might have been launched when, returning home, evening drink in hand, Nagel retired to his desk after dinner to write an article arguing we lack not language but adequate mental tools to think like a bat, let alone to “know what it is like for a bat to be a bat,” or imagine a bat-like proposition about space. If the “bat’s point of view” is foreign to our own individually embodied experience so removed from a distributed network to imagine flying through the air or moving the the darkening evening sky–let alone accurately navigating–like a bat, in clouds of a distributed intelligence foreign to the individual human mind, let alone the bat-versions we imagine of pain, fear, hunger, lust, loss or desire. The problem allowed him to ponder the “subjective character of experience,” but may have driven a wedge between human-space and bat-space we are trying to emerge.
Are bats able to synthesize, share, and collectively process a sense of the images of the outlines of trees, skyscrapers, and blocked routes, by abilities to synthesize individual datapoints in something like a collective map map? If it was a philosophical topos of sorts to pose thinking like a man or thinking like a bat, that was inherited from philosophers before Nagel’s essay. Isaiah Berlin, who sought to describe the dignity of human feelings, had little regard for bats, from whom he felt some repulsion– ‘I don’t like flying insects, moths and things, and I hate bats – if I were in a room with bats, I should go completely crazy,” he wrote, describing the bat as a provocation sufficient even to unhinge the most rational of minds. He had traced it back to a fear of moths from his childhood, that his mother indeed took him to a doctor in Baden-Baden to diagnose as a phobia of insects, but found himself unable to relax in the presence of a flying insect or bat. (“‘I shan’t be able to relax until it’s gone,’ but adds, ‘but don’t kill it!’“).
Nagel may have been far less phobic about bats than the towering authority of Wolfson College, but was more interested in the sensory apparatus that contributed to the distinct subjective realty of being a bat, a reality that Berlin seems to have acknowledged readily in the strong reluctance he showed for killing a bat–rather than the unique means of echolocation by which they navigate space from the reflections of the modulated shrieks they send out to detect objects within range, as a form of sonar, as a distinct way that their brains use to navigate space. The inaccessibility of the “inner life of the bat” might be restated as a problem of mapping, however, at least in how we can accommodate–if not understand–how bats navigate space, and indeed understand bat sociability as a problem of mapping, rather than excluding bats’ skills of echolocation from anthropocentric maps. If they have a different sensory apparatus, how can our maps better accommodate bat sociality, as much as bat minds, to the way we map space?
The philosopher performed a powerful thought experiment about human consciousness about the subjectively rooted nature of human experiences, by inviting us to consider what he took as the vast intellectual remove of the experience of those nocturnal navigator. We might, Nagel imagined, well be able to adopt “the bat’s point of view,” rather than a human, if being like a bat did not escape the conceptual tools humans possess. While Nagel may have been looking into the night sky for his historical experiment, the mass knowledge of the “bat” as opposed to the individual actor of history was a stock figure of philosophers, hit upon by the belief philosophers focus on human knowledge and human experience–“what it is like to be a man and not a bat”–might deserve to be reframed. For as human space and bat space intersect and overlap in new ways, we may find the need to try to imagine how their habitats overlap like a Venn diagram. And we do well might to start to do so as a need to try to consider what it would be like to be certain about how bats to move through space in a distributed network of collective thought based on their experience of the world, to extract ourselves form such anthropocentric models of spatial thought.
While Nagel did not necessary mean the swarm thinking that enables bats’ behavior, it is striking that the logic of the swarm of bats’ nocturnal flight paths–that employ vision, but don’t rely on it–may be providing a basis for the new “training sets” that push new horizons for AI intelligence, beyond the “training sets” used to develop computer vision that has helped “train” how computer vision might “see” and recognize facial characteristics. As echolocation helps bats track insects, not crash into each other as they fly in large groups, and navigate caves, moving by sounds, as much as visual cues, the abilities it allows–for densely flying animals to somehow not jam each others’ sounds, but fly side-by-side in large groups without touching, evading one another without audio interference, and distinguishing the recognizable pitch of one another’s individual calls–they may offer a way of being within a distributed network, sustained at over sixty miles per hour–and within underground caves from which up to half a million bats nightly emerge. This would be a form of distributed intelligence and a form of “intelligence,” Nagel’s work reminds us, removed from human ken.
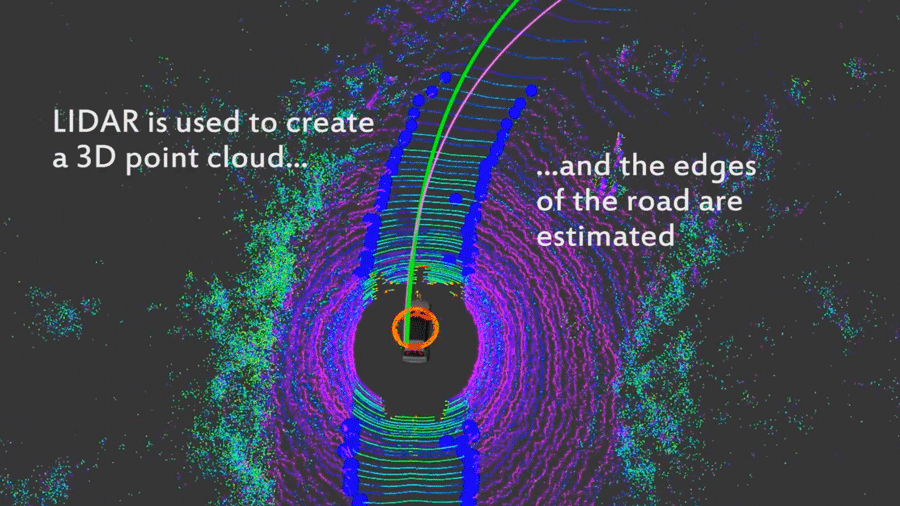
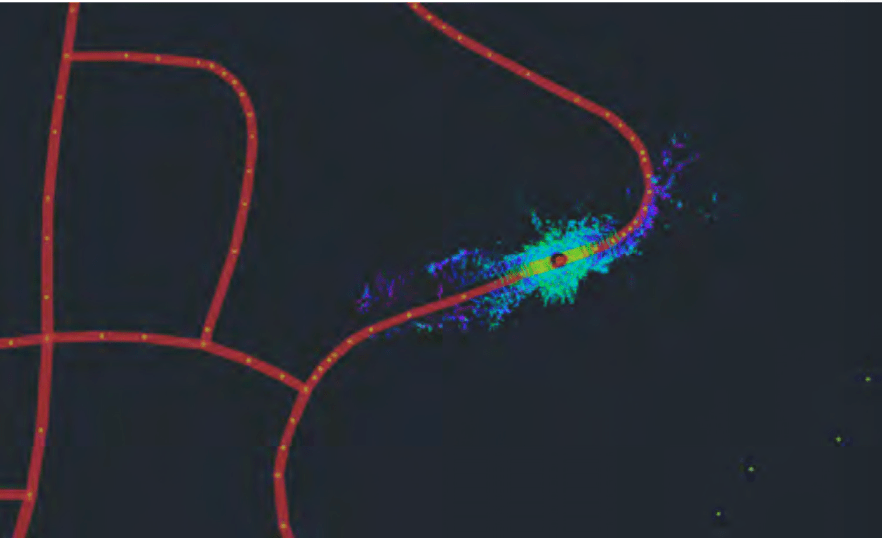
Bats’ powerful bioacoustic abilities to distinguish individual echolocators without interference in crowded caves may offer a powerful model for using sonar signals to create a similar capacities of sonic recognition among the range of sensor data that self-driving cars use by emitting distinctive levels of sonar so specific not only across different makes, but individual drivers, allowing swarms of commuters to calibrate their spatial relations to other commuters by an analogous sort of distributed intelligence: might autonomous vehicles, in other words, be made to think like bats? The thought is tempting, as it would push a new basis for drone “thought” and warm thinking and movement, if it remains a bit of a pipe dream quite different from the current base-maps for self-driving cars, based on mapping roadways, directionality, and the driving cues of highway signs, turn routes, and the sort of tacit signs of how we move cars within lanes, along painted reflective dashes, to prevent or reduce automobile collisions.
Civil Maps
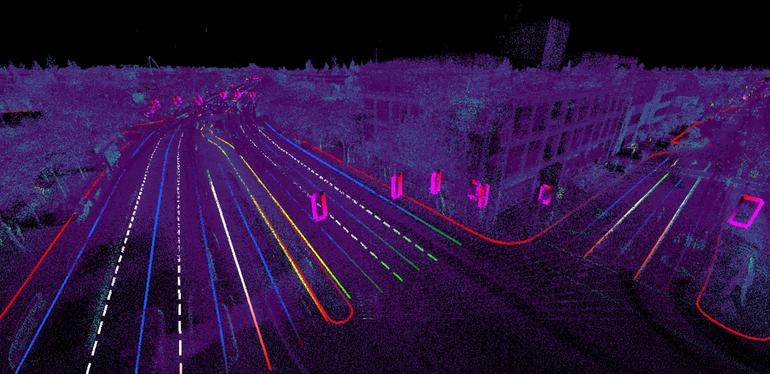
But what are the maps of bats? Could the flight paths of bats ask us to reimagine maps? The level of auditory discrimination is at basis, perhaps, a question not only of “technologies of extremely accurate localization” but bioacoustics. Much as LIDAR might create a point-cloud for areas that are lacking in many topological maps of routes to estimate the areas of roads on which autonomous vehicles might travel, is there a chance that bats move mentally among multiple scales and registers of mapping, moreover, both to navigate among one another’s flight paths while traveling in the night skies at speeds that are often up to 60 mph, and to take paths that allow them to return to the security of caves or other diurnal dwellings?
The problem was how the sort of state-of-the-art maps for autonomous vehicles that were dependent on existing maps would make sense in the dramatically changing extra-urban and rural environments on large scales, and how such rapid development of built landscapes could limit the potential positives of autonomous vehicle technologies: often, these areas were the same in which many commuters lived, and where the benefits of driverless cars would be felt, so the benefits of unmooring cars from existing maps was more than a purely academic challenge.
The bioacoustics tools bats use to negotiate in swarms and on individual rest on developed abilities of acoustic recognition that might be especially important to autonomous vehicles–for which the motion between large scale maps and the mapping of fast-moving vehicles beside them remain something of a missing piece, if not a potential cartographical blind spot for modeling distributed spatial intelligence by sonic blasts.
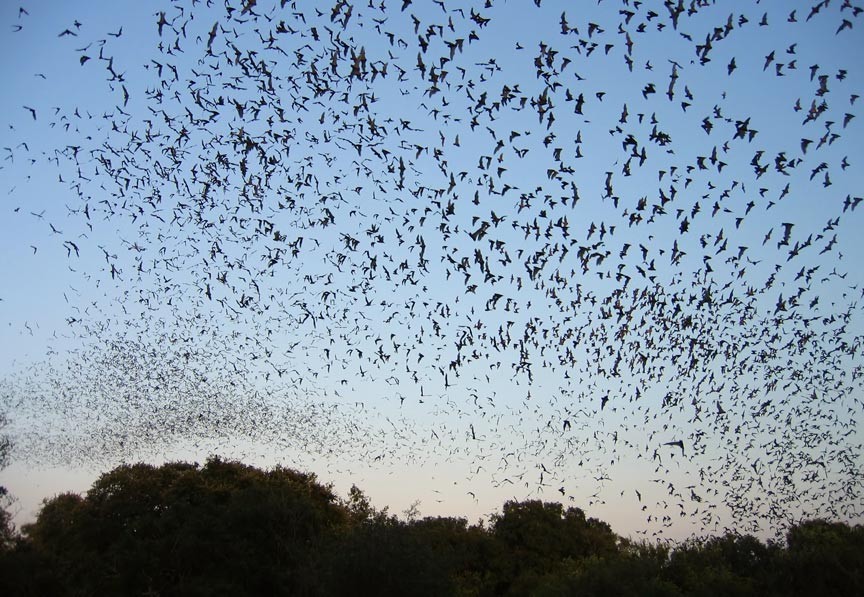
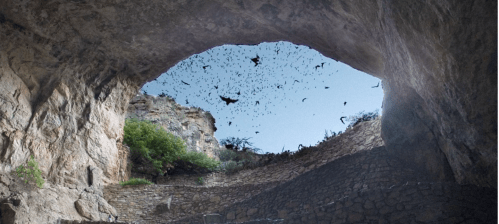
Bats may hone these auditory skills of discrimination of sonic frequencies by skills honed by preparing from departure deep underground in caverns, developing echolocation systems that allow them to capture insects while flying that are less than a centimeter in size, though the presence of a still human can confuse bats’ sonic maps for judging moving prey, while navigating swarms of over 1.5 million–15 million live in Natural Bridges underground caverns, and caves in Carlsbad NM once housed up to eight million.
Natural Bridges, TX/National Parks Service
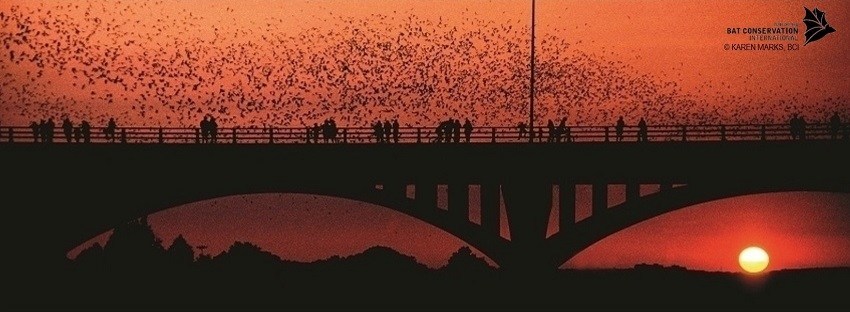
The ability to map individually and in a swarm make their ultrasonic pulses a powerful tool of acoustic discrimination of routes, but the images bats preserve in their mental maps are not nearly so existential in nature. Indeed, the colony of a million and a half Mexican free-tailed bats that live in downtown Austin, under Congress Bridge, beleived to be the largest urban bat colony in the world, is so prized by the city’s human residents that the emergency of maturing bat pups in the Central Texas night sky is advertised as a cheap thrill during fall sundown of vertiginous biophilia, the dedicated “bat hotline”–(512) 327-9721–provides visitors eager to witness the swarm with confirmation when bats are seen emerging downtown—
Bat Conservation International
–a biophilic spectacle that highly demonstrates the intricate networks of distributed knowledge as young pups learn to fly, that is a prominent part of the Central Texas city’s ecology. Perhaps a splinter group from the nearby Bracken Cave colony–one of the densest sites of mammals on earth, just a half hour northwest, is the largest known bat colony in the world.
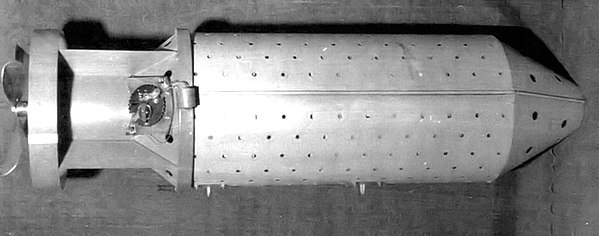
Inspired by the broad arcs of nightly emergence of bats from New Mexico’s Carlsbad Caverns National park as Pearl Harbor was attacked, a dentist first promoted the idea of using bats for fire bombing of Tokyo’s wooden homes. The plans for outfitting thousands of bats with explosives affixed to their little chests–treating the bats as dive bombers to create spontaneous conflagrations in Japanese cities–developed as the letter sent to President Roosevelt led to plans for a nocturnal release of thousands of bats, bearing explosives on their chests, who would roost in the structures of Japanese buildings by treating Mexican free tail bats as a squadron of blind dive bombers who, transported across the Pacific to the eaves of wooden houses in Tokyo, might provoke an incendiary attack by distributing packets of napalm–the basis of incendiary bombs–by the far greater geographic area of bats on whom chests were affixed napalm adhesive vests. Sequestering a thousand free tails hibernating in isolated chambers for trans-Pacific travel never bore fruit; optimistic simulations revealed explosive packets regularly impaired flight and “uncertain behavior of bats” glossed the failure to cooperate in destructive fantasies of using winged mammals to distribute urban conflagrations by 1944, if disastrous experiments in California created some massive explosions. Despite the failure to orchestrate a swarm of bomb-bearing bats, plans to parachute a swarm were brushed aside by OSS director William J. “Wild Bill” Donovan punctured as the “Die Fledermaus Farce,” dismissing the fantasy of costuming bats for an air raid by an Strauss operetta promoted into the operatic repertory to ridicule the strategic value of an airborne zoo –putting the cruelty of immolating flying mammals aside. The basic truth was that the bats’ flight could not be planned.
Canister Designed by Louis Fieser for Dropping Hibernating Bats on Japan
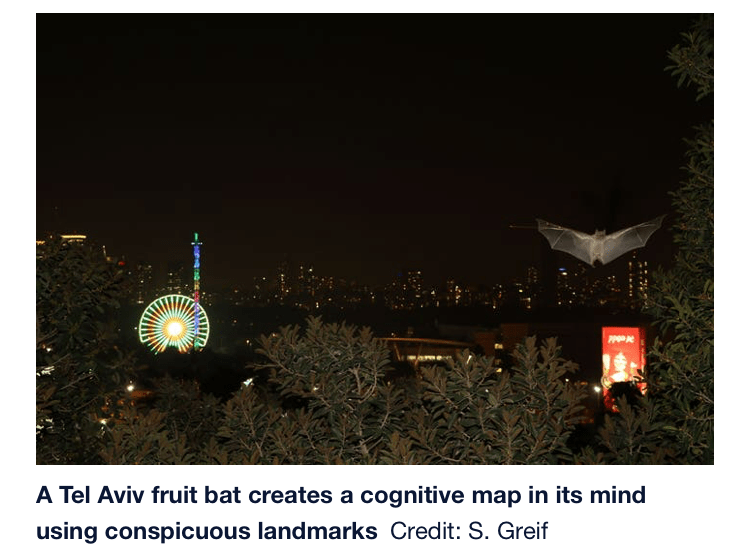
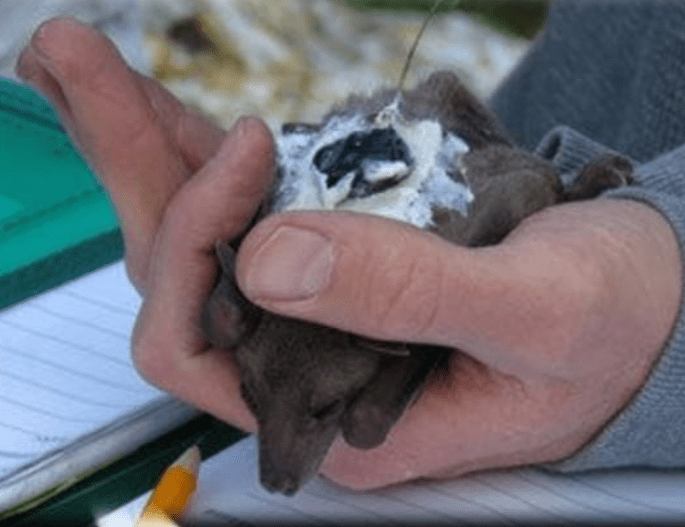
The remove of such a bomb as a way of creating winged kamikazes removed nature of hopes for the strategic deployment of bats in a global strategy from what it is like for a bat to be a bat, or how bats think. But could it be possible to approach the mental outlook that enables bats to navigate nocturnal skies at high speeds in search of fast-moving food? Perhaps Nagel’s project influenced how, since 2011, Israeli researcher Yossi Novel attempt to cross this bridge of consciousness by a colony of bats–nearly 20,000 winged mammals–that he raised from birth to maturity, and tracked their progress as they navigate Tel Aviv’s skyline, using the city lights to navigate their paths home. By fitting the small bats with the “smallest GPS [then] in existence” of about ten grams, scientists charted paths to uncover secrets of the mammals’ neural abilities of nocturnal navigation around man-made waypoints in Tel Aviv’s and the most “visible” nocturnal monuments to detect their cognitive abilities.
While perhaps not as elegant as aerial V-formations of geese, pelicans, or storks, timing their wing beats to catch eddies of air that seem to save birds some 20%-30% in energy, minimizing downdraft to an aerodynamic advantage, and flapping in phase to maximize energy by an anti-phase synchronizing of wingbeats in V-formation: bats’ far smaller wingbeats evolved fewer aerodynamic problems, and responded to fewer challenges of long-distance migration, but offer evidence of assembling spatial maps over time over a surprisingly expansive distance range. Far from a costume party of human orchestration, in a staged ball based on costuming bats, the bats’ flight was nightly tracked.
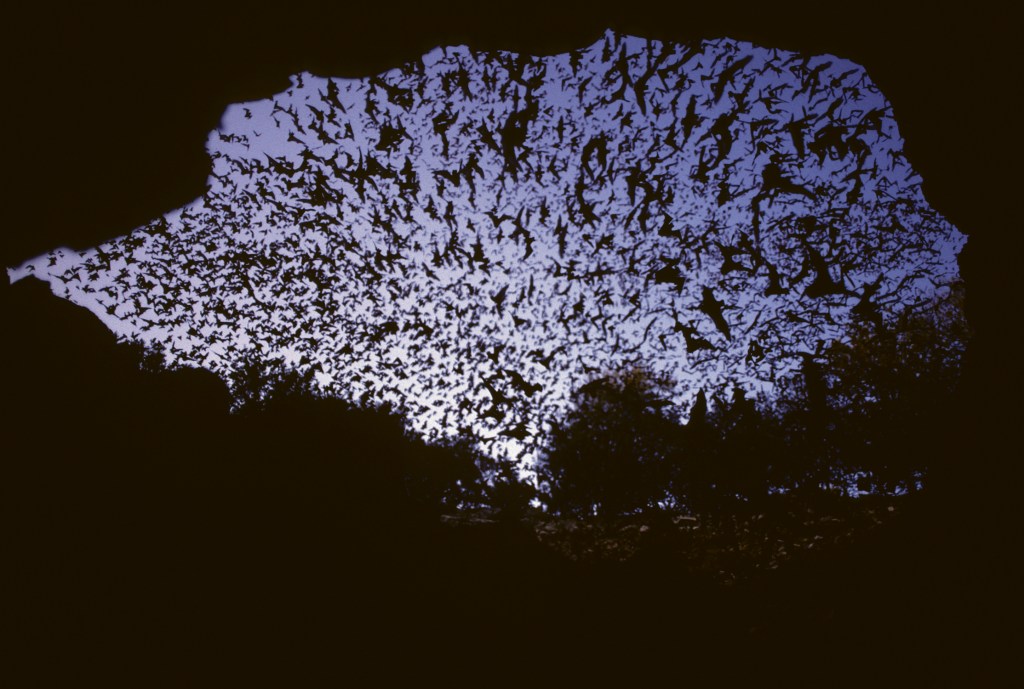
Indeed, the almost nightly expeditions of bats–some 15 million from caves north of San Antonio TX, in summer months–that show up on radar as explosions of “bioscatter,” as they emerge from caves in search of food, is so striking at large-scale that the small-scale tools of navigation by which the bats move from sundown need to be mapped in relation not only to seasonal meteorology, artificial light, and human disturbances of the environment, although it might be better to begin from more basic–still insufficiently understood–questions of how bats, all too often mischaracterized as “blind,” regularly map space. The National Weather Service mapped nocturnal emergence of bats from caves in Central Texas on its radar that appear to be explosions of meteorological imbalance, but in fact only track the nightly emergence of millions of bats, an efflorescence of cave-dwelling mammals bursting into flight from underground sites–what weather forecasters dismiss them “bioscatter” which raises immediate questions about the bats’ mapping tools, and the distributed networks of navigation that allow bats to fly across the state in search of food, without ever crashing into one another’s paths of flight.
if all maps are ‘surface readings’ and of necessity exclude often crucial sensory “noise,” do those green explosions miss the miracle of bioacoustics that allow sophisticated level of auditory discrimination for bats to move with a sense of where they are going–or what to avoid and what to eat!–while registering or encoding a map to allow them to return to the caves? What are we missing in mapping those bats as mere “biostatic,” of no meteorological significance, we are now asking what sorts of sounds bats are making to one another as swarms disperse from what seem fixed points? Are the bats best mapped as swarms, or do they have individual flight paths, and, if so, what is their form of air traffic control?
Without explicitly trying to revisit Nagel’s thesis, the data gained about the bat’s spatial sense of navigation and its brain capacities provided a sense of navigation as they flew above Tel Aviv’s skyscrapers in relation to the tallest towers of the built manmade environment by a GPS of their own devise, that revealed how bats possessed uncanny navigational skills to fly in straight lines at considerable elevations of over a hundred meters, using as points of reference trees up to twenty-five meters away. Outfitted with GPS chips, they mapped the progress made from bat pups’ first exploratory flights, theorizing their abilities to encode learned flight paths to identify the best routes to locate food sources in the city at distances far beyond what sonar allowed them to navigate, to accumulate a mental map of the city that they accrue over years around visual landmarks, taking shortcuts to move across dozens of kilometers.
Israeli researchers explained without much surprise how their bats navigated elevated points on the skyline of Tel Aviv as akin to the same GPS tools that they used to navigate their commutes around the skyscrapers that provided waypoints that were, somewhat quaintly, the very same waypoints of the researcher’s own daily commute: it seemed eerily natural that bats had substituted for other landmarks that bats employ to orient themselves to a skyscape to seek their food or find their diurnal dwellings, as a basis for aerial navigation that provide orientation to the built environment. It might make sense to ask who was enabled by technology, or how technologies allowed us to think like bats: scientists interpreted their data by consulting with pilots, in order to determine what sorts of landmarks the bats released near Bersheba to guide their fairly secure paths, or what types of spatial learning bats developed over time, and how they build maps that allow them to navigate areas as expansive as 100 sq km.
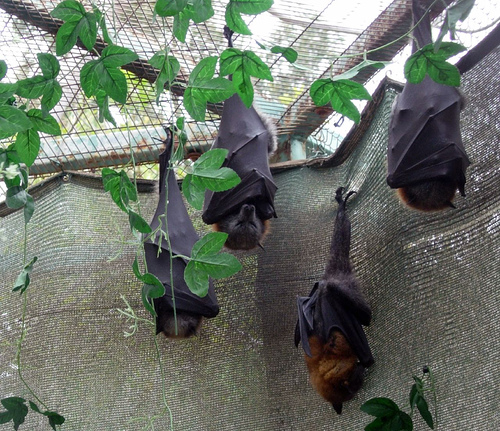
The studies of bats’ neural navigation nets began in 2011 in Israel, in a sense as a casualty of war: the military engagements in Israel created huge pressures on displaced and endangered animals, peace also provided new nesting opportunities for bats, as Haaretz reported Eran Levin of Tel Aviv University’s Department of Zoology discovered species-rich bat populations nesting in long-vacated army bunkers in the Jordan Valley, abandoned since the 1994, but now repurposed by displaced bats as perfect niches that mimic caves, repurposing the bunkers abandoned by Israel Defense Forces, vacant since peace accords with Jordan, but serving as a new habitat for large colonies of Egyptian fruit bats. The fruit bat populations provide a new sample group for zoological studies, providing a unique site to study bat populations, as help from Bat Conservation International and the Ford Foundation transformed the bunkers to homes for displaced bat colonies, including plastic nets and ropes to refashion their ceilings for bats that could restart new colonies holding up to twelve different species in twenty old unused bunkers, that have welcomed bats from the Palestinian Territories, Jordan, and Israel to temporary or perhaps permanent shelters.
If bat studies progressed in the West Bank, the space of urban bats have been studied to show their ability yto navigate from the desert locations as Bersheva to urban habitats. taking them to new areas in the desert over forty kilometers from their usual habitat, finding fruit trees where they feed in the desert, 44 kilometers south of their normal range, and releasing them at dusk who had no problems finding their ways back to their favorite fruit trees, and those who were released at dawn went back to their caves. The bats seemed to use landmarks to guide their paths of flight to do so, and the bats that were released in a crater, over eighty km south of their caves, gaining the purchase to start to fly north: as they took time to exit the crater and to get oriented and needed to leave the crater to place themselves against distant landmarks to return home–waypoints, as it were, to mark their own travels that we imagined computationally checked out, grasping their internal wayfinding abilities by analogy to our own use of GPS in multiple contexts; in what risks a circular argument, bats were argued to have internalized a GPS system. Did the GPS trackers enable researchers to map a bat navigating system, or to think that they had?
The surprising lack of difficulty that the bats had in moving collectively is striking. The success with which bats learned short cuts, and indeed re-oriented themselves to space against spatially removed landmarks, seemed to suggest that they had been caught in the act of building a sophisticated mental map on which they could draw, even if it did not derive in sight, as they could indeed “see” it in their minds, that raised questions of how to describe the mental processes by which they were able to navigate after having been moved almost fifty kilometers south of their usual feeding grounds, and easily able to find their familiar sites of rest by the following day: the description of the bats as moving against buildings by their “own GPS” applied the grids we use to navigate traffic, airspace, or bike rides to the cognitive tricks of the mental operations of bats, without missing a beat. Tel Aviv researchers started monitoring a colony of 20,000 bats from birth could unlock secrets of sociability allowing colonies of thousands of bats to survive over forty years, and indeed to all use their own abilities of sonar to fly together collectively within subjective tools, by a neural map that the abilities of echolocation bats use for closer range encounters.
Such studies that hint at the importance of bat sociability suggest intriguing orientational abilities of mouse-eared bats to orient themselves by magnetic fields–as if by analogy to a compass–at sunset, when they emerge, the suggest possession of considerable orientational tools. but the study of how bats can cannily navigate Tel Aviv skylines suggested an uncanny ability to internalize built landscapes, and to study their behavior that would not cause duress to any single bat. The image of the peaceful nocturnal navigation of the Holy Land seems a collective experiment for which funding must exist in Israel, the questions of echo-recognition were hoped to find a solution to how bats map human-built space, and perhaps the surprise came when they were recently explained to built a map akin to GPS as the means that “experienced bats” move with such surety across what seems a known space, taking short-cuts around buildings to find new paths to food, in ways that indicate they have built a map of the city in their bat-minds–or to cast the bats minds not as a different embodied experience, but akin to GPS machines.
The mapping tools strapped on their backs seem to have provided terms to allow us to imagine how bats navigate as a swarm–by a version of GPS?–as if the point-based mapping system that we adopt to move through space provides a basis for understanding how to be like a bat, or how a bat navigates space–the GPS monitors seem to adopt a sort of invisible agency in the experiment, indeed, that allow us to think we can indeed, pace Nagel, enter a bat’s mind. But the astounding adoption and growth of GPS as a universal translation device seems to have been extended across species in the experiment that ties GPS monitors as tools without their own spatial logic.
Whether such monitors afford a sense of what it is like for a bat to be like a bat may be less evident than the possible expansions of imagining a neural net or distributed network by which automated cars case use GPS. There is a sort of romancing of the GPS devices as an agent, in other words, that links the bats to one another, and allow serve as universal translating machines,–a version of the instantaneous translation of TARDIS, in Dr. Who, that relies on matters of telepathic fields, or the “babel fish” that excretes translations into the auditory canal in which it is implanted like an active hearing aid in an auditory channel, as a sort of prosthetic that provides instant empathy in Hitchhiker’s Guide, or the prosthetic Microsofts that plugged into “wetware” sockets behind the ear like a chips to offer exoskeletal enhancements enabling fluency in other languages: the conceit of simultaneous translation the was tweaked by Douglas Adams and William Gibson was imagined as needed to resolve an atomic stalemate that emerged during space travel, in Murray Leinster’s First Contact, as atomic detente after the encounter of a ship of humanoid bipeds are caught in a deadlock near the Crab Nebula–and leads to a memorable conclusion as humans learn to recognize the truly universal sounds of laughter after both ships find they have proposed the same solution.
The fiction of simultaneous translation in the 1945 story would be the basis for resolving the actual fears of atomic war at the foundation of the United Nations, which from its start promised to instantaneously translate all communications under its auspices into each of six “official” languages–Arabic; Chinese; English; French; Russian; Spanish–from the 1945 San Francisco Conference that led to its formal founding; instantaneous interpretation for speeches anywhere from as long as thirty-five minutes to a full hour became a basis for world peace, if one that Preter Pyotr Avaliani compared to “driving a car that has a steering wheel but no breaks and no reverse”–as it allows no time for corrections–characterized as premised on remembering enough short-term but forgetting the words one just said.
The analogy takes us back to unidirectional routes of travel, waypoints, and the creation of a mental map without what we recognize as vision, based on the supersensitive visual perceptions of far greater distances than we’ve imagined, if a vision not dependent on color sensitivity or differentiation.
The GPS device attached to the backs of the bats provided the very tools used to track their motion would allow us to think like a bat, at least in offering a basis to interpret the how the bats navigated airspace,–and make us realize that just as we enhance our navigational abilities by placing trust in Waze and “live” GPS navigation to avoid traffic jams and plot our daily commutes–or used to–they, too, allow us to think like bats.
But the elevation of way finding tools in GPS might make us imagine we’ve found way to think like bats, as opposed to equip them with translation devices that provide a better analogy to think about how they travel.
Echolocation and geolocation are different spatial logics. But we may be in danger of assimilating bats to a system of something like a GPS-inflected AI. If the earlier model of navigation by magnetic fields at sunset posed the problem of the internal compass by which bats move after sunset by magnetic fields, the mental dominance of GPS as a grid we have internalized around waypoints, destinations, and points of primary reference provides a new model to think about how bats do think.
We read more maps than ever before, and rely on maps to process and embody information that seems increasingly intangible by nature. But we define coherence in maps all too readily, without the skepticism that might be offered by an ethics of reading maps that we all to readily consult and devour. Paradoxically, the map, which long established a centering means to understand geographical information, has become regarded uncritically. As we rely on maps to organize our changing relation to space, do we need to be more conscious of how they preset information? While it is meant to be entertaining, this blog examines the construction of map as an argument, and proposition, to explore what the ethics of mapping might be. It's a labor of love; any support readers can offer is appreciated!


