A pandemic is by its nature both local and global by definition–and begins from a local outbreak. But if the only way to gain orientation to a pandemic is by accurate local counts, the problem of balancing–or toggling between–the local and global has become staggeringly pronounced in the case of COVID-19, as if the point-based cartography that we use to track the disease has the better of us, and upper hand, with the absence of accurate local counts. The lack of clear data that came from Wuhan in the days that followed the outbreak of the virus revealed worrisome problems of transparency. The difficulties Chinese government authorities faced in getting bearings on the zoonotic virus, lab-born or not, raised problems of even trying to map its rise, and we tired to look at maps as tea-leaves of future responses, as well as retrospective diagnoses of the point of origin of disease spread–as if maps could explicate our uncertain conditions, and increased vulnerability.
Data visualizations since seem to proliferate in response to uncertainty and an absence of consensus, as we turned to maps as a hope for truth in an age of increased uncertainty: as local officials were loathe to shoulder responsibility, the tally of infected in Hubei Province jumped, astoundingly, forcing the government to recognize the ease of its transmission among humans, was far more virulent than believed. But at this point, looking back in the mirror provides little sense of orientation to the multiplication of dispersed local outbreaks of coronavirus that we are increasingly challenged to map in relation to ourselves. Were the first maps of the New World similar responses to the deep sense of religious and eschatological uncertainty of the early modern period? Whether or not that was the case, we all felt especially early modern now, plague victims of a sort that led us to look back on the mapping and mapping of responses to the spread of pestilence, and hoping that past experience–or our current increased ability of empathy–gave us more meaningful access to the epidemics and pandemics of the past.
The sudden uptick of cases reveals a reticence in tallying the infected out of fears of reprisals for apparent incompetence, an institutional blame-shifting triggering mechanisms of concealment that has led American meat-packing plants to hide numbers of infected workers, and numbers of tests for infection to be far lower than official records suggest: the absence of ability to control the spread of SARS-CoV-2 led us to proliferate maps in hopes to grasp its rapid doubling, uncomfortable at the world they began to show, apprehensive at how to come to terms with the rapidity of local outbreaks of confirmed cases with sufficient granularity, and enough continuities, hoping to track contagion as hopes of containment were beginning to fade in the new aggregates that were increasingly evident.
New York Times
The warning of the virus’ spread was raised by Li Wenliang on December 30 from Wuhan, inter-agency shifting of blame and responsibility in Wuhan– a reflexive institutional blame-shifting by “throwing woks”–abruptly ceased with summons of Shanghai Mayor Ying Yong, he who lured Elon Musk to Shanghai, to restore order: as a new hospital was built, tallies of new cases of coronavirus in Hubei astronomically grew by nine from 1,638 to 14,840, shocking the world–a figure was in keeping with the nearly 1,400 people dead in the country, but suggesting a viral load of unprecedented proportions. Americans apprehensively watched the disease afflicting passengers of cruise liners as if it would arrive ashore, its virulence was in fact already of pandemic proportions: yet American disinformation here took over, as we were told to stick our heads in the sand, ostrich-like, as fears were overblown, and tried to keep calm. And then, the tables were turned, as the United States President described, or suggested, a national policy of intentional undercounts, and limited testing, lest the counts discovered tank his popularity–the stock market value of Trump, International, or, rather, Trump-in-Office, Trump-as-Chief-Executive, whose new season might be canceled due to low ratings. And although the virus began in China, how the United States increasingly came to be the outlier in the numbers of infection confirmed weekly suggested a national story of mismanagement, as the narrative we told ourselves of American exceptionalism before illness seemed to have boomeranged, with the three-day averages of confirmed infections skyrocketing, and setting us apart from the very nations we compare ourselves to, but whose health-care policy we increasingly realize we are distinct from.
Americans were soothed by deceptive common-sense talk. But the results of a lack of investment in public health are all too evident, if our maps are . Robert Redfield, a virologist who served as the public spokesperson of reassurance who had long sustained false theories about retroviruses causing HIV and AIDS, argued that even if the fourteen confirmed cases of the novel coronavirus were monitored and traced, “the virus more exploded . . beyond public health capacity,” he seemed to forget he had not developed that capacity. Virology is of course Dr. Redfield’s area of expertise, but he won his political post in no small part by being practiced in massaging truth statements for political ends. During AIDS outbreak, the last major plague in the United States, he had advocated unproven drugs billed as HIV vaccines and encouraged quarantine, abstinence, and stripping the medical licenses of HIV-infected medical workers, more than accelerating cures; Redfield took time to blame the Obama administration for implementing clinical tests, to please his patron. Bt he obscured the level of infections that in truth were not known, blinding the nation to a cartography of COVID by not advancing adequate levels of testing, that returned us to the simple equation of the dog days of AIDS, only able to make us yell, yet again, this time with Larry Kramer, stalwart resistor of the silencing of AIDS by the failure to use on-trial medicine–
–at the utter deception with which we met the pandemic. Dr. Redfield must have met his commission to radiate calm by assuring Americans in late February. As he assured us only fourteen cases had been diagnosed in the United States, the number meant little, as any virologist should kmow; while hindsight is a benefit that obscures us from the need to life life forwards, we suspect urban hotspots were already laden with infected individuals by March 1, a silent ticking bomb of urban outbreaks already infecting 28,000 as it spread broadly its “hotspots”–New York, Chicago, San Francisco, Seattle, Boston and Chicago–all of massively different density, without tests being able to affirm the scale of its spread.
There was no map. And then, all of a sudden, the globalization of coronavirus hit home; any place in the world could be related to any other place, as rates of infection bloomed globally in geographically disjointed hotspots, spatially removed from one another, even as a standard for uniform testing lacked. And there was no sense of an art of dying, as the amazingly rapid contraction and worsening of illnesses left many without a script, and many more silent before a dizzying multiplication of statistics of mortality in the face of COVID-19, several weeks later.
Every other map of COVID-19’s spread seems an attempt to persuade the viewer of its accuracy and totality, in retrospect, even as we have no clear sense of the total figures of infection-or even of the paths infection takes. We are mystified by the geography and spatial dynamics of the virus’ travel, but realize the severe communicability of a virus whose load is stored in the naso-laryngeal passages, and can be communicated by airborne drops. Is distancing the best way we can constrain the geographic spread of infection? Can statistics demonstrate the success of curtailing its spread?
It was a hidden agenda in the maps of news agencies and to register the accurate levels of infection, promising the sorts of transparency that had been clouded in much of January. And while we watch the progress of the pandemic on screens, there is a sense of truth-telling, as a result, of revealing the scope of the virus’ actual spread that compensates for the lack of clarity we once had. But it is also increasingly difficult to orient ourselves to the GPS-enabled scales of its spread, for we still are looking at pretty limited and almost superficial data, in the sense we have trouble plotting it in a narrative context, or find a reaction more than shock. The virus is easy in ways to personify as a threat–it wants us outside; it comes from afar; it pervades public spaces and hospital grounds; it demands vigilant hand-washing and sanitizing–but the very numbest are elusive. While we try to track reported cases, hoping that these limited datasets will provide orientation, we have been lumping numbers of tests that might be apples and oranges, and have not found a consistent manner of testing. Deaths are difficult to attribute, for some, since there are different sites where the virus might settle in our bodies.
Even while not really following the pathways of its transmission, and the microscopic scale of the progress of the pathogen in bodies. And if we rely on or expect data visualizations will present information in readily graspable terms, we rarely come to question the logics that underly them, and the logics are limited given the poor levels of global testing for COVID-19. It is frustrating that our GPS maps, which we seem able to map the world, can map numbers of surrogates for viral spread, but we have yet to find a way to read the numbers in a clear narrative, but are floored by the apparently miasmatic spread of such a highly contagious disease that makes us feel, as historian of science Lorraine Daston put it, that we are in “ground zero of empiricism,” as if we are now all in the seventeenth century, not only in being vulnerable to a disease far less dangerous or deadly than Yersina pestis, but without explanatory and diagnostic tools.
This was, to be sure, a past plague come to life, requiring new garb of masks, face-shields, and protective gear for health workers–
–as the cloaks, leather gloves, staffs and masks that made up early modern protective gear returned to fashion, as if in a time warp, in new form.
We find a leveling between folk remedies and modern medicine, as we live collectively in what she calls a “ground-zero moment of empiricism”–if one in which we are deluged by data, but short in knowing what is data, as we are lacking in explanatory models. This is a bit unfair, as we still can profit from autopsies, and have been able to contain spread by hand-washing–but the images of a single magic bullet, or antiviral cure, are far, far away in time. But there is no longer any familiarity with an art of dying, although we found we encountered death with an unforeseen and unpleasant rapidity: we moved from hopes for awaiting immunity or antivirals to a basic need for some consolation of our mortality. There was no possibility of transcendence in a crisis of mortality of dimensions and scope that seem outside the modern era.
And it is ironic that distancing is the best mode to prevent infection–and many deaths may have been enabled by quicker decisions to adopt practices of distancing that could manage viral spread, Trump seemed not to notice that the very globalization he had resisted, and swung against with all his force to win votes, had facilitated the spread of a viral agent whose arrival was denied even as SARS-CoV-2 had already begun to flood the United States, in ways we only mapped in retrospect, as a global village that by March 1 had already grown satellites of viral loads in South Korea, the Middle East, Iran (Teheran), Europe (Milan; Gotheborg), South East Asia, and Hong Kong, as we anticipated its arrival with no health policy in place and no strategy for containing what was already on our shores. The global crossroads defied any choropleth, but we had only mapped the virus for some time in choropleths, as if believing by doing so we could not only map it by national boundaries to keep the virus at bay.
New York Times
But if we lacked a model of infection and communication of COVID-19, we lacked a sense of the geography by which to understand its spread–and to map it–and also, deeply problematically, an inter-agency coordination to assess and respond to the virus’ spread as we sought to contain it: and in the United States, the absence of any coordinating public health agency has left the country in something like free-fall, a cluelessness emblematic by a map cautioning American travelers to take enhanced protections while traveling in Italy or Japan, two major destinations of travel, and avoid all nonessential travel to China, but refrained from ceasing travel plans.
1. The most compelling language of the novel coronavirus is “false positives” and “false negatives,” that seem to betray the unsure nature of standards; the most haunting is the multiple sites COVID-19 can appear in the sites of the body we use to map most disease. While we associate the virus with our respiratory tracts, the virus can do damage to multiple organ systems, as well as create blotchiness of “covid toes” due to burst peripheral blood vessels; it can damage multiple organ systems simultaneously, including the kidneys, heart, lungs, brain, and linger in our intestinal tract where it can flourish and proliferate; the virus can reduce the ability of our blood to form clots, or disable our ability to form clots. The ACE-2 receptor protein, a launching pad for viral infections, lies in our lungs and respiratory tract but in stomach, intestines, liver, kidneys, and brain. Increased sensitivities among those suffering from high blood pressure, cardiac disease, and diabetes reflect the nosological difficulties of classifying the virus as a cause of death or to grasp it as an illness, let alone to read data about the disease. If the virus lodges in the most delicate structures of the alveoli, which it causes to collapse as it infects their lining, it can take multiple pathways in the body, and as its pathway of infection may be multiple, medical response must be improvised with no playbook for clinical care.
All we know is that our medical staff desperately need protective gear. On top of that, it hardly helps that we are without a clear national policy, and find that the United States government has engaged in far less transparency that one could have ever expected.
We can only say its spread is accelerated dramatically by structures of globalization, and it stands to disrupt them. utterly Even as we map what seem total global knowledge of the disease, analogous to what we have come to expect from Global Positioning System, the multiple holes in our picture of the spread of the disease provide little sense of mastery over the pathways of communication, contraction, and infection we have come to expect from maps. These maps may even be especially disorienting in a world where expertise is often dismissed in the United States–not only by the U.S. President, but out of frustration at the inability to distance, diagnose, track or supervise the disease that is increasingly threatens to get the better hand. Have our visualizations been something of a losing battle, or a war of atrophy we will not win? Or do we even know what sorts of data to look at–indeed, what is information that can help us process a sense of what might be the geography of the contraction or the transmutability of the virus? Is the virus eluding our maps, as we try to make them? These sort of questions of making sense may be the process of science, but they trace, suddenly, a far steepder learning curve than we are used.
A dismissed biomedical researcher who ran efforts to develop a vaccine cautioned that we still lack that the failure a trusted, standard, and centralized plan for testing strategies must play a part in the coordinated plan “to take this nation through this response.” Dr. Bright, who was abruptly removed last month from his position as head of the Biomedical Advanced Research and Development Authority, bemoaned the limited statistics, alas, in large part as fear of providing too many tests–or fanning the flames of insecurity that testing might promote in the general public and in our financial markets, seem to have created the most dangerously deceptive scenario in which the United States seems to be committed to projecting confidence, even if it is the global epicenter of the pandemic.
Have we developed a language to orient ourselves to the scale of emergency in the spread of COVID-19? While we turn to images of natural disasters in describing the “epicenter” of the outbreak in Wuhan, this hardly conjures the species jump and under-the-radar communication of the virus that was not tracked for months before it emerged as a global threat. In tracking COVID-19 globally, or over a broad expanse of nations or states, we often ignored the pathways by which the novel coronavirus is spread in crowded spaces, where the single strand of RNA may hang in droplets that linger in the air, and are looking at the small scale maps to track a microscopic pathogen. But we are increasingly aware the spread of these strands, of the virus SARS-CoV-2, that infect populations along increasingly unequal fault lines that divide our cities, nations, health care systems, and crowding, or access to open space, are all poorly mapped in the choropleths into which we continue to smooth the datasets of infections and hospitalizations. While the problems are posed for national health services in each region, the devastation and danger of overloading public health systems and hospitals outweighs are local manifestations of a global crisis of the likes we have not confronted.
2. And the crowding of such numbers beyond the buffers that began with lead to a visual crowding by which we continue to be overwhelmed–and will have been overwhelmed for some time.
April, COIVID-19Iinfections Globally by Country/Clustrmaps May 12, 20202020
For although the global pandemic will clearly be with us for a long time, spatial narratives might be more likely to emerge in networks and in forms of vulnerability, in ways that might reveal a more pronounced set of narratives for how we can respond to a virus than the deep blues of even the limited and constrained datasets that we have, as we struggle against the blindness we have in containment and mitigation, and the frustration of the lack of anything like a vaccine. (This pandemic is almost a metastasis of the anti-vaxxers: confirmation that a vaccine cannot check a disease, it gives rise to concerns that vaccinations might have left us immunologically more vulnerable to its spread . . .and a sense that the hope of eradicating COVID-19 by the availability of a vaccination in four to five years will be widely resisted by anti-vaxxers and their acolytes, to whom the pandemic has given so much new steam. Yet as the virus interacts with the viral posting of anti-vaxxers resisting social distancing or collective policies of response, the stresses that exist in our society will only be amplified.) And if as late as February 24, only three laboratories in the United States did test for COVID-19–artificially lowering public numbers–even confirmed numbers through March and April were as a result tragically low. Could maps even help to track the disease without a testing apparatus in place?
Global Covid Infections/Datascraped by Avi Schiffman, May 11, 2020
The prestige of the data visualization has been a basis for reopening the nation. Yet if less than a tenth of the world’s population has yet to be exposed to the disease–and perhaps only 5% of the American population, in one estimate, if not lower–the virus is bound to be endemic to the global landscape for quite a considerable length of time. At the same time, one must wonder if the many fault lines that have created such peaks and valleys in the virus’ spread, if confirming its highly infectious nature, to be sure, are not removed from us in some degree by the smooth surfaces of the screens on which we watch and monitor, breath bated, with some terror, its spread, unsure of the accuracy or completeness of the data on which they are based but attentive to whatever they reveal. In many ways, these maps have created an even more precarious relation to the screen, and to the hopes that we find some sign of hope within their spread, or hope to grasp the ungraspable nature of COVID-19.
These datamaps suggest a purchase on a disease we don’t understand, and we don’t even have good numbers on contraction. Yet we are discussing “reopening” the United States, while we do not have anything approaching a vaccine, let alone the multiple vaccines that medical authorities desire before resuming social contact at pre-pandemic levels. How to process the data that we have, and how to view the maps not only by hovering, zooming in, or distancing the growing rates of infection, but tracking the virus in spaces, mapping levels of infection against adequacy of testing, mortalities against comorbidities, against with the chronic nature of the virus must be understood, as well as levels of hospitalization levels; and distinctions or mutations of the virus and against age ranges of afflicted–by, in other words, drilling beneath the datasets to make our maps’ smooth surfaces more legible, as horrifying as they are?
Can we use what we have to pose problems about the new nature of this contagion we don’t fully understand, but has been mapped in ways that seek to staunch fears of a decline in the stock market, as much as an emergency of public health, with up to one third of the population at risk of infection? The instinctive reaction of the Trump Health and Human Services to create public-private “community testing sites” for drive-thru or drive-up testing at Walgreens, CVS, Rite Aid, Kroger and other pharmacies seems reflexive for a government wanting to minimize federal overhead, but a far less exact means, and a far less intuitively sensible basis to attract potentially infected individuals to sites of public congregation. The hope of Verily–a subsidiary of Alphabet, whose Project Baseline boasts the slogan, “We’ve Mapped the World, Now Let’s Map Human Health,” in a bizarrely boosterish rhetoric, aggregates medical for medical screening in California–
Select States for Project Baseline Testing/Verily
–and select states–was the primary response that Trump had promised of a network of drive-up testing sites that has never materialized, even as it expanded to a hundred sites in thirty states. After Walmart opened two sites, and Walmart 40, the difficult accuracy of creating multiple testing sites was prohibitive, the testing sites that were rolled out with the assistance of private entrepreneurs that Jared Kushner enlisted, that filled the absence of any coherent public health response–perhaps, terrifyingly, in concert with his brother’s health care company, Oscar, which also partnered with CVS and some of the same pharmaceutical services, focussing on drive-thru sites more than sustained medical care, focussing largely on calming retailers who feared the arrival of infected patients on their parking lots, more than on the efficacy of testing, which they didn’t understand. If only 40% of promised test kits were made available, the absence of providing staffers or selling, as in Massachusetts, self-testing kits–and failing to provide many in large cities like New Orleans, as if to keep the final tally of infected artificially low. Even if the Center for Disease Controls had never done clinical tests on hydrochloroquine, whose dangers on humans were not studied, and despite some benefits of the antiviral on cell cultures, none appeared in mice, the drug was promoted widely on social media as late as April, although its mention on Twitter grew, even as the government delayed any roll-out of testing sites.
The demand to calm the nation, a position dangerously close to concealment, delayed action on a wave of infection that President Trump had long sought to deny, claim to be overblown, or call Fake News. The lack of a public testing initiative, and rejection of the tests of other nations, forced the United States to adopt a disorganized go-it-aloneist approach, akin to isolationism, not benefiting from the potential ties to Chinese doctors’ response, or the testing kits that would have been available that the World Health Organization (WHO) had suspected since January, and made test kits for poorer countries that might be replicated in the United States–which chose to make its own tests to ensure the highest quality. When WHO had urged countries “test, test, test” for the coronavirus to contain its spread, the global health organization provided 1.5 million tests to 120 countries who lacked the ability to test by March 16; the United States went without the diagnostic tests developed in Berlin by la Charité, implemented in Germany. If the United States had submitted a test to WHO as well, the German test the health organization adopted was never used or ordered–and by mid-March processed a sixth the specimens as in Italy, with found over six times as many cases, and an eleventh as in South Korea, which found double the cases.
By April, the picture had improved, but not much.
COVID Tracking Project (Data)
And based on later data of the virus that spread to other American cities, the virus that had infected so many in New York seems to have spread to other American metropoles by May, as we were still awaiting broad testing.
If elites have long harangued lower classes for continuing behavior that continued to spread disease, interpretation of the spread of illness has rarely divided so strikingly along separate interpretations. It is as if life or death matters were open to public debate: rarely have reactions to an infection been able to be received so clearly along partisan lines. While reaction to COVID-19 were long cast in partisan terms by the President, our Fearless Leader of Little Empathy, as far overblown, the surprise was perhaps that even as the data grew, and the exponential growth of infections in American cities began, the decision to announce Shelter-In-Place directives in hopes to “flatten the curve” shuttering non-essential businesses with increased fears of overloading public health facilities. As anti-vaccination movements grew in the United States, the skeptical strain of coronavirus denialism grew with anti-federal government movements, and the weak national public health policies in America created an uneven topography of health care as the mapping of infections provided no real sense of orientation at all: no one knew what to expect, but the uncertainty of prognosis created levels of unprecedented anxiety about disease spread, as we all visualized the worst, and grew more addicted to maps than ever before, and on more insidious platforms, remapping the causes, consequences, and corollaries of Covid’s spread–and trying to “stack” data visualizations, as if we were all experts not only in infectious disease and epidemiology, but of data visualizations–how hard could that be, actually?–too.
Faced by drastically uneven hospital bed capacities in individual states, reflecting existing fears of hospital bed capacities for intensive care units or floor beds, and deepening fears of needs to add increased beds across the nation, to confront a major public health emergency. Using different scenarios of increased needs for beds based on infection rates, a relatively moderate need for beds: infection of a fifth of the population in six months would compel expanding existing capacity for beds in multiple western states already hard-hit form infections, like Washington and California, east coast states, including Massachusetts and New York, and Midwest’s like Ohio, Michigan, and Minnesota, and many pockets of other states, including Louisiana. Actual fears of such an impending emergency of public health emergency —
–grows even sharper if one allows oneself to imagine an expansion of infection rates to 40%–not unheard of for the highly infectious novel coronavirus–over the same six month period:
1. Even as “Shelter-in-Place” measures sought to staunch the spread of infections across the nation, the uneven nature of the measures adopted by state governors, mayors, and counties suggested a fragmenting of the nation, as the governors of many states reacted to the issuance of shelter-in-place orders or stay-at-home directives by declaring their separate rule of law, in the words of Alabama’s Governor, “we are not New York state, we are not California–right now is not the time to shelter in place.”
Shelter in Place Measures Confined to Bay Area/Washington Post, March 15
Yet if the confirmed infections of the novel coronavirus seemed concentrated in preponderance in Louisiana, California, and New York, the virulence of its transmission was far more widely distributed, Philip Bump created a simple overlay to show, and the readiness of imposing measures of restriction were often resistant to accept school closures, or shuttering bars and restaurants as a means to restrain the virus’ spread.
Such choropleths are poor indicator of concentration and dispersion of infection, or of the “hot-spots” early watchers of the novel coronavirus hoped to isolate, folks commuting from counties of identifiable outbreaks created an immediately far more complicated map of viral dispersal, often crossing state lines and state jurisdictions at the very start of March, as work commuting alone bled from 34 counties into 1,356–even into Mississippi!
Despite some a lone call the President impose a national shelter-in-place order, but the response of asking for a collective sacrifice would be hard to imagine. But the animosity that Trump revealed to any governors who tried to impose a policy of social distancing has intensified a new sense of federalism, as the increasing opposition that President Trump has directed toward Governors who have responded with attempts to enforce social distancing led, mutatis mutandis, to a new call for “liberating” states from social distancing requirements, President Trump announced April 21 that “We are opening up America again,” with great content, heralding an “opening” across twenty states comprising two-fifths of the nation’s population, if partial reopening are only slated in eighteen states.
But how could one say that the need for social distancing was not increasingly important, in a nation where health care is not only not accessible to many, but that hospital bed capacity is uneven–and would need to be ramped up to serve the communities–
–but that many areas are distant from ready testing, diagnosis, or indeed the ability for easily accessible health care? What is COVID-19, if not a major wake-up call for disparities in public health and medical access?
New York Times
–and many regions suffer severe health care professional shortages, that have been obscured in the deep shortages of health professionals, according to Rural Health Info, who have revealed these gaps in the following infographic, but many towns in each county remain difficult to get to hospitals in time in cases of emergency or need.
2. The legitimacy offered to “re-opening” states for business channeled a rousing sense of false populism across the nation, courting possible onset of a second wave of infections by easing llocal restrictions on social distancing–although testing is at a third of the level to warrant safe a transition, several governors claim “favorable data” to justify opening shuttered businesses. But when @RealDonaldTrump retweeted an attack on public safety measures against COVID-19 that were enacted in California and other states to slow airborne viral infection that labeled the closures of bars, restaurants, and theaters as revealing local states’ “totalitarian impulses” in the face of COVID-19, as having effectively “impaired the fundamental rights of tens of millions of persons” and flagrantly abrogating constitutional rights and natural liberties: the endorsing of a tweet of former judge, Andrew Napolitano, of an open “assault our freedom in violation of Constitution” demeaning sheltering policies as”nanny-state rules . . . unlawful and unworthy of respect or compliance,” inviting the sort of social disobedience, encouraging the stress-test on our nation that the pandemic poses be generalized?
COVID-19 Infection Rates in United States/New York Times/March 27, 2020
While the calls to prevent violations of the U.S. Constitution have grown in recent weeks from March to April, it makes sense to question the validity of an eighteenth-century document to a public health emergency–or to abilities to respond to a zoonotic disease of the twenty-first century. Never mind that such arguments ignore the reserving of rights of state governors in the U.S. Constitutions Tenth Amendment to protect the safety, health, and welfare of the inhabitants of their territory, is the ability to manage state health not a calculus for public health officers, rather than a partisan debate? There is a despicable false populism and rabble rousing in decrying “nanny-state rules” as “unlawful and unworthy of compliance,” and covers for “assaults on freedom” as a Lockeian natural right. Yet in retweeting such charges and denigrating policies of social distancing as “subject to the whims of politicians in power,” President Trump perpetuated the notion that medical consensus was akin to an individual removed from public concerns. In doing so, Trump echoed the opinion of a member of his own Coronavirus Economic Advisory Task Force, Heritage Foundation member Stephen Moore, to protest “government injustices” echoing false populist calls to “liberate” Michigan and Minnesota from decrees of Democratic governors. As Moore called for further protests, opening a group, Save Our Country, dedicated to agitating for the reopening of states, out of concern for the “abridgment of freedom” of sheltering in place.
The call to arms over a rejection of social distancing emphasized the translation of the pandemic into purely partisan terms, and echoed the partisan resistance to the states-right discourse of a rejection of health care, using the panmdemic to divide the nation along party lines.
3. The weekend before SIP was announced in the East Bay, my daughter’s High School suspended, and I snuck out in the mask-free days for a Monday morning coffee at my favorite café, where my friend Mike caused some consternation in line by ordering through his black 3M facemask. The mood was survivalist and grim, but we stopped outside our local Safeway, as if to provisions before an impending lockdown, looking for half-and-half. Staring me in the eyes, Mike said with some resignation that the massive mortalities in northern Italy were our future in a week at most, as the spreading waves of infections migrated crosscountry, approaching in something like a delayed real time; the question was only when “It’s gonna happen here.”
What was happening across the Atlantic Ocean was trending not only on social media, but was being attentively followed by epidemiologists like Dr. Cody, apprehensive of the state of development of pubic health across the entire East Bay.
The Public Health Officers in the region had been haunted by the vision, alerted by the tangible fears of the Santa Clara Public Health Officer, Dr. Sara Cody. That very day, Cody was convening the coming early Monday morning, gripped by a sense of panic for a need for action, as the public drinking festivities of St. Patrick’s Day loomed, and as Chinese health authorities curbed travel and cancelled New Years celebration, even if its airborne communication was doubted, in hopes to contain an outbreak that still seemed centered in its largest numbers in Wuhan province–
Quartz, January 22, 2020
4. It was if we were watching in real-time image the global ballooning of COVID-19 infections in the Bay Area feared was on its way to Silicon Valley, or the entire Bay Area, as the virus traveled overseas. The lockdown that had begun in northern Italian towns in a very localized manner from late February when a hundred and fifty two cases were found in Turin, Milan, and the Veneto, had, after all, only recently expanded to the peninsula, filling Intensive Care Units of hospitals or transforming them to morgues. Although elegant graphics provided a compelling narrative, with the benefit of retrospect, that “Italy’s Virus Shutdown Came Too Late,” the interactive story of a “delayed” shutdown after the February 24 shutdown of sites of outbreak within days of the first identification of an infection in Milan, across two “red zones” around Italian cities, and the March 3 cordoning of larger areas.
February 24, 2020 Lockdowns in Northern ItalyLockdown in Response to COVID-19, March 8 2020
The reluctance to impose a broader shutdown over the northern economy created a tension between commerce and public health that led to a late ‘shutdown’ of the movement across the peninsula by March 10 to prevent infection risks, haunted by public health disaster.
Multiplication of COVID-19 Cases in Italy, February 27-March 12, 2020 BBC
Fears of the actuality of a similar public health disaster spreading under her nose led Dr. Cody to convene a quick check-up with local public health officers to see if they registered a similar alarm, and what policy changes were available across a region whose populations are so tightly tied. And the need to convene a mini-summit of Public Health Officers to take the temperature of willingness to recommend immediate public policy changes was on the front burner, as one looked at the huge difficulty of containing the outbreak in Italy–often argued to not have been responded to immediately enough, but revealing a full public health response that the Bay Area might not be able to muster, as Italy’s hospitals were flooded by patients with infections and was on its way to become the site of the most Coronavirus deaths.
Vivid fears a growth of COVID-19 filling the hospitals and emergency rooms after St. Patrick’s Day–an event for a far larger audience contracting the aggressive virus–led Dr. Cody to arrange a group call among the Public Health Officers in San Matteo and San Francisco early Monda. Dr. Cody had broad epidemiological training was rooted in an appreciation of contagious disease–including contagious diseases outbreaks like SARS, H1N1 influenza, and salmonella, and had worked on planning for public health emergencies and completed a two yer fellowship in Epidemiolgoy and Public Health, managing E. coli outbreaks as an Epidemic Intelligence Service Officer with CDC. Fears “crystallized” quickly of a scenario of similarly exponential rise in case loads making Silicon Valley a new epicenter outbreak of an epidemic overwhelming the public health services. As she quickly contacted Public Health Officers in San Francisco and San Matteo, to contemplate a response, by March 8, a lockdown in all Lombardy and other states was declared, as COVID-19 cases multiplied, in a chilling public health disaster replicating the lockdown in China.
In contrast to the uncertain public health numbers from China, as the city’s airport, highways, and rail stations, images of massive mortality from health care disasters in Italy were haunting and suddenly far closer in space, even if cases of viral infection were already reported in each province, Macao, Hong Kong, and Taiwan–revealing a global pandemic that linked place to a global space in ways difficult for some to get their minds around. The honesty that came out of Italy was an alarm.
The Bay Area health authorities were looked with apprehension at the arrival of St. Patrick’s Day celebrations, after the exponential growth of infections from COVID-19 in the region: Dr. Mirco Nacoti had just published an eye-catching account of the catastrophic conditions of Ospedale Pap Giovanni XXIII in Bergamo that weekend, describing the levels of general contamination of caring for COVID-19 patients, for whom over two thirds of ICU beds were reserved, and filled a third of 900 rooms in thd peer-reviewed NEJM Catalyst; he described phantasmagoric scenes of a hospital near collapse as patients occupied mattresses on the grounds, intensive care beds had long waiting lines and with shortages of both masks and ventilators, and poorly sterilized hospitals became conduits for the expansion of diseases. The clinical model for private care incapacitated, as patients were left without palliative care; a surge of deaths in overcrowded wards overtook China’s community-based clinics at such higher death rates of 7,3% Italian doctors plead felt incapacitated by the surge of cases overflowing at intensive care units from March 9-11 as a model for mass infection, before COVID-19 was declared a pandemic.
The desperation of a staged re-enactment of Michelangelo’s Pietà of L’Espresso were a few weeks or so off. While the spread of infections in our region had not yet begun, ant eh below photoshoot by Fabio Buciarelli did not appear until April 5, we were still formulation the desperation of confronting the ravages of disease we lacked time to develop any reactions, processing current or impending mortality rates.
Fabrizio Bucciarelli/COVID-19 Pietà. 5 aprile 2020, L’Espresso
The danger of trusting scientific modeling, or data, and fostering deep suspicions of trusting data on confirmed infections, or modeling that suggested the danger of failing to practice social distancing.
5. Decisions to “shelter in place” promised to “slow the spread” of COVID-19 transmitted widely in group settings, and able to create a public health disaster in the Bay Area, and was quickly followed by Santa Cruz county. After the growth of cases in Santa Clara county–whose rates of infection doubled over the weekend to 138 as of Monday–the absence of a any national restraining order save a suggestion to social distance, as Seattle cases of infection had grown to 400–and some 273 cases of infection had appeared over th weekend, despite limited testing availability.
The clear eventuality of a public health disaster, after a directive closing bars, night clubs, and large gatherings, as well as many school closures in San Francisco and the East Bay–where my daughter attends Berkeley High, whose doors shuttered on March 13; Los Angeles’ mayor, Eric Garcetti, closed bars, gyms, movie theaters, bowling alleys and indoor entertainment on late Sunday night, as Gov. Newsom encourage all elderly to self-isolate immediately. The 6.7 million in the Bay Area early agreed on the need for a “shelter in place” order as a basis to control the spread of COVID-19 that had been discovered in the region on March 16, 2020, anticipating the nation by some time.
The closure of all non-essential businesses in the seven counties sprung from the epicenter of Santa Clara county–Silicon Valley–but included affected a much larger area of commuters, no doubt, across an interlinked region of commuting far across the northern state to twelve other counties.
The cases in Italy would only grow, creating a textbook case of the exponential expansion of illness that killed a terrifying number of physicians in hospitals on the front lines against its expansion, as the arrival of medical supplies and medical viral specialists from China increased the logic of the lockdown as a response to its spread.
The evident stresses on the health care system of Lombardy, where a terrifying number of physicians on the front line contracted the virus and died, in the wealthy region of Lombardy, distanced the disease whose effects were projected or distanced onto China, and provided a clear scenario that Cody understood could be repeated, with even worse consequences, in the crowded population and limited health facilities of Santa Clara County: her own close ties to public health authorities in Italy made the exponential growth of cases from February 21 across the peninsula seem a preparatory run-through for a future disaster, as China was sending increasing medical supplies and specialists to Italy in a global story as a pandemic was declared in China March 11; northern provinces were declared under lockdown March 8 quickly extended to the nation, as a spike in 1,247 cases were found on the previous day.
When Cody urgently alerted San Francisco Public Health Officer, Dr. Tomás Aragón, to discuss the fears of a new epicenter of COVID-19 spread in Silicon Valley, they did not start by contemplating their authority to issue a legally binding directive to shutter businesses in the region. But as they discussed consequences of the exponential increase in Santa Clara County and the greater danger of facing an analogous overwhelming of pubic health hospitals as in Italy, haunted by a danger of a similar scenario overwhelming public health, and Cody’s tangible fear, Aragón floated the idea of a shutdown, acknowledging their authority of acting without permission of governors.or mayors or county supervisors; the call touched on a series of calls to debate options, including the most dramatic — a lockdown order–which seemed the only certain means to enforce isolation and social distancing haunted by the image of the increased diagnosis of COVID-19 across the Italian peninsula that would indeed only be publicly released March 18. Two days later, Governor Newsom expanded the policy to the entire state; the time lag meant that by late April, almost half of all infected with the novel Coronavirus in California were found in Los Angeles County, and were facing the prospect of overloading its public health system and hospitals.
Diagnoses of COVID-19 in Italy/ Ministero di Sanitá, March 18 2020
The influence of the health care provider Kaiser Permanente was unseen, but the preventive agenda of the health provider can be seen in a sense in the shadows of this quick consensus among six Public Health Officers. But the qyuick defense of the decision–soon followed by dozens of states since–suggests the prominence of Kaiser Health Care in the dynamic of emphasizing preventive health care, and in anticipating epidemiological spread. Cody’s brave insight into the fact that northern Italy provided a rehearsal for the public health disaster, shifting from the ban on mass gatherings to a concerted effort to isolate millions, was less apparent to the nation.
Tracking the progressive advance of Ebola virus in West Africa in an animated HealthMap projection created an eery sense of inevitability of the virus’ unprecedentedly rapid diffusion. But the mapping on a Google Maps platform so removes the virulent spread of the virus from any context, noting suspected and confirmed infections and fatalities in a bubble map, to poorly embody the scale and scope of threat of contagion. Omitting the distinct terrain over which the strain has expanded from rural areas to urban slums, and the complex vectors of the new strain’s transmission almost conceal the reasons why this outbreak has been so hard to contain adequately, and leave one raising perhaps unanswerable questions about the delay of an orchestrated or more effective response to contain or try to control its increasingly exponential spread.
The rapidity with which microbes from the very rainforest allows the virus spread to highly vulnerable populations of Guinea, Liberia and Sierra Leone, as well as, recently, both Nigeria and Senegal–populations particularly vulnerable to the current strain–foregrounded in a time-lapse sequence of those infected with the deadly virus uses a Google Maps platform and template to map the spread, but might be taken as something of a challenge to better map the virus by refining our image of the virus’ transmission and catastrophic spread. If such widely circulated maps provide a basis for describing the challenge of containing the virus’ spread, they also present a challenge for better mapping the transmission of Ebola virus and reviewing reasons for slow response, perhaps as we hoped the contagion would not emerge to be so virulent as it has become. Were we confident in the containment of the disease, or were we not mapping the multiplication of pathways of its transmission? What sort of maps can we now make to better understand the specific distribution of the disease? Did our own reliance and use of apparently exacting maps, which were only as good as the data that they were fed, conceal a delay in broadcasting early warning signs to the world?
If this is the case, it makes sense to ask if an unwarranted trust in the metrics of mapping has contributed to a lack of clear understanding or reporting on how the disease has spread. The outbreak that has outpaced previous outbreaks of the virus in central Africa challenge our models for mapping Ebola the spread of the deadly virus–whose mortality rate has at times been estimated as high as 90%. Even notwithstanding the low resistance of the populations of West Africa, and its location in a region of recent urbanization–unlike the rural areas of Central Africa where outbreaks had been previously confined–the unprecedented levels of human-to-human transmission challenge us to map the contagion we seek to control in ways that can best process the very rapid transmission of the virus and its advance across six countries with varying rapidity.
The numbers noting rate of mortality in the above map threatens to overwhelm our sense about the virus’s spread by privileging the rapidity of its contagion and not examining causes for its diffusion or vectors of its virulence. The HealthMap announcements have become the recognizable image of its spread. But despite the apparent authoritative HealthMap graphics as mapping the disease’s first appearance on March 19, a full “nine days before the World Health Organization formally announced the epidemic,” notwithstanding the considerably large investment in Health Map of the US government’s Intelligence Advanced Research Projects Activity (IARPA), rather than standing at the forefront of health reporting and surveillance, the first maps HealthMap issued in fact antedate the first news conference of the Guinea’s Department of Health of the Ebola outbreak, reported in the first news articles on a “hemorrhagic fever” which summarized the news conference of the Director of Disease Prevention, Dr. Sakoba Keita. While we have focussed on the HealthMap graphics for the authoritative clarity with which they mapped the virulent disease’s outbreak, forecasting systems played little role in detecting the virus–and little advanced news of the outbreak beyond traditional news sources.
The rhetoric of the map has masked the lag that occurred in the first diffusion of news reports of the hemorrhagic disease. The unfolding of the maps of the disease’s spread display a similar reluctance to listen or observe on the ground, but rather to synthesize data in what has become something like a proxy for direct observation or reporting. The limited spatial context for the generic Google Maps platform used on HealthMap especially obscures, on account of its lack of spatial precision, the complexity of new vectors and sources of transmission that differentiate this outbreak from Ebola outbreaks in the Democratic Republic of Congo over the past fourteen years. For it maps the disease only by registering numbers in vague national conglomerates–often using incomplete numbers reported by local agencies. While the first cases appear to the Guinean forest, the spread infection to urban areas and slums offers a powerful chart of the outbreak that–unlike earlier outbreaks of Ebola in central Africa–gained a virulence that challenged both public health authorities and residents who had little exposure to the animal-born disease.
The crowding of states with tan and brown bubbles to designate human suspected or confirmed infections obscure the dynamics and dangers of Ebola’s transmission to a rapidly urbanizing landscape, and are silent on the dangers of confronting the wide range of potential pathways of its transmission that we seek–and indeed are ethically obliged–to contain. Maps provide forms for embodying as well as tracking diseases, practices of mapping can both communicate the exponential expansion of fatalities of infected victims across space, and suggest potential future strategies for their containment. Were we only hoping that, as earlier outbreaks in the Central African Republic or DRC, the West African outbreak would be contained, without considering the multiplication of vectors by for its contagion, or the new terrain and new populations to which it had spread? Or did we fail to map its dangers as quickly as we could have done?
1. The lack of qualitative or specific details in these maps treat them as registers of the exponential expansion of epidemiological updates. Whereas no previous outbreak of a strain of the diseases has produced more than several hundred cases, the virulence of the specific strain of Ebola, previous confined to rural areas, may rest in the multiple vectors of its transmission and the difficulty containing new vectors for the transmission of Ebola, easily communicated through contact with bodily fluids or blood, leading to a far greater expansion of human-to-human transmission of the disease than occurred in recent history. Shock at its spread displaces the vectors of contagion by which Ebola has so rapidly and virulently spread. Indeed, the current reproductive rate of the disease suggests its expansion will continue most dramatically.
When epidemiologist Michael T. Osterholm warns “the Ebola epidemic in West Africa has the potential to alter history as much as any plague has ever done,” the comparison may illustrate both its extreme danger and potential significance, and a need to reconsider how we have charted the contagion’s spread. Plague was, of course, misunderstood as a miasma and not examined as being transmitted from the bacteria carried on fleas resident in rats. While we don’t still know the natural reservoir of the virus, or the relations between different strains of Ebola virus, the pathways of its contagion challenge our ability to map the vectors of viral transmission–and the mapping tools we might better use to contextualize its virulent spread from its epicenter in the Guinean forests. Despite repeated warnings of the dangers that the consumption of infected carcasses as bush meat constituted a neglected source of its transmission, the expansion of human-to-human transmission has obscured its animal-born origins. The continued possibilities for infection from the meat of carcasses of animals infected with the virus moreover creates new problems as the WHO works to contain the spread of microbes dwelling in the very rainforest that spread to vulnerable populations in Guinea to recur in Liberia and Sierra Leone, as well as Senegal and Nigeria–whose populations seem particularly vulnerable to the current strain.
The need for a map that charts the spatial transmission of the disease, which has itself proceeded jump borders and region divides with ease. Such boundary lines name the different public health authorities that are forced to face the ravages of Ebola, which may offer a haphazard barometer to calibrate the global danger of the danger, but might obscure the ways humans were infected by the virus in recent months. Already by March 23, cases of the virus were suspected near where it claimed its first victims:
HealthMap/Boston Children’s Hospital
The first documented documented cross-border spread of the disease, according to tropical medicine specialist Dr. Estrella Lasry, occurred in late March–about the time that the outbreak was first reported by Guinean authorities to the WHO. In over just a month, by April 20, the distribution of suspected cases had dramatically grown, in ways that would have already suggested the substantial threat of its growing incidence of what had been confined to inland areas, and had not been associated with the region: the migration of the disease from forested and rural areas to cities marked the first time urban occurrence of hemorrhagic fevers in urban slums, in crowded areas where it dramatically spread, overwhelming health care workers whom it affected in great numbers, and the fear of its international spread prompted military-enforced cordon sanitaire at border areas, as more affluent areas trusted in their access to superior health care protected them from the growing diffusion of the infectious disease even as it spread.
HealthMap/Boston Children’s Hospital
The concentration of infections seem relatively concentrated, but had taken on particular virulence on in Liberia–a country with limited health care facilities or health-care workers. And by July 8, the area of those infected by disease had grown broader and deeper in density, and any hopes that the outbreak would stay in a concentrated area disappeared, although international attention was only gained as the virus arrived in Nigeria in later that month.
HealthMap/Boston Children’s Hospital
And on August 5, as the contagious virus decisively multiplied in Nigeria, which, one would think, eyebrows were first raised:
HealthMap/Boston Children’s Hospital
The number of confirmed cases not only had grown, but the number of confirmed cases in Guinea and Liberia indicated that the disease was spreading both toward the Côte d’Ivoire. As of September 16, the virus had grown to new proportions and scarp, an epidemiological emergency only partly intimated by the crowded bubbles that hint at the changed profile of the infection even as they offer frustratingly few tools to process it:
HealthMap/Boston Children’s Hospital
Providing a means of grasping the spread of a disease and the dangers that it poses is an inherent property of the map, but the obstinacy of not reading the disease’s widespread infection is difficult to explain fully. Could it be that the multiplication of the vectors for the disease’s transmission were inadequately mapped?
Yet plotting confirmed incidence of Ebola tells only part of the story of the expanding risks of infection in the sub-Saharan continent, and the silences of the HealthMap graphic compromise its informative value. Recent predictions that the spread of infection by Ebola across West Africa will continue for twelve to eighteen months have confirm, if this was needed, the global scope of the health disaster, as the cascading influence of the spreading contagion for which we have no vaccine challenge the region’s food security. The expected spread of Ebola virus in new areas will continue to raise compelling questions of the ethics of care–and of the availability of provisional vaccines that will be developed as they are tested–as more than 70,000 people in much of sub-Saharan Africa seem to lie at risk–according to the fifty-two received alerts for Ebola in just a week in mid-September.
HealthMap/Boston Children’s Hospital
How did it travel so quickly after being apparently contained so long? How safe can it even be to remain, at this time, in Liberia, or to send medical doctors and workers, needed nurses, and temporary hospitals there?
This post focusses attention on the ethics of how we have mapped the virulent disease both at a remove from the landscape and surroundings where it has occurred, and the sense it makes to continue to tabulate confirmed or suspected cases of infection. For we have charted the current spread of Ebola virus spread to at risk populations, suppressing panic at its exponentially expanding scope, as we try to imagine how the infections might be contained by charting the number of humans infected, omitting the virus’ relation to vectors of transmission or hosts that may warp the dangers faced by people who might become infected in coming months. Although there is the danger that the current strain may mutate to an air-born virus, as some fear, tracking its human-to-human transmission might be placed into better relief by considering both the paths by which the virus migrated into urban areas and jumped to humans from animal hosts.
A chief difficulty of continuing to map Ebola against a base map of national frontiers and boundaries is that it contains the virus lies in locating it within fixed boundaries and perimeters–and misleadingly suggest a controlled outbreak. Maps of the region foreground numbers of dead and infected along a blank topography, moreover, in ways that conceal the potential for a qualitatively rich map of the virus’ spread from the Guinean forests, where the recurrence of the highly contagious disease first broke out in humans. Such projections of the virus ignore important questions of how the vectors or courses of transmission the outbreak have made it so difficult to contain: for we often read the maps for the possibility for human-to-human contagion, although the spread of the virus seems to mirror the possibility of several sources of Ebola’s transmission to humans from its animal hosts.
Indeed, the spread of the virus mirrors the fragility of the broadleaf forests that run from Guinea to Sierra Leone in the West and the Cote d’Ivoire, Liberia, Nigeria and Togo to the East, mapped below–an ecosystem that is an environmental “hot-spot” whose diversity is so endangered by slash-and-burn agriculture and irresponsible mining to be among the most “critically fragmented regions” in the world. The terrain reflects the contours of regions in which Ebola has spread from the very bats and primates from whom we believe the highly contagious strains of Ebola jumped. We neglect at our peril possibilities of recurrent transmission from animal hosts as we seek to map the spread of contagion at a remove from the continued consumption of such animal host as “bush meats.” The widespread contacts with meats of monkeys, rat, and bats–all affected by the virus–from the fragmented forest may have contributed to its spread to more heavily populated regions where we are now struggling to contain its transmission.
The coincidence of these regions suggests the need to map distributions of animal inhabitants as we chart Ebola’s dramatic spread across areas it rarely occurred previously–beyond the transmission of the virus by human hosts. The spread of the disease has occurred without proper precautions or an establishment of best medical practices. The worst Ebola outbreak ever confronted by doctors and medical staff was regularly met without necessary protective gear in many West African hospitals for much of the summer. As if in a terrifying apotheosis of Ivan Illich’s argument of the abundance of “iatrogenic” diseases whose transmission grows in hospital settings, we face descriptions of the frequency with which hospital beds and rooms covered with smeared feces, urine, or blood–the very prime vectors for contracting the virus–were the norm.
The inadequacy of facilities to control or treat the highly infectious disease’s spread has been facilitated not only by health-care breakdowns but an inadequate understanding or mapping of its epidemiological causes, masked in the above graphic, leading President Obama to propose the contribution of multiple mobile hospitals in order to bolster local health-care. As we brace for waves of panic, challenges to food security with a far more limited harvest, and rising food prices, map-makers will be challenged to chart the waves of multiple impact of the simple virus across the continent.
Have we understood the best models for mapping a disease that has been imagined as specific to humans, but which has not only infected as it has jumped to humans from the animal population, but seems to have jumped from rain forest populations of fruit bats, antelope, great apes, and chimpanzees through local food supplies? Although once the virus has migrated to humans, further pathways of infection will be human-borne, the continued danger of Ebola’s spread through meats and contact with animals’ blood suggest a proliferation of the virus’ impact we need to assess in order to contain most effectively. Controlling the transmission of the virus’ transmission, which can occur through contact with the effusion of blood or bodily fluids from infected bodies, or spread from contact with cadavers, is now feared to spread to up to fifteen nations–of which some 22 million people stand to be at risk. The maps of the risk of the infection have, indeed, displaced maps of actual infections or local mortality rates as the focus of international news–as what was at first a West African phenomenon has been replaced by a startling “heat map” of the broader populations at risk for virulent disease, whose infection of which is shown as spreading like an unstoppable cancer across Central Africa toward the Democratic Republic of the Congo and Burundi.
The eye-catching graphic in the Daily Mirror used data of at-risk populations across Africa to create a graphic of the disease boring a radioactive hole in the continent’s interior. But the numerous absences and silences in this attention-getting infographic–as the Google projections of confirmed cases and deaths from Ebola in this post’s header–distort its communication by the remove at which they lie from the local landscape.
Daily Mirror; Sunday, September 14
Is this eye-grabbing graphic most informative guide to the progress of the devastating disease, if it tracks the range or human infection by Ebola alone? And could one better understand the multiple “populations at risk” that it illuminates, not only in Guinea, Sierra Leone, Liberia and the Ivory Coast, but Togo, Angola, Uganda, Cameroon, the CAR, DRC, and Burundi by the migration of the virus and the local transmission of viral infection? Would this offer a better base map to chart the containment of successive waves of infection? How would this change our notion of the best practices for the effective containment of the disease?
2. The World Health Organization hoped last month to control the outbreak of Ebola over nine months to only 20,000 human infections. But difficulties of controlling numerous vectors of the transmission of the disease through contact with bodily fluids now suggests the reality of soon facing 20,000 cases in one month that will be increasingly difficult to contain.
Ebola’s spread raises questions of the best practices of mapping the devastating outbreak, and of communicating Ebola virus’s transmission: so physically devastating and gruesome is the virus, which is notoriously difficult to contain with success, or even to treat by intravenous replenishment, that viewing the virus outside the lens of human-to-human transmission is difficult. But the huge risks of transmission compels we consider what criteria to adopt to map to best process the disease’s spread and contagion. National maps of the distribution of illness make little sense in communicating that spread. The rapidity with which microbes focussed in the very rainforest that seem to have spread to vulnerable populations in Guinea to recur in Liberia and Sierra Leone, as well as Senegal–whose populations seem particularly vulnerable to the current strain. The outbreak at first concentrated in these three countries was no doubt encouraged by their increasingly urbanized and interconnected populations, especially among the high levels of poor who live in dense slums, whose populations who depend on the foraging of “bush meats”–the term for local animals in surrounding rain forests on which many depends. Such animals not only seem the hosts from which Ebola “jumped” to humans, but have themselves, due to deforestation, suffered from shrinking forest land, moreover, in ways that have restricted their regional habitat (and that of the virus)–augmenting the risk of a “spillover” of Ebola across species in these regions that it is deeply unethical not to map.
The silences of the info graphic conceals deep changes, including the expansion of a network of roads that have multiplied routes of contact of meats from rural areas to urban slums, that have shifted the ecosystem of the Ebola virus itself. As we consider turning our attention to mapping the location of the virus and its varied hosts, we stand to gain much from what might be called a “deep map” of Ebola both less widely discussed and understood, for all the emphasis on the dangers of eating bush meats, and better communicate what underlies the disease’s dramatic distribution.
FAO
Absences of endangered forests are by no means the only silences of info graphics depicting the virus’s spread. The most prevalent way of mapping Ebola’s incidence by national boundaries and human habitation presents a striking contrast with the extent to which its hosts have been bats and other animals as rats and monkeys–whose consumed flesh is known as “bush meats.” The meats constitute a prevalent form of nutrition among poor in a region without traditions of husbandry. As much as the virus might be easily contracted by person-to-person contact, we may have focussed on contact of infected bodies, given both the horrors of hemorrhaging and bleeding in an uncontrolled manner so horrible watch and humiliating to experience, and our belief in familiar microbial transmission of influenza or other microbial diseases. This concentration on hand-to-hand contact may however have perhaps led us to focus on the bodily fluids of the infected as a vector of the transmission of the disease. Although such meats are now publicly prohibited from consumption by several governments, animals such as bats seem frequent hosts of the virus, although few mappings of the incidence of bat colonies have been attempted to determine the possibilities or potential for the virus’ geographical spread. Could one map not only the presence of disease in populations of fruit bats, a common for of bush meat, and the routes of their harvesting and transport for sale to urban markets?
Such a practice of mapping is recognized by Oxford researcher Nick Golding as necessary to offer “the first step towards understanding where outbreaks of the disease might occur in the future,” as well as help “prepare for future outbreaks and to deal with the current one we need to understand how human movements cause the disease to spread once it has entered the human population.” Indeed, while the disease is found in animals over a broad territory, the outbreaks of disease among these animals are rare, and the ability to detect infections in animals militate against the ease of such mapping, the ability to synthesize a variety of social and environmental factors where Ebola might be transmitted to people from host animals might be mapped in order to be correlated with the past occurrence of human infection from Ebola.
The mapping of such possible animal hosts of Ebola is not new or unavailable. But a mapping of the simple distributions of animals who serve as hosts for Ebola–from fruit bats to chimpanzees to cane rats–provides a basis to examine the entrance of Ebola virus into local food chains.
To do so would present a compelling alternative mode to track spread of the virus from the first epicenter in Guinea to Liberia and Sierra Leone ,where it has been particularly virulent, and to Nigeria, and illuminate links that exist from the surrounding forests from urban centers on which health authorities have concentrated attention. To process the alarming spread of Ebola virus across West Africa, our use of maps to track the illness poses unique questions of how a virus judged to be hosted by animals (fruit bats or great apes or chimpanzees) in the continent’s interior has rapidly spread along its coastal populations as well as rural regions, that demand more advanced tools of mapping to track adequately.
As we synthesize increased data about the precise location of Ebola’s initial outbreak, its pathways of infection, as well as its future risks, it makes sense to increasingly adopt such models to process the virus’ geographic distribution.
3. The recent closure of national borders follows the logic of quarantines for those infected with the virus, and reflecting the maps that specify nations whose citizens have been infected with the virus–rather than of controlling the vectors of its transmission. Might pathways of the handling and consumption of meats be mapped against the spread of Ebola, to create a more complex map of the virus’ diffusion as we work to contain its spread most effectively? Examining other pathways for the transmission and contraction of Ebola might lead to a more effective attempts to contain its spread, to be sure, even as we focus on rates of suspected or confirmed infections that are reported by national agencies or available to the World Health Organization and CDC, and at least complicate the picture maps might offer of its containment. As it is, the progress of Ebola from rainforest environments is often labeled a “social problem” difficult to contain due to “deep-seated beliefs and cultural practices” as well as inadequate health care, and not mapped on the ground. One stares at the progress of figures of mortality and infection in maps, questioning if they even display the full range of the infected, hoping to contain their future spread across the continent, without describing the range of narratives or social processes that have facilitated the contagious disease that they purportedly track.
We have most often mapped the outbreaks and incidence of Ebola across West Africa by tallying infections and mortality in bubble maps that show sovereign frontiers, but might better map to trace the complex narratives by tracking so viciously contagious a virus against the changed landscapes where it has spread to understand the climates and environments in which it has appeared as we seek to contain the over 4,366 cases of infection so far confirmed. Despite valuable charts and tables that “map” the spread of Ebola virus across West Africa from March 2014, the tally of infections hardly begin to process the shock of the dramatic levels of mortality but both barely chart the striking process of the disease, at the same time as their alarmist tone effectively heightens our deepest fears of contagion.
The recent proliferation of web-based maps chart the unfolding of the incidence of a virus previously successfully contained in remote areas in the African continent, but long feared to spread beyond its shores, as we picture terrifying screens for scenarios of a global health crisis caused by the tendril-like threads that seem to move from hosts with such ease as to complicate their vectors of transmission and confound the idea of what it would be to map the disease’s spread: as we come to conceive of Ebola as able to move from contact with an infected individual’s bodily fluids, mapping the spread of the virus seems the only way to grasp the meaning of its reappearance and difficulties of its containment. (The complication for West African food security as the virus has both increasingly claimed lives of rural populations and spread to the interior of the continent.) The microbe’s spread is poised to create a devastating web of indirect risks of global proportions, where risks of transmission have grown, despite a widespread ramping up of clinical trials by GlaxoSmithKline.
By tracking the virus as if it were transmitted has spread only by human-to-human contact, and by excluding the transmission of the different strains of the virus from animals, we may be short-sighted in perpetuating only a part of the picture of Ebola’s rapid spread. Alternate scenarios for viral containment among local populations forecast situations where the possible numbers of individuals infected by rates Ebola virus could range from 20,000, if conditions stay roughly the same, to as high as 60,000 if conditions worsen–and, should conditions for treatment and containment improve, or a vaccine developed for humans, below 20,000. Although the geographic migration of the deadly disease is challenging to track, the maps we make of its incidence raise as many questions as they do red flags and suggest the importance of dedicating attention to Ebola’s spread.
The ways in which we map the virus raises questions of what sort of story we want to tell about the rapid spread of Ebola virus. Ebola is transmitted by contact with the blood or liquids of the infected. But the spread of the virulent strain is due not only to human-to-human contact–as suggested in many of the maps or the most inflammatory prognostications of possible avenues of its future global spread–but also in the body fluids or tissue of other hosts, such as animals, whose distribution are for more difficult to map. As we contemplate the litany encoded in the distribution of over 2,400 deaths caused by the virus and over 4,700 infected, according to recent metrics of its fearsome spread, and a huge future fatality rate, given the absence of any vaccine; notwithstanding several promises to start testing a vaccine for humans, limited successes have been reached for individual treatment, despite the recovery of two Americans flown to Atlanta. The pathways of the virus need to be mapped both from its first confirmed cases in March 2014 and from the case suspected in Guinea in December, 2013: but difficulties to chart multiple possible vectors of transmission complicate the effect or informative nature of a tally of those infected, or afflicted. (While we do not have a vaccine, the tremendous gravity of the situation is evident in the WHO’s recent acceptance of that experimental drugs to treat Ebola patients would indeed be ethical so long as it involves patients’ consent.)
Such maps may erase the very vectors and hosts in ways that obstruct a clear understanding or picture of the terrifying process of the disease across the continent–as we risk essentializing the disease or seeing it as a consequence of inadequate health care. The drastic manner that the virus dissolves linings of the internal organs of the body by hemorrhaging and bleeding, perpetuate images designed doubtless to increase fears of the further spread of disease whose very symptoms–the discharge of blood and bodily fluids from bodily orifices, and, as blood fails to coagulate, something like the dissolution of linings of bodily organs–so horrific to experience so as to obscure other vectors for Ebola’s transmission. (Practices for treatment by intravenous replenishment of blood and electrolytes pin hopes on the reconstitution of one’s bodily fluids.) But the practice of mapping the disease’s incidence may tell only partial stories about the incidence of illness, and offer narratives inadequate to translate into health policies: for they ignore the danger of the transmission of Ebola in animal meat, and the migration of the disease from rural to urban environments.
Has our fear of the transmission or communication of Ebola by contact with bodily fluids led us to focus, as in the case of SARS, only on the bodies of those afflicted with the disease? Ebola virus was almost only found in Africa since its discovery in 1976, fears of its migration off of the continent have almost subsumed understanding of the contradictions of its apparent localization in central Africa, where the first cases were discovered in Zaire and Sudan, contained on account of their remote locations, but with high fatality rates in all its strains. The absence of a vaccine or isolated antibody, the basis for much modern medicine, have increased deep fears about human-to-human communication of the viral disease, exploited in such films as Contagion and partly domesticated by the marketing of stuffed Ebola microbes. The paramount questions of its containment and isolation–the goal of the World Health Organization–and the difficulty of raises questions of how medical supplies, infection control, and treatments can be maintained, and the ethics of medical treatment without tested vaccines, as the geographical spread of the disease across two geographically removed regions faces problems of being contained–especially when its communication is not well understood or studied. The most recent panic provoked by the arrival of two infected Americans infected with Ebola virus in Atlanta’s Emory University hospital elicited immediate fears of the expansion of the virus and sympathy.
But the existing caseload of Ebola victims in all countries seems likely to surge in coming weeks across West Africa, and its spread difficult if not impossible to contain, despite attempts to do so by quarantine. The virus’ spread have not been mapped in nearly the sufficiently sophisticated tools to comprehend the nature of its virulence. We continue to privilege human contact with blood, sweat, bodily fluids, or diarrhea of human victims, so terrifying is the apparent breakdown of bodily structures Ebola provokes. The difficulty of administrating the intravenous electrolytes to stave of its terrifying spread is all but secure, and the HazMat suits and protective gear mandated to be worn in the presence of cadavers of Ebola’s victims or the infected underscore needs to circumscribe contact with the diseased. Indeed, the fixation on the confinement of the bodies of the ill in continued disputes over plans to quarantine Ebola victims suggest a difficulty of mapping the disease’s spread by local governments and international health organizations. For while Doctors Without Borders/Médecins sans frontières doubts the value of quarantines ill in “death houses” to contain the virus–pointing to the number of cases that will go unreported and the risk of lack of food and clean water for those with the virus–even if they have also established isolation houses in hopes to contain the virus from spreading to further states as the Ivory Coast. But attention to the constraining of bodies may obscure other avenues for outbreaks of the disease
Yet the logic of its spread may have been poorly mapped in relation to the environments where its progress has been most terrifying. The challenge of how to project the expanse of widespread waves of infection by Ebola virus across much of West Africa are hardly met by a static map of the region in which it has spread–which treats the environment as a passive field against which the viral infection has spread. As of August 31, the WHO reported over 3,600 confirmed, probable, or suspected cases of Ebola virus in West Africa,–and the number of people affected by the haemorrhagic disease has indeed recently exponentially grown, as reported cases have multiplied by over 50%. Could a mapping of the sites of outbreak and transmission of the virus offer a way of telling a story about the physically ravaging and highly contagious virus, or even process the sheer information overload of so many infected or deceased? Mapping the virus’ rapid and terrifying spread, as much charting its incidence from Guinea to Senegal, and beyond Nigeria, through their populations to Sierra Leone or Nigeria since its first appearance risks projecting fears of the danger of communicating the virus to populations worldwide that remove it from any cause, and limit our response. This post seeks to raise several questions about what shown in the organization of information in these data maps–and if one is not just tallying demographics not readily updated and lacking clear geographic specificity–and how to map the local outbreak as a global health risk. As we continue to process further information about the vectors of infection and the needs to contain infection among animals as well as humans, we can hope for more effective mapping of the incidence of Ebola, both in relation to urban centers, slums, and rural areas, as well as to areas of forests from which bush meats come.
National Geographic
4. The problem of charting local emergencies has become one of mapping a health crisis of truly global proportions. Even if it is now confined to a region in equatorial Africa, mapping the communication of the virus raises question of what it means to track the outbreak of Ebola, its relation to previous outbreaks, and the incubation of the disease that allowed its rapid spread. The relative lack of epidemiological sophistication by which maps tally reported cases of infection or mortality in bubbles fails to capture how the very geography that facilitated the contagious’ virus rapid spread by treating the base map of the virus’ communication as an oddly static field, and viewing humans either as potential vectors of infection or passive victims. For most of the maps of Ebola’s rapid spread seem to confirm the scariest fears of “losing the battle to contain” the virus for which there is no known vaccine, and which has previously ravaged the African continent. Geographic containment of the disease is a priority of the World Health Organization, the data maps of its spread in West Africa have offered a screen on which to project fears and concerns of outpacing efforts to control a disease whose spread through bodily fluids of people or animals–and the possibly placing the virus into broader circulation among humans once again.
This highly infectious variant of previous Ebola outbreaks in the continent appears to have been likely underreported since the possible earliest case last December. While known vectors of its communication are poised to multiply, the practice of containment is impossible to achieve by quarantine and isolation of patients in sick-houses or containment of traffic between national borders: while the sealing of national borders in hopes to create barriers that might prevent the cross-country mobility among the possibly infected stands at odds with recent rapid expanding urbanization and geographic mobility in growing cities of this very region: demographic changes brought by increasing urbanization, deforestation and geographical mobility have transformed West Africa’s living geography in the past decade, effectively bringing the city closer to forests where the epicenters of past Ebola outbreaks. Yet the specter of confined borders or the creation of confines stands to create undue stress on relations between doctors and local populations to slow the infection’s spread or arrival of medical staff and supplies, if not generate panic and mutual distrust within local populations at the same time as weekly count of infected exceed 500, with many likely to be unreported.
Quarantines have offered somewhat effective means of containing Ebola. Their prevalence as a tool to combat Ebola echoes attempts to contain plague in seventeenth-century Italian cities, when the isolating the afflicted within cordoned city-state or regions as soon as possible fit new understandings of the transmission of disease by individual bodies. Quarantines separated people known to carry the plague, segregated by analogy to goods exposed to plague or disease that remained for periods of forty days [quaranta giorni] in order that miasmatic “pestilential air” could dissipate, and the rapidly growing numbers of those infected with plague be effectively circumscribed. The practice of quarantine emerged before plague hospitals, and the same sort of isolation once again emerged as a coordinated reaction to unidentified virulent diseases such as the recent outbreak of SARS: quarantine managed plague with shifting efficacy from 1347-52, as cities instituted quarantines of neighborhoods or goods in the face of a disease against which there was no known or effective medical response–encouraged or facilitated by the drawing of a fixed spatial boundary on terrestrial maps, as in this late seventeenth-century plan of the barriers that would contain the plague in seventeenth-century Bari.
Is this emphasis on the human-to-human transmission of disease the correct strategy to apply to Ebola? The spatial containment of bodies of the infected and ill–who are often asked to lie in isolation wards that are deemed an effective death sentence for those effectively removed from medical care–oddly mirrors early modern reactions to pestilence despite our more effective concepts of tracking disease: although effective if they occurred quickly, the scope of Ebola virus in the region suggests a range of factors have shaped true transmission of a disease beyond close contact with bodily fluids, or its human hosts: are human bodies rightly presumed to be the sole agents in need of containment, and the sole subjects to be confined?
Containing Plague in Bari (1690)
Is an emphasis on the danger of human-to-human transmission, the sort of transmission that quarantines seeks to limit, an adequate response? Closed national borders have so far followed the logic of quarantines for those infected with the virus–rather than of controlling the vectors of its transmission. If barriers have contained disease when created quickly, the vectors of Ebola’s transmission are so challenging to map to make analogous quarantines by cordoning off West African regions offer a sort of exemplum of the misleading picture of the pathways of infection that the Ebola virus might exploit. Fifty thousand people were quite recently forcibly barricaded in Monrovia to isolate the Ebola virus’ spread, limiting access of inhabitants to food or drinkable water and no doubt increasing their desperation, fearfulness and sense of fatality. The first two Americans reported to be infected with Ebola virus, Dr. Kent Brantly and Nancy Writebo, have been transported from the continent, and to Atlanta, to recuperate in isolation chambers set up by the CDC in Emory University Hospital, the former recently released after being cured. Is such a dramatic contrast in understandings of the etiology or response to the disease unconscionable? With numbers of those affected by the Ebola virus now seem destined to rise exponentially, with some West African countries experiencing an increase of 50% last week, the specter of further quarantines and fears of the airborne transmission of the virus are misplaced. Although the contact with dead or ill bodies is one clear means of transmission of the disease, its long strands are rooted in the body’s fluids–and its most virulent strain yet encountered seem able to have “jumped” from animal meat to humans, and prove particularly difficult to contain in cases where the disease is advanced.
The initial response of the United States Center for Disease Control and Prevention was to issue bulletins restricting non-essential travel to Guinea, Liberia and Sierra Leone, in the hopes to create distance between the US and the re-emergence of the disease. African nations followed suit, terrified by re-emergence of the deadly virus and the lack of any public health response that was deemed effective: Nigerian airlines cancelled flights to Freetown and Monrovia in an attempt to contain human contact with the infected; Nigerians angrily blamed airplanes for allowing passengers infected with Ebola to enter the country as opening the pathways to transmission of the disease. But presumption that victims of Ebola constitute the prime subjects needing to be contained, or quarantined, or that the disease could be bound and frozen, kept within the boundaries of states where the virus, not only hamper coordinating medical reactions to Ebola and needed supplies, as well as food, but offer a no-exit strategy that may fail to contain the disease or address the actual vectors and incubators of its rapid geographical spread through several cities across the central Continent. If trade provides a crucial means for the communication of disease, which is not only particularly aggressive but may mutate in the face of resistance.
Rather than being an isolated instance, historian Tom Koch, who has studied the uses of maps to embody the spatial distribution of diseases from the early modern period to the present, warns that “rapid viral and bacterial evolution brought on by globalization and its trade practices” pose deep challenges to how we contain future outbreaks of disease as well as to our practices of medical protocol and ethics. The reactions suggest a terrifying widespread return of medical quarantine as we face increasing fears of contagion as unable to be contained. The need for containment is itself echoed in the mirrors maps manufacture about the disease’s rapid spread, and what better maps might exist in an age when our mapping abilities to track the transmission and probable bearers of the highly infectious virus.
5. The figure of infected victims of Ebola crossing national borders has become a standard and repeated image of the transmission of disease and the challenges of its containment. A widely read report of late July described with considerable panic the arrival in an airplane of a man infected with Ebola who collapsed in the airport of Lagos, Nigeria, infected with the Ebola virus. It provoked increased fears about the very vectors of Ebola’s transmission, including airborne transmission (which is impossible) and exposure to the environments where the bodily fluids of its victims have been present.
The communicative value of even the most accurate epidemiological maps of the virus’ rapid outbreak may have failed their readers–as this powerful visualization from National Geographic–in communicating the nature of its transmission, despite its terrifying suggestion of its spread in West Africa serves to emphasize the global threats that Ebola’s spread pose. Although disease maps provide clear tools to understand the spread and pathways of communication of a disease, the highly virulent and rapidly moving nature of the virus, whose spreading transmission has multiplied because of both growing density of urban population sizes and the increasingly interconnected nature of populations in the region. Given the increased health risks that are the result of huge changes in West African urban geography, both the simple tally of cases of Ebola the snapshot-like nature of most distributions by country only skim the surface of the depth of multiple stories–and terrifying fears–about the virus’ rapid spread across the West African coast. For the story of Ebola is increasingly about the new vectors of transmission that result from the relation of the cities to the interior, in ways obscured by data distributions that collectively group numbers of cases and deaths–mutely enumerating the daunting count of those infected and deceased, but without telling a clear story about its geographical spread across a rapidly urbanizing region.
National Geographic
The spread of Ebola across four nations since April, when it was first reported to have spread from an epicenter in a rural Guinea, is unprecedented in the relative rarity of its geographic spread and the rapid bodily decline of those it has infected raises questions of how medical supplies, infection control, and treatments can be maintained, across two geographically removed regions–as the existing caseload of Ebola will likely surge in coming weeks. The odd mapping of the incidence of Ebola by nation contrasts with the extent to which the hosts of bats and other animals whose flesh is consumed known as “bush meats”–and not person-to-person contact alone, despite the horrors of hemorrhaging and bleeding in an uncontrolled manner so horrible watch and humiliating to experience. Although such meats are currently prohibited from consumption, the virus’ rapid spread provokes fears of containing increasingly porous boundaries between nations in West Africa, but such containment and isolation may discount other sources of the bearers of disease at multiple sites, or the over two thousand afflicted with Ebola. And, if bats are indeed the hosts of the virus, few mapping of the incidence of bat colonies have been attempted to determine the possibilities or potential for the virus’ geographical spread. Could one map not only the presence of disease in populations of fruit bats, a common for of bush meat, and the routes of their harvesting and transport for sale to urban markets, as a basis for the spread of the virus from the first perceived epicenter in Guinea to Liberia and Sierra Leone where it has been particularly virulent, as well as Nigeria. Might pathways of the handling and consumption of meats be mapped against the disease?
Is the danger of the disease’s fatality underestimated in the graphic posted above?
6. Can we explain the dangers of its communication by maps that do not adequately chart the spread of the virus’ outbreak by a range of vectors? The effort of humanitarian mappers, using OpenStreetMap mapping templates, readily applied mapping techniques to track the first outbreak of infections from April 2014 occasioned an early attempt to trace the spread of the virus from rural areas, and define its Guinean epicenter and routes of travel to coastal towns from the regions around Gueckedou, as Doctors without Borders requested the OpenStreetMap Humanitarian team to map the outbreak in an effort to define with greater precision the spread and immediate impact of the disease, using Bing’s high-res imagery of the region, and maps from Airbus Defense and Space as well as overlaying satellite images with MapBox Streets/Digital Globe to track incidence with a resolution absent altogether from most large-scale maps. The collective effort of 200 mappers to locate over 100,000 buildings and some hundreds of miles of roadways supplemented the absence of adequate maps of the region of Guinea, the site of the first hemorrhaging confirmed caused by Ebola virus. At the same time as worries already began of the spread of the virus to Liberia and Sierra Leone, the mapping helped establish the epicenter in Guinea and radius of the outbreak. Despite the far greater complexity and geographic range of Ebola’s spread, such maps might be beneficially integrated with other overlays in attempts to try to understand the mechanisms of its rapid spread in an area for which we often lack adequate maps.
The level of local detail in such early maps already pinpointed the breadth of its transmission, and raises questions about the role of human-to-human transmission as the sole vector of the virus, which has been argued by the World Health Organization in July to have been transmitted by wild animals, such as bats, but in addition to bush meats from wild animals, in the local pig farms that often play hosts to the bats.
Some of the precision of these maps has been lost in the later maps that seem emphasize occurrences of probable or confirmed and suspected cases in “countries” and regional “districts,” rather than in an inter-related web of the transmission of the disease. The result of the tracking of cases came to embody the sources and centers of fears of its spread, as the confirmed or probably cases of infection were mapping against the continent as a whole, so that the spread of infections gained a new look on the map as a field of red that demanded to be contained, juxtaposed by the specters of historical sites of infection, as if to augment local fears of its future spread, and to understand the migration from regions of Guinea and Sierra Leone to other ports along the shoreline of West Africa as Dakar, suggesting that the spread of the virus has not only outstripped medical abilities in the area, but that the spread of the disease invaded an entire district which would need to be isolated or quarantined–as requested most recently by Theo Nicol, Sierra Leone’s Minister of Information–and not public health officials–to respond to the spread of the disease into the country, in ways Doctors without Borders (MSF) cautioned were without benefits and in face quite detrimental to medical care, nourishment, or establishing needed trust of medical professionals: the mapping of confirmed cases as if confined to a given administrative region reflects a reality of public health administration, but a distorting image if one would like to map the vectors of its communication. (The historical cases of former outbreaks of Ebola in the CDR or South Africa were another strain of the virus, and, while reaching into the collective memory, not related to this outbreak, which began with a similar jump of the virus from animals to humans.)
The spread of Ebola in West Africa in relation to “Historical Cases” magnify its danger, but oddly contain the virus to the African continent’s sub-Saharan regions.
7. The mapping of “historical cases” of related Ebola virus outbreaks may introduce more than a bit of a red herring. For although they similarly seem to have begun from similar reservoirs of monkey or bat hosts, relations between the viruses is not clearly understood, despite similarities between the Guinea virus and the Zaire Ebola virus (EBOV) lineage; nor are links between their different reservoir species or hosts and the virus outbreaks understood, although the relations are presumed in the coloration of the above inset map of the African continent. The vectors of viral transmission may create a map quite distinct from the earlier inland growth of Ebola in both Central and South Africa. For outbreaks of Ebola may have all been incubated first within the animal populations in ways not communicated in the above maps. At the same time, the natural cycle of transmission of Ebola within the forest remains largely unknown, creating problems understanding its transmission–although its appearance in and transmission from animal populations has been clearly identified as the basis for its spread at the forest’s edge in rural Guinea.
The spread of the virus across three countries by late July already made it the deadliest breakout of the contagious virus in the continent as it moved from Guinea to other edges of the forested interior, in ways that the CDC map below does not clearly describe, but explain the odd dispersion of cases reported around the border between Guinea and Sierra Leone. When Liberia shut most of its border points in late July in an effort to contain the disease and halt the virus, it had already spread across at least four nations, leaving possibilities of its future containment optimistic at best, in an attempt to isolate the migration of infected individuals given deep preoccupations at continued geographic mobility in the region.
The confines created around those districts with suspected or confirmed cases in April, shortly after the spread of the deadly virus had been mapped, misleadingly places the problems of quarantine on each nation–Mali; Guinea; Sierra Leone; Liberia–and not to define the impact of infections on local society or analyze the channels of its transmission, apparently able to have jumped national boundaries with ease in areas. We perform a far less sophisticated mode of mapping outbreaks by identifying its incidence in isolated districts, without the greater geographic or spatial specificity the OSM map tried to chart–and perhaps have provided a misleading map that raises false hopes for being a ground-plan to its spatial or geographic containment. But the multiplication of incidence has of course made the process of mapping impossible, and fears of under-reporting widespread. Such a mapping might be particularly important, however, since the evidence suggests that the combination of increasing human penetration into rain forests, and increased human contact with meats in urban centers–in addition, most significantly, geographical mobility between goods from rainforest areas to growing urban slums, creating channels and microclimates that are increasingly likely to change the patterns of the transmission of Ebola in ways maps might better track in order that the virus could be more effectively contained. In an era when satellite-based mapping and GIS systems could make questions of human penetration into forests, contact with animals, distribution of bats and other species, and population density in urban slums where Ebola has spread could stand to be mapped in quite potentially significant epidemiological ways.
The recent growth of populations in West Africa that are living in urban slums from the Ivory Coast to Senegal suggest an especially dangerous topography for Ebola’s growth, which is left silent or unspoken in most infographics of the region, despite its significance in understanding the social shifts that magnify the transmission of the deadly virus.
The considerable growth in urban areas and slums in Conakry, Bamako, and Dakar make them terrifying incubators for human hosts, again absent from infographics of Ebola’s current spread.
The distinctions of local distributions are unfortunately erased in flat “impact maps” which highlight danger zones of travel, and not effectively map the virus’ transmission and spread or the environments in which it has grown–the flat colors of data maps, prepared relatively quickly with whatever data is at hand about Ebola, and not the region, seem almost to hide, rather than try to foreground, the dangers of the virus’ spread and the dangers of its migration from rural to urban areas.
At the start of the virus’ spread, attempts to localize its incidence expanded the number of fine-grain maps in circulation–although the mapping of incidence onto the urban and rural environments was rare, as were fears and concerns about the mutation of the virulent disease. The rapidity with which Ebola spread through Liberia and to Senegal makes the distinction between “confirmed” or “suspected” cases, or indeed an administrative mapping of the topography of Ebola less valuable in understanding its transmission or the possibilities of its potential spread by vectors or the overlap of incidence with even a road map of nations that might track the paths of geographical mobility by which removed outbreaks could be related to one another. Although fourteen of Liberia’s fifteen counties report cases of Ebola, what does such a spatial distribution tell us about the disease save of the dangers that the administrative response must face? Data on the large numbers of populations of the slums of Monrovia were not even available to the United Nations in its mapping of slum populations, shown above, from 2009–although the terrifying density of populations in urban slums in growing cities in Sierra Leone, Guinea, or the Cote d’Ivoire are striking, as is the massive urban growth of the city of Dakar (Senegal) or Conakry (Guinea), not to mention the large city of Bamako, which lies terrifyingly near to the suspected cases of Ebola in one district of Mali. (There seems no data available in the UN map of urbanization about Monrovia.)
If in 1990 there were only some 24 cities in Africa whose population exceeded one million, the number of cities with more than a million inhabitants had doubled by 2011, and has exceeded that proportion by 2014, and many of these urban agglomerations are concentrated in West Africa in ways that have dramatically shifted the landscapes across which Ebola has so far most intensely spread.
The movement of the virus to these cities was terrifyingly close in April, when it seemed inevitable, or evident, but few measures of adequate containment were articulated or in place as the virus advanced from Guinea to Mali and Liberia. But the shifts of urbanization that have occurred in the region were oddly absent in most of the maps that describe the disease’s spread in districts of Guinea, Sierra Leone, Liberia, and Mali–the size of urban populations only become prominently realized in maps of contagion after the virus arrived in Dakar.
8. Boundaries between states however provide a limited information to allow us to track the disease’s spread or its scope. The responses to the spread of highly infectious virus by August was to shut the borders crossings and frontiers between nations, in a terrifyingly shortsighted miscalculation of the spatial geography of viral containment, and misplaced allocation of resources, since the virus had already spread to Guinea. When Liberia shut most of its border points in order to contain the virus’ progress to the south, was the area of infection from Gueckedou already too progressed to rely on national frontiers as a basis to staunch its spread? Were other possible causes or vectors of disease less addressed?
While the map rightfully suggests the importance of human-to-human transmission, it oddly omits the very animal populations that both suffer from the disease and from whom Ebola is prone or apt to jump. Closed national borders follows the logic of quarantines for those infected with the virus–rather than of controlling the vectors of its transmission.
Continued consumption of bush meats across much of West Africa suggests a far likely route for the transmission of Ebola than person-to person contact. The difficulties of preventing the consumption of bush meats that were infected with the disease–including fruit bats, rats and monkeys–though widely suspected to be as the chief bridge between humans and animals in the region. The transmission of disease in meats–either uncooked or by butchery–can cause itself multiple centers for the transmission of the disease from infected humans, not tracked by the concentration on human incubators of the disease. Despite the current ban on consuming bush meats, the possibilities of such a transfer of the virus through consumption poses a decisively high risk and is potentially difficult to enforce. Many villagers openly blame the arrival of medical teams for the virus’ spread, even as fruit bats and antelopes and rats have disappeared from the markets of the main towns, attempts at curbing the consumption of animals that are both plentiful in the forests and provide a prime staple to meet local nutritional needs of urban and rural poor in an area without animal husbandry; such curbs on the butchery and sale of bush meats are however most often met with incredulity among many–“Banning bush meat means a new way of life, which is unrealistic”–in regions without animal husbandry, and the eating of potentially uncooked meats or handling of dead infected animals from the forests effectively multiply the potential for further human-to-human transmission of the disease. A ban on consuming bush meats–Liberia forbade its consumption and shopkeepers selling bus meats were jailed in attempts to retract its consumption in Nigeria–was less effective in practice, and pushed trade underground. Bans on the importation of bush meats into London reveals fears of the meats as vectors of transmission that are difficult to control in West Africa, but have gained less attention than they deserve.
Ahmed Jallannzoe, EPA
9. The policy seems to hope to contain the spread of bodily fluids that are associated with its transmission from those inhabitants infected with Ebola, as if the enforcement of clear boundaries could prevent future transmission in an era when far great border-crossing and dramatically increased interconnectedness of urban populations across West Africa. Indeed, the mapping of the epicenter of its “outbreak” seem to be beyond the point, if important to register, in dealing with its spread: the unwarranted closing confines with Sierra Leone and Liberia rests on the conception that human-to-human transmission constitutes the sole or primary sources of its incubation. But this inference may be false, according to Mapping the Zoonotic niche of Ebola virus disease in Africa, who suggest that the transmission from infected humans is in fact surprisingly low. The absence of attention of a topography of the network of transmission of the disease, and of the presence in animals, as well as humans, would offer a far more complete picture of its transmission beyond the numeric tabulation of the dead in datasets.
What could a more dynamic terrestrial mapping of the spread of disease show, beyond the fears for its further expansion? In what ways does the embodiment of the virus’ spread in maps of the districts of West African nations poorly communicate the nature of its spread–or the relations between Ebola virus’ spread and recently increased connections between large urban centers on the coasts to rainforest areas previously less often penetrated by purveyors of goods for urban food markets. Indeed, health authorities would do well to monitor then expanded unrestricted or reviewed traffic of foodstuffs and plants from vendors who move with increased access to the deforested rainforest areas on new roads into growing cities, even if the virus is already out of the bag: for the very roads linking regions that were previously with far less contact with one another create new pathways for rapid transmission of the virus, as much as they might be seen as forms of regional modernization.
Other maps might offer unwarranted alarmist images of the potential pathways of Ebola’s feared future spread. The justifiably intense fears now emerging about the uncontrolled spread of this hemorrhagic fever have grown after the spotting of several cases in Senegal and seems possible to be transmitted on any flight out of Dakar within the contents of a plane’s shipments. We map the increased fears of cross-border transmissions of the dread disease in a particularly terrifying fashion, forecasting future distributions of illness by transposing a map of airplane flights from Dakar into a graphic that might be read as one of the exponential growth of the airborne transmission of a disease, in ways that misleadingly label the global health crisis as one of transmitting Ebola out of Africa, rather than trying to contain or understand the mechanics of its rapid spread on the ground trough far greater international aid before the outbreak itself is truly cataclysmic, and no longer possible to be mapped locally:
Despite the good intent to emphasize the global nature of the epidemic, the graphic removes attention from the on-the-ground story that the same magazine had been tracking so compellingly. For all the knowing ways of getting the attention of readers of a progressive magazine, the image of the proliferation of Ebola on airplane flights may even minimize the questions of either its spread on the ground or provoke a rhetoric of quarantine. The map of airplane flights from Senegal’s capital does suggest the huge changes in human connectivity that have emerged in the past decade, as if they stand to change the transmission of the deadly virus into a focus of global attention. But the alarmist tenor of the map, which colors potentially affected countries in yellow as if to display how much of the globe could be touched by the bodily fluids from infected passengers leaving Dakar, suggests only potential channels of travel–and is not in facet based on actual reporting of disease.
The map almost seems to advocate the need to pursue a logic of quarantine and containment, so terrifying is the scenario of the virus’ potential spread. Do the flight pathways tracked by Google Flight Search map potentially expanding pathways of Ebola virus’ communication in ways that play upon our fears, and, even as they ostensibly invite us to consider how the disease might be contained, deflect questions from situation on the ground that we are all too likely to see as if it is far removed? Or are we already there, given the recent mapping of 140 alerts for the hemorrhagic virus that are already evident worldwide on HealthMap?
In the case of West Africa, might it be prudent, as Pigott, Golding et al. suggest, to monitor the presence of disease in fruit bat populations and Great Ape populations to try to contain the outbreak of a disease whose outbreak is commonly associated with hunting and butchering, as much as contact with infected humans’ bodily fluids? Despite the risks of contagion from the fluids of the dead, the mapping of diseased populations is often the most fearsome–and least preventative–means to track Ebola’s incubation and chart the virus’ spread. Do such maps effectively perpetuate ungrounded fears of human-to-human transmission by regarding infected local inhabitants to be exclusive vehicles of contagion, since they are the subjects whose mapped distribution minimize the attention we might pay to the transmission of the disease by animals and especially rodents, monkeys, pigs, and widely ranging populations of fruit bats?
Rather than being a purely human-borne disease, despite the huge multiplication of human-to-human transmission, the transmission of Ebola through animals, uncooked bush meats, including apes, fruit bats, rats, porcupines, and non-human vectors has dramatically grown since from August. The geographic spread of the virus did not follow regions that were geographically contiguous, but spread from multiple epicenters in the region, in ways perhaps dependent on animal hosts and the possible cross-species jumping of the disease from bats to apes and others. The maps of local health authorities and treatment centers against the spread of reported instances of Ebola offer images of overwhelmed health institutions which surrounded by the virus’ spread, hampered from reaching inland areas affected: major treatment centers in the region appear to be swallowed in a sea of Ebola infections, themselves overwhelmed by risks of infection they are inadequate to handle. They exploit justified fear of the virus as a source of infection by displaying the paucity of hospitals field laboratories to study to the incubators of the virus’ spread or be trusted to staunch it, as well as the deep need for international aid to contain the further spread of the virus and care for its victims.
CDC
The map charts the spread of a disease as overwhelming medical capacities which are positioned in a far smaller area than the areas where confirmed case of Ebola have been reported. Its design of placing the few clusters of treatment centers far removed from the expanse of afflicted almost confirms the decreased trust between healers and patients for a virus which not only lacks commensurate medical response: treatment centers seem lacking in ways that could stave off the dangers of the virus’ inland spread.
The authoritarian images of control over cities by armed forces, or militias that fumigate streets or men in white HazMat suits, recuperating the body of the dead that were formerly attended by family, suggest an imagery of antibiotics and antiviral spray in Monrovia’s Duwala marketplace, as if to acknowledge the fatalism of the virus’ spread and the only means of stopping it with antibiotics and law and order–notwithstanding the huge potential risks of panic. (Indeed, the huge risks of decreased harvests and local food supplies, whose prices are poised to spike to levels never seen in West Africa, have already led the UN and FAO to secure and transport masses of foods from rice to maize and cassava. Even the recent ban on consuming bush meat may further dry up other needed sources of nutrition.) The promise for the arrival of American soldiers and military–while a needed reinforcement of personnel–cannot but raise fears and questions about the future multiplication of vectors of transmission of the disease, and of their arrival without coordination of the application of best resources to policy of containment.
Stringer/Reuters
AP Photo/Abbas Dulleh
10. The unprecedented intensity of this West African outbreak has moved from Guinea in March 2014 and then Liberia and Sierra Leone, onto Nigeria and the Democratic Republic of Congo, reveal a potential multiplication of vectors of infection clearly knowing no national bounds and beyond the mandate of any local authority. But it does little to provide a causation image of the historical necrology of Ebola it mutely registers, and places so suggestively to the apparently geographically broader, if less virulent, outbreak of Ebola in earlier years:
The BBC’s info graphic illustrates the intensity and increased risks that the current outbreak of Ebola poses. But in projecting the data onto a relatively blank base map, it oddly removes attention from the situation on the ground that it fails to map sufficient detail. The reluctance to encode further information than that disseminated by WHO and CDC creates a limited view of the transmission of Ebola on the ground, despite the impressive use of intense coloring to focus our attention on the expanse of its recent outbreak. Despite data from such apparently reliable sources as the WHO and CDC, the map offers few guides for reading its mapping the incidence of outbreaks of and fatalities of Ebola virus by proportional nested circles, and presumes that the variants are Ebola are not different from each other, although it does suggest a broadly focussed geographic incidence in a similar region–and apparently similar ecosystems, putting aside the outlying outbreak in South Africa. The absence of individual or collective narratives that it tells leaves one confronting the sheer numbers of the outbreaks, but hanging in the air. Might the mute order of the data distribution be more helpfully placed in overlap with other data, in order to foreground its relation to other potential causes of these viral outbreaks?
Even less helpful, of course, are the maps that redden the entire central band of the continent as a source of infectious viral disease. The maps that are proliferating online and in the news tell us little of epidemiological value about Ebola virus’ spread, so much as they reveal the chance of infecting the entire continent, reminding viewers of the multiple sites of the outbreak and recent spread of the virus across the expanse of much of the central continent in alarmist fashion, as if to suggest the danger of neglecting the disease that had previously dedicated the Ivory Coast and CAR.
To be sure, the detailed country by country regional spread of the illness suggests the benefits and needs of clearer tracking, and a unique topography for the pathways viral transmission has so far taken, raising multiple questions about the relation between human and animal vectors that encouraged the unique topography within which it has most rapidly spread, but also the distinct topography among reported victims of the disease. Are these counts accurate, one wonders–do they rely on accurate door-to-door screening to tabulate the numbers of those afflicted by Ebola-like illnesses, or depend on the counts of health authorities and hospitals?–and can they forecast its future spread? When the World Health Organization is now predicting some over 20,000 cases of a disease that has no known cure, the limited areas of exposure seem reassuring, but the map of confirmed cases offer little sense of a road-map to its future cure–even if they misleadingly suggested areas of its containment last July.
11. The difficulty of establishing a clean dataset on the ground in these regions is, in a sense, compounded by the exclusive mapping of human cases of the transmission of the disease–which has, at the same time as displaying particular virulence in humans, been widely reported across populations of great apes across Africa–including the gorilla and chimpanzee–to an extent which has so far not been mapped or not mapped with nearly the same prominence as human cases and deaths. Hunting and handling of bush meats appear the most likely causes of outbreaks of the virus, although the dangers of human-to-human transmission are particularly high risk during home care and funerary preparation of infected cadavers. At the same time, they discount the extent to which the increased urbanization of West Africa–and its own expansive rise of urban populations–create a human density where the disease might be difficult or impossible to contain, and the vectors of its transmission uncontrollably spread.
Much of the mapping of the occurrence of Ebola outbreaks past or current occurs without noting Ebola’s presence in apes or fruit-bat population. As if significant, they somewhat stubbornly retain the boundaries of the modern sovereign states. In this late-July chart from the Economist, has the cumulative spread of the virus was mapped against the population of fruit bats who are credible vector of transmission across species throughout the continent, to judge band in this case it is based on a rough mapping of the ecosystem where fruit bats live, rather than the number of bats who are themselves hosts for the disease or, say, infected apes. (And the result seems equally–if not more–alarmist, since not all fruit bats can be said to carry the virus, and the scientificity of the image that it presents undermines the intensity of this localized outbreak on the Western coast.)
The Economist
Reading the map, one imagines its spread was a public health crisis reveals the poor quality of public health in Africa, rather than that most western medicine has been particularly ill-equipped to understand the spread or the vectors of its disease. But the map oddly conceals the different viruses of Ebola that have appeared in the past fifty years in Africa, and the increased virulence of the current disease. For although the incidence of Ebola in the Central African Republic now seem to be confirmed as a separate, less virulent strain, the overlap in the map of incidence and the bat population suggest the danger that infected animals transmit the disease in ways not constrained by human-to-human contact.
Meanwhile, the map omits the routes of the transmission of the butchery and migration of uncooked meats to cities and slums on rainforest-to-city roads that seem to be a major route for the disease’s transmission. The difficulties of reaching rural areas where the dependence on bush meats is particularly intense–and distrust of foreign doctors or medicine has the potential to be considerably stronger–might create a distinct map that foreign aid organizations might approach the growing epidemic. Local insistence against the danger of consuming bush meats that might be uncooked or handling raw meats and widespread refusal to accept the interpretations of medical aid workers in much of the continent poses a serious health risk–and underscore the importance of confronting this resistance in providing aid to West Africa. The reasons why a base-map of the habitat of infected fruit bats and bush meat consumption have been less prominent in the mapping of the outbreak suggests the limits of relying on base-maps to understand the spread of the disease.
12. The recent dependence on the recycling of existing geographic and news maps of West Africa have been less informative of the vectors of transmission or incubation of the deadly virus. They almost indeed seem to generate the illusion we are able to locate and control the disease whose spread we are still at such pains to try to control by effective quarantine–the three-day country-wide “lockdown” that is proposed in Sierra Leone suggest a desperation at confronting the disease, with the rationale of taking an updated count of mortality rates and number of those afflicted, and may well provoke a deeper erosion of trust between the sick and health-care providers, that would encourage many to disguise the symptoms of illness or not seek out care, at the very time that a better understanding of the basis for its spread need to be understood.
Despite the intentionally misleading opinion of the Nigerian government asserted that the haemorrhagic disease in question was in fact not Ebola virus, but Dengue–though this has few grounds for being true–provided an interesting distribution of this insect-transmitted disease across specific latitudinal parameters might lead us to re-dimension our own ways of mapping Ebola against a variety of base-maps, perhaps focussing less exclusively on human victims–even as we mourn their tragic deaths, and see such deaths as a barometer of the global catastrophe of the virus’ spread–by shifting from the counting of the dead that Ebola has claimed than the animal vectors which communicate the deadly virus, or the changes in human populations from urban population density that have increased the transport of meats and butcher shops that have made it more likely for people to come into contact with the deadly virus.
We read more maps than ever before, and rely on maps to process and embody information that seems increasingly intangible by nature. But we define coherence in maps all too readily, without the skepticism that might be offered by an ethics of reading maps that we all to readily consult and devour. Paradoxically, the map, which long established a centering means to understand geographical information, has become regarded uncritically. As we rely on maps to organize our changing relation to space, do we need to be more conscious of how they preset information? While it is meant to be entertaining, this blog examines the construction of map as an argument, and proposition, to explore what the ethics of mapping might be. It's a labor of love; any support readers can offer is appreciated!

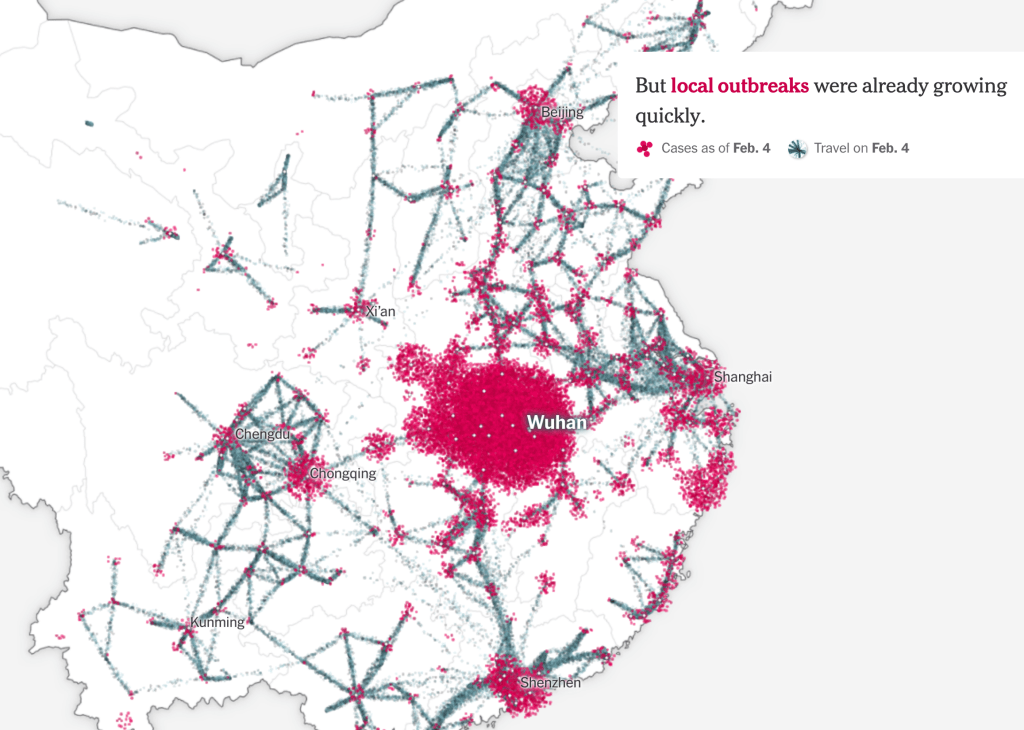
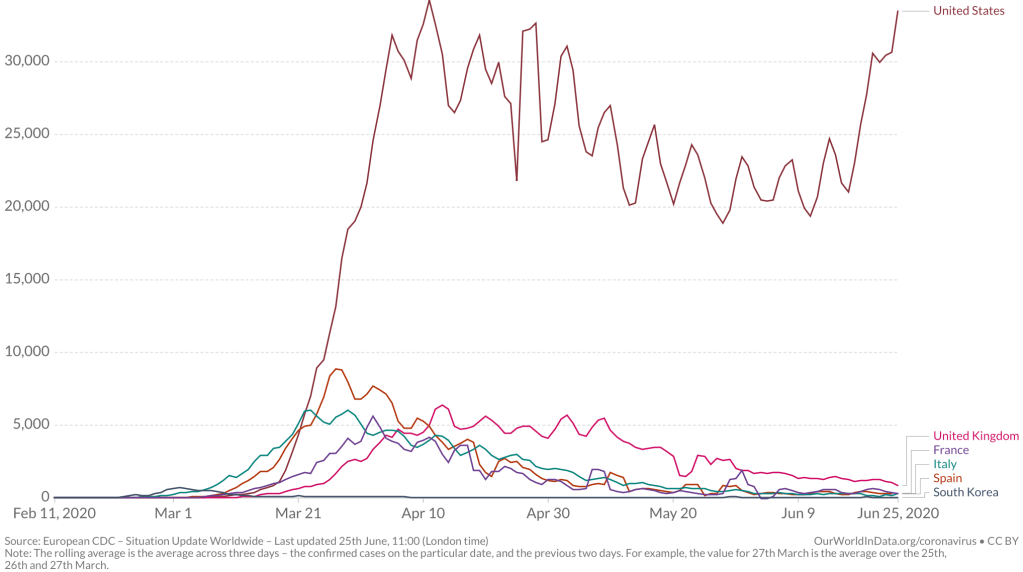
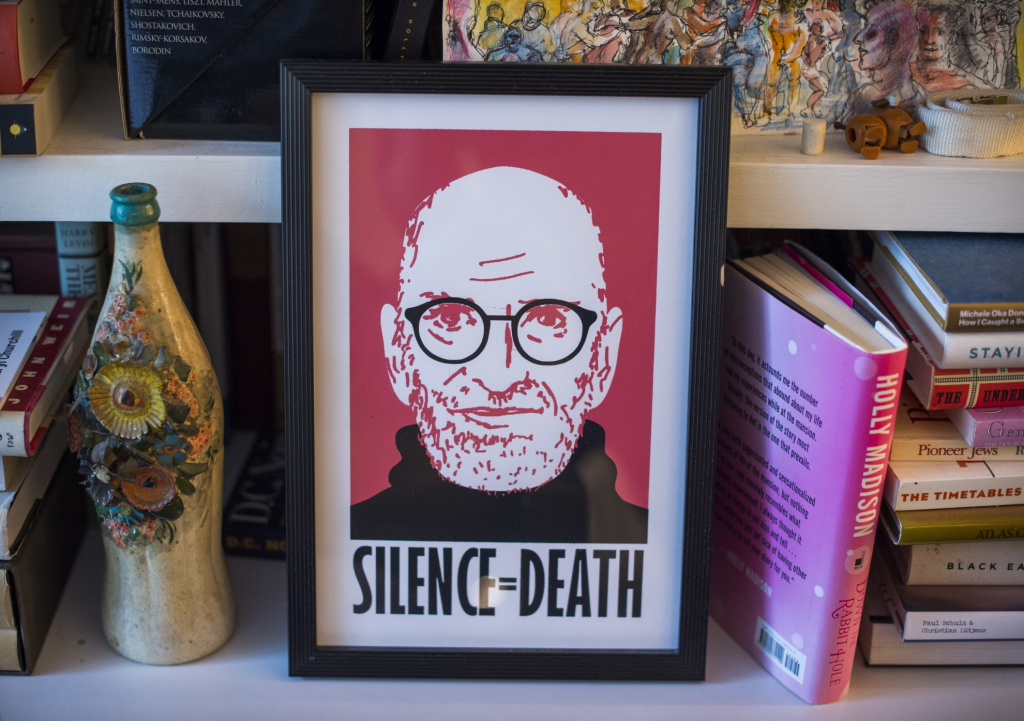
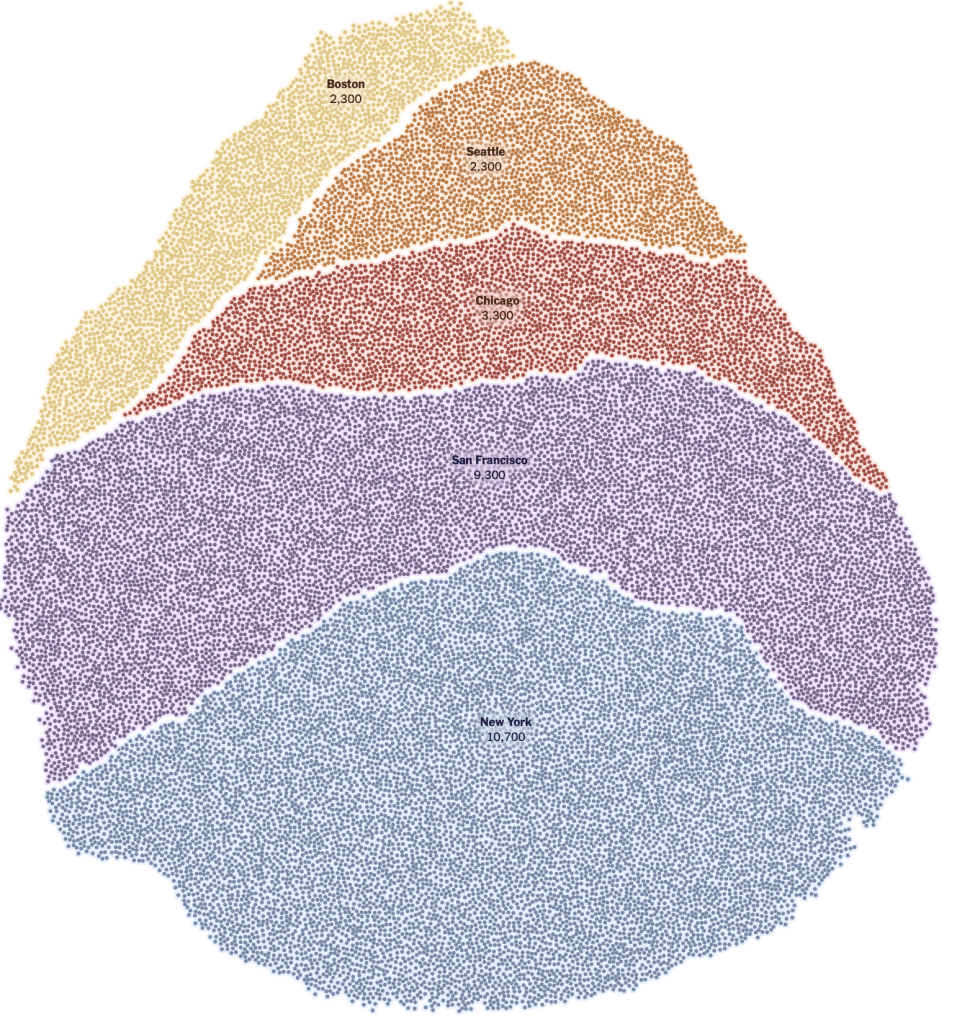
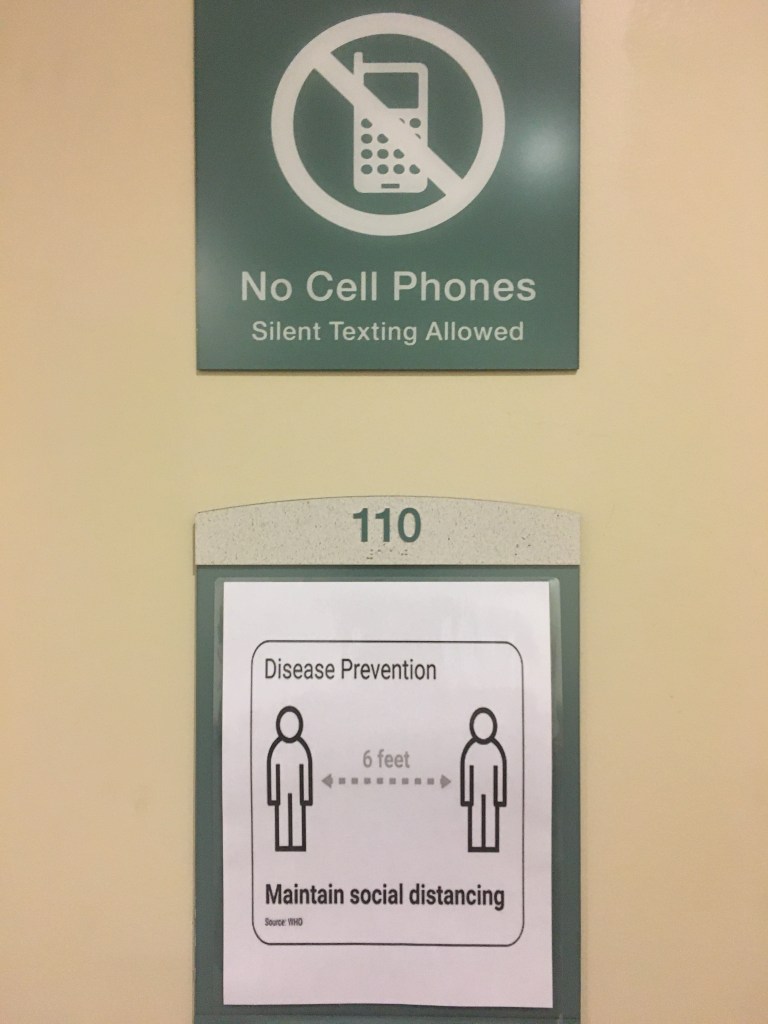
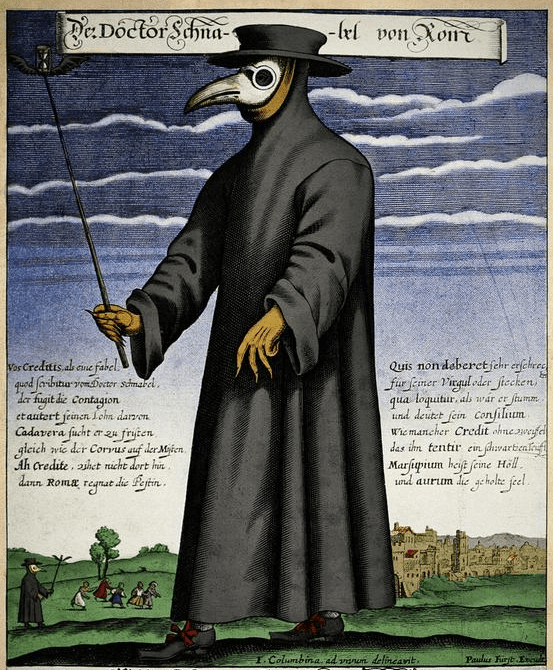
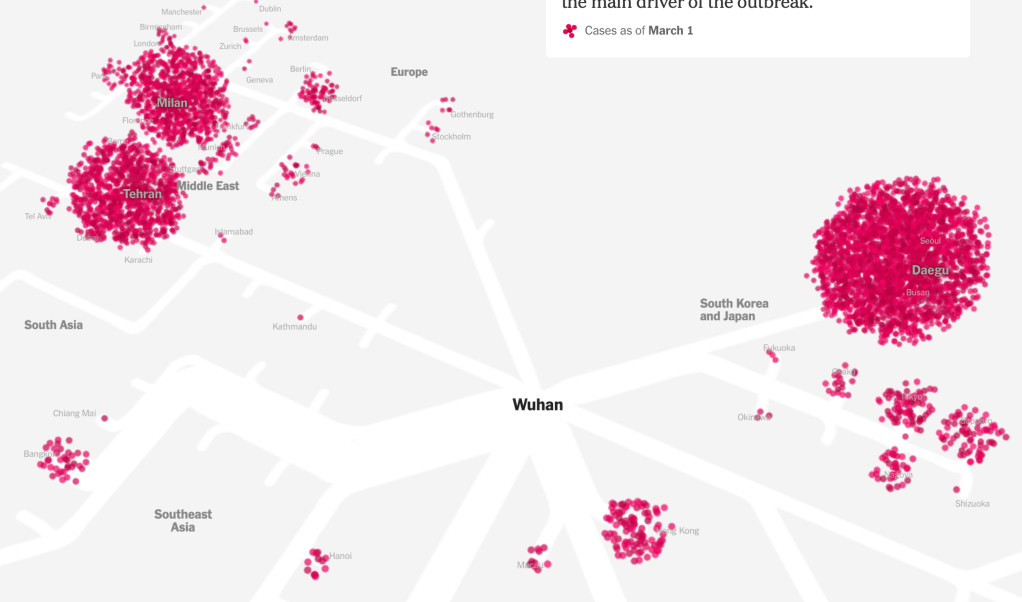
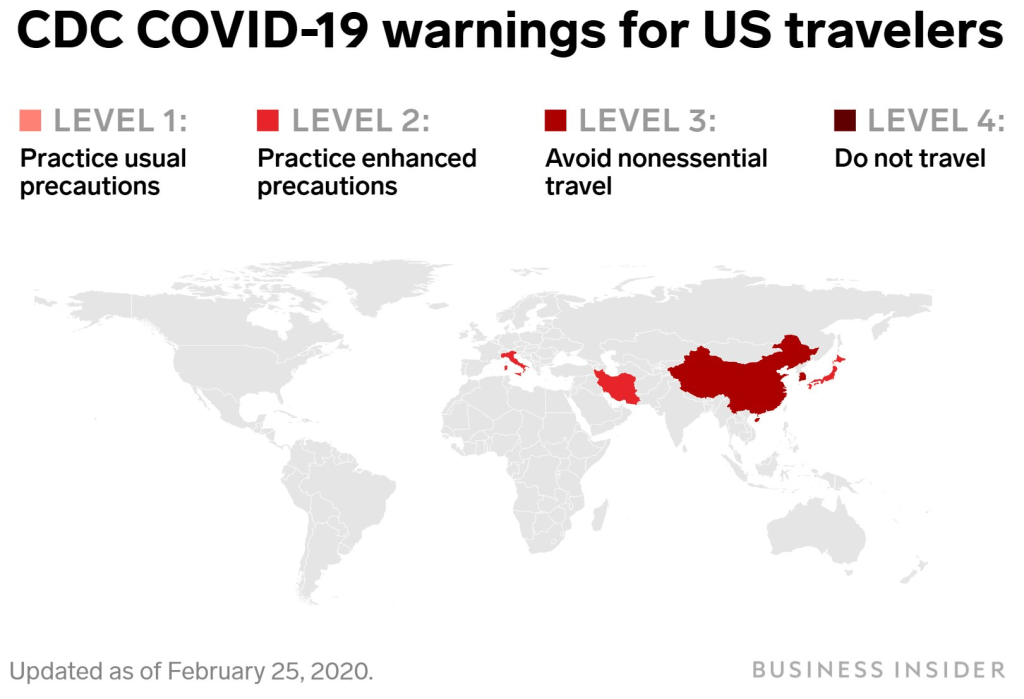
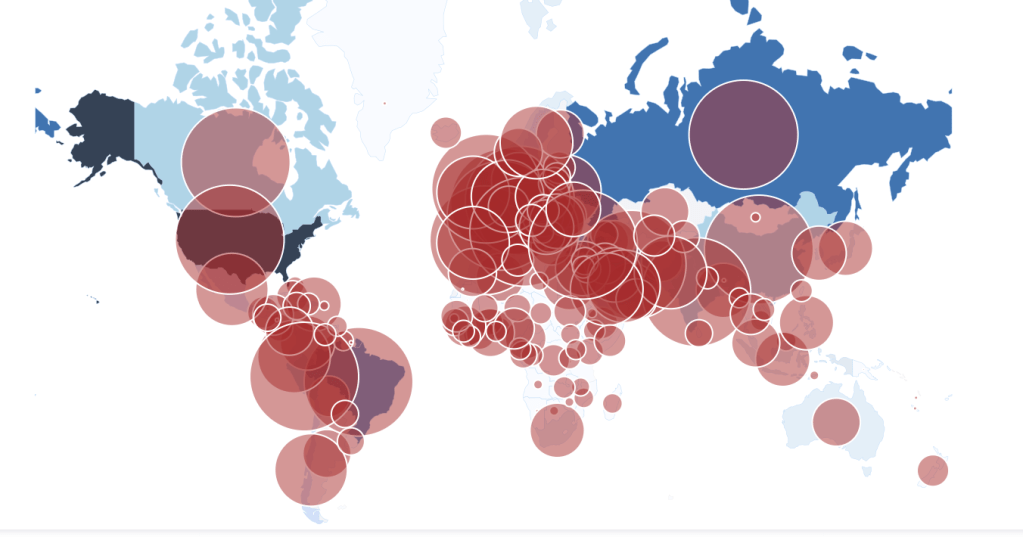
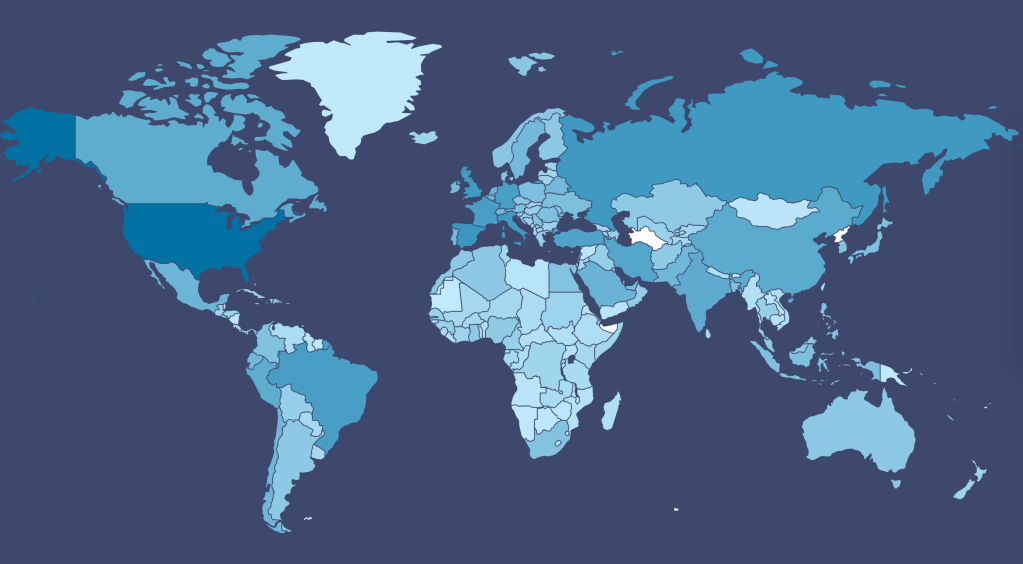
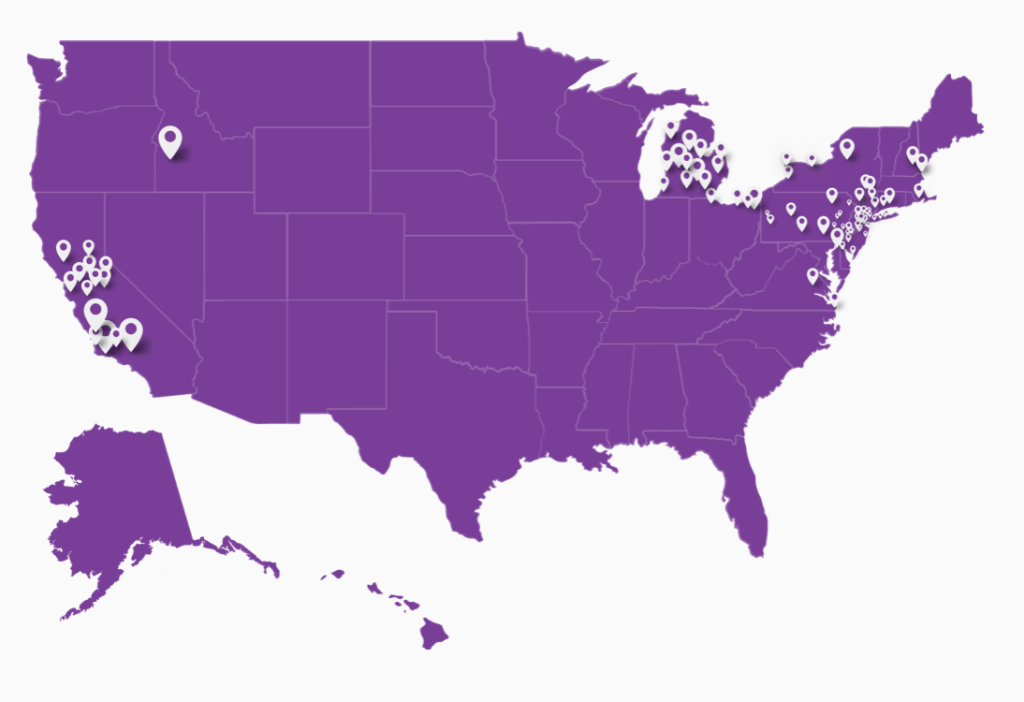
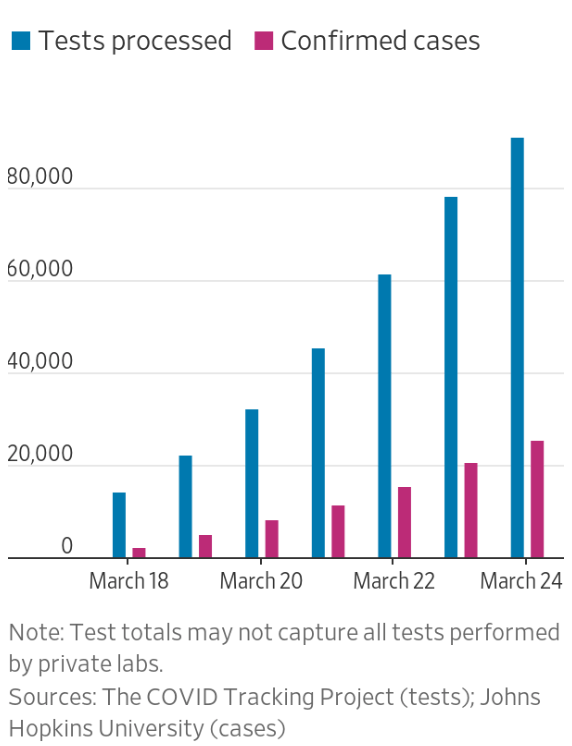
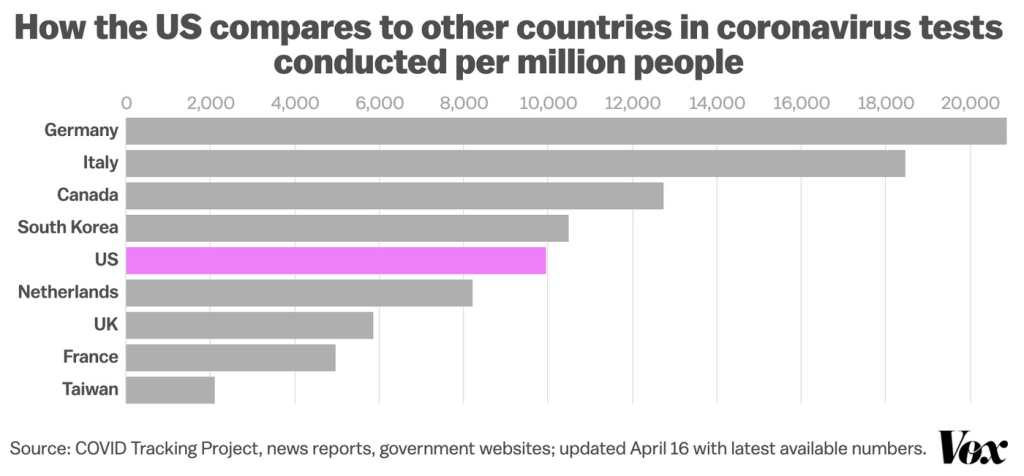
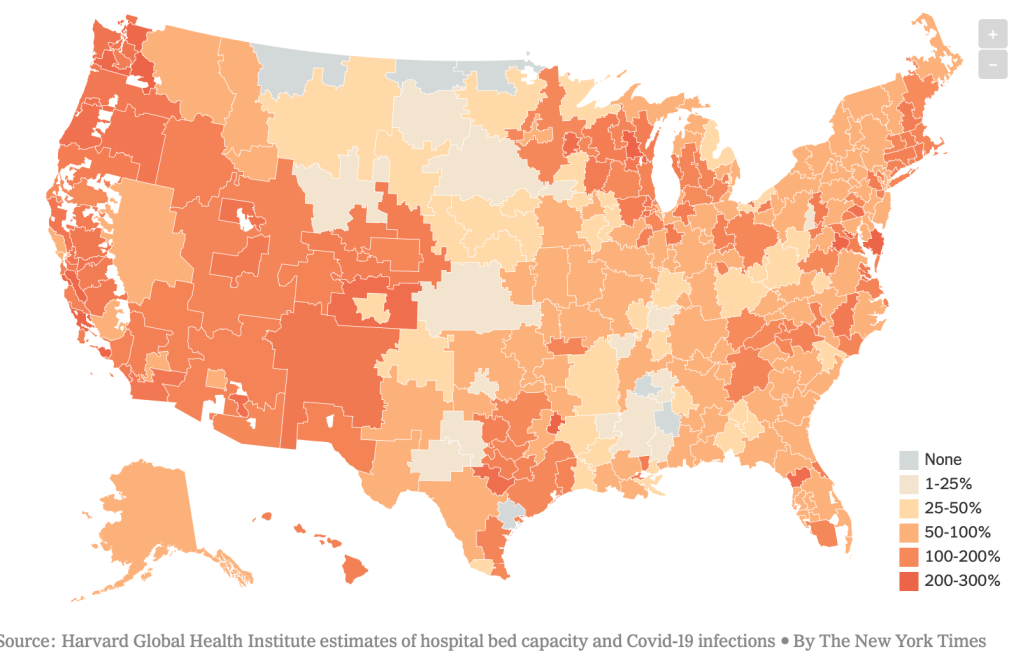
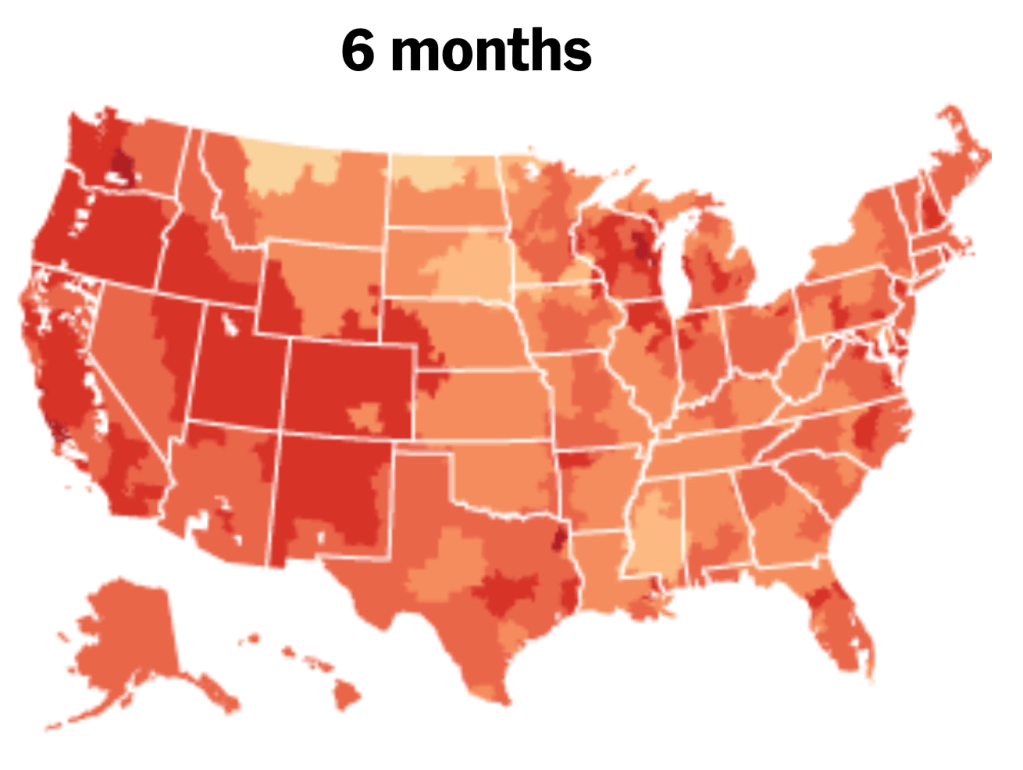
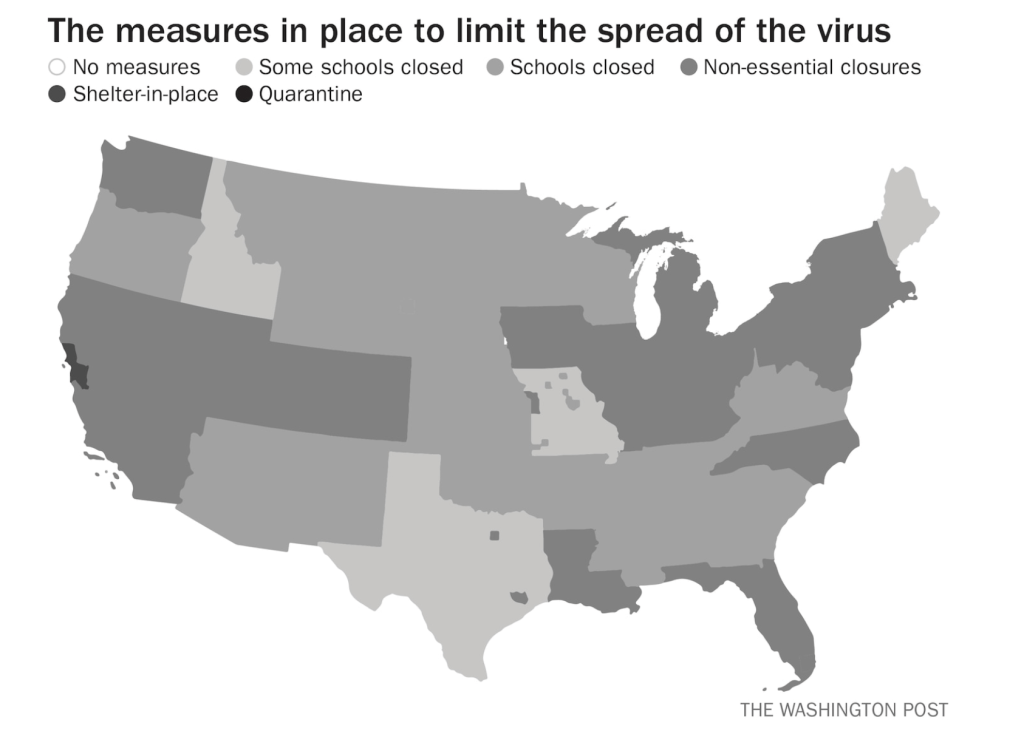
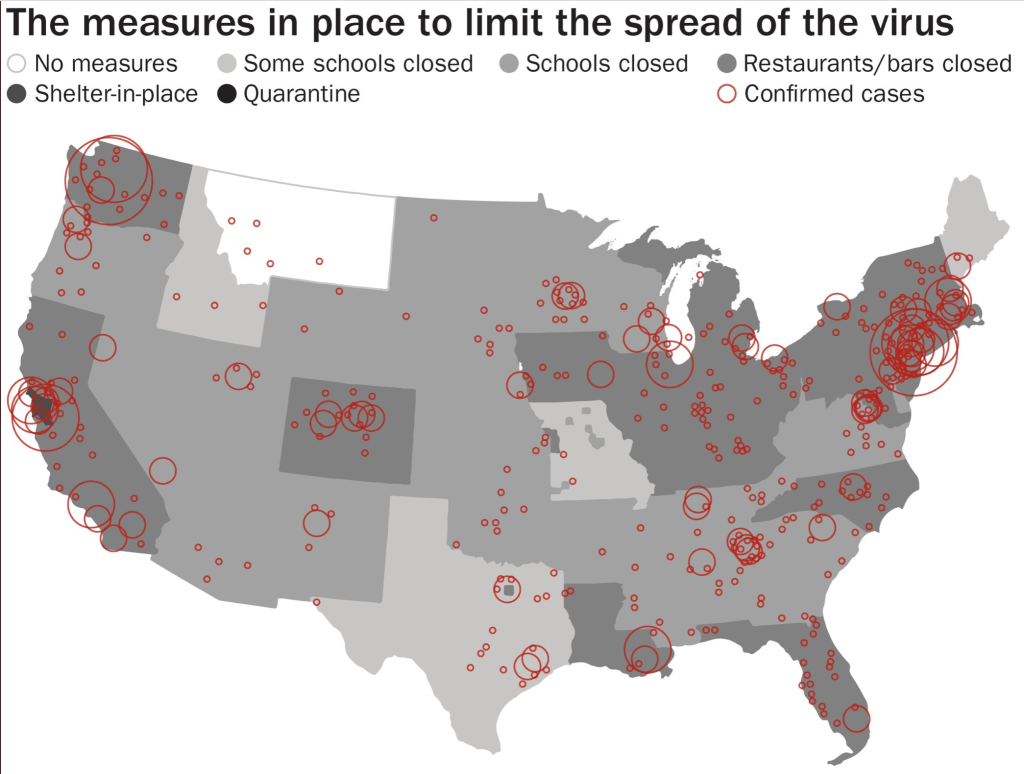
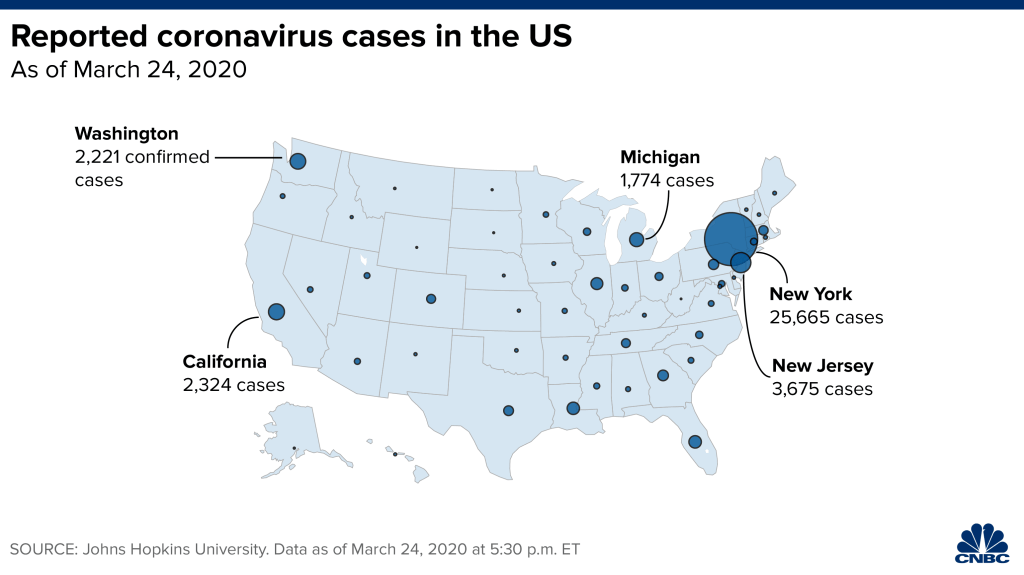
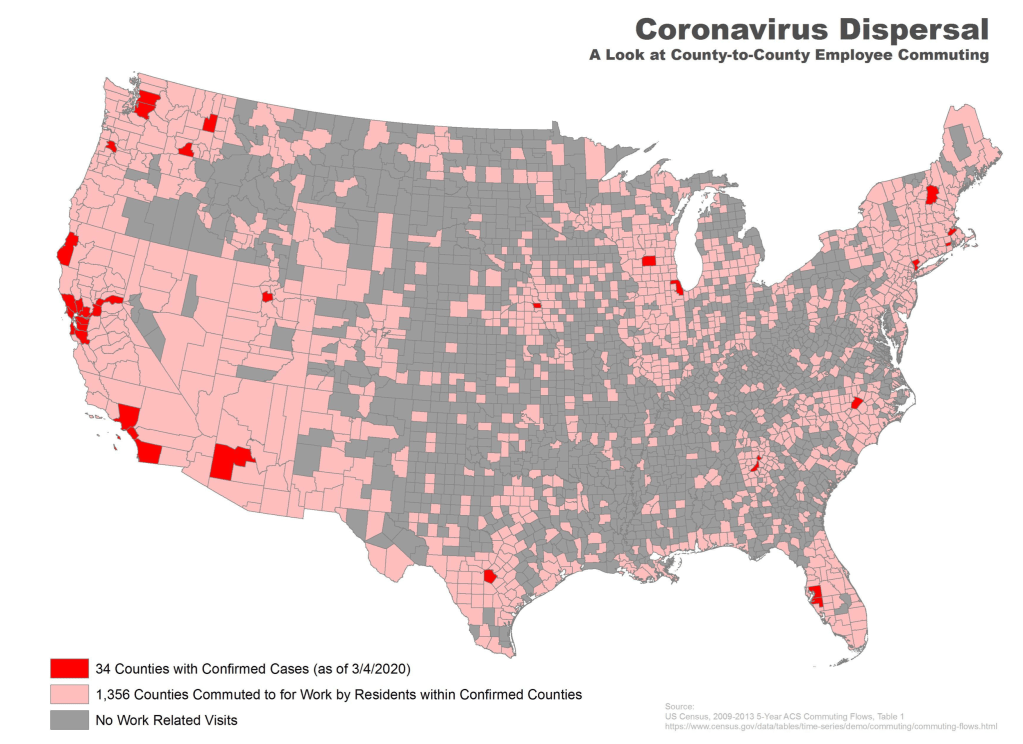
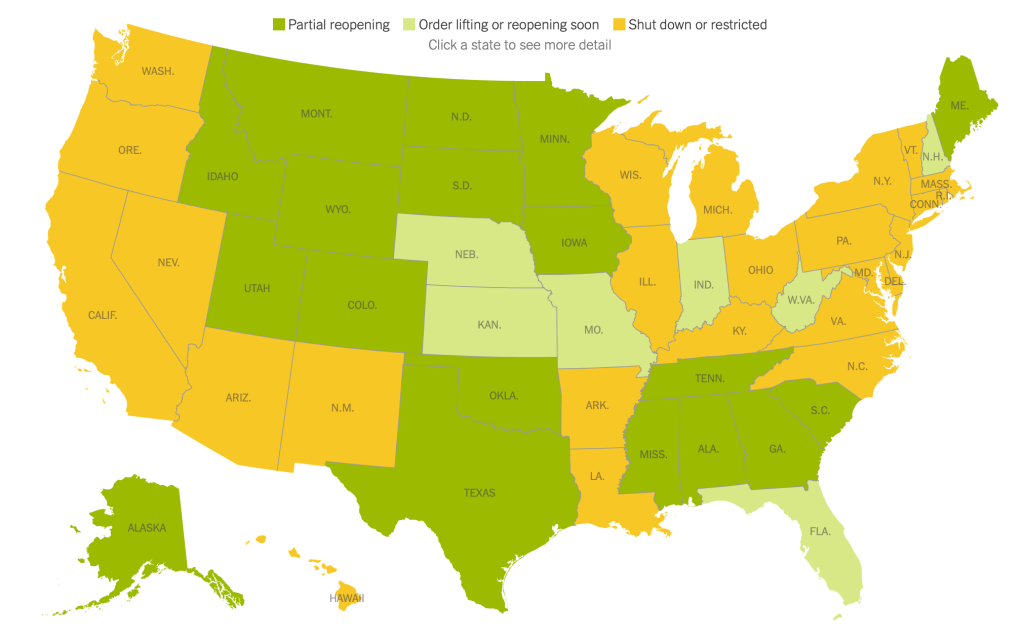
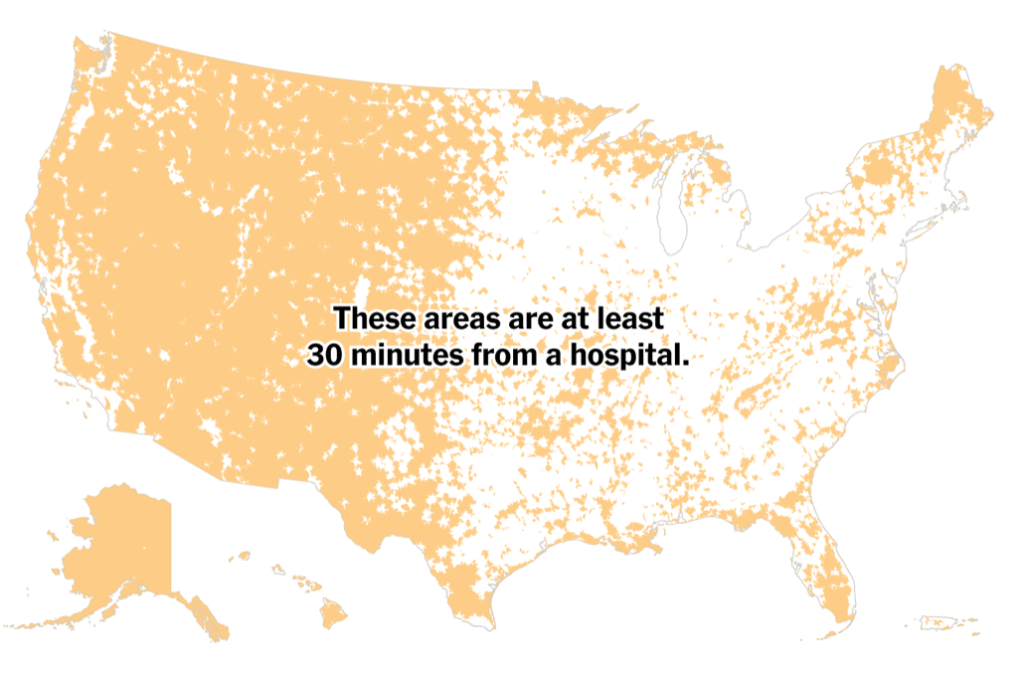
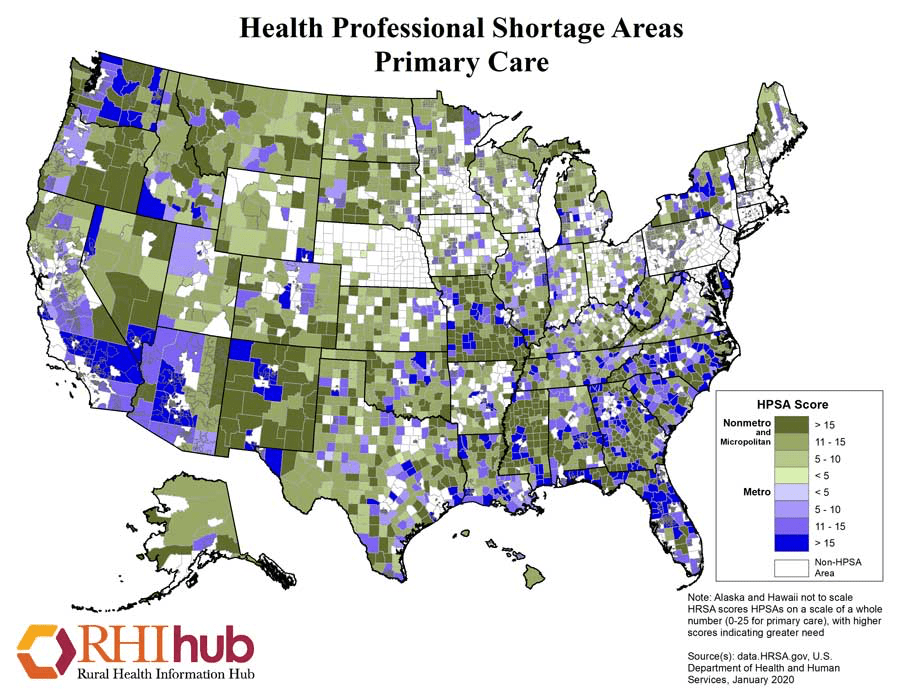
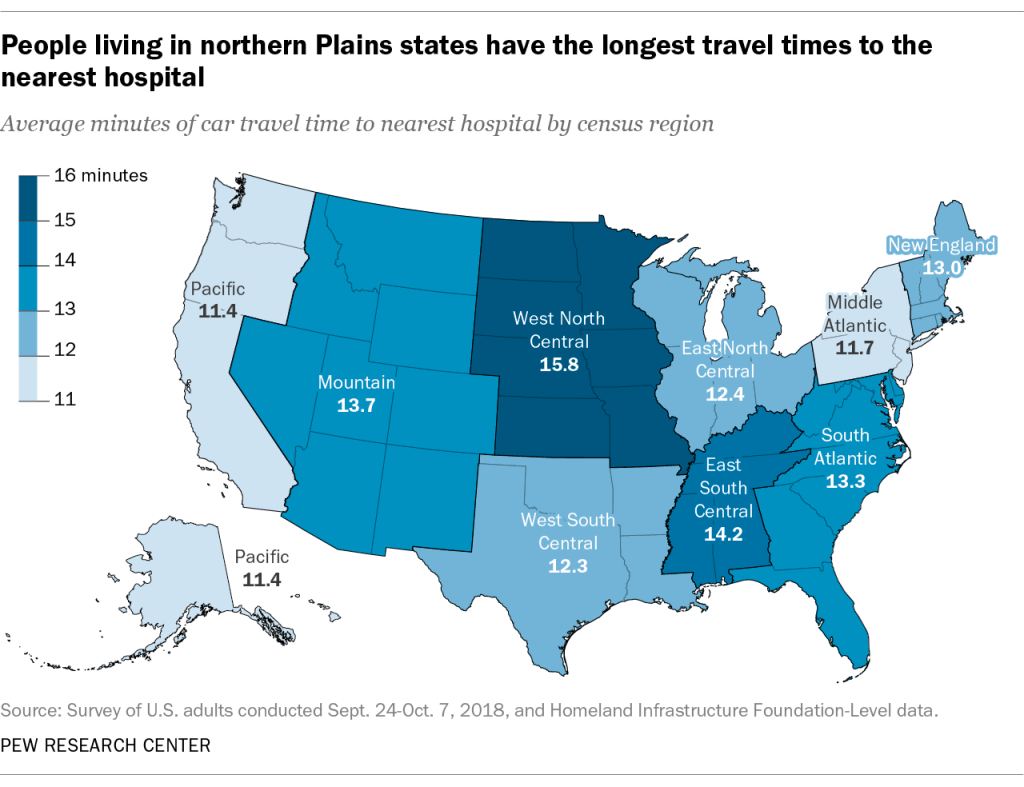
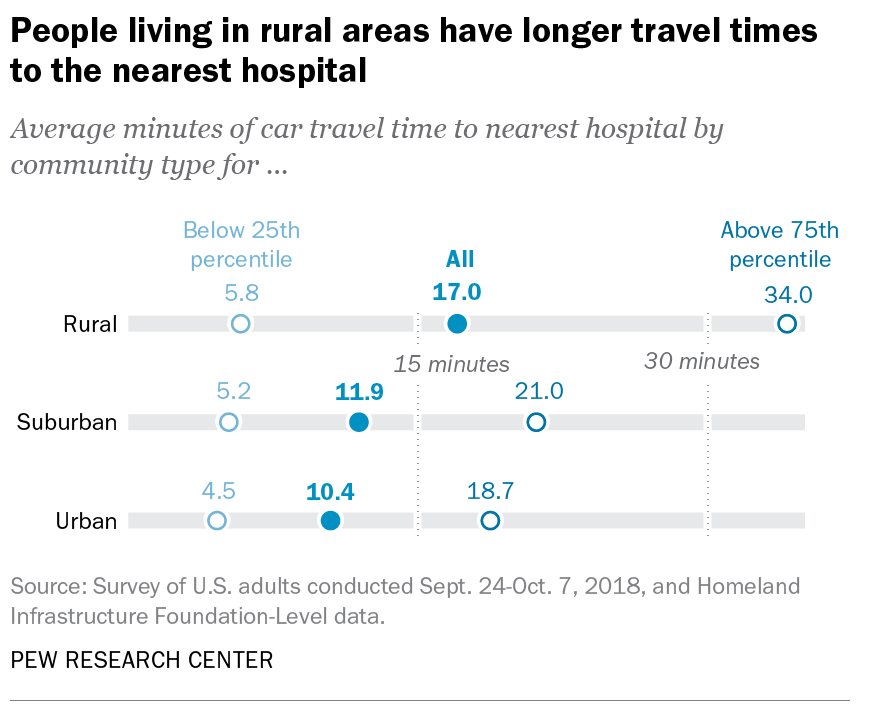
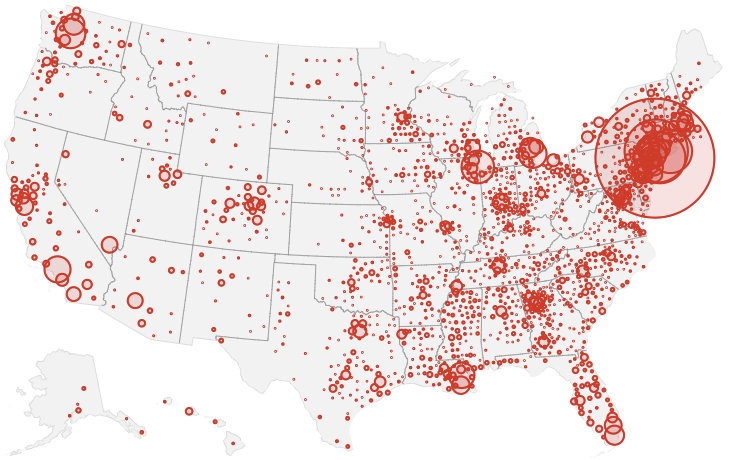

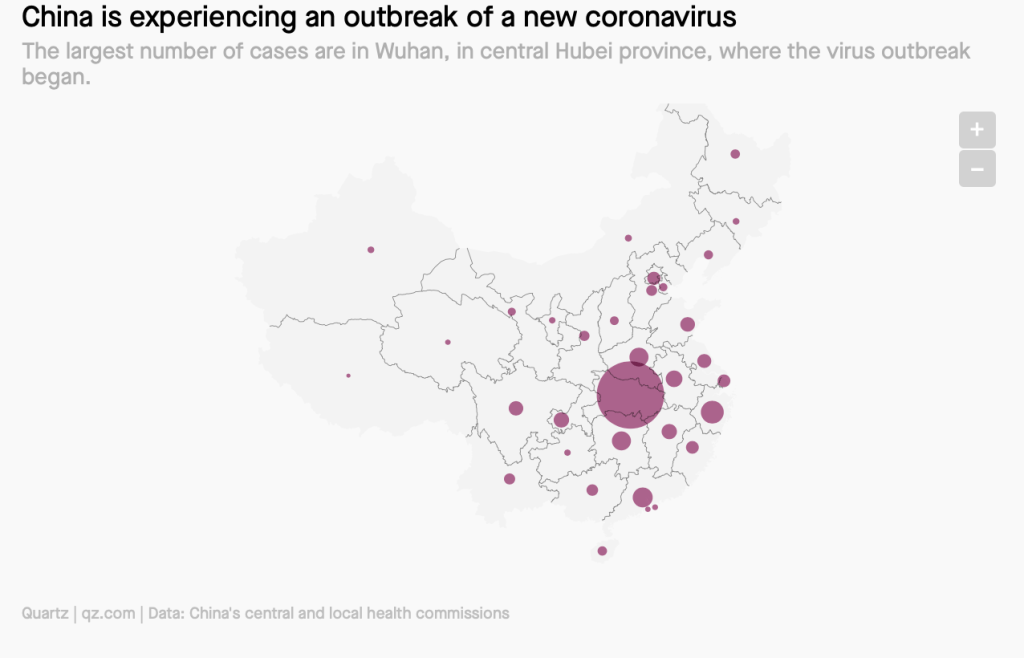
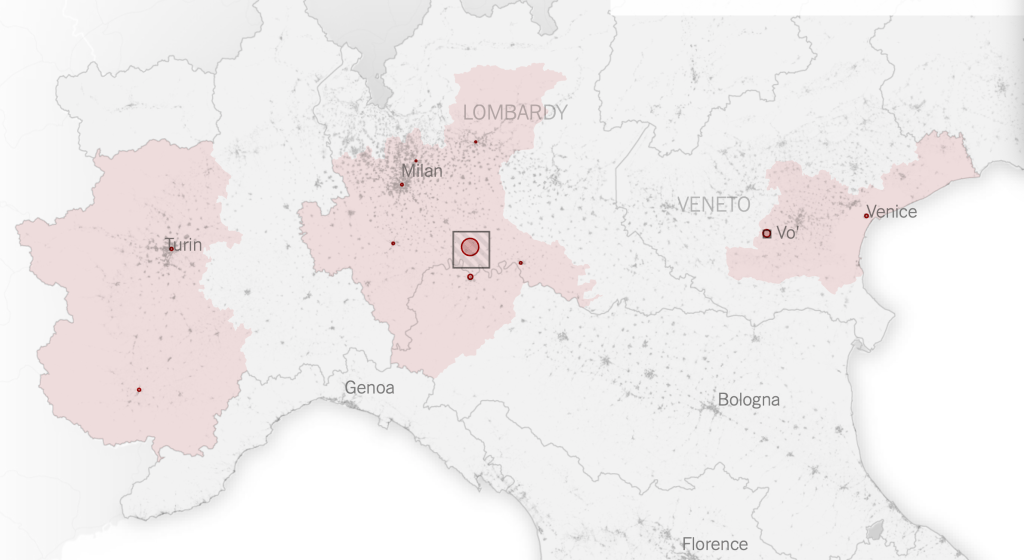
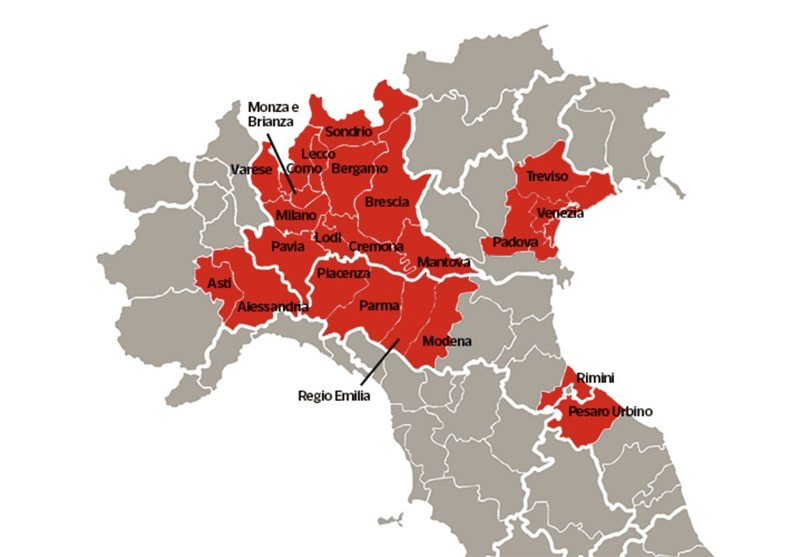
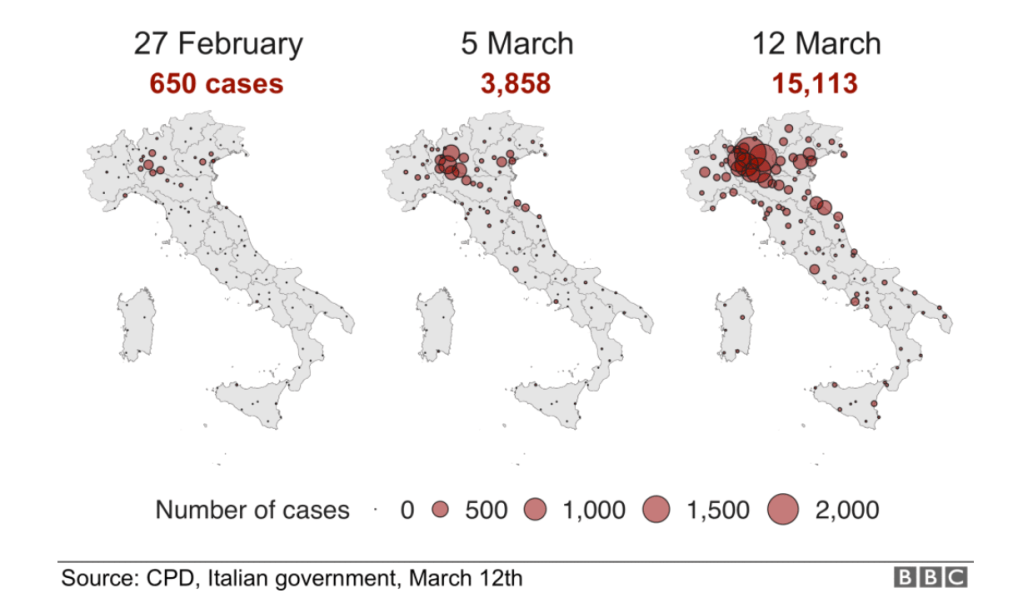
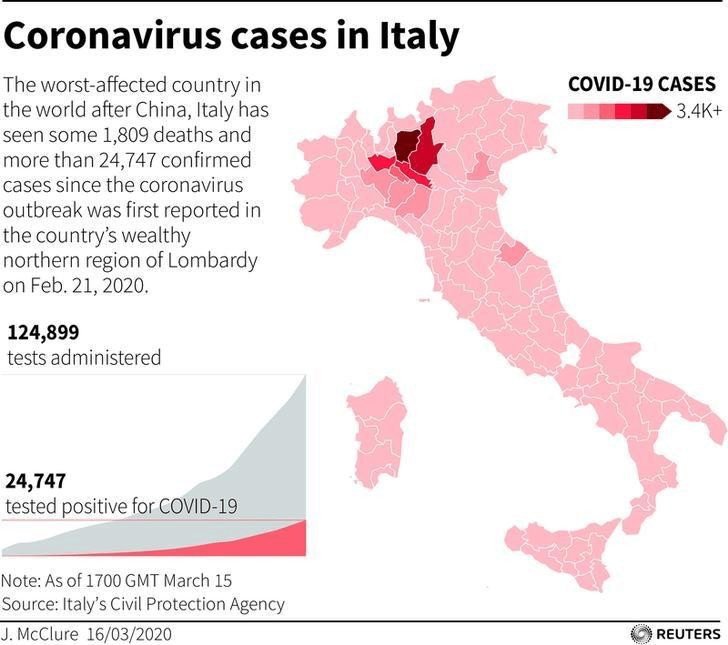
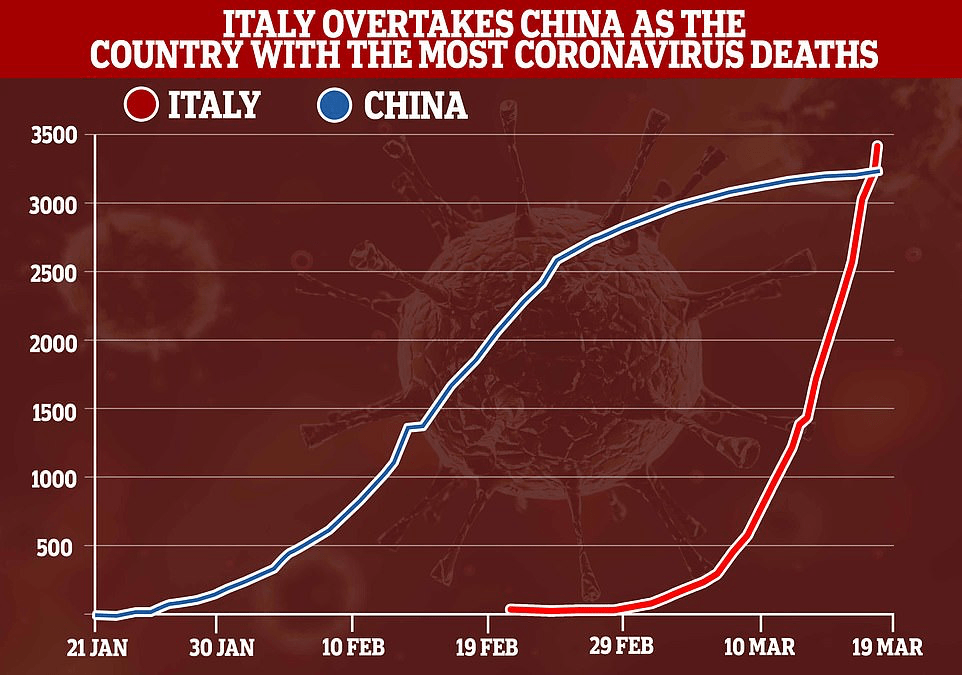
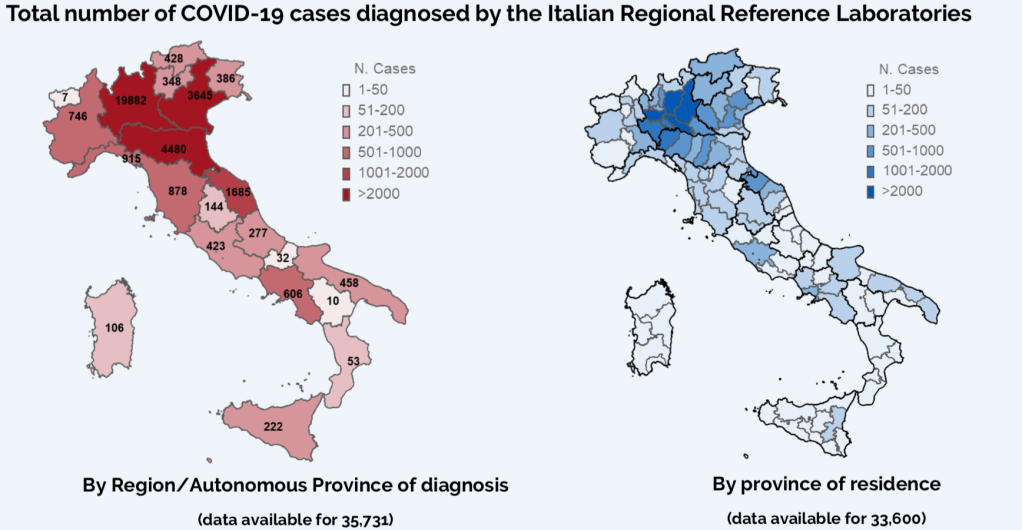
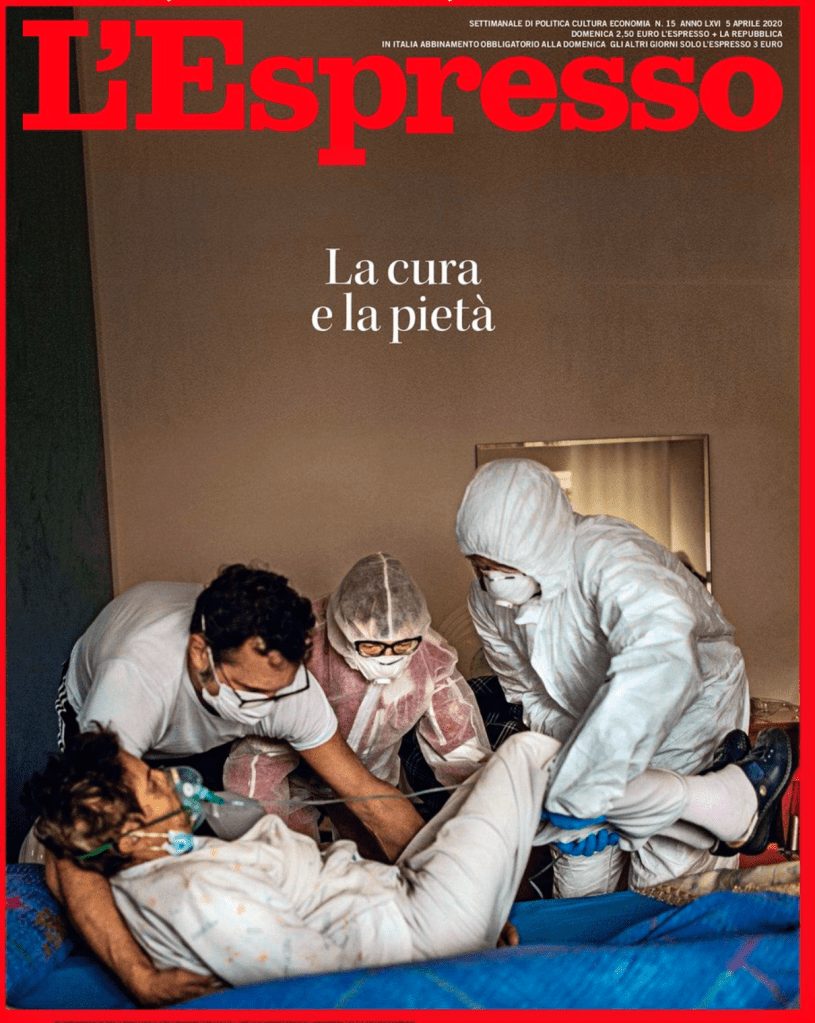
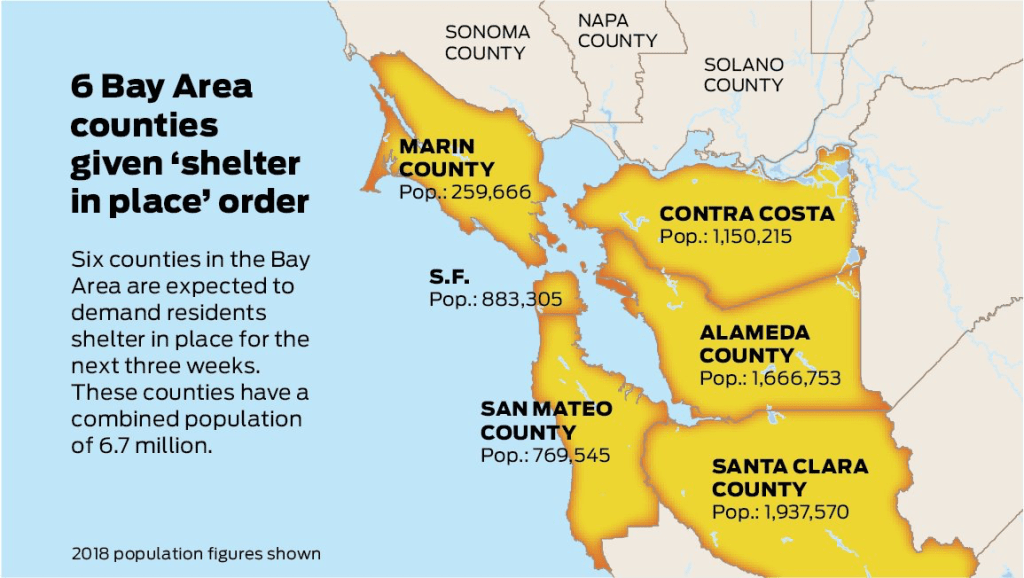
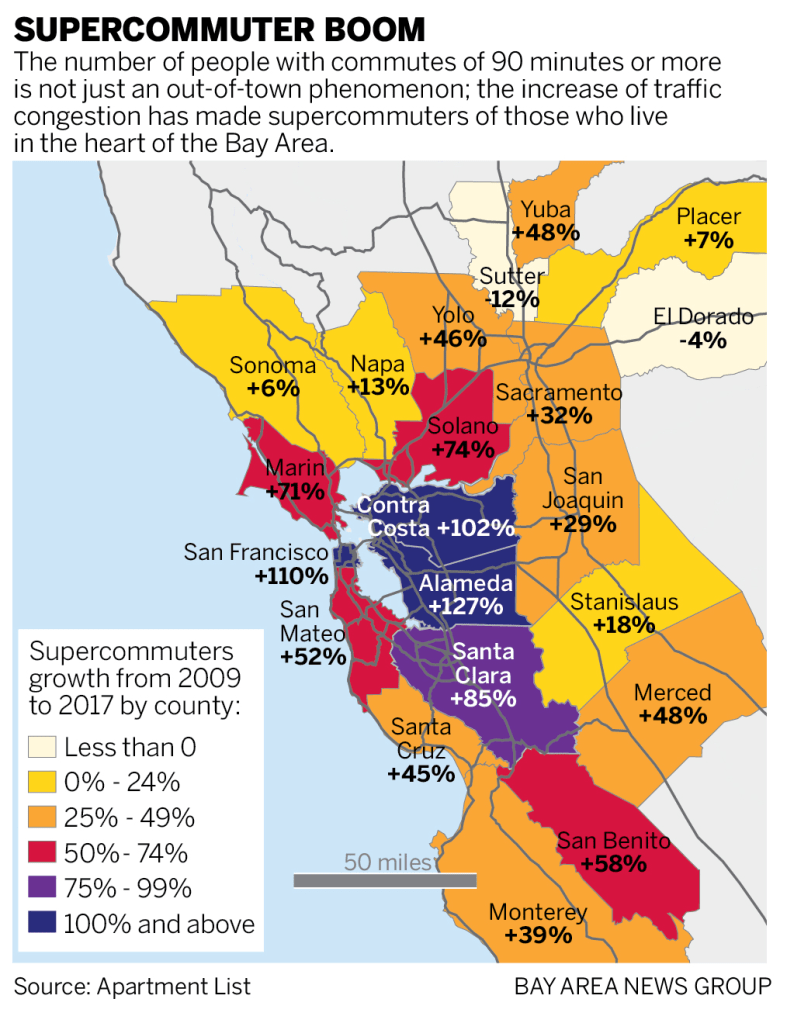
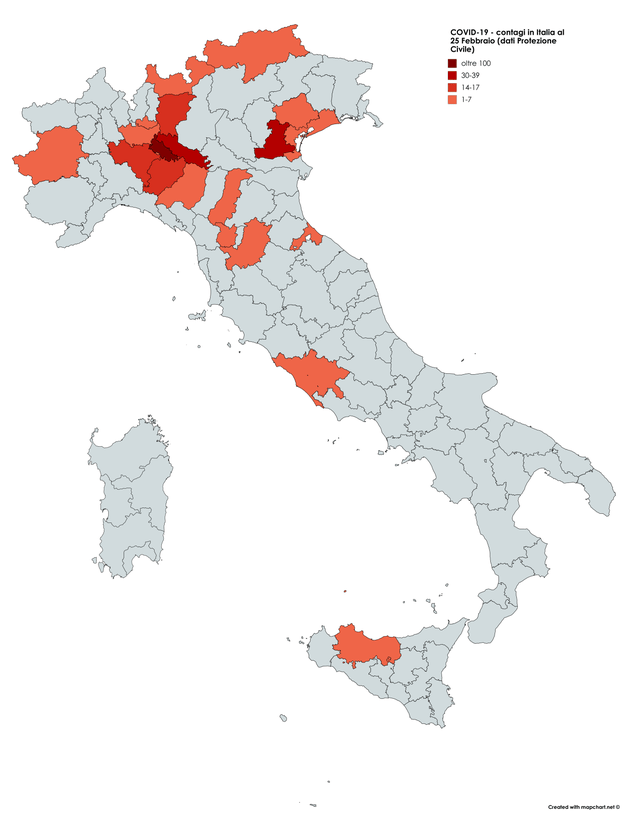
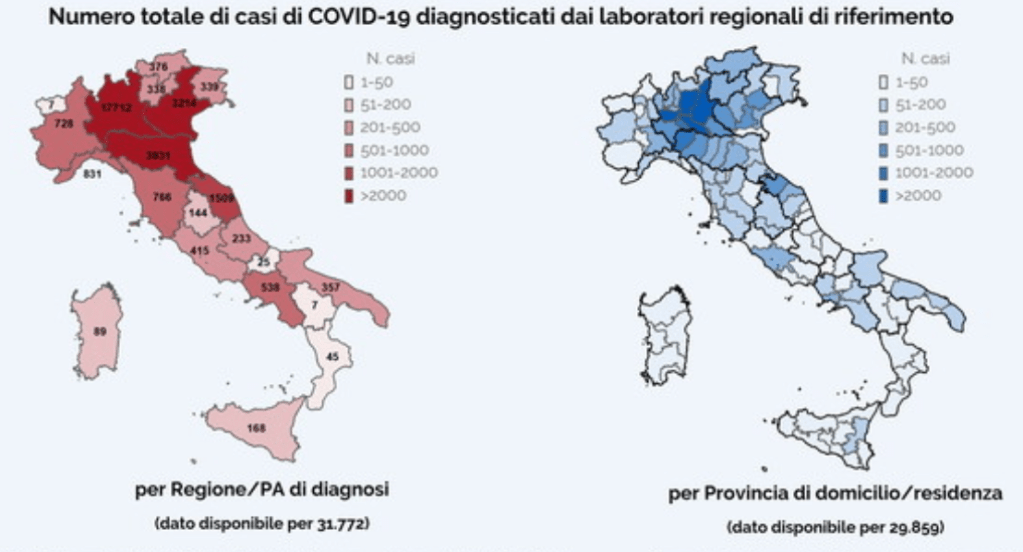
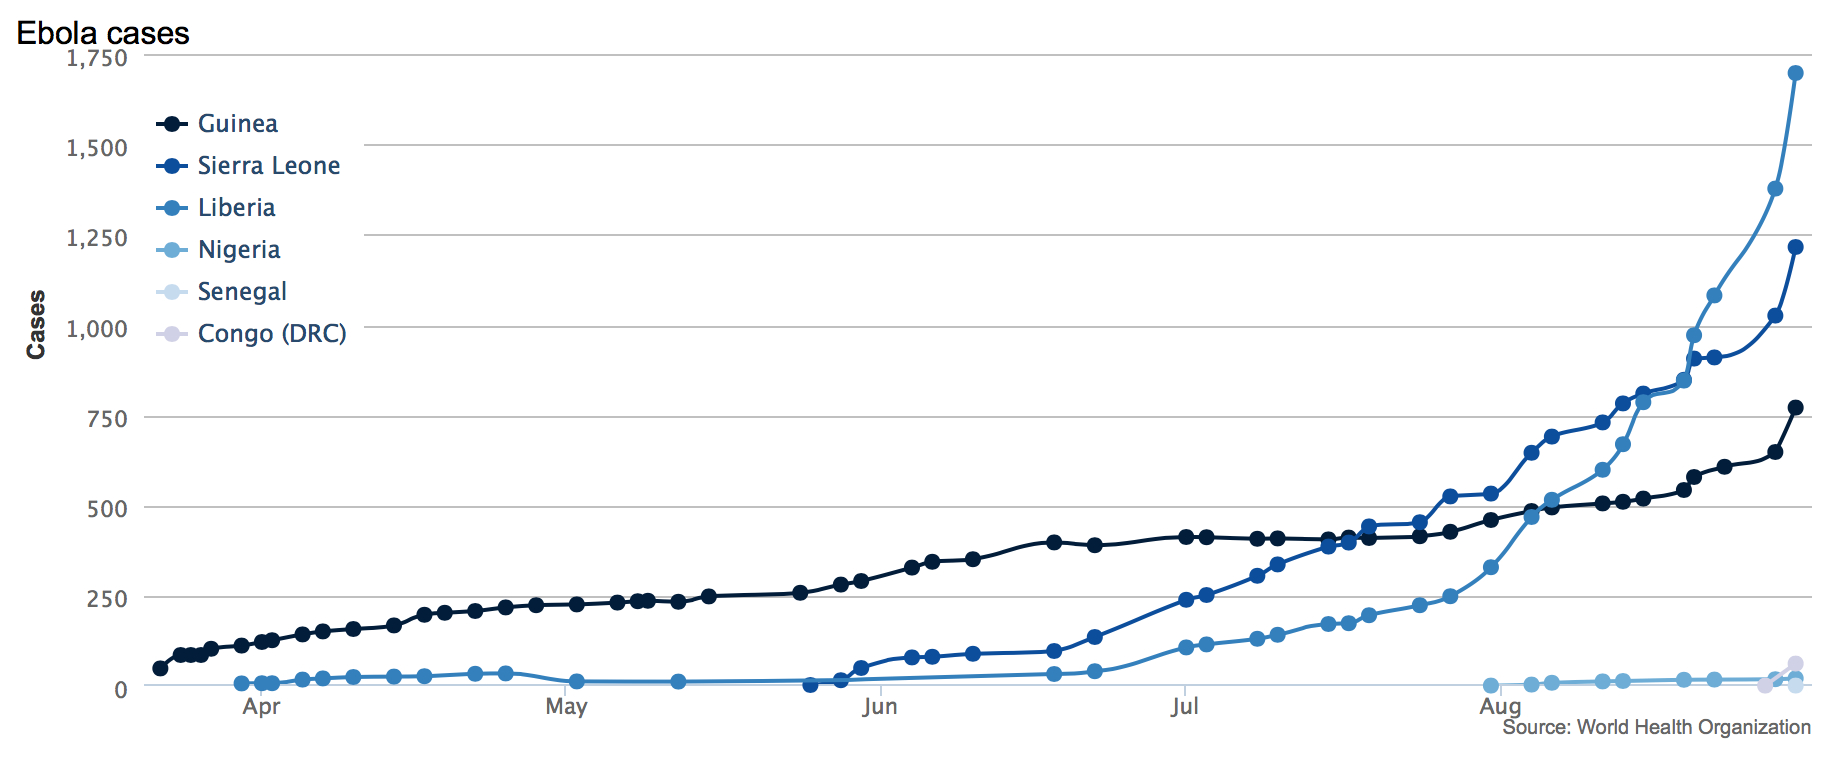
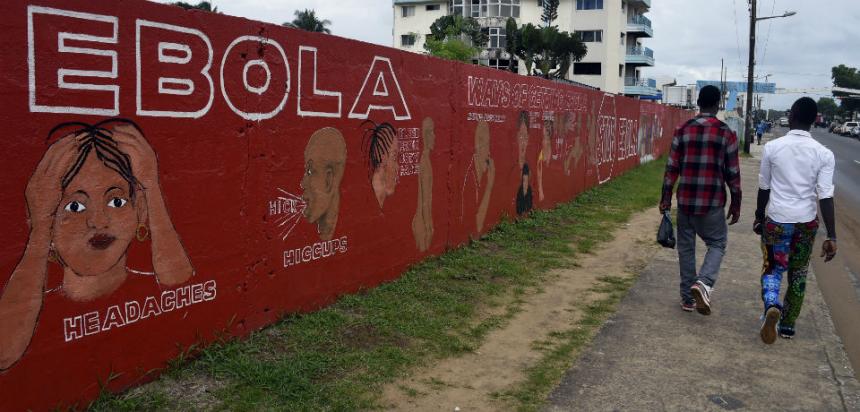
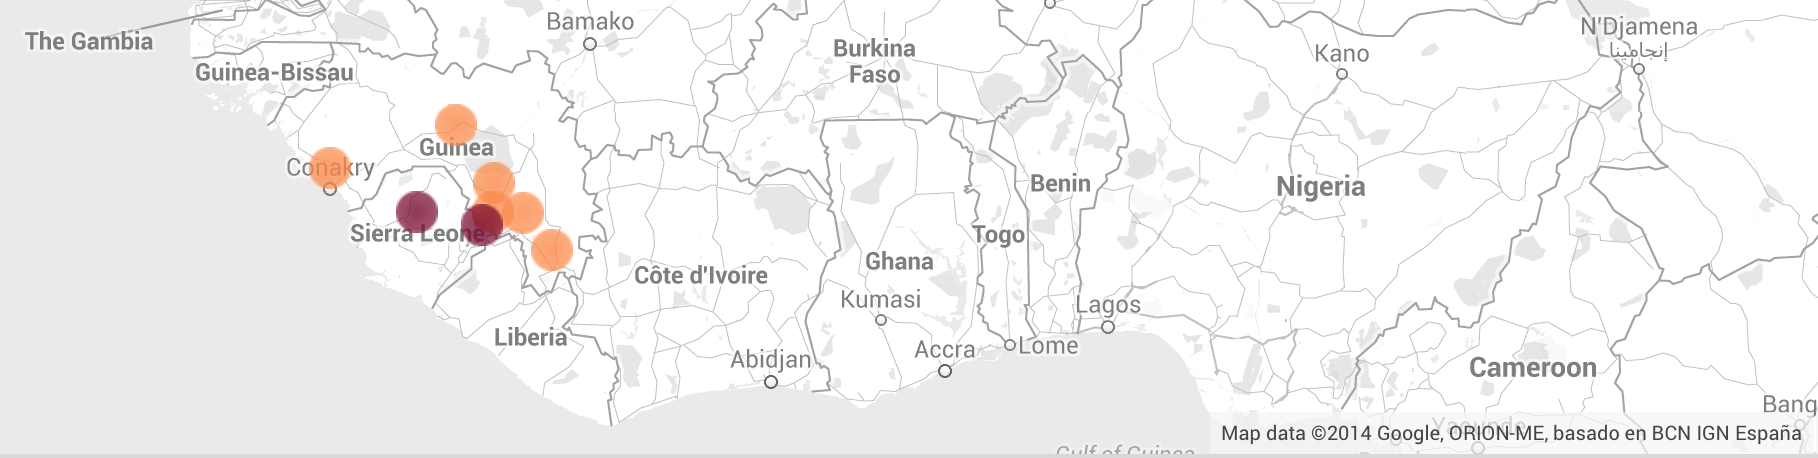
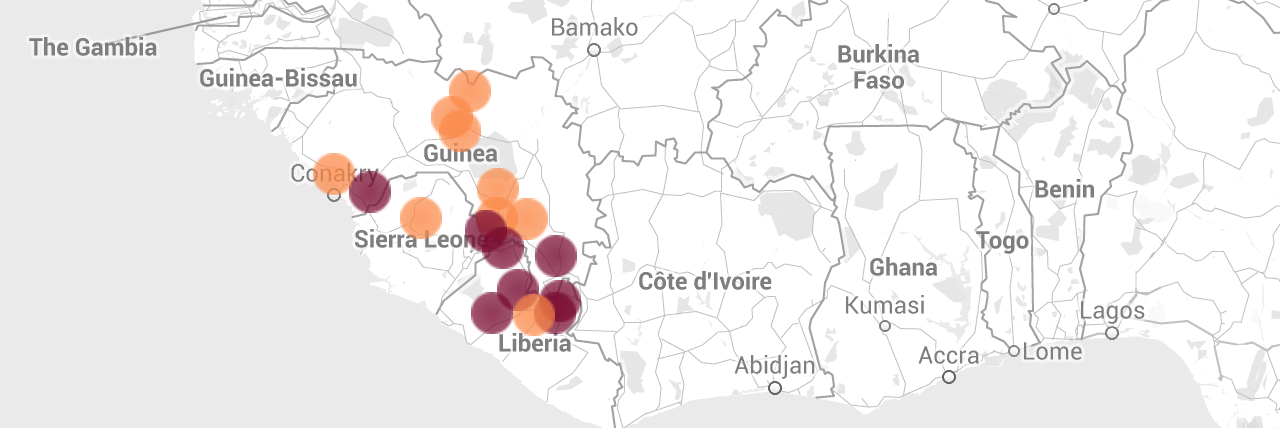
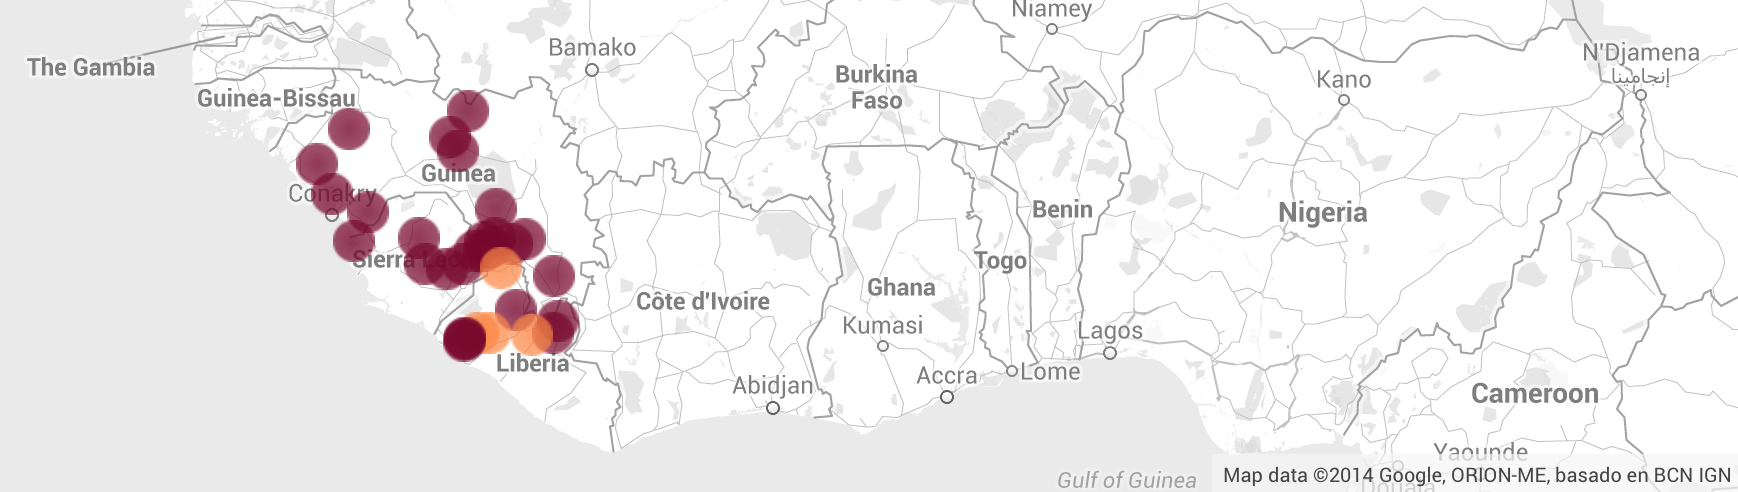
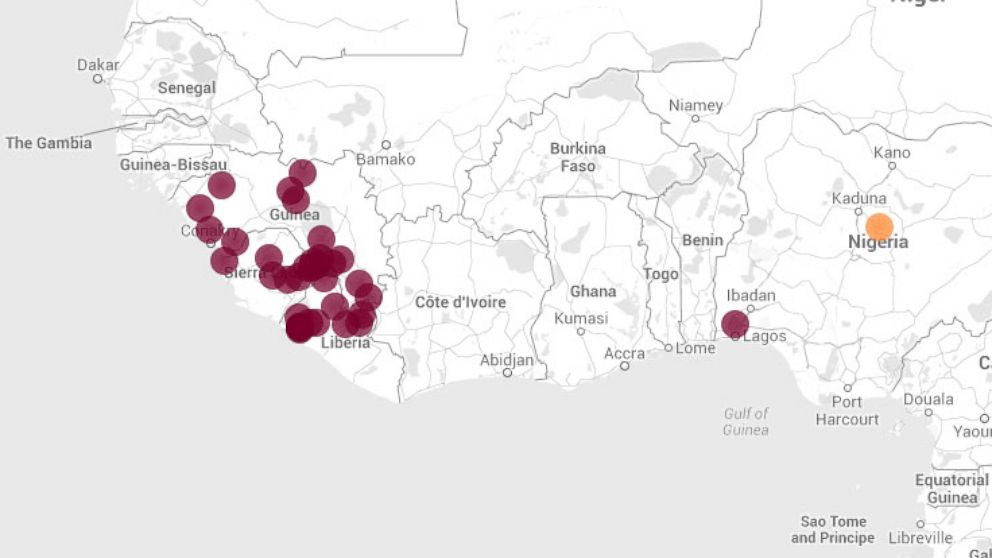
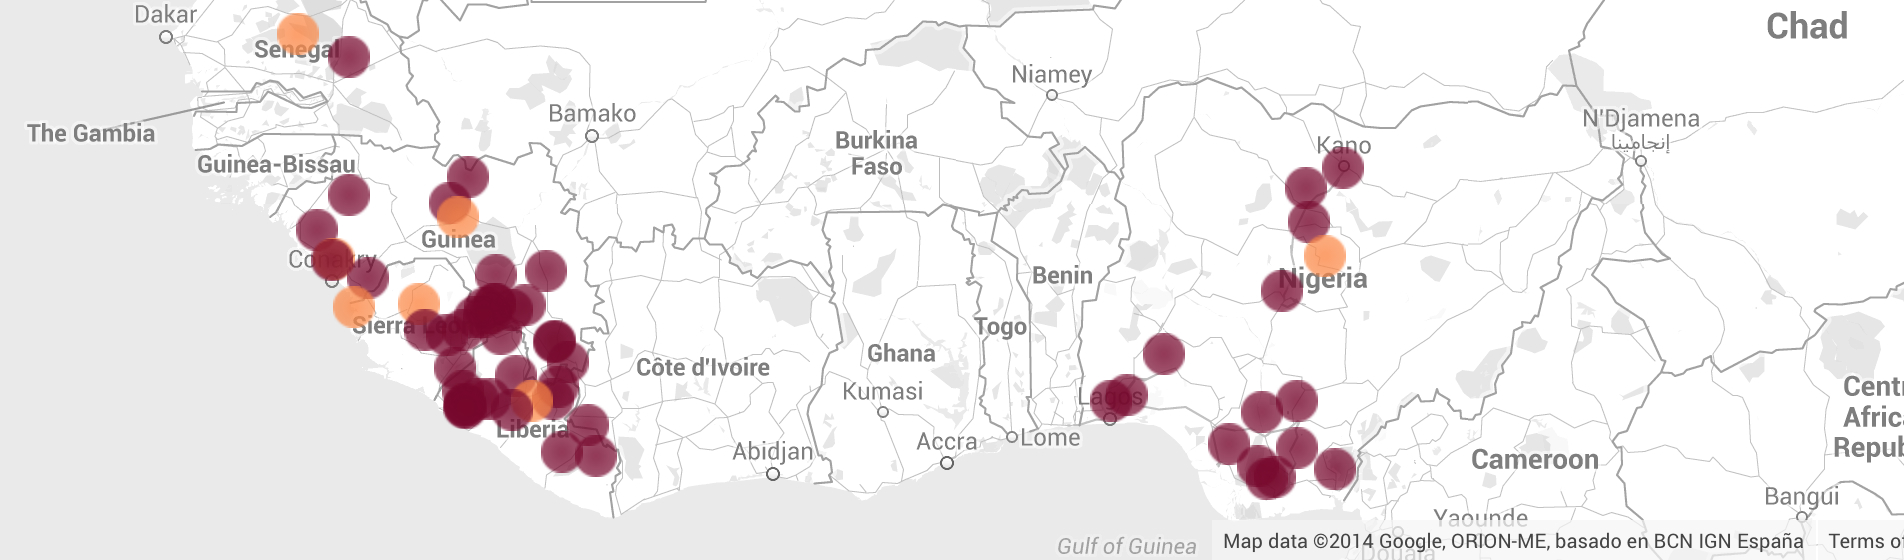
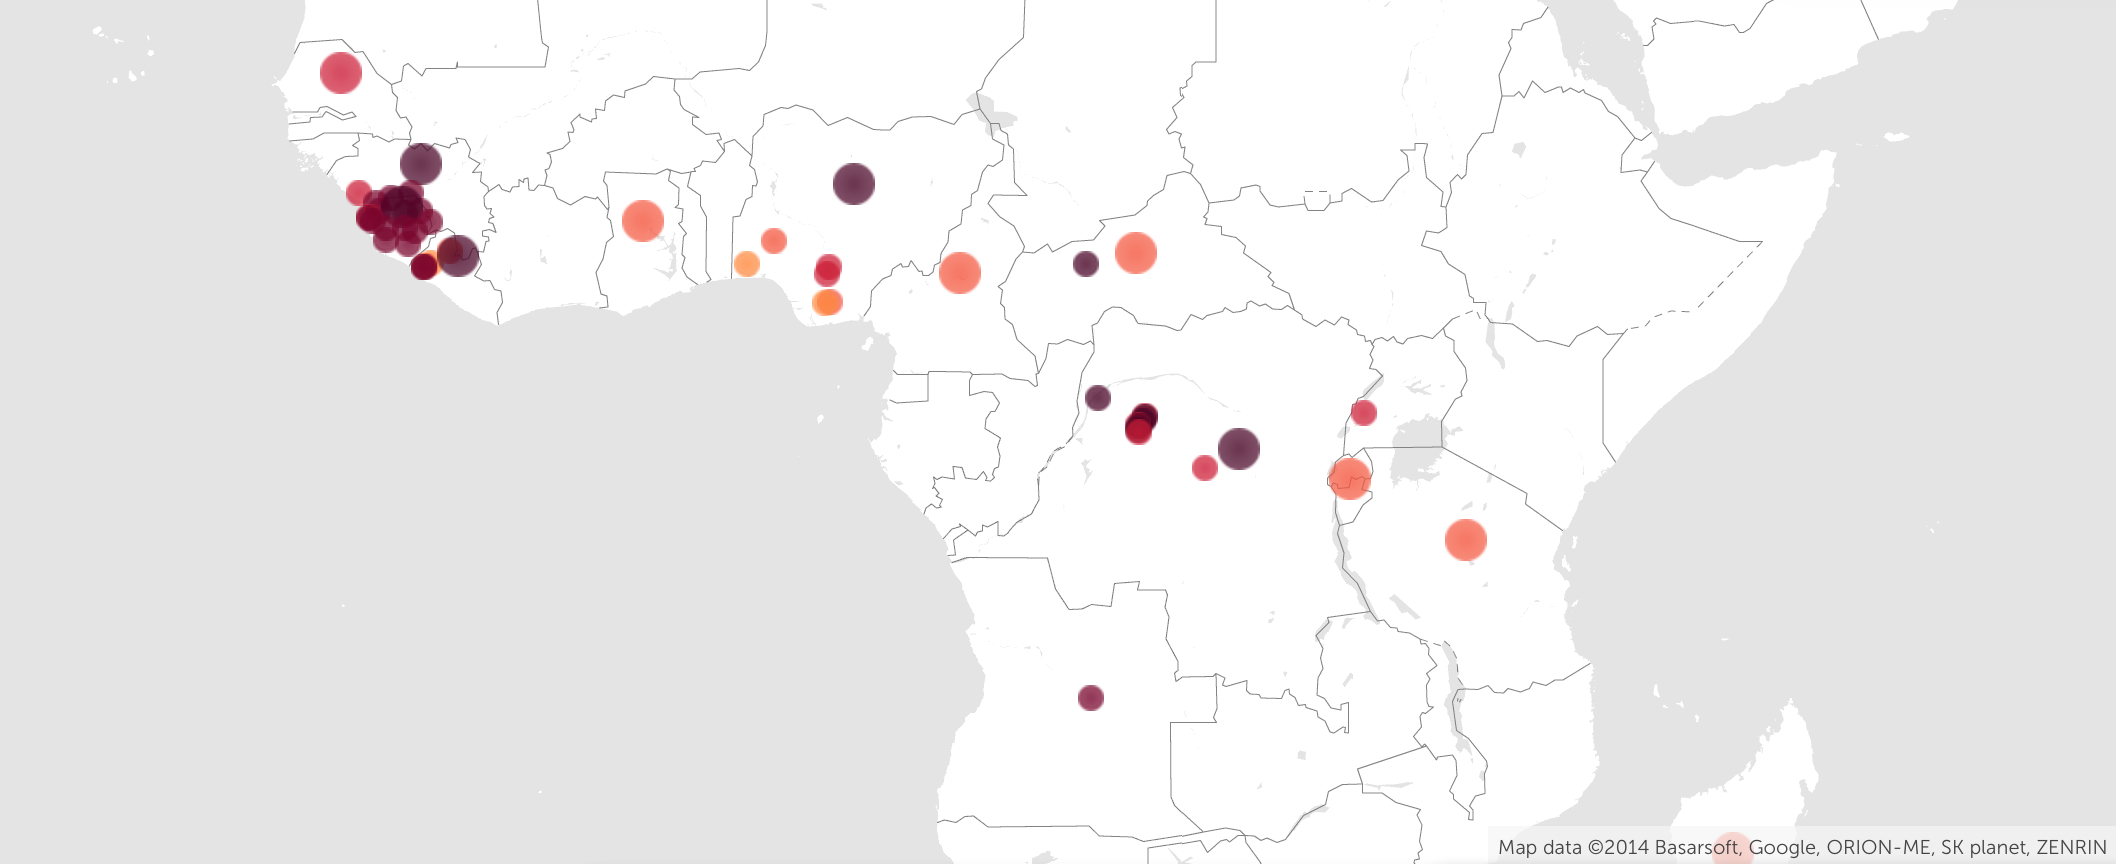
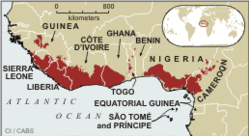
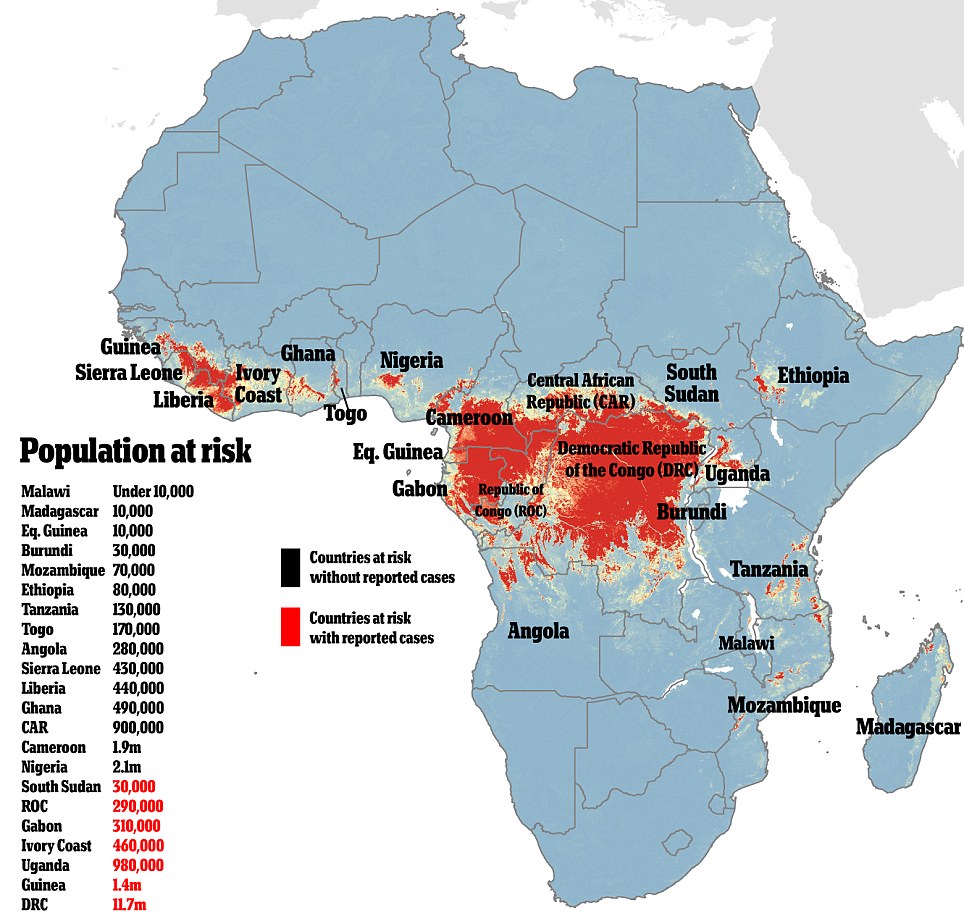
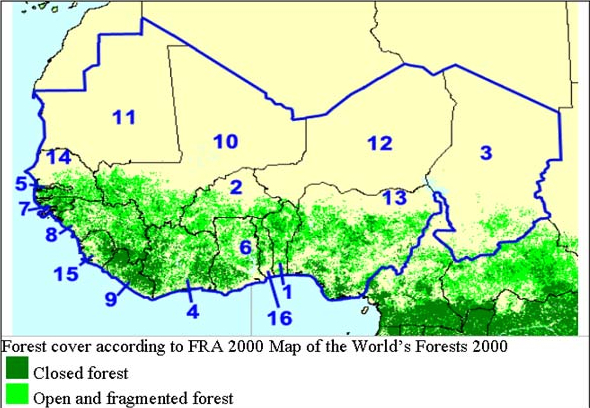
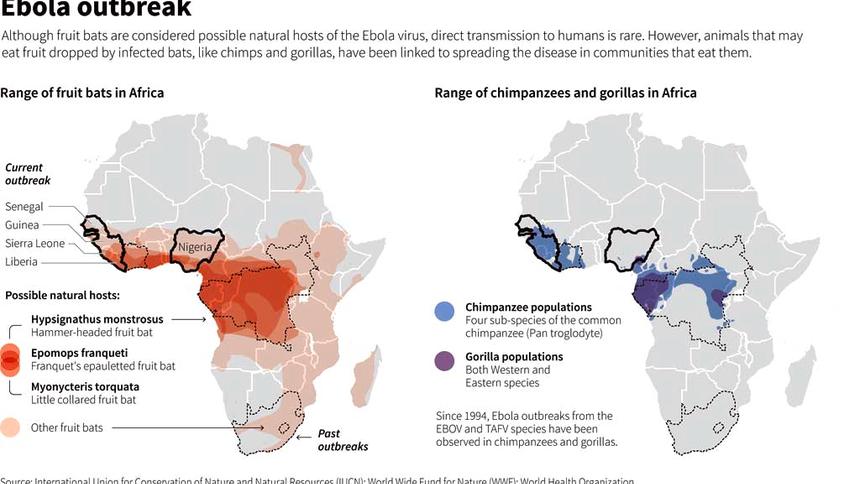
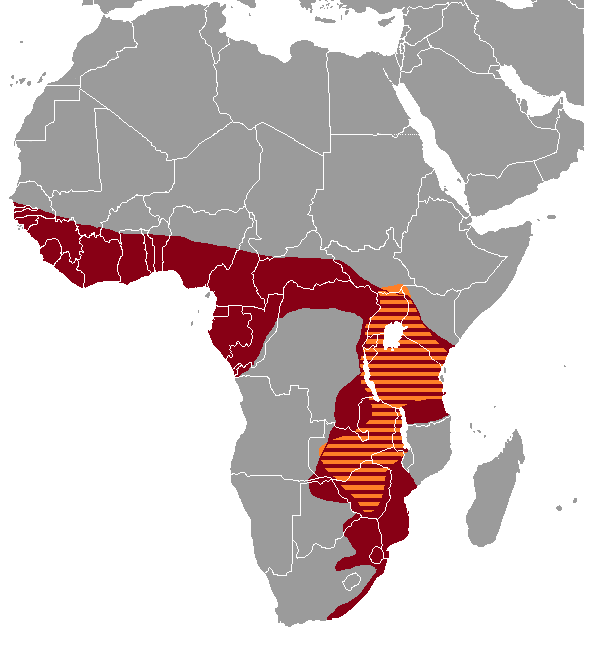
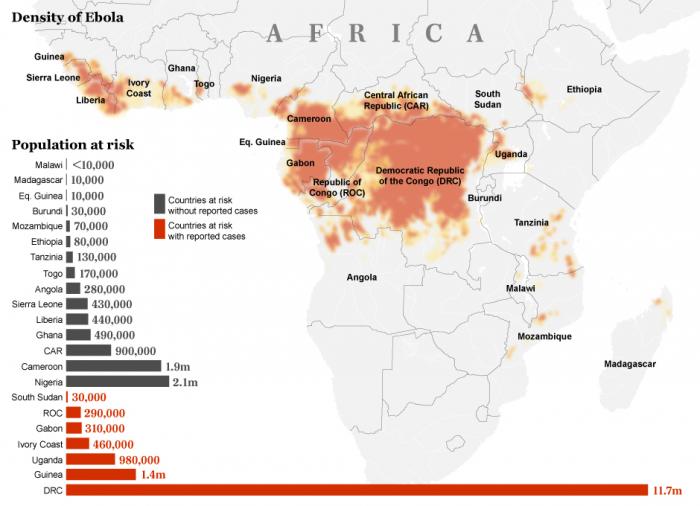

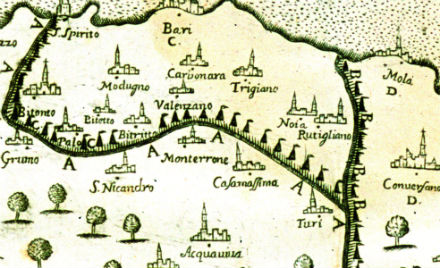
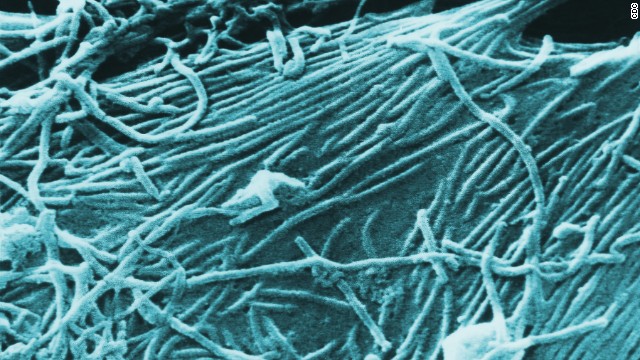
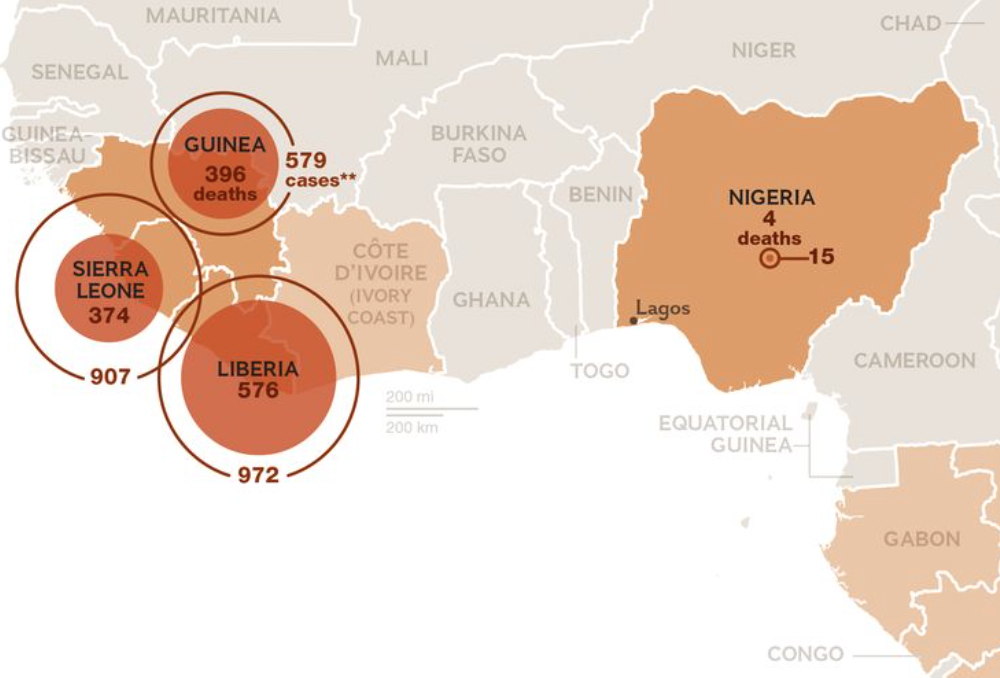
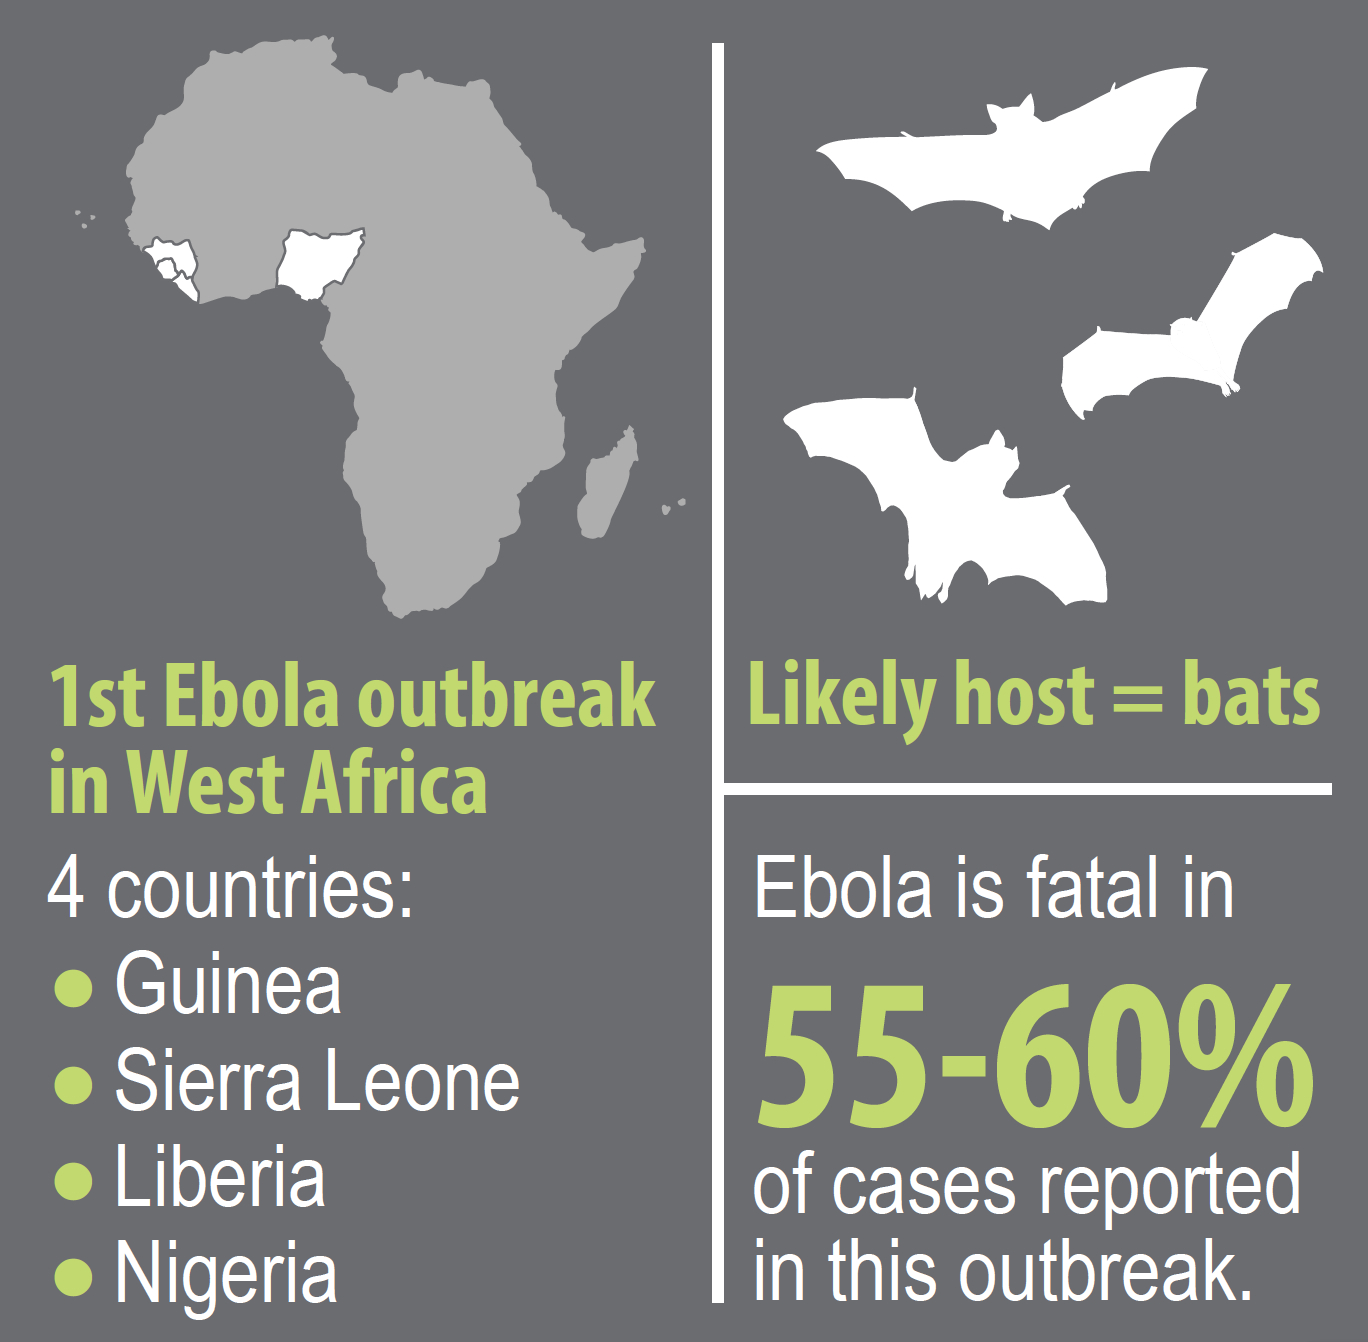
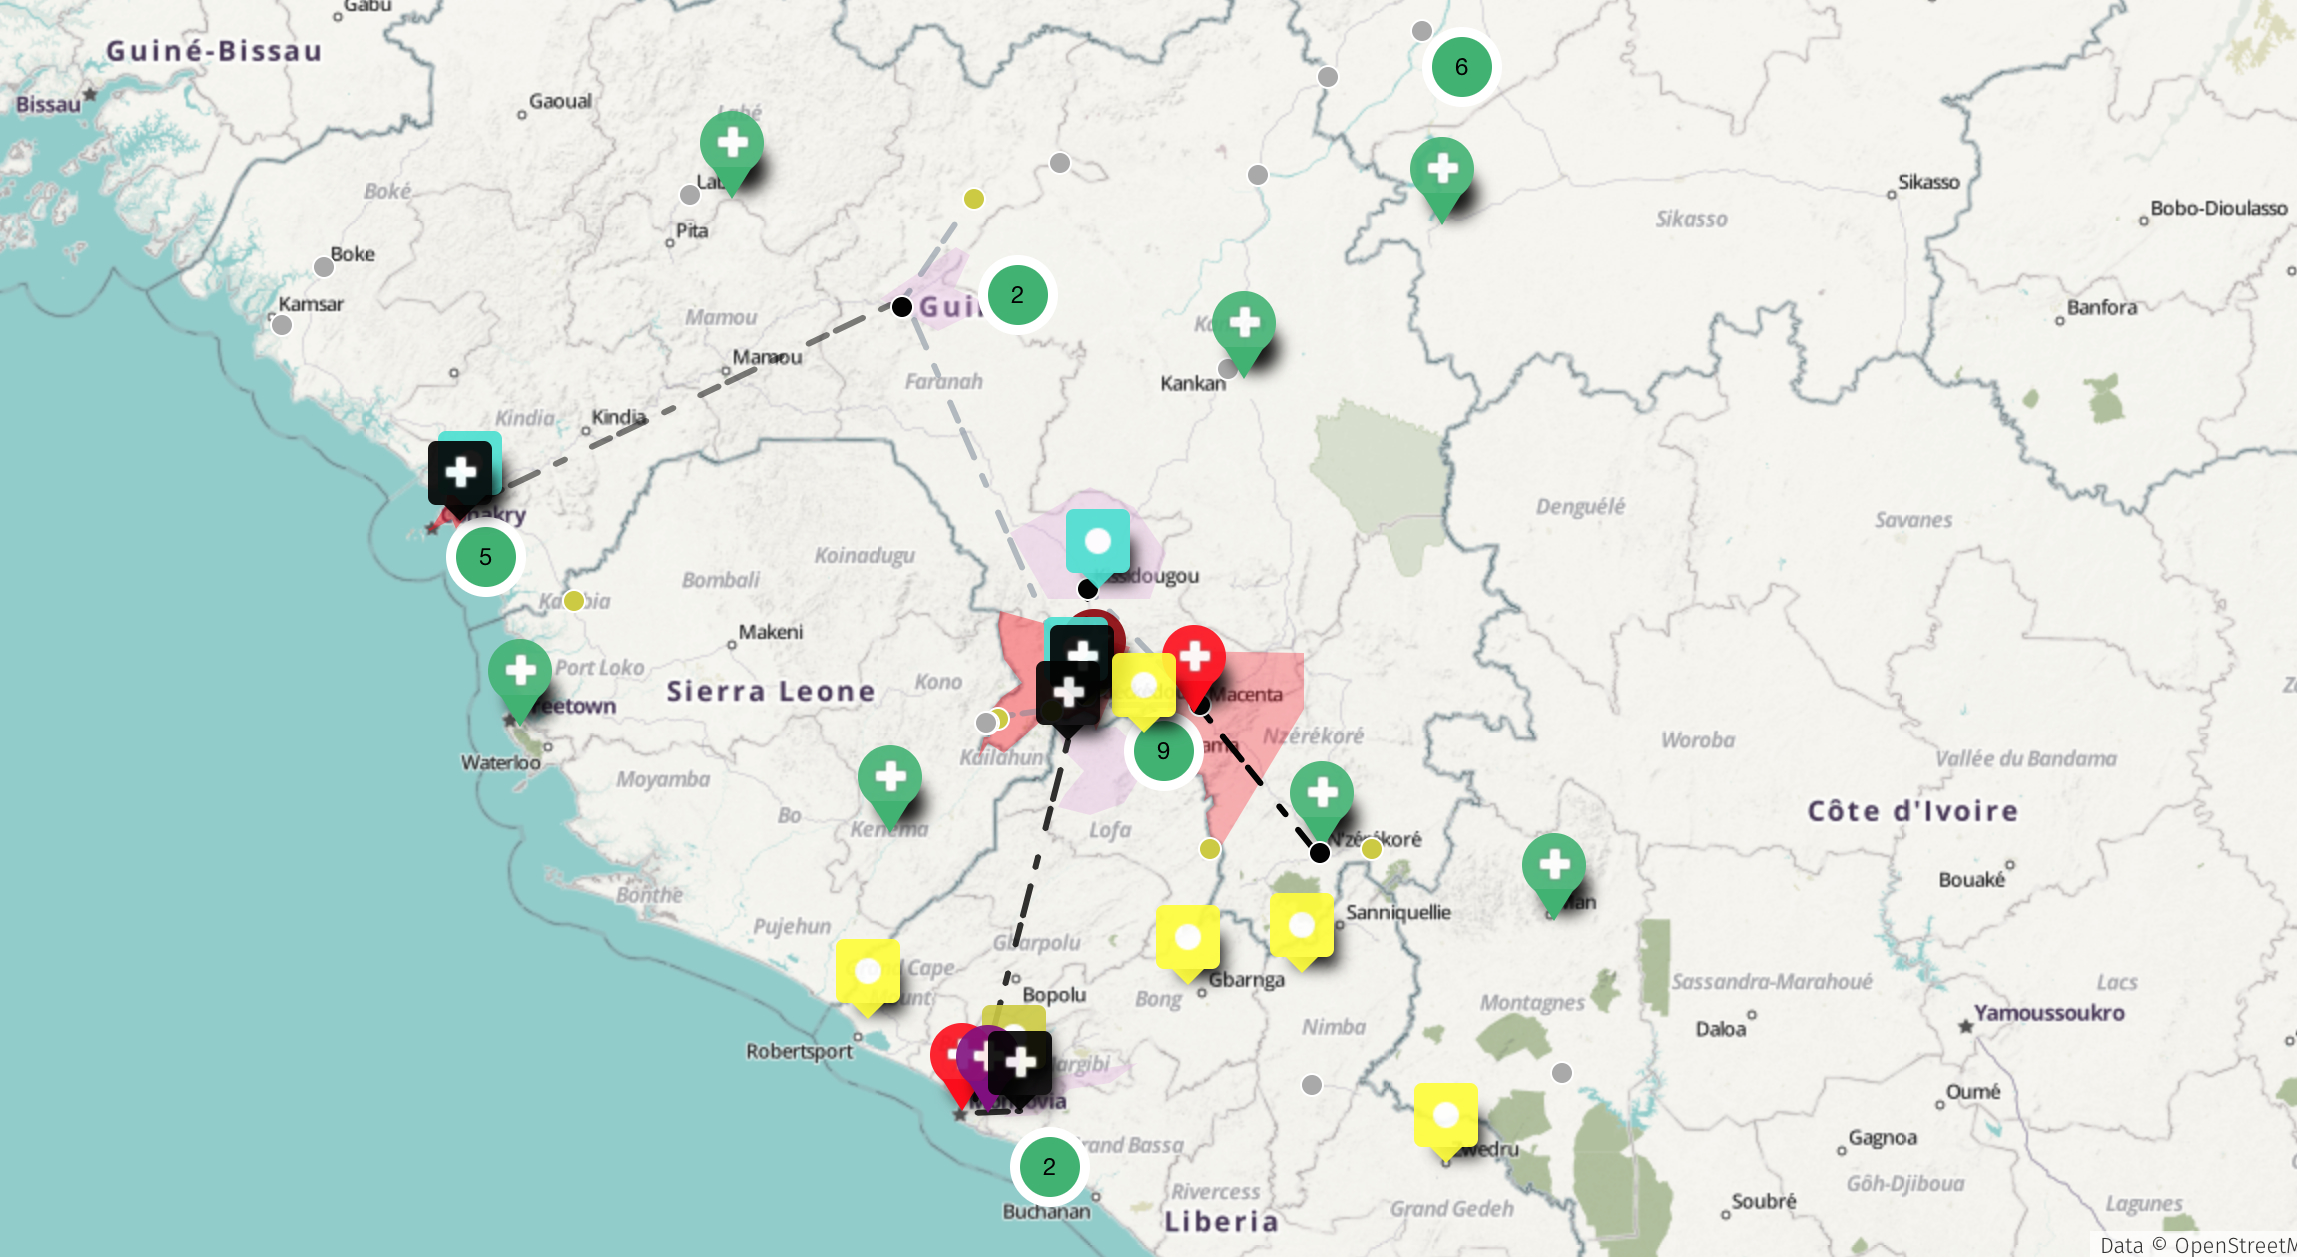
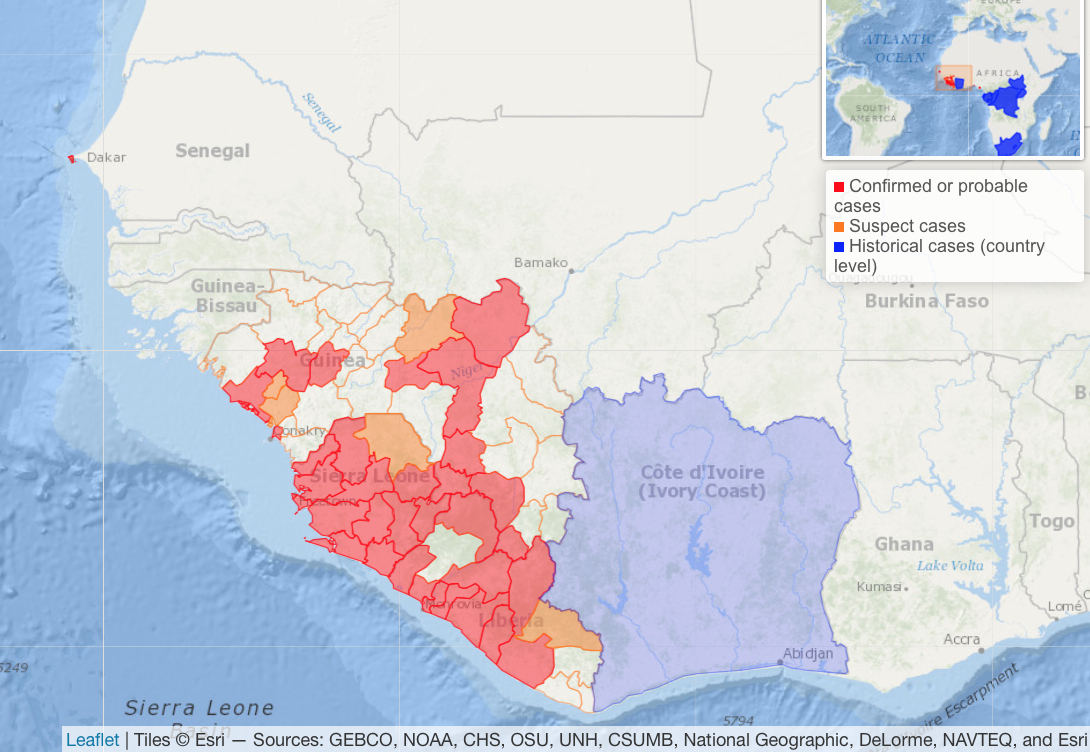
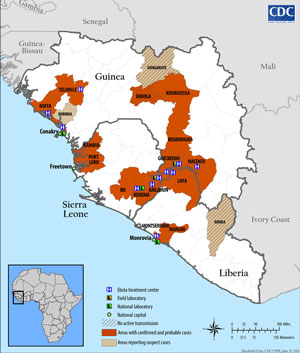
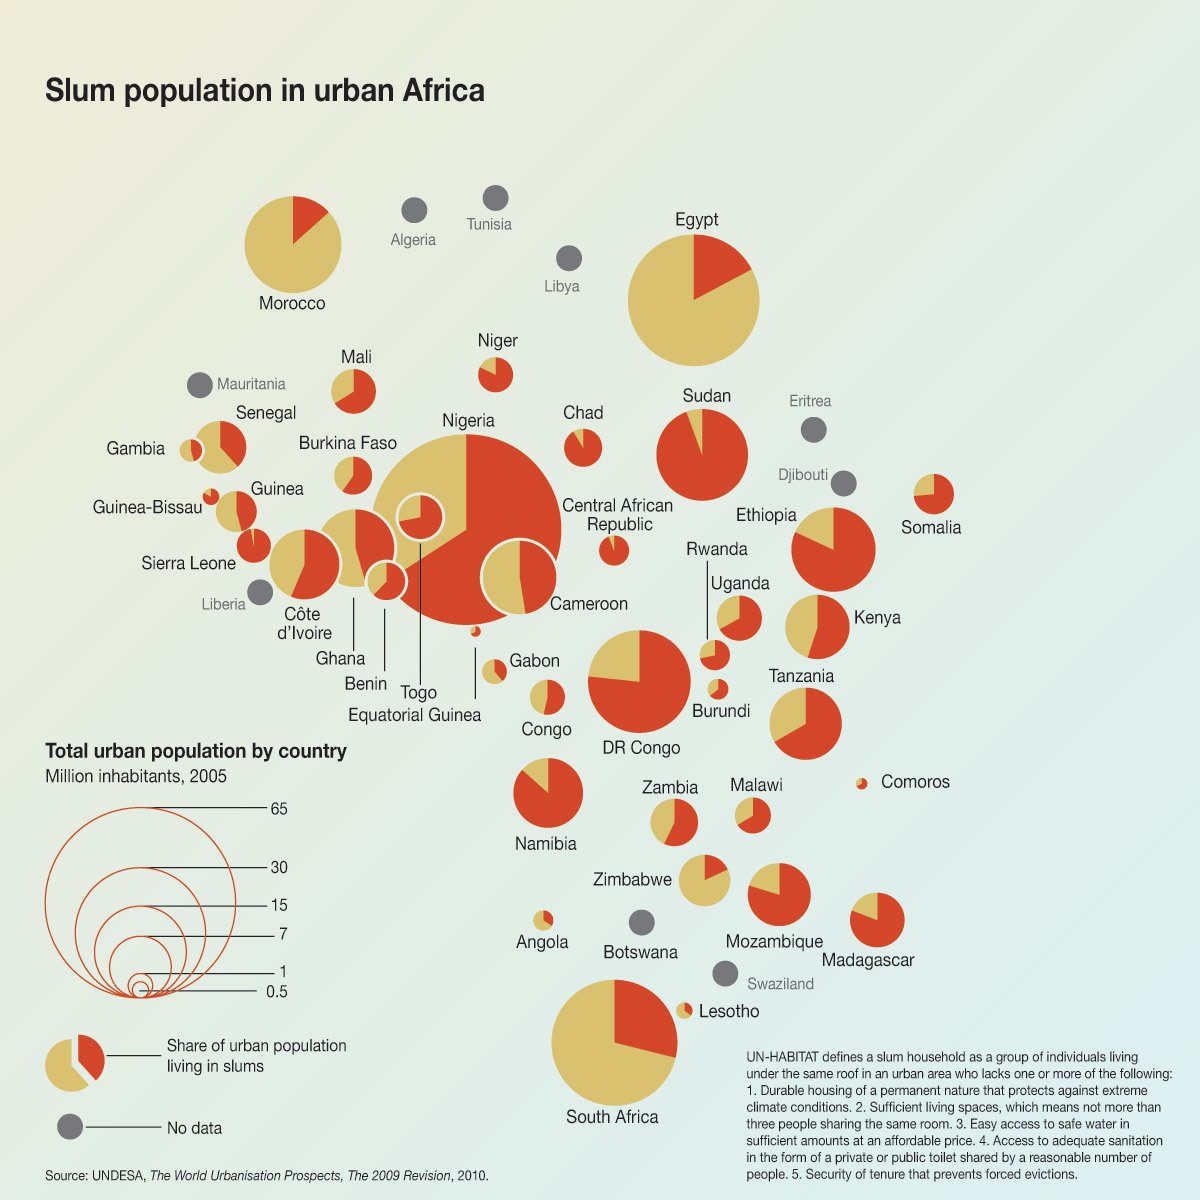
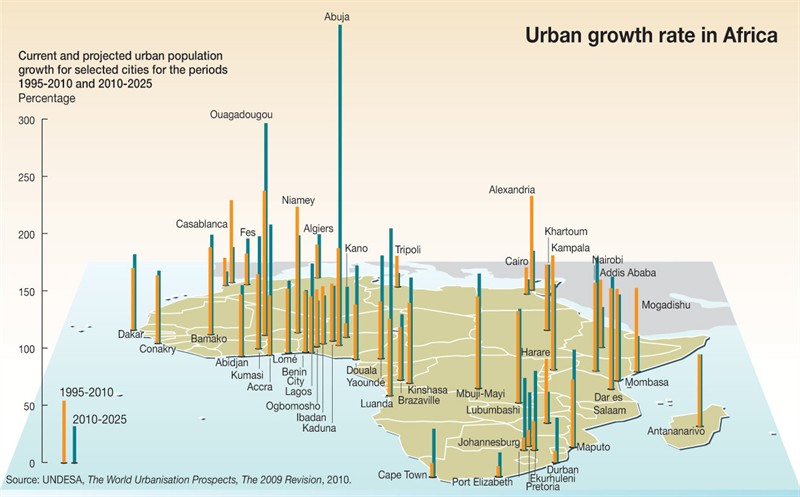
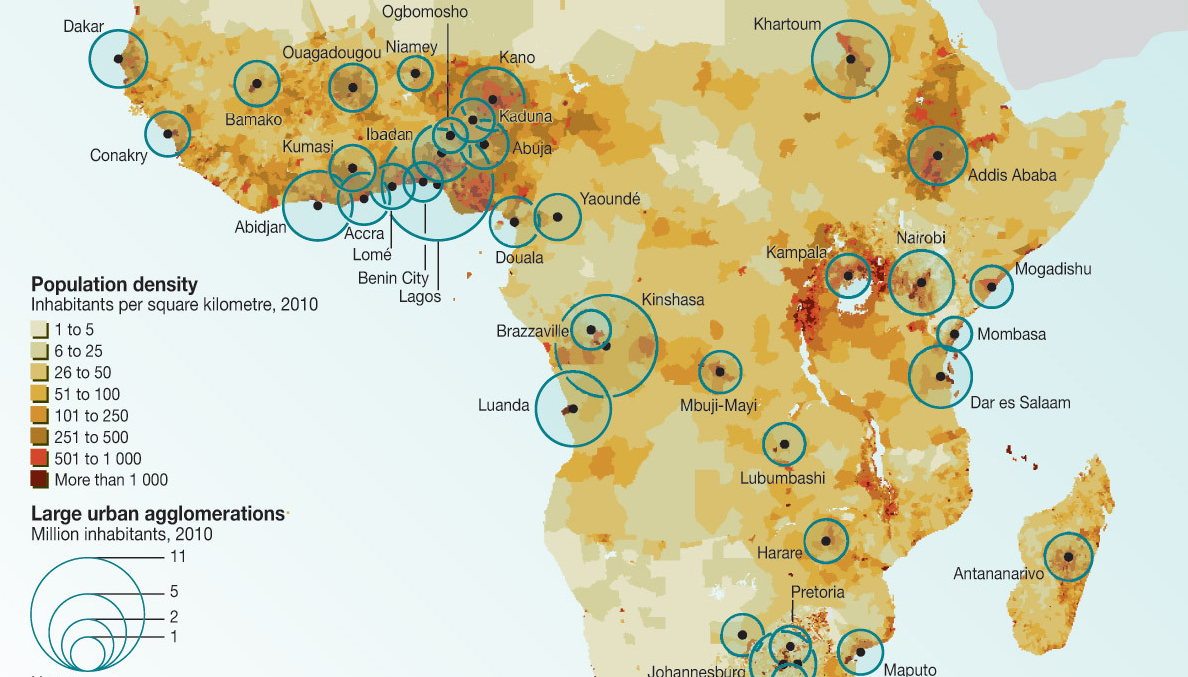
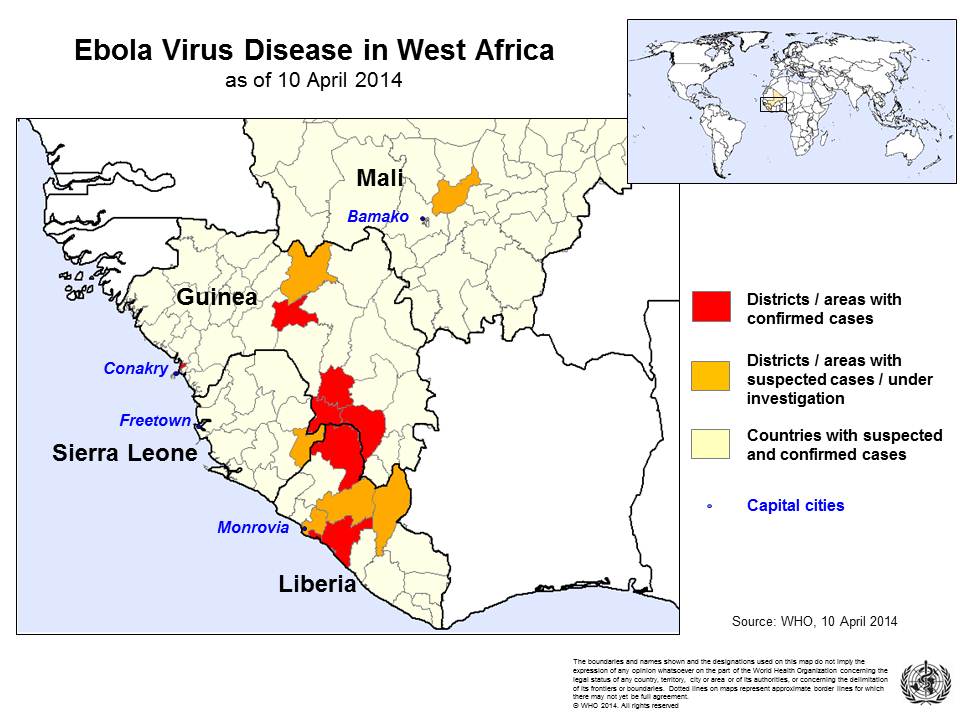
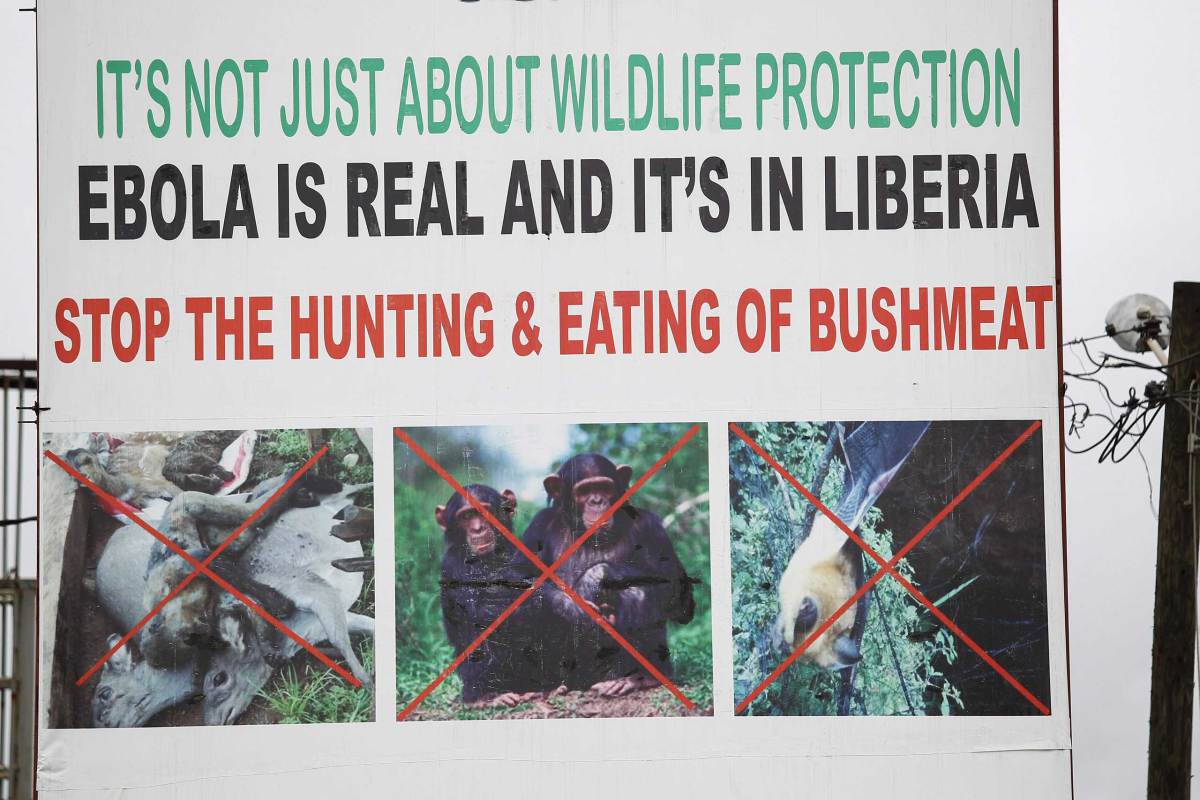
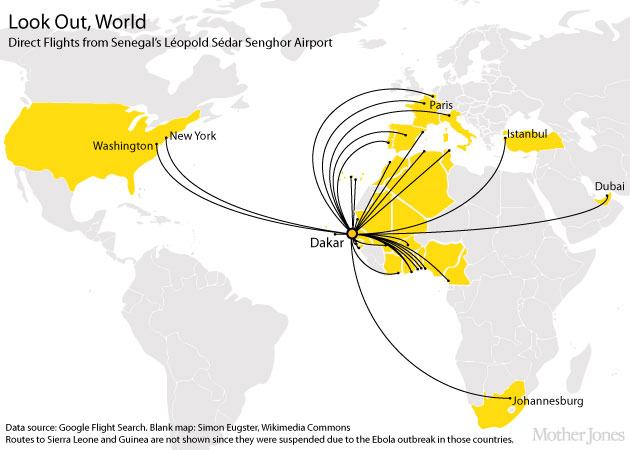
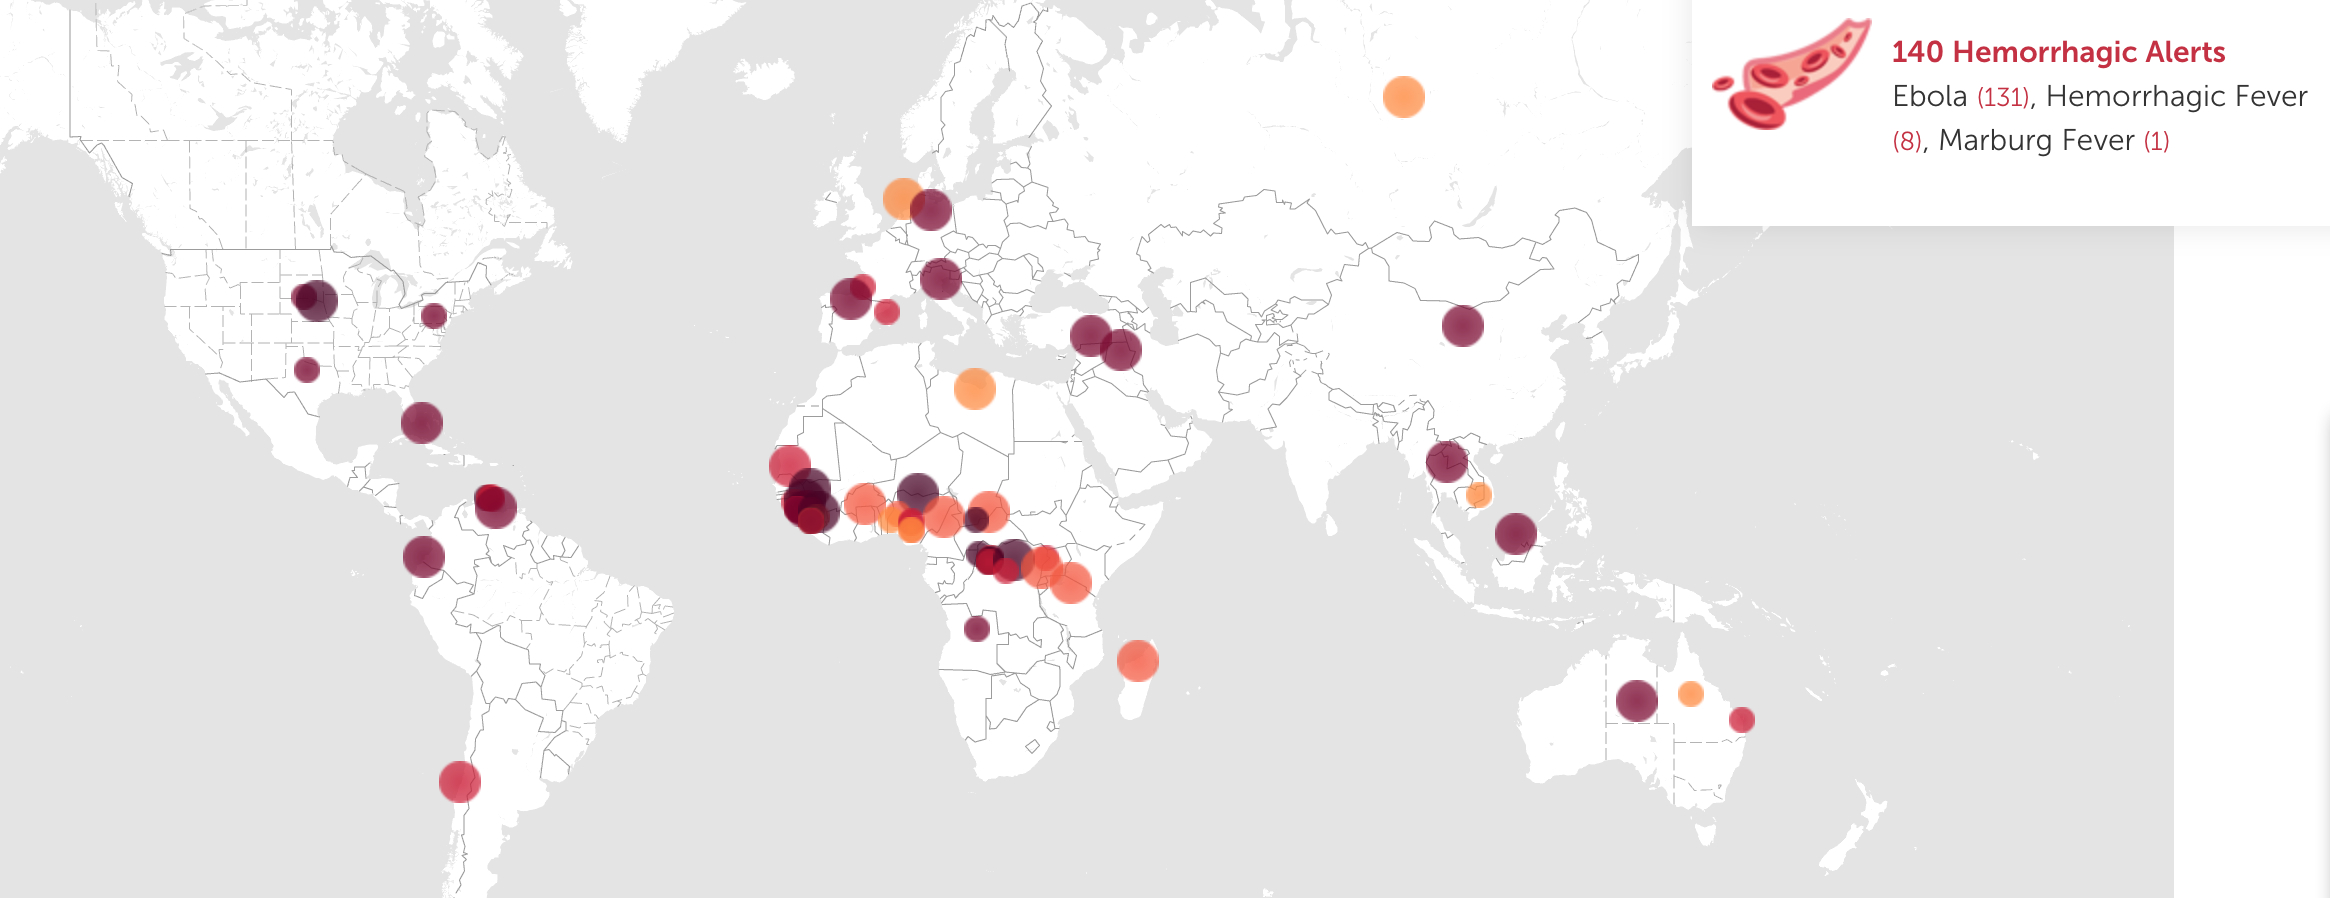
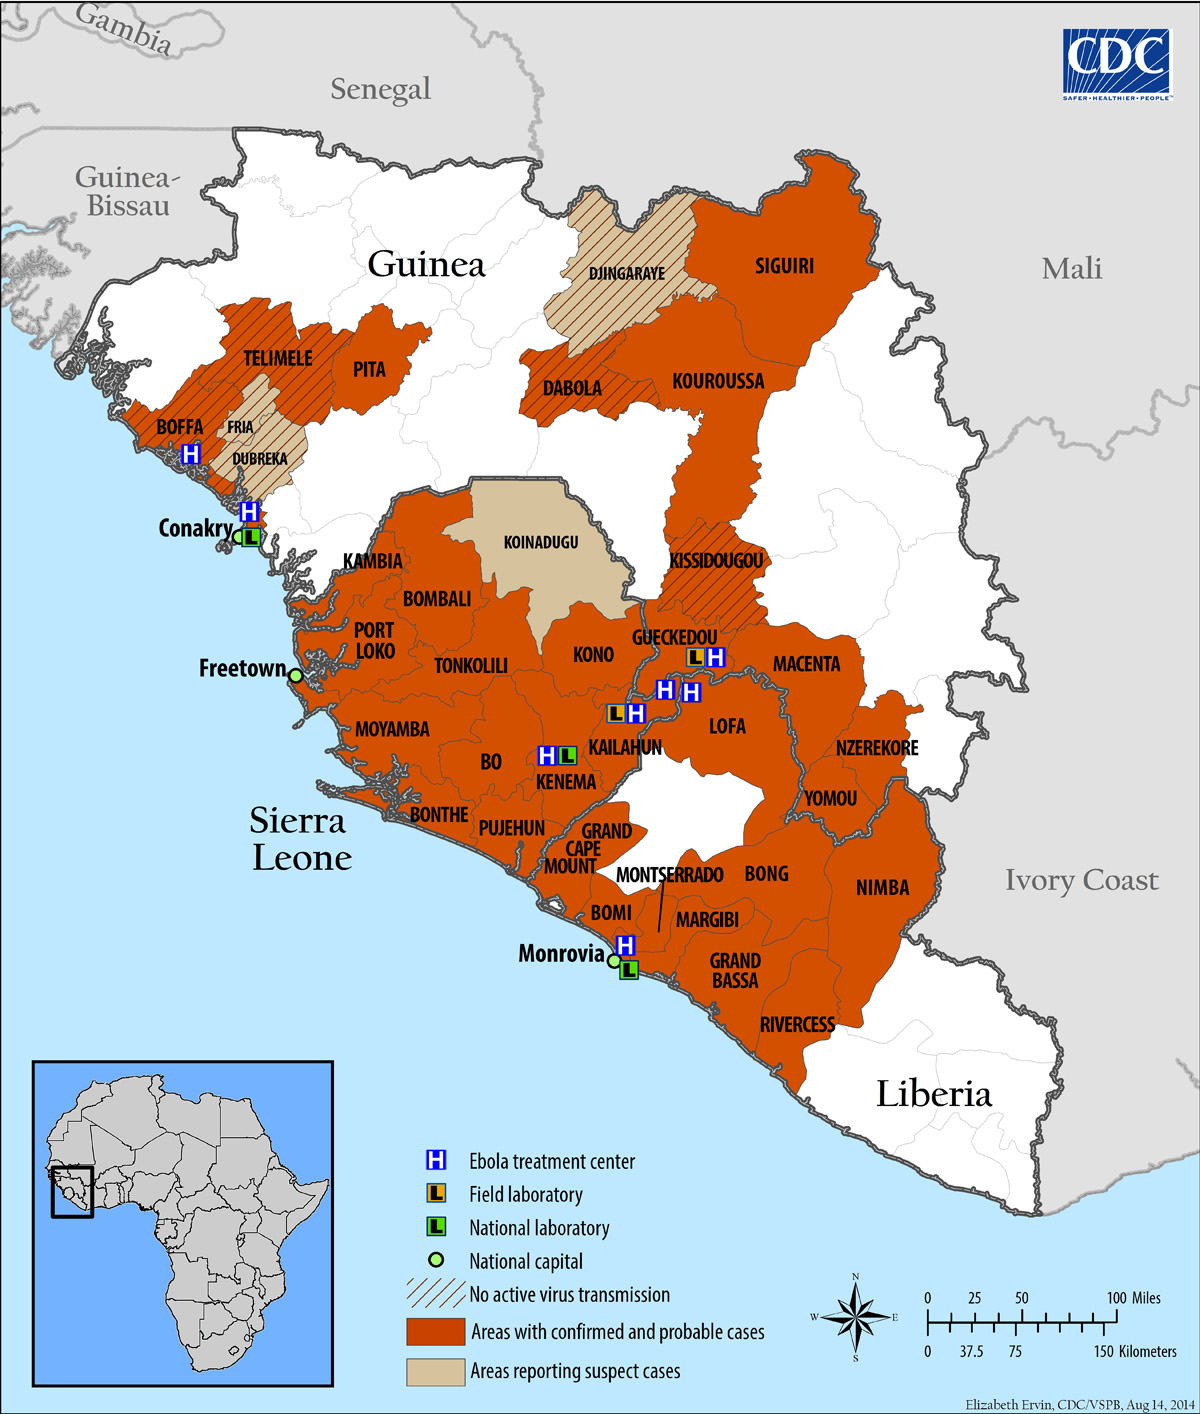
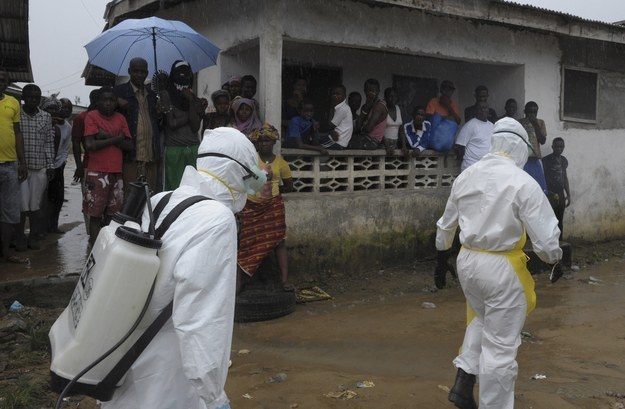
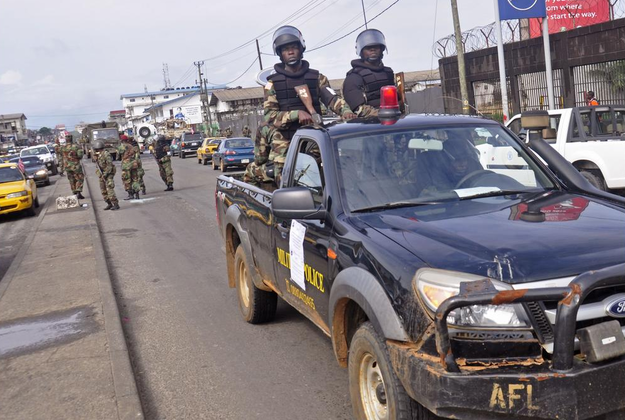

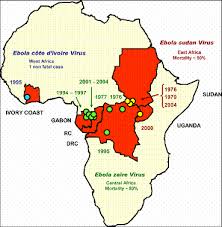
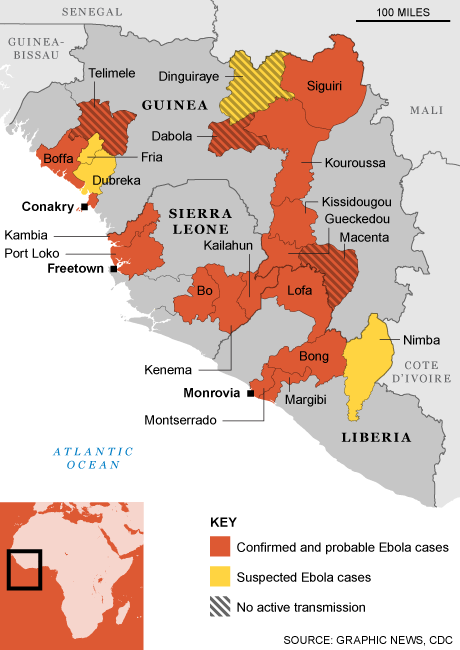
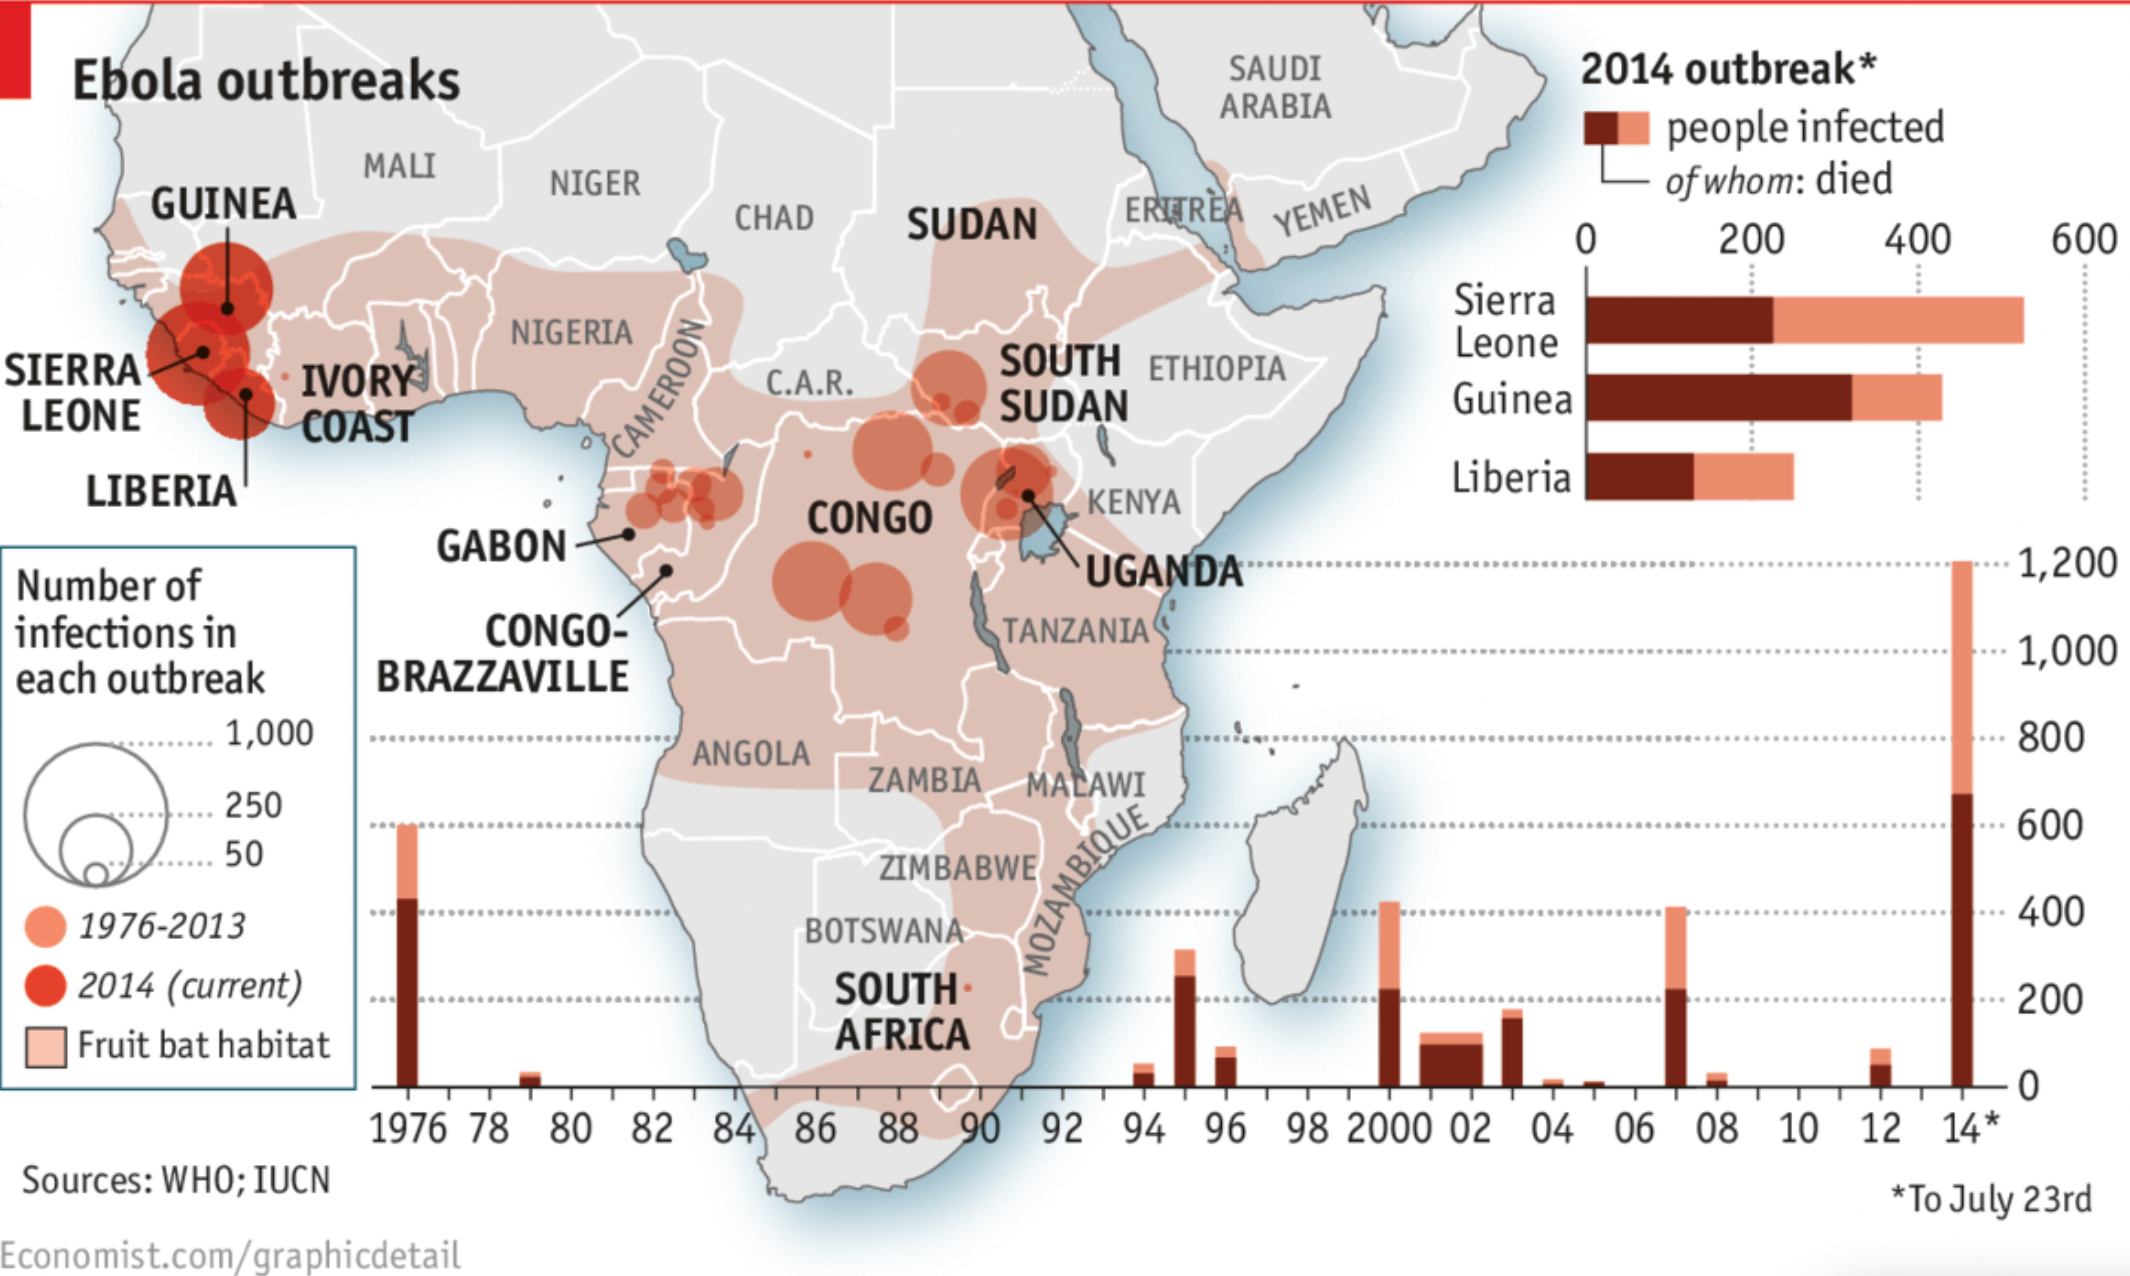
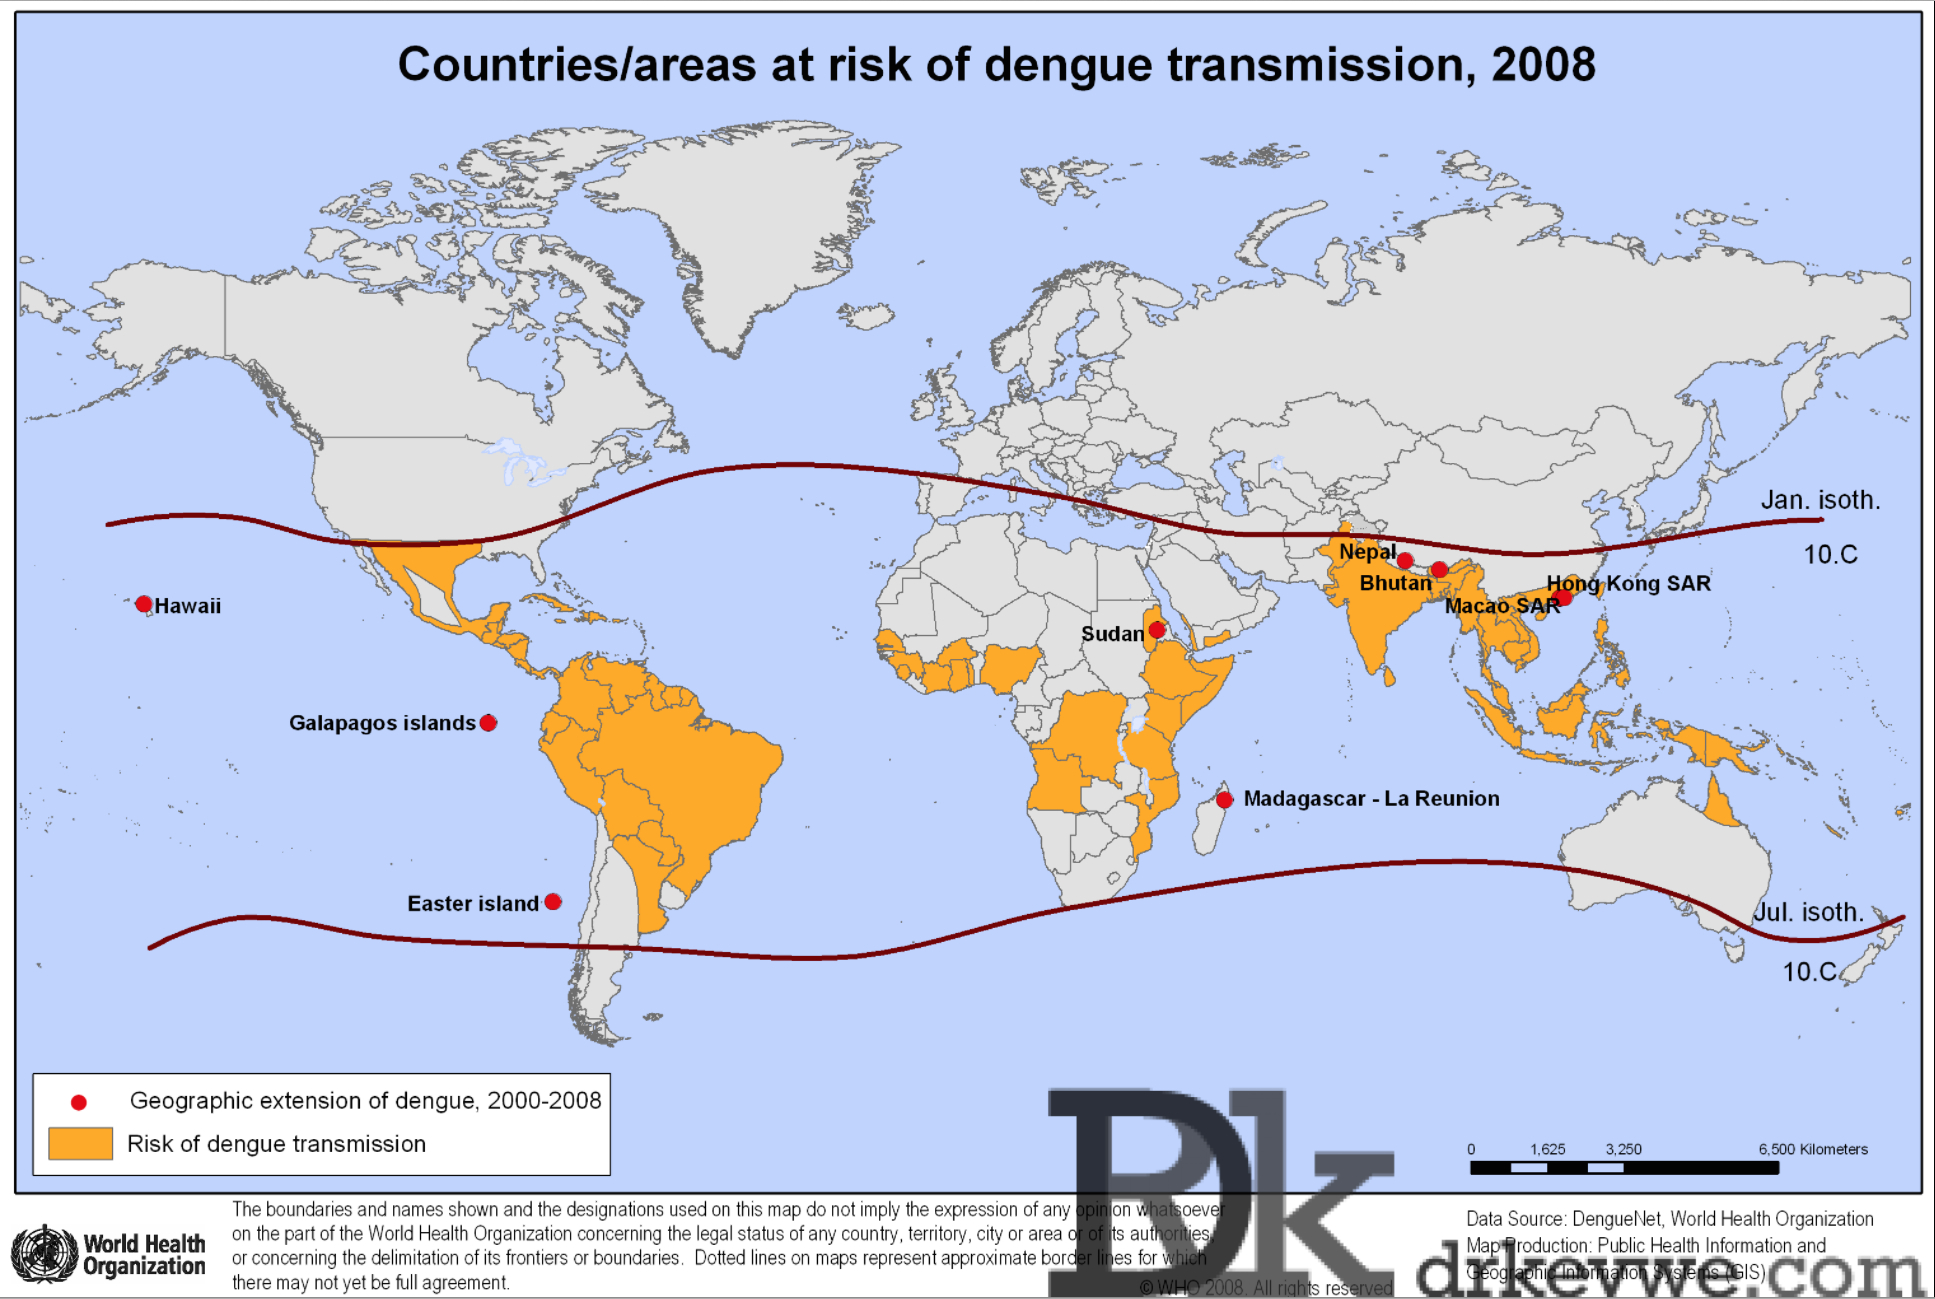

