We have long considered man’s impact on the world, but are only starting to be able to chart the vastness of the scope of anthropogenic change. And wen it comes to the contraction of shores and beaches that has been forecast in current climate scenarios, the oldest of human environments, the shoreline and coast, seems in danger of drastic reduction at a scale we have rarely considered. The shifting littoral landscapse of the world have ben long neglected, if they are turned to each Earth Day for coastal cleanups and have been the site of intense preoccupations as a result of sea-level rise, as we have protected much of our national seashore.
But the prospect of an accelerated global erosion of coastal landscapes, and the loss of beaches, have only begun to be processed as triggering cascading consequences from disturbing ecological niches and coastal economies to the human relation to the natural world–a new relation to global ecology that we may well lack the vocabulary and structures to map on adequate scale to process, let alone discuss.
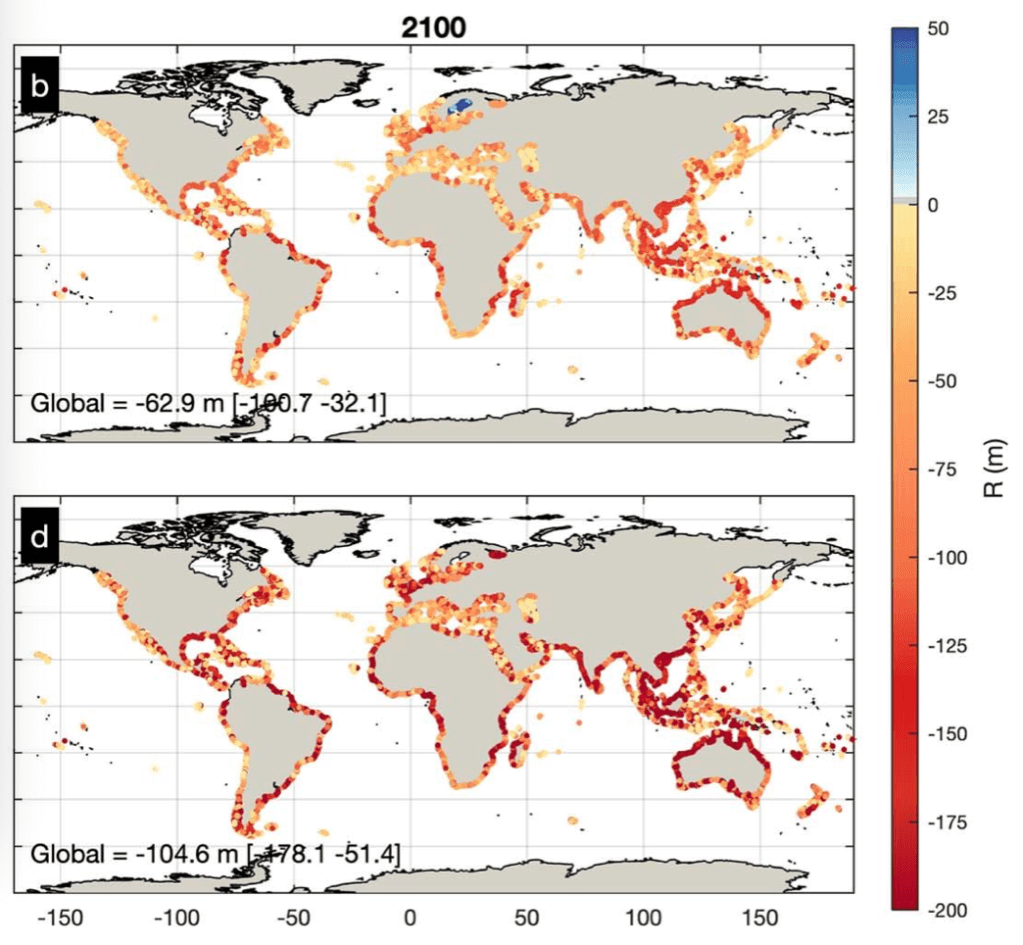
But the mapping of coastal retreat that is projected for the coming century charts the magnitude of the scale of impact of human-created modification of a global environment in NOAA’s Fluid Dynamics Project calls for a broader reckoning of the impact on the global environment that stands to be created by coastal retreat akin to a global pandemic like SARS-CoV-2, and a remapping of the global shorelines that we have a very limited chance to come to terms with in any active context; terms like East and West don’t work in a climate catastrophe that does not differentiate not only nation states but that we lack the narrative categories to come to terms with in terms of economic inequalities, but suggest a crisis of global proportions that contrast with the delicate organization of space on shorelines near our home in their brute redrawing of the increasingly impermanent sandy shore projected for 2100, according to a rather modest climate change scenario.
The discovery of margin of the shoreline in the middle of the twentieth century as a privileged site of intense biodiversity risks obliteration as a particularly fragile ecosystem. Yet the shoreline habitat is now a site of unprecedented vulnerability. (The same stretch of sensitive shoreline habitat was quickly closed to comply with shelter-at-place directive, given the range of urban residents who drove to flood its trails, beaches, and shoreline as a way to find balance, many standing transfixed before the waves in a particularly stressful time, seeking purchase on a moment few could really grasp.)
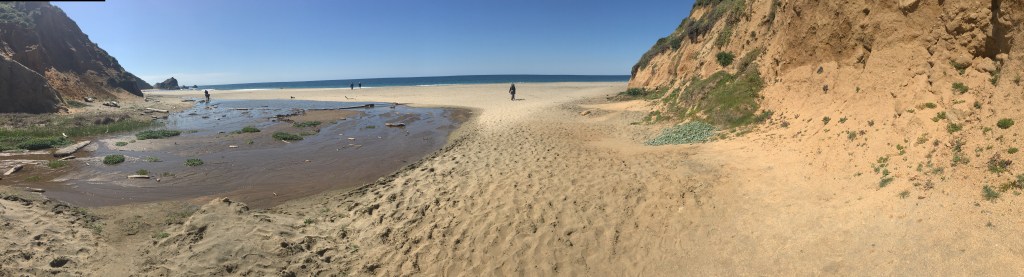
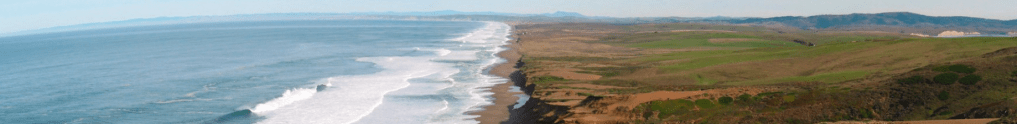
The seashore seemed a natural place of reflection. But it was hard to imagine the sensitivity of these littoral lands. While the national seashore at Point Reyes is a unique preserved coastal environment, where eroding cliffs meet sands along broad strips of beach whose low grade offers habitat to coastal birds, grasses, and shellfish, in a meeting point of fresh and salt water, the beauty of the coast seemed a perfect refuge in a time of disorientation.
This blog has long discussed the specter of anthropogenic change, but in the panic of COVID-19, it seemed clear that we lack the mode to talk about the scale, continuities, and complexity at which such world-changing processes will occur. The future loss of shores would be quite difficult to imagine, even if one stares at the remote sensing maps that predict the effects of sea-level rise.. So many had voyaged to the shores as if by instinct during the COVID-19 coronavirus outbreak in 2020, from Long Island to Marin, to the extent of disturbing many coastal residents, who read searching for break from anxiety by acts of coastal distancing as an unwelcome promotion of the danger of importing viral spread.
In England and elsewhere, many departed from the city, in search of a new environment, by traveling to the coasts–where they were greeted, similarly, by protests by those who saw their arrival as a harbinger of infection. Many public beaches, concerned about close contact, have outright closed, as coastal communities do their best to dissuade visitors seeking to escape infection in Hawaii, Moab, Alabama, North Carolina or the Gulf Coast–in ways that cut us off from the shore as a place of reflection and rumination.
If undue media attention may be directed to bemoaning college students on Florida Spring Break, we must remember that Florida’s Governor, Ron DeSantis, ostensibly encharged with securing the state’s well-being and public welfare, stubbornly insisted on keeping beaches open in the state the shore until Easter, to allow “students to party” on Miami Beach, Fort Lauderdale, Clearwater Beach, and other “hotspots” of pleasure into hot spots of viral infection: DeSantis, never one to stop claiming higher ground, hypocritically or not, only turned his wrath on the partiers after facing a lawsuit from the state Attorney General, and even as communities closed beaches, refused to shutter state beaches to limit the spread of the Coronavirus that were a vital parts of the state’s economy–reluctant to close them until local municipalities intervened.

Shifting the blame to foreign travelers–and insisting on self-quarantining visitors from New York state or New Jersey–he sought to keep them open for business, by casting them as more vital than viral. DeSantis refused to accept the national scope of the problem, defending an economy that depended on tourism, elevating the economy over national health–and keeping them open a week after the closure of Disney World, after trying to keep a “six feet distance rule” to “stop large crowds from congregating,” as if the crowding was an issue, more than human proximity and contact–and refusing to take leadership on the issue by “deferring” to local government and causing confusion.
As fhe Florida Governor reflected on the large number of elders in the state population, and their potential hindering of his own chances for re-election, it seems, did he alter his stance entirely, and beg the President to declare a national emergency, as the spread of the virus led to thousands of layoffs, with all non-essential businesses closed in coastal communities, as De Santis issued a state of emergency March 9, 2020.
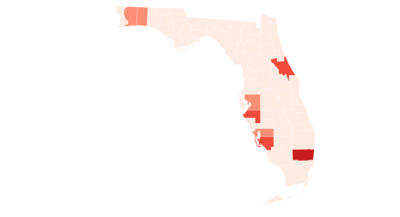
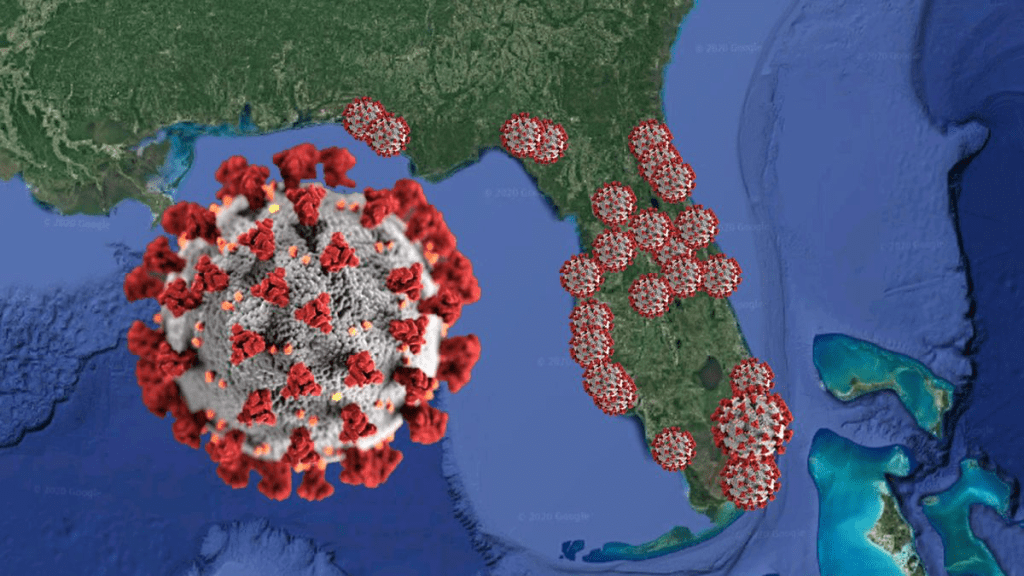
Meanwhile the COVID-19 data timeline by mid-March had spread across Central Florida, with cases of infection clustering on the shores. While the map that sizes the isolated pathogen as its symbol of COVID spread seems freakish, the telling newspaper graphic captures well the problem of coming to terms with the transmission of infections along the beach–superimposing the specter of an overlay of the COVID-19 pathogen as if colonizing or as blossoming along Floridian shores.
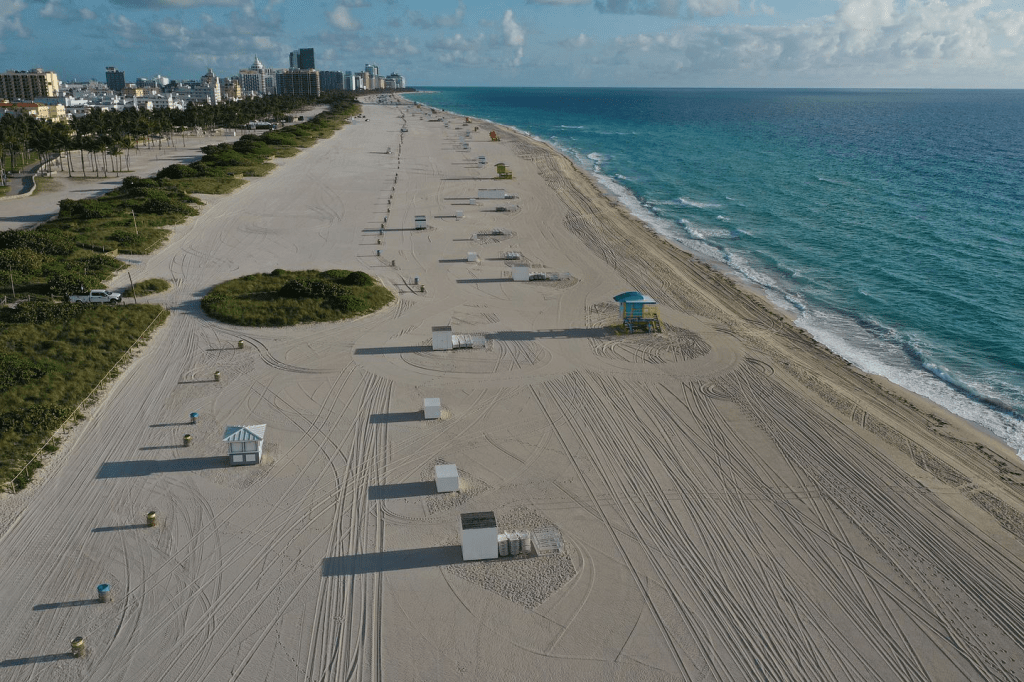
The abandonment of the closed Miami Beach–one of several citie that refused to keep its beaches open, as infection spread, as they knew what was really best for them–seemed to confirm the shore’s status as a natural site of reflection. The scope of projected reconfiguration of future shorelines would effect a deep change in the human relation to the shoreline, as much as the shoreline as a site of shelter and habitat.
For environmental geographer Clarence Glacken, the “traces on the Rhodian shore” were signs of civilization and the human modification of the environment that were fundamental to historical processes of change. The reference of the title of his survey of the modification of land through the industrial revolution took its reference point as antiquity–the image of the philosopher taking geometric figures drawn on the shores of Rhodes where he was shipwrecked as evidence of human habitation. The anecdote was prized by Vitruvius as evidence of the ability of geometry to frame the environment, and respond to it; Glacken took the image of the shores as a leitmotif for a magisterial survey of relations to the natural world that we now observe expanded and refracted in the remote sensing that tracks the broad impact of how industrialization has inscribed human relations to the environment far beyond Glacken’s four on the environmental influences on human history and man’s remaking of the environment. And the problem of the continued access to shores, and future of the shores, makes us go back to some of the early work of Glacken to recover its new relevance, if only because of our failure of models to come to terms with such massive anthropogenic change.
Continue reading