Category Archives: data visualizations

On the Proposed Balkanization of California

Timothy C. Draper fondly reminisced that “I grew up in the state that was number one in education, the number one place to do business and the best place to live.”  The venture capitalist who brought the nation hotmail, Skype, and Tesla was savoring the new mental landscape that he argues would be recaptured by remapping California as six separate states. That simple cartographic intervention, and the “autonomy” it would serve to return each region–or all of its six new states to be carved from it–would fulfill the ideals of a rapidly receding past, and allow each to independnetly confront the problems of a crumbling infrastructure, poorly performing public schools, and pension obligations for state workers, and taxation practices that he judges unfriendly to business.  The “start-up guy” sought to restart the project of California in 2014, spending $5.2 million to liberate each of the state’s six parts, which failed to make the ballot, if it gained the national spotlight thanks to Stephen Colbert. The self-defined “start-up guy” returned to the table to reparse the largest state in the union in 2018, when the notion of national division gained traction in the national news, with hopes to give a greater tax franchise to at least two of the regions–the rump “California” around Los Angeles and Orange County; “North California;” and “South California”–as if to allow citizens to self-sort themselves into their own “like-minded” communities and unique styles of governing, to reboot the largest state that had just become too populous into three.

The insistence of these aspirations to cartographic self-definition suggests, in other words, the fiction of independence that Silicon Valley has been selling the nation for some time. As Draper has argued American would be best by adopting Bitcoin as its national currency, cutting out the Federal Reserve as so much excess baggage, the big stakes questions as land maintenance, coastal commissions, and Fish & Wildlife would be deferred, as would many questions of ecological conservation and fire management that are currently on the front burners of most Californians. By persuading us to see the state as a set of discrete regions, however, bushy-eyebrowed Draper hopes to urge voters to realize his political strategy to divide California into six cantons of different hues.  And when he rolled out the project for dividing the state–and its resources and economy–once again into three states,  one named simply “California” on the coast below San Jose to Los Angeles, bounded by the “Northern” and “Southern” California, as if in an attempt to make the map look clearer, Draper seeks to persuade voters to overlook the complex web of natural resources (like water), but huge discrepancies in public education, pension plans, transportation needs, and water management that demand resolution in coming decades–and in effect heighten the levels of inequality already permeating the state, as well as diluting its political voice.

A six-color map of the state offered the rallying call to generate support for his map to renewed economic prosperity–a spectrum intent to underscore inherent differences between each region.  The cartographic division of the state became a logo for a movement, found a nice logo in six colors, designed to strike a key in reflect the parched nature of the more arid (purple; red; orange) and waterless or irrigated areas of the state, and to suggest they were best left to fend for themselves, especially, perhaps, the orange Southern California and the Imperial Valley and bright red Central California’s desert. The coastal communities would have their liberties, and the tax franchises that went with them.

New Map of California

Draper’s initiative to “divide” California into six California’s–six separate states–picks up the inventive cartographies of division that partition the United States into more “rational” or “reasonable” mega-regions, macro-states, or mini-countries, and betrays what little sense he has of the environmental or ecological status of the state.  His proposal stands at odds to how, back in 1837, the German-American jurist Franz Lieber famously doubted that merely altering hues of any map could affect its political economy. He doubted that “the face of our country would change” as a result, and saw little impact for changing a map’s color-scheme, and hoped that “if the engravers were able to sell their maps less boisterously painted and not as they are now, each county of each state in flaming red, bright yellow, or a flagrant orange dye arrayed, like the cover produced by the united efforts of a quilting match.”  Lieber had studied topographic mapping in Dresden before coming to America, and meant to contrast realities of political economy with the coloration of maps–probably contrasting the four-color maps of the United States to those of Prussia with his Berlin-trained mind’s eye; the flagrant color-scheme of a map, however, becomes a device for Draper to urge that we remake California into six “political entities” that most of those living in them wouldn’t actually recognize.

In treating California as a landmass whose extent is able to be parceled into six–or three–blocks, the iconic visualization presumes “California” is not a landscape bound by coastal rivers, streams, glacial ice-pack, or viaducts, but might be parsed as the graphic designer wishes, in what seems the utter alienation of map from place.  By converting California to six cantons, the hope is to remake the state as six more manageable mega-regions to bridge perceived distances between government and Californians.  Draper represents the remapping of the state as a means to reconnect its residents to a model of good government in something of an extension of the argument of states’ rights.  The graphical division of the Golden State into six entities, maxi-regions or mini-states, each emptied of local meaning and purged of cities, provides the rallying cry of the venture capitalist’s movement for the May 2016 ballot, having gained over 1.3 million signatories of in-state residents–at the time of its submission in mid-July–and of a charge that Draper hopes would open up the possibility that other states follow the lead of his movement to break into separate states as well.

The return to the map as an iconic form of taking self-consciousness as Draper urges is a bit odd, to be sure, for a libertarian. For the image of the map as an icon of national destiny–the pentagon of France; the “lebensraum” of Germany; the unity of China–has a distinctly nationalist heritage, as does the call for a Red-State America with disturbing similarities in its contours to the Confederate States of America. The map indeed conceals, by a nice slight of hand, how much of California is “open space” managed by the U.S. Forest Service, Department of Defense, or Bureau of Land Management, in its attempt to carve up neat bundles of California in the hopes that these would align–or soon come to align–with independent interests. Fearing the administration of wilderness areas of the National Park Service or Forest Service during the Trump regime, Governor Jerry Brown had indeed not only filed a spate of twenty-four law suits against the Trump administration in 2017, the first year of the Trump Presidency, but questioned the validity of any attempt by the chief executive to sell or exchange land rights in the state, by pronouncing them void ab initio, without review by the State Land Commission, fearing the dismantling of hard-won environmental protections across the state.

The defense of undeveloped land that Brown holds dear and near was a pre-emptive strike that provoked a quick legal response from Jeff Sessions’ DOJ: “California was admitted to the Union upon the express condition that it would never interfere with the disposal of federal land,” he cautioned, defending the “rightful prerogatives” of the Interior Department, U.S. Military, and Bureau of Land Management “to buy, sell, exchange or donate federal properties in a lawful manner in the national interest” that should rightly make Californians fear the actual intent of the U.S. Government. While the admission of California to the United States in 1850 indeed stipulated that “the people of the said State, through their legislature or otherwise, shall never interfere with the primary disposal of the public lands within its limits,” the mandate for the state’s defense over those public lands may well be, in an era of accentuated climate change and fire danger, the rationale for rationale for administering public lands had so dramatically changed since the expropriation of public lands from indigenous tribes and mandates of public land management that the threat of their misadministration or maladministration by the rapacious Interior Dept. of the Trump era had grown pronounced–and fears of the placement of lands of the Bureau of Land Management and National Parks had been warranted, given the stunning removal of public lands protections in the first year of Trump’s administration, mostly directed to review the protections of federally owned lands from oil and gas drilling, groundwater mining, logging, and offshore drilling–all triggers for immediate protection–as well as removing responses to climate change from the administration of Park Service lands. The real fears of leasing lands for oil and gas extraction had led to the leasing of 223,200 acres of public lands to private individuals in FY 2014 alone, and the expansion of such leases would render the potential influx of cash as music to Draper’s libertarian ears.

While Draper’s initiative of the “Three Californias” was not openly framed by the tussle over land management over open spaces or wilderness areas, the fact of the federal management of 45% of California’s territory provoked fear of a slippage of protection of grazing rights, timber and forest management, and development of extractive industry that were cleverly concealed by the Three Californias, and which render California a fairly unique target of free market forces. The anger DOJ barely concealed in sniping at the “extreme state law attempting to frustrate federal policy” that Attorney General Sessions may have been born from venting about the state’s resistance to policies of border protection, and the incarceration of “illegal” migrants, with the pretense of drug enforcement, but created a unique opening for Draper’s initiative, an economic bottom-line of as limited ethical scope and compass one might associate with Don Draper, the fictional composite protagonist of “Mad Men,” but aligns closely with the brutal calculus of Tim Draper’s broad-strokes vision of governmental reform. Perhaps the true base-map, if often hidden, that lies beneath the busting up of California as a state are the network of environmental protections and protection of public lands and coasts, enforced by state regulations and commissions, that would be removed by the division of the state into cantons that would be open to the free market, pried from a vision of environmental stewardship.

Continue reading

1 Comment

Filed under California, data visualizations, environmental stewardship, Six Californias, Timothy Draper

Cabstopping: Data Visualization and the Re-Mapping of Urban Space

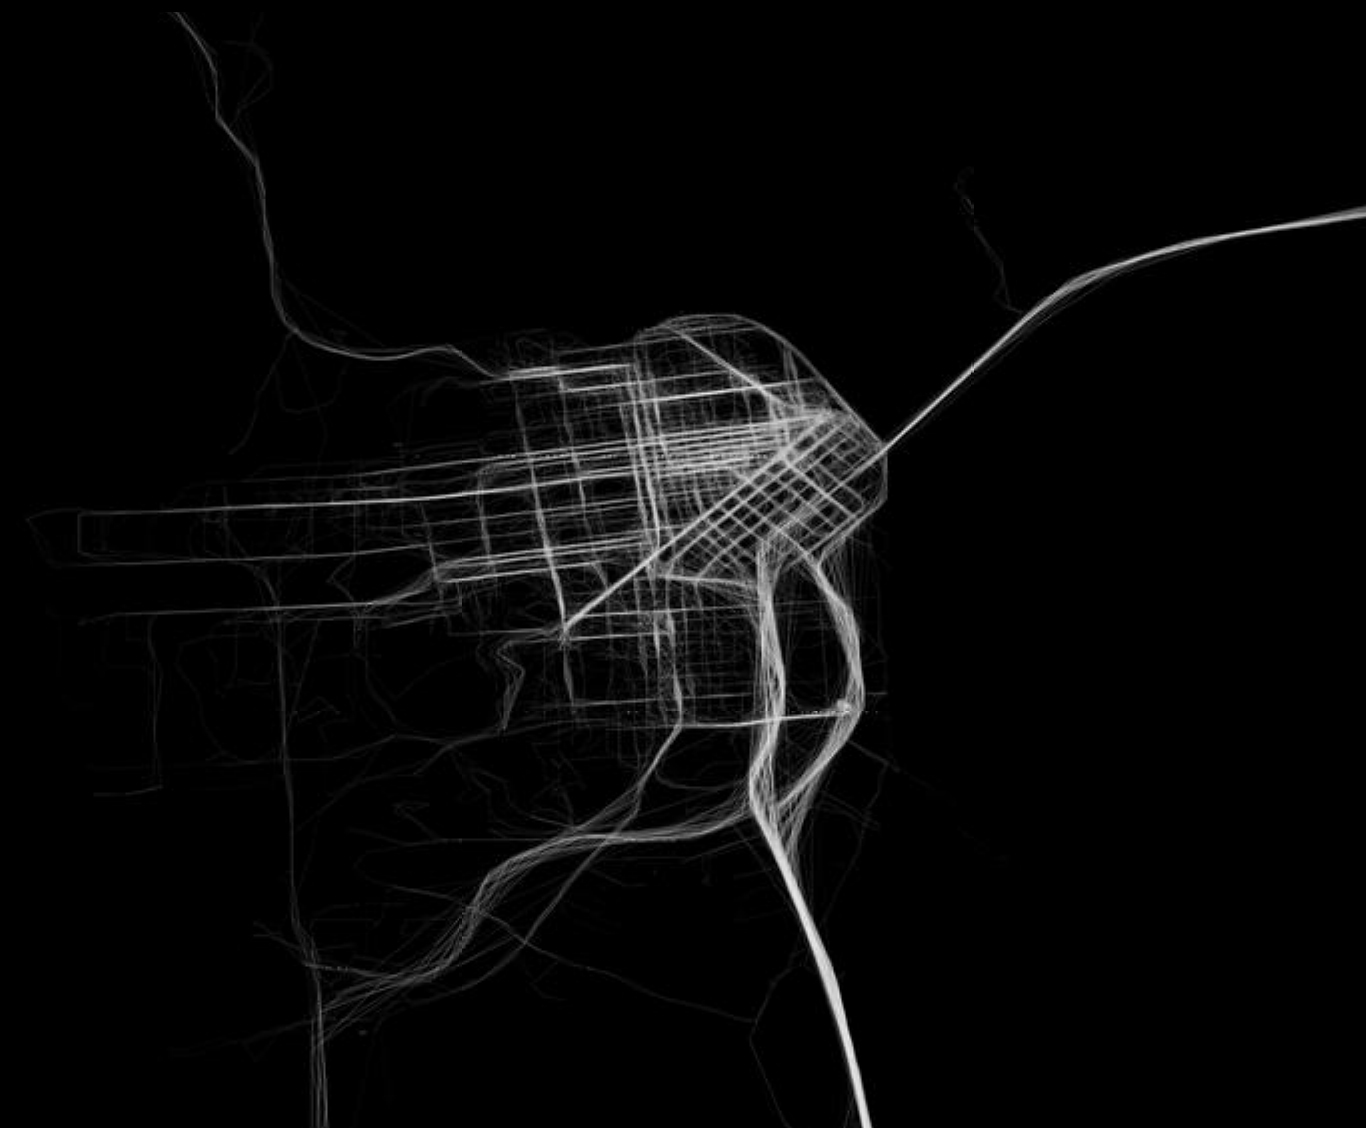
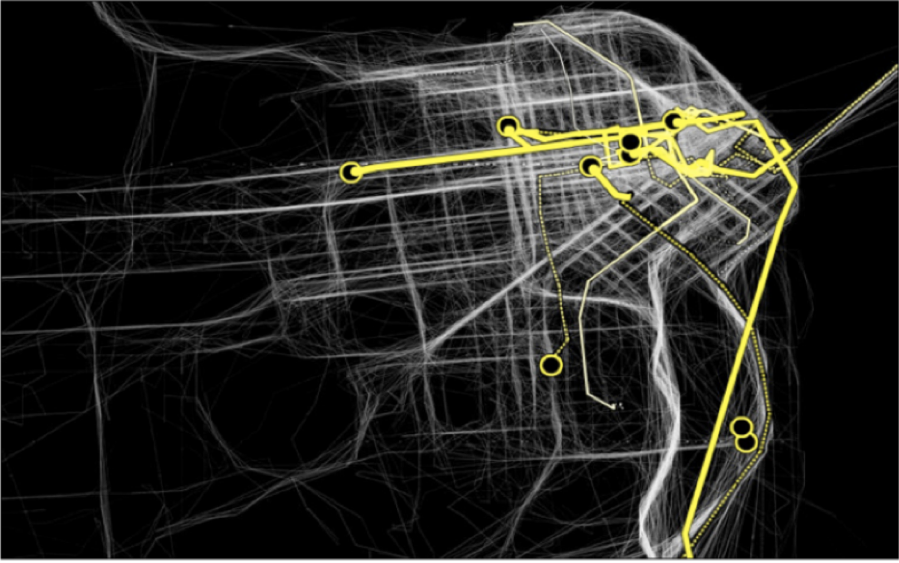
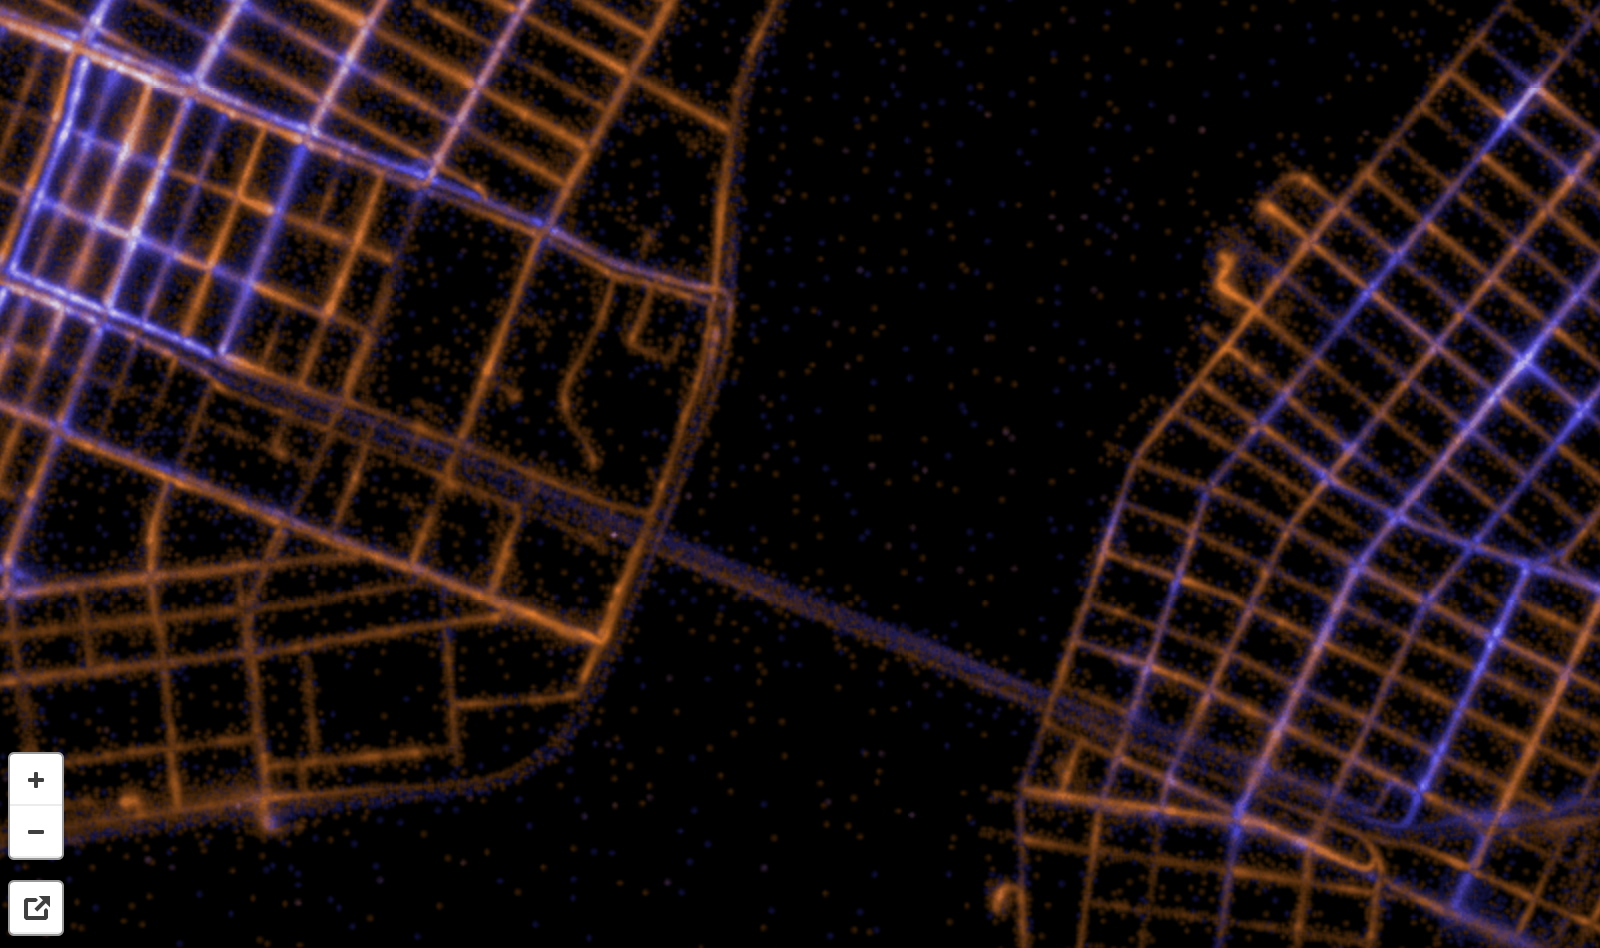
Data visualizations often employ maps to make their point, and organize an effective argument that will engage their audience:  when we see data embodied in a map, and are best engaged in its interpretation.  The alchemy of the data visualization is a magic way to throw the map’s content into multiple dimensions:  data visualizations offer plastic forms of mapping to illustrate the way we fill and occupy space, transforming the mechanics of mapping specifically intended to track the stability (and meaning) of constructions of place, and orient us to different perspectives on how we move through space.  We can better understand the ways links can be drawn about data in clear synoptic terms, and reassured by the act of discovering new patterns in a readily recognizable form.  In describing the spatial distribution of an attitude or affinity, maps are readily consumed.  But they are also cognitive tools to process shifting notions of place:  the sleek tapering negative lines in the above visualization of San Francisco’s cab traffic offers a dynamic model to examine how GPS changes relations between cities’ center and margins.

Data visualizations are not present in the recently published primer “Make Map Art” invites us to adopt traditional cartographical tools as helpful strategies to “creatively illustrate your world.”  Mapping has long been rooted in the world of graphic design.  But the siblings Sue Swindell and Nate Padavick’s Map Art invite readers to embrace the diffusion of mapping as a form of making in the service of self-expression in this lovely book–whose championing of the hand-made map seems a counter-strategy to the near-ubiquity of Google Maps on hand-held screens and maps in evites, embedded in social media, that direct us to a destination.   The toolkit offered readers of Make Map Art invites us to adopt tools and forms of maps not only as orienting tools but instruments of “creative illustration” that suggest we rehabilitate forms of mapping as our own tools.  These maps are marketed more as a hobby than a strategy of resistance:  but in their romanticized vision of the self-made map, a sort of trickle-down of the popular resurgence of hand-drawn maps, they neglect the diversity of spatial knowledges in their “creative toolkit” of easily mastered tools of design.  The handsome how-to book offers some twenty projects by which to frame  cartographical interventions in a world already abuzz with maps:  but the forms of mapping 2-D toolkit primarily marketed in stationery shops and bookstores neglect the most interesting ways cartographical design has caught up with how increasingly stark social divides have come to structure quite divergent perceptions of space.

Web-based maps are not included among the toolkit for map-your-life/make-meaning-from-maps they present, since their medium doesn’t fit the niche audience or the Luddite inflection of the book–or the sense that the map, once considered a tool of government, can be a relaxing way to order space in a world where we are all too often confronted or running to consult a handheld screen.  But this might be unfortunate.  For in a culture where we are consulting or faced by screens in  the forms of attentiveness data-driven maps create compelling models for charting our occupation of space and indeed processing our own relation to space in particularly creative ways.  If the screen often provides compelling tools to grasp our increasingly uneven occupation of space to a degree of visual attention unlike–although not foreign to–static maps.  They can show us how we fill space, and how our experience of place is redefined with a rapidity that the static design of a local or regional map has difficulty continuing to fulfill its orienting functions.  We are impoverished by circumscribing our access to a full range of mapping forms.

SF Traffic

In their engaging how-to book of personalized map design, Swindell and Padavick offer a something like a basic toolkit for those eager to respond to fears of being dominated by data.  In designing customized maps, one might resist widespread concern for being regularly mapped by unwanted forms of surveillance, and indeed dominated by the ways in which our lives are regularly mapped.  But Padavick and Swindell don’t push back that hard: they dwell in the cozily utopian idealized spaces that any map invites viewers to inhabit. It’s cool to play with our sense of space and abilities to create forms of personal orientation for ourselves or indulge in returning to cut-and-paste type of social media of material design in a DIY guide for fashioning personalized geographies ready “to be framed and displayed as artwork” to gain new decorative status as personalized cartographies.

Data visualizations, unlike static maps, define the networks of interaction in which we have increasingly become enmeshed, tracing forms of  inhabiting place that are often illuminating of the complexity of navigating place than they are comfortably reassuring.  Map-based data visualizations orient us to the shifting ways we fill space and inhabit our streets, and make interpretive demands on their viewers about how we actually have come to use our space.  For while the formats of maps offer cool tools of spatial orientation that remind us of the favorite streets we love–and how we walk across them–if the alchemy of data visualizations remake maps as especially creative tools of engaging with one’s environment, they process our own relation to a built space in dynamic ways, effectively organizing our orientation to space by revealing contours of divergent perceptions of and access to space in cities–spaces that are now no longer easily mapped by public transport maps, grids of streets, or even schools and social services.  The patterns that data aggregates are particularly valuable as a tool to unpack the changing occupation of urban spaces, from public parks to freeways to avenues, and to interrogate the practical and real boundaries of known space.  And they raise questions, perhaps known to some extent in anecdotal experience, about the increased dependence on GPS to navigate urban space in many drivers of ride-sharing services–from Uber to Lyft–perhaps in distinction from drivers’ familiarity with the automobilistic navigation of city streets.


1.  Maps that derive from big data offer particularly versatile tools, in contrast, to visualize the ways that we inhabit space and, by extension, how we travel through it and make it our own:  much as flows of information or currency or patterns of immigration, data maps show patterns of collective action that is rarely otherwise aggregated, and help us visualize how we inhabit space in dynamic ways.   They present the ability to map a network around both space and place as, indeed, constitutive of both, dispensing with and not adopting a static cartographical frame of reference to describe our relationship to space.  The alchemy of data visualizations allows us to  illustrate shifting relations between urban centers and peripheries in a map, tracking shifts in the nature of mobility in urban space, beyond a physical plant, but embodying how GPS readings tracked each cab across urban space as they move on major arteries, noting not only their positions over time, but indicating patterns of traffic, shifts in density at different times, relative rates of acceleration and different speeds of travel–all to chart how different dynamics by which the aggregate of cab riders’ experiences across urban space, the access to urban space that the self-selected demographic of cab-riders share, and the areas of cities that remain off their maps.

The dynamic results of such data visualizations provide compelling ways to understand the organization of urban space.  And in such lies their attraction for puzzling the existence and resilience of place.  “Cabspotting” at San Francisco’s Exploratorium invites us to track cabs as they carry fares at different rates of speed and acceleration across that city’s thoroughfares.  The data visualization is designed after the pioneering aggregate mapping of cabs in San Francisco’s streets by stamen design’s Shawn Allen and Eric Rodenbeck, displayed in a gallery setting in 2008 at MoMA, and first designed in 2005 by Scott Snibbe, Amy Ballin, and Stamen design.  This “high art” of data visualization was devised as a tool to reveal social, economic, and cultural data about the city in a variety of video platforms, exploiting the ability to download massive amounts of data about city cabs in aggregate that could be graphically condensed to a single image of apparent simplicity that spoke volumes on space use.  “Cabspotting” (2005) created an innovative alternative model of revisiting the city as a permeable and open space that was at the same time structured by economic patterns and social divisions in urban space:  the famous visualization of how people use cabs to inhabit urban space re-envisioned the city’s physical plant in a dynamic data-driven pattern varying trail length in response to cab speed.  Its particular power as a data visualization lies in its tracing of a collective iteration of individual itineraries, whose line thickens as they accelerate, creating an image that asks viewers to cathect to real routes through and across the city–either in an aggregate view as below, or in a real-time film of the routes and speeds on which cabs move.

Cabspotting

We are able to enter into the pathways along which the city plan is traversed and experienced, as well as occupying an Olympian point of view.

The sinuous traces left by the aggregate of cab-fares allow us to watch cabs moving at different velocity and acceleration across the city, to reveal a haunting socioeconomic X-Ray of the city’s space, and pathways within in its streets.  While omitting large areas of poorer regions, from Hunters Point, Bayshore, or Daly City, it illuminates areas in the financial district arrived at with disposable income:  thick lines of rides near the shores show a general acceleration, especially on the Central Freeway, Market St., the James Lick Freeway or the 101 and 280, as well as along the Bay Bridge and out to the Airport, reveal a dense distribution of cab lines filling the city plan that hinges on Market Street.  The absence of a network of freeways built within the city seems to have helped cabs’ circulation, but cabs are limited to a dense occupation of downtown streets.  Indeed, if the sort of freeways and highways were built over and across the space of San Francisco in the way that they were in other cities, perhaps the illumination of that gridded downtown would be less prominent in the Stamen visualization–although one can still discern the 101 or James Lick Freeway and Marina Boulevard leading to Ghirardelli Square in the Stamen map, imagine the shifting spatial spread in a city defined by the proposed arterials which would have rendered the city more navigable, but faced such intense local opposition  that they were never in fact built or got beyond the drawing board.


picture_4


The animation of traffic around San Francisco’s roads and freeways that Cabspotting celebrated the unique space of San Francisco’s streets, removed from a world fearing surveillance.  It also provided a model for processing data from taxis to illustrate the ways we use cabs to inhabit and navigate a city’s streets, emphasizing what routes cabs take and how San Francisco’s urban space is navigated, by taking up the perhaps oxymoronic proposition of surveillance technology as truly inspirational, in Scott Snibbe’s phrase.  The resulting graphic illuminates a hidden geography of how San Francisco is experienced across time in cabs, whose tracks trace a socioeconomically differentiated space in ways that cast the city’s physical plant in a dramatically new lens, where the density of downtown peters out to wisps along those avenues where fewer cabs run their fares:  Cabspotting set a compellingly high bar for data art.

The compelling portrait that emerges from the Stamen visualization offers of primary routes of cab entry generated considerable excitement for a virtual palimpsest of how urban space is navigated by paying customers in a city on a single day.  In ways that privilege specific areas of the downtown, and the larger streets–around the bay near the Embarcadero, down Geary Street, along Mission Ave. or nearby Civic Center, it suggests a living template of the city, noting each cabbie’s trajectory of driving by a white line, and increasing the size of its ghostly white lines by velocity and frequency of cabs.   As a form of GPS-based art, the ghostly image of the city may have shaped Jeremy Wood’s use of GPS in 2009 to track his personal cartography in the Gliclée print “My Ghost”, imaging an overlay of his own itineraries over the span of a year, but Wood’s image lacked the richness of wealth implicit in Stamen design’s data overlay.  Even if it suggested the lack of access of certain areas of London to Wood’s experience of the city, and a wide wandering over a hairy looping of space, the individual migrations through London streets suggests restless  iteration of an individual across city streets, unlike the densely packed social clustering of cabs  concentrated in the downtown San Francisco and accelerating along freeway lines.


my-ghost


The image Snibbe and Rodenbeck designed offered a memorable real-time contours for a city’s urban space that show a far less dispersive wandering around the vagaries of urban byways, and a focussed repetition of routes around a relatively restricted urban grid.  In each of its successive animated time-lapse iterations and real-time rehearsals, the Stamen’s “Cabspotting” re-mapped urban space by tracking the collective aggregate of motion across urban space, using data from embedded GPS data of position, speed and acceleration to remap a strikingly plastic living urban landscape in dynamic–if haunting–ways:  pay-per-fare riders sculpt streams of traffic across its major streets and thoroughfares, rife with cab rides, appear illuminated by the aggregated overlay of rides over time, showing the different rides of the city that were being performed as if to condense a residue of the collective transit through the city around select hubs and thoroughfares of increasing or diminishing traffic.


Stamen Cabs


2.  The wealth of data mediated by GPS measurements allows one “map” space around each of the “lines” that designate cab-rides by relative speed, using red to highlight moments of acceleration at a fixed period, in a time-lapse moving image that traced the matrix of the city’s streets.  In ways that predate but prefigure the current rise of on-demand  smartphone-based apps as Umber or Hailo which aim to displace the local cab economies in most metropoles, the pulsing traffic of animated  tracking of taxi-cabs renders the city’s grid in a wonderfully dynamic way:  Cabspotting serves to delineate clear economic patterns and socioeconomic points about how different folks perceive the same space of the city.  The dense glow of traffic around Union Square of cabs parked, circling, or just stationary reveals a center of commercial congregation.


colored map cabs' speeds


Such tracking of cab-traffic of course may sharply differ in other urban spaces, where centers or commercial districts are more concentrated or differently distributed, and access to space less clearly privilege distinct thoroughfares.   The real-time tracking features of Cabspotting liberated static models of mapping by using GPS to amass data in ways Rodenbeck and Allen could readily visualize in clean lines.  But the “snapshot”-like nature of the Stamen graphic led to some early envy in data visualization, as Kottke and folks on the East coast imagined what a similar data vis of taxi flow for midtown New York would look like, and first obtained the GPS data from taxi trips to create an image of the “vital signs” of where cabbies picked up their fares in the first half of 2009.

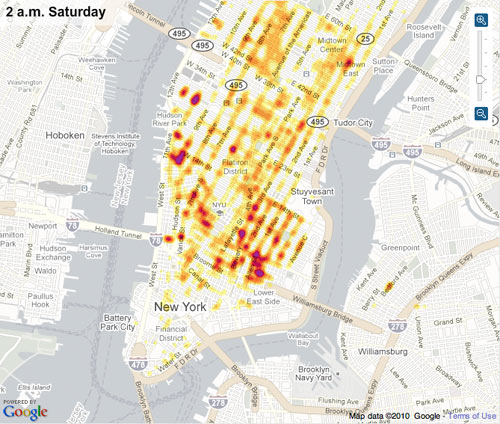
The resulting temporal condensation of an animated sequence of cab traffic between January to March, once sped up to suggest something of a regular flow over time  is clearly made to appear synchronized with human cycle of breath, as if to suggest its record of the vitality of the city’s traffic, with fares increasing from 7 am to 8 am, expanding to their highest density in midtown every morning, pausing, and rising again, only to decline in their yellow-hued intensity by nighttime, and leave the city blanched in the early a.m. hours.  (The maps should be looked at by anyone interested in hailing a cab, and as a companion piece to the guide of NYC cab etiquette–asking cabbies “What route do you think fastest?” “instills trust in the driver”, rather than giving directions on where to go–although it is unable to be accessed in real time.)


Densest at midtown #4


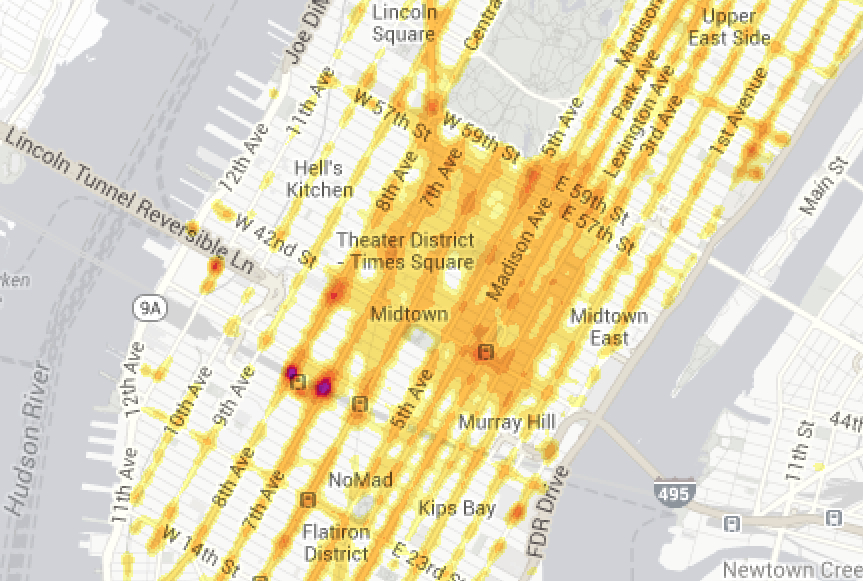
This apparently anthropomorphic time-lapsed image created suggests the inexorable daily constriction and dilation of the city’s vascular system, in tempo with the gorging of taxi fares that slowly dissipate, as if in a forced analogy for urban vitality:  the density of fares in midtown suggest clots more than flow, but provided a neat heat-map of city traffic’s frenetic pace. The distinct flow of cab traffic responds to the dense layout of Manhattan, and the saturation of the midtown and lower Manhattan with cab rides that fan up and down its major avenues.  Unlike the smooth flows out of arterials and to the outer edges of San Francisco, the knotted nature of the New York City visualization suggested a rigorous diurnal rhythm of relatively small trips of privatized transport, densest at the city’s midtown hubs, and reaching over to its wealthier east-side avenues.  But while its anthropomorphic form may be stretched as a bridge fusing nature and culture, the map reveals in important ways the individual specificity of taxi patterns within an urban topography, and indeed the specific diurnal fluctuations that define the demand of taxis–fading as we approach uptown above the blip of the 79th street subway lines–and suggest distinct rhythms of distributions and concentrations of demand for cabs that appear across each urban space, focused in midtown below Central Park, along Broadway and Third Avenue, and specific spots in lower Manhattan.


Screen shot 2010-04-05 at 9.05.50 AM Screen shot 2010-04-05 at 9.05.50 AM Screen shot 2010-04-05 at 9.05.50 AM taxi-flow-nyc   taxi-flow-nyc


The specific density of midday midtown reveals a complicated geographical picture a city served by experienced drivers doubtless working in tandem with a sense of its rhythm, best able to gauge the shifting traffic contours of urban avenues.


Densest at Midtown #2


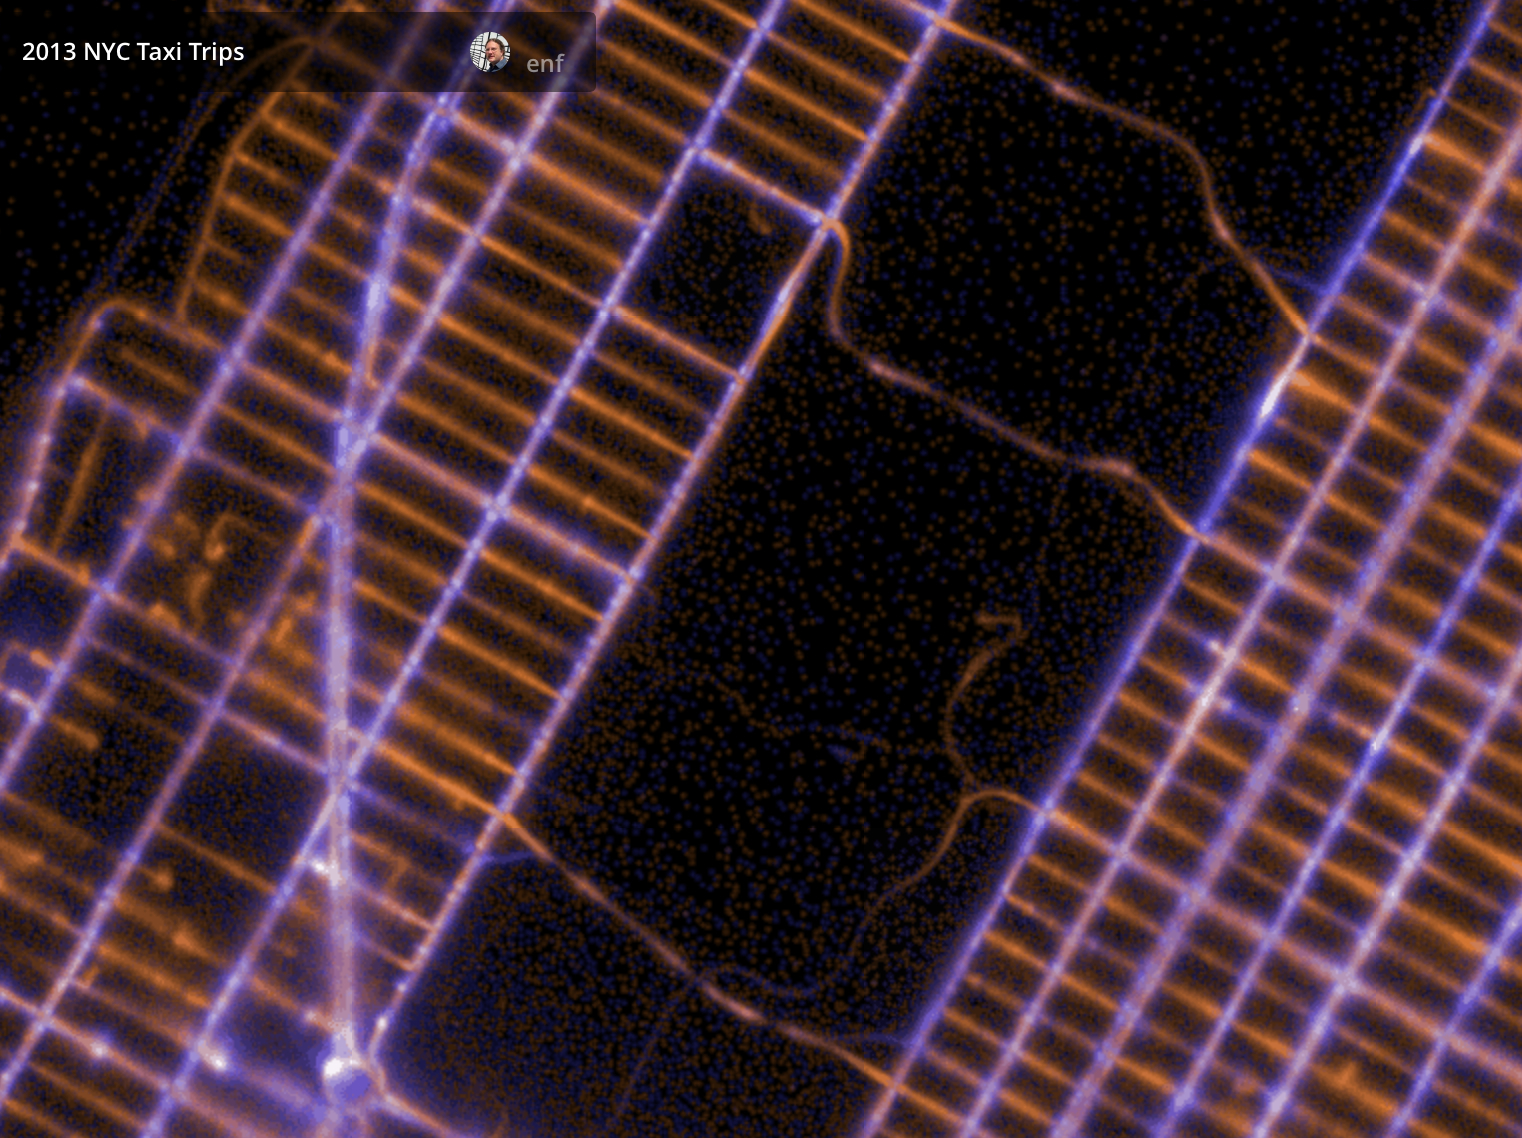
This image, if interesting, has been recently refined in a two-color data visualization that refine the image of how New Yorkers enter and exit from taxis to navigate New York’s urban space.


3.  Eric Fischer re-mapped a specific topography of ‘cabstopping’ by aggregating the range of cab hailings (blue) and destinations (orange) across the city in 2013.  And an even more massive amount of cab data was declassified after Chris Whong and Andrés Monroy used New York City’s Freedom of Information Law to obtain a copy of the taxi records from 2013 they soon published on the web.  The big data of some 187 million geo-located cab-rides inspired transportation visualization guru Fischer to map the aggregate of total rides taxi drivers gave passengers across Manhattan’s particularly packed automotive space, now on Map Box, in a striking visualization of the collective use of cabs across Manhattan.  The map’s strikingly clear block-by-block topography is of striking precision; it illuminates how densely cabs are concentrated in midtown Manhattan and how specifically the vast majority of pick-ups and drop-offs center in specified regions–and how omnipresent are cabs up to Columbia University and 96th on the East:  cab-density, unsurprisingly, is a measure of socio-economic wealth and property value.


Big Mapping NYC Taxi Trips from Open Data


The social topography of the city is balanced by the white skein of veins in midtown that define a special density of cab-use along major traffic arteries.  And it presents one way of mapping a changing configuration of center and periphery across the city. For Fischer, a fan of both crowd-sourced mapping and urban transport system, dissected the data in visually compelling ways by highlighting the starts of taxi rides in blue and the end-points of destinations in orange, a spectrum that allows us to map the topography of collective cab-use around Manhattan, Brooklyn and Queens. The demand for local usage of cabs isn’t divided into analytics, but provides an image of the density of cab-use in an actual topography before folks like Uber or Hailo threaten change its face–and seem to use their own GPS tracking to exploit by a smartphone app to connect passengers with vehicles of hire, provoking some concern about using GPS to charge fares, and adjusting fare rates in relation to the density of traffic flows:  indeed, the apparently clear preference of New Yorkers to use Uber in off-peak hours and geographically removed and less-served locations suggest that Uber might, in New York, be better conceived as complimentary to the apparently engrained services of other cabs.  Are such drivers even more dependent on GPS to discover the relations between fares’ destinations and the cityscape, as well as to find their next pickup?


Uber hand


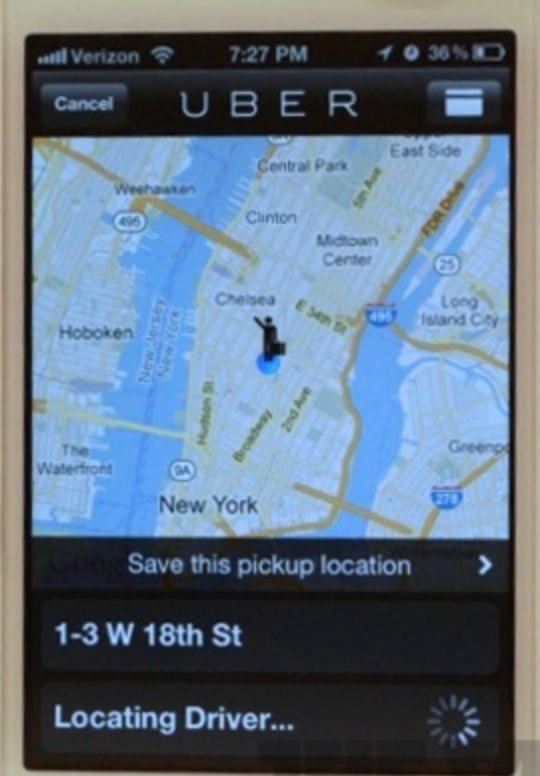
The data that maps coordinates for the start and end of cab rides provided a way to “map” what places New Yorkers are most likely to hail a cab–perhaps the most difficult places to get a cab, but also no doubt those areas where cab-drivers aware of an increased demand–as local knowledge of cab-riding more informational of urban space than even the most comprehensive transit map–and perhaps augur the life-span of cabs in the age of Uber.  It also offers a readily accessible instance of open data which provides a nice counterpoint to the banality of the Google-Maps-based cityscapes that feature on demand cab-hailing apps:  or the difficulties for the sophisticated software that sets its rates in relation to the hours of increased intensity to offer what an actually accurate image of the urban space in which it promises travel.


Hailo:Uber


But let’s return to the subtlety Fischer’s coding of end points in orange and sites of hailing in blue allows.  The aggregation is so dense that it defines the entire street grid.  Most superficially, a scan of the data visualization he posted shows the hailing of cabs to be clustered on avenues where cabs congregate and course North or South–joins legibility with aesthetics, charting where New Yorkers access and stop cabs to tell us a lot about the navigation of the city’s grid in its crowd-sourcing of automotive itineraries.

For Fischer’s visualization deserves plaudits for elegantly synthesizing an exact visualization of the unique ways that folks use urban space:  of the over a million and a half taxi-rides that were taken in 2013, most concentrated in the cab-mecca of Manhattan, most seem to be taken along the North-South axes of the avenues, somewhat predictably, with a striking density of destinations on almost all of the major streets, often ending along North-South avenues.  Fischer’s map almost illuminates the grid of city streets in ways that tell us considerably amount the range of disposable income available to Manhattanites as well as to most visitors to New York.  The intense activity that the cab occupies as a sort of “second car” and mode of transit suggest a fully served community, if it sacrifices data on speed, acceleration, and delays that might be necessary to really envision drivers’ relative effectiveness.


187 mill Taxi Trips in NYC


4.  Access to this huge data offered a rich vein of data for Fischer, a data artist who often sources huge amounts of information off Twitter, to work characteristic visualization alchemy in a static spectrum to conveys the dynamics of how people move in patterns to organize urban space.  While the image is 2-D, the fading and clustering of its range of illumination invest the Manhattan grid with an illusion of three-dimensionality by using a simple set of primary hues.  Indeed, the phosphorescent blue taxi pick-ups create indelible records of where the cabs were “spotted” and used, although something of a patina in this digital visualization is created by shimmering “GPS-static” in the more densely built skyscrapers of the city, which are odd artifacts of the mechanics of data collection:  as Fischer notes, in certain spots, GPS signals have reflected off buildings’ windows, in ways that add an other (if not welcome) layer of legibility to the map of the city’s space.  (Far crisper contours of cabs’ signals arrive from streets that service the much lower-lying buildings of Brooklyn or other boroughs, even if cab-traffic there is far less intense.) We can read the data visualization to detect the conscious choices of cab drivers to negotiate the flows of urban traffic, even though the image is static, based on the similar clustering of overlays in data.    Although midtown is somewhat filtered beneath  a gauzy layer of interference or blur of GPS-signals’ distortion, as is much of lower Manhattan, reflecting the interference created by urban canyons of clustered skyscrapers that render GPS reception less precise–though we can see the white heat of cabs hailed or congregated at businesses and hotels that serve as sites of conferences and conventions, and detect a temptation to leave rides on East-West streets,as on Central Park South and 57th Street:


Blur of Midtown's White Heat


The data visualization charts the tacit mechanics of the topography of cab use, by using a orange-blue color differentiation to set of regions where destinations dominate cabs hailed or flagged and journeys begun, and where they leave passengers.  We can see a sharp preference to take cabs to destinations on East-West streets, negotiating a topography of traffic that taxi drivers’ familiarities with the different velocity in the white-lit larger avenues control.  In contrast, the specificity of red bulbings of destinations at various crosstown blocks where passengers stopped cabs suggests a specifically situated transportation midtown, even with clear evidence of the blurriness of GPS-interference.  (GPS fixes are also less easily held near LaGuardia airport, as bright red “worms” approach the access roads of terminals, as if to indicate “premature” arrival of a cab stopping before where they were surely headed; a pattern of blue blurs result that seem air-brushed, in comparison to the crisp lines in Cabspotting.)


GPS Fixes near LaGuardia Airport


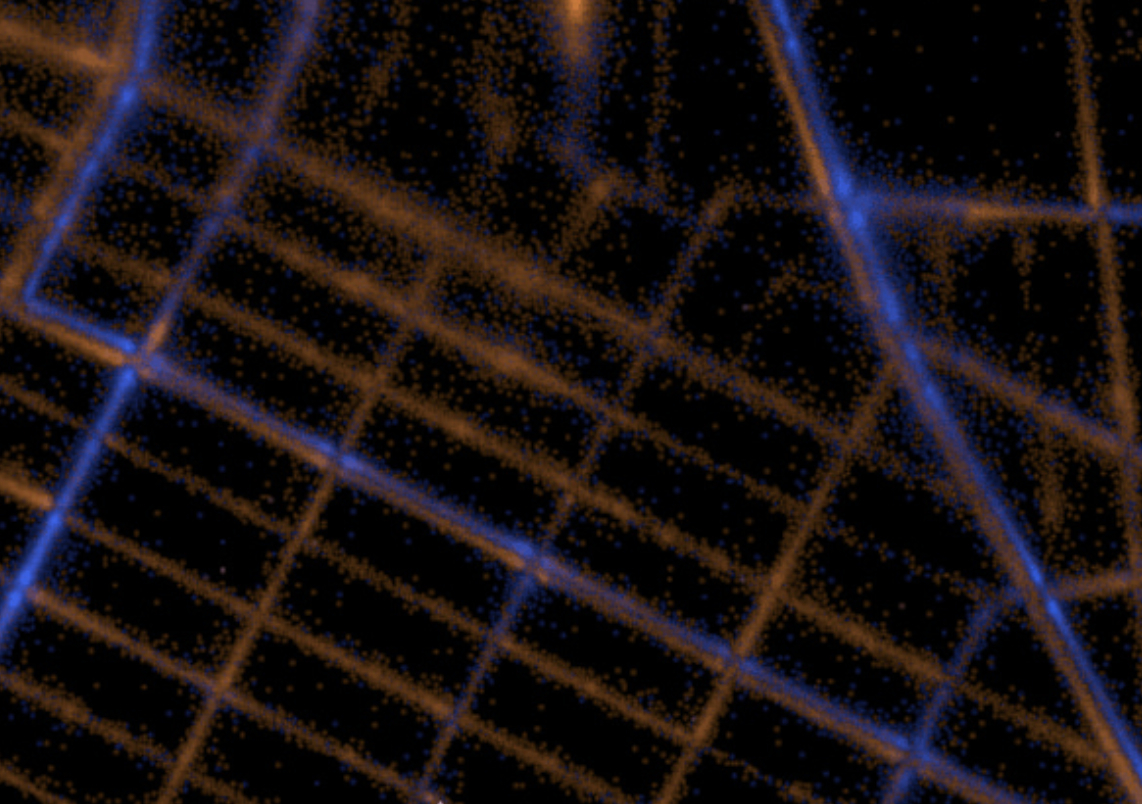
If the Bay Bridge stood as a beacon of taxi density in the Stamen visualization of San Francisco, La Guardia seems a brightly burning beacon off Manhattan, and the Brooklyn Bridge provides a lighter but indelible tie recording of inter-borough taxi traffic.

The traffic patterns recorded in the visualization reveal a palimpsest that demand interpretation of denser lines of red (where cabs leave folks in the city) and a tool to investigate how city space is used and what neighborhoods visited per annum:


Strats Blue:Ends Orange-BrooklynBridge #2


Red lines are veins across New York City’s Central Park, where one can’t imagine the destinations are actually along the crosstown lanes of traffic that run on paved roads across the park, where tunnels that cabs run through seem to have interrupted the GPS signals as well at 86th street, 81st Street, and 66th:


Veins around park and Mysterious Red Dots


Brightly lit blue lines illuminate 5th Avenue, a street almost always crowded with cabs, and light up both lanes of Broadway, in ways that offer a beautiful visualization of the way we demand to be driven in Manhattan’s urban space and across its street plan that demand to be pored over with a magnifying glass in hand to best interpret its elegant aggregation.  The map can help us create a better navigable urban space–and perhaps respond to the needs for taking cabs in the city–by mapping needs of public transit, and the readiness of customers to use cabs to navigate urban space.  The street plan provides tons of neat points about the nature of collective behavior, as all aggregated data, nicely foregrounded in Fischer’s color scheme:  just as we detect bright blue sites of starting cab-rides near the Brooklyn Bridge, if considerably brighter in Manhattan, and notice bulb-like orange clumps of drop-offs in Dumbo–the downtown municipal buildings are the looming black blocks.


Strats Blue:Ends Orange-BrooklynBridge #2


The blue bulbs at street corners give a more likely (more convenient and better) place to start one’s cab-rides in Manhattan, as our GPS lines bulb out at centers of cab-hailing at intersection in the form of a Q-Tip, suggesting considerable refinement of the data, in spite of the occasional blurred reception of GPS signals:  some corners burn an incandescent blue.


Corners are often Bulbs


5.  The specific transportation needs that taxi cab services supply suggest a distinct manner for negotiating urban space at a pace that public transport can’t provide, and a particularly resilient form of a local economy.  How might this relate to the specifics of the survival of the cab as a viable vehicle and model of transportation (and the regulation under which cabs function)? In an era when GPS’ing pickup locations in the crowded downtown by Uber threatens the cab-drivers who have so long made their livelihood in the city’s streets.  It awaits to see how the density of cab traffic already available in the city will react to the influx of passengers with handhelds.


uber


Indeed, despite the universalizing nature of Uber’s intentions, the app they offer may best function  precisely in those cities and urban areas which fit the traffic patterns specific to San Francisco most closely.  San Francisco, the city where the app was first devised, offers a unique problem of navigation for taxis:  pedestrians and inhabitants both face a scarcity of free cabs and often face the need for long trips from downtown to, say, the Inner or Outer Richmond or Pacific Heights, call cabs over to the East Bay, and are often located at a distance from taxi stands, and where fares might have too much difficulty hailing a cab at later hours.  And where single women who want a secure ride door-to-door make up, it’s been suggested, a major portion of the fares.  (It might be argued, however, that the whole point of Uber was to harvest a huge amount of data that can be plotted by future mapmakers and indeed predict the relative likelihood of destinations across the city in a more sophisticated way than was ever possible.)

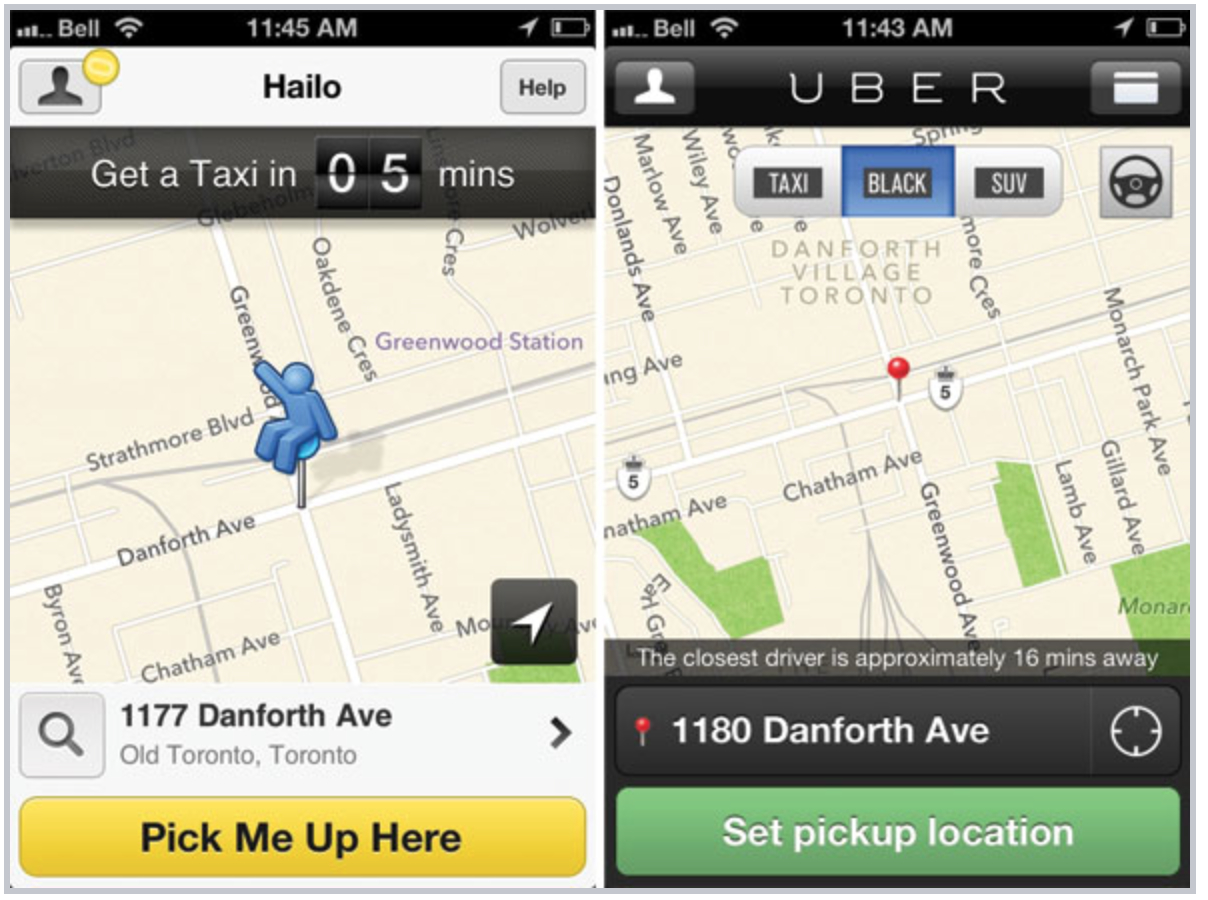
But even in San Francisco, it bears noting, the recent introduction of “Pick-Up Points,” or recommendations of specific pick-up locations in mid-2015 suggest a new way of mimicking mobile taxi-stands for their users–as if to acknowledge the difficulty inherent to promising mobility for an urban space that is often by definition clogged.  Although the potential to be anywhere–or assign a driver to appear anywhere–at first distinguished Uber’s provision of crowd-sourced drivers, eerily soon after the suggestion that the rideshare service provide precise locations of where a fare might be best able to draw drivers–and, if not hail a cab, meet one’s driver–the urban maze of U-turns, changing traffic flows, one-way streets and freeway onramps makes it not only more convenient but more enabling to imitate the interactive suggestions made by Lyft, for example, in inviting its users to indicate where they might best meet their ride:

yft

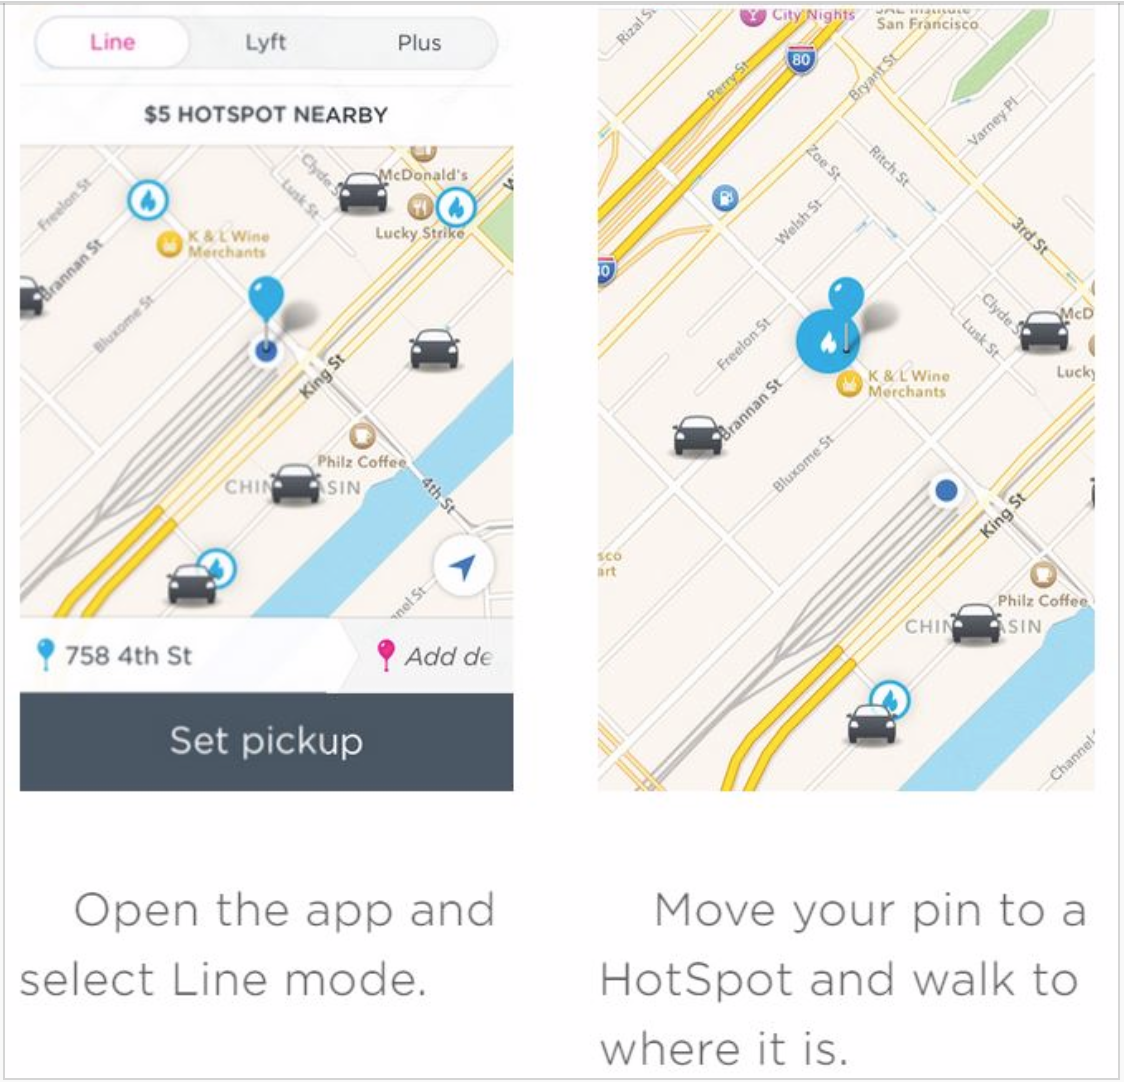
The innovation is not to become less interactive, but to offer a set of coordinates from, for example, a crowded field or region, where one’s ride might otherwise have difficulty locating you, even if that selection may sacrifice the illusion of being anywhere, anytime, and involve some extra footsteps of one’s own:

Suggested Pickup POint UBER


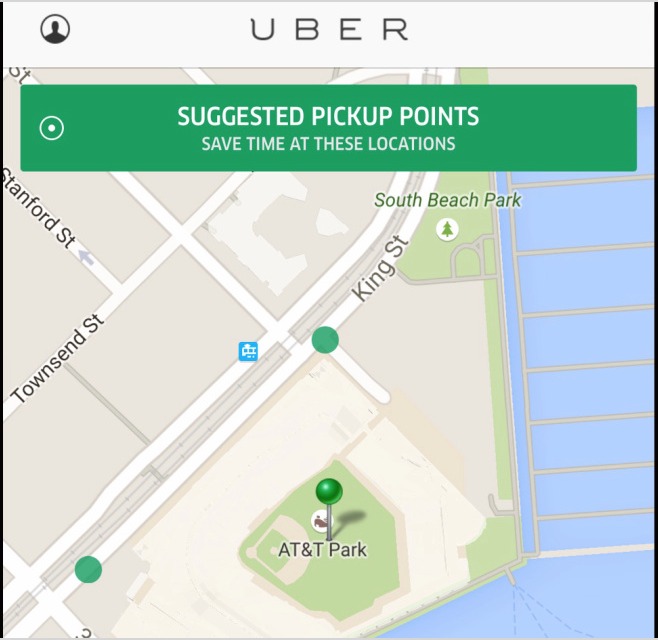
There is some data that demonstrates that the indication of such exact sites of pick-up may allow riders to appear at precise times without creating a situation where drivers would actually compete for fares, and to ensure the illusion of personalized service in a service that in aggregate reveals clear patterns of its own.

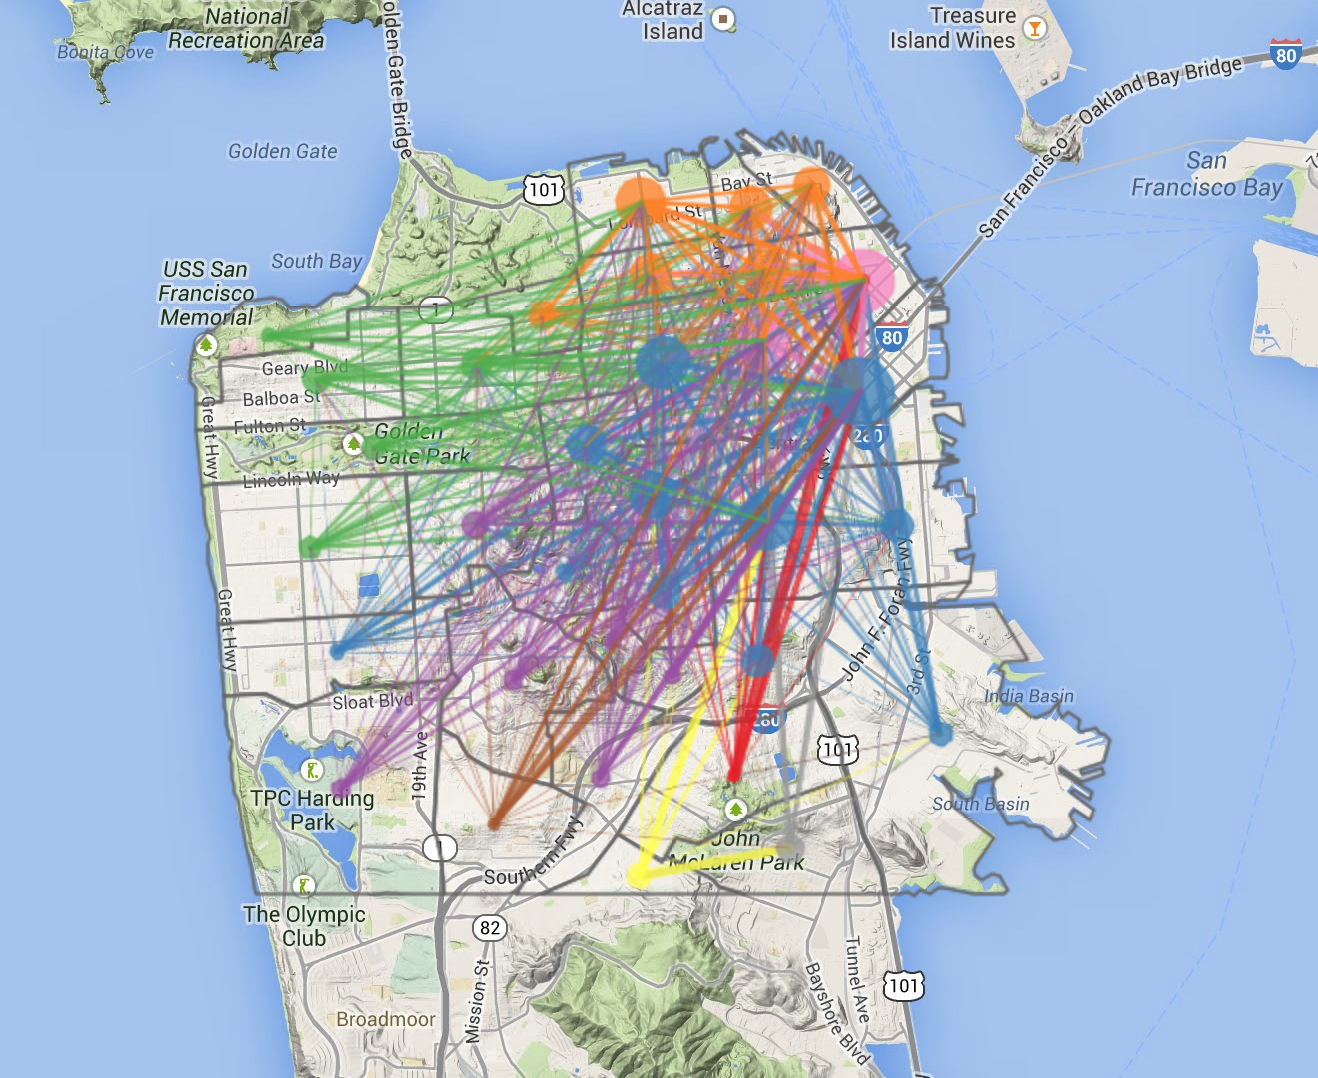
The harvesting of data that Uber allows, indeed, makes it a sort of Google for the taxied set, and creates something like a valued dataset that Uber has done its best to exploit.  As Bradley Voytek has noted in a neat on the Uber Blog, in a neat weighted diagraph visualizing the flow of rides from one of San Francisco’s neighborhoods to another, noting the aggregates of rides leaving a neighborhood by a circle of varying size and drawing weighted arcs in the color of the neighborhood of a destination, the flow of Uber rides predominantly originate from South of Market or downtown–the largest point of departure of Uber clients by far.  Almost all the rides originate from the downtown.  This clustering of rides around a single region of the city suggest a restricted range of sites of departure for on-demand rides, and a marked clustering among three neighborhoods from which users predominantly originate–although it should be noted that Voytek used dated data rather than the data Uber now possesses–and offers a larger visualization here.

Rides into neighborhoods Bradley Voytek


Might one decide to map the different topographies of traffic flow across different cities in the hopes of predicting how well Uber offers a fit for the navigation of a distinct urban space?  Even with the increased homogenization of cities, the underlying plans and patterns of local traffic provide some guide to its potential “fit” with local traffic and cab-use. It demands investigation how the market would adjust for Uber to be most complimentary to local needs.  The integration of GPS with a local taxi economy has been recently argued to create an artificial scarcity of taxis squelching competition, but to champion the free market approach runs the risk of setting off shocks in the local economy of providing short-term rides that has developed in the city’s somewhat fragile transportation economy.  For as well as reveal the pathways of negotiating urban canyons of New York, the visualization reveals a delicate local economy in which car-users navigate the available calculus of transportation–a city where few drive the cars they own every day, and despite a relative density of car-ownership in Manhattan and New York City as a whole.

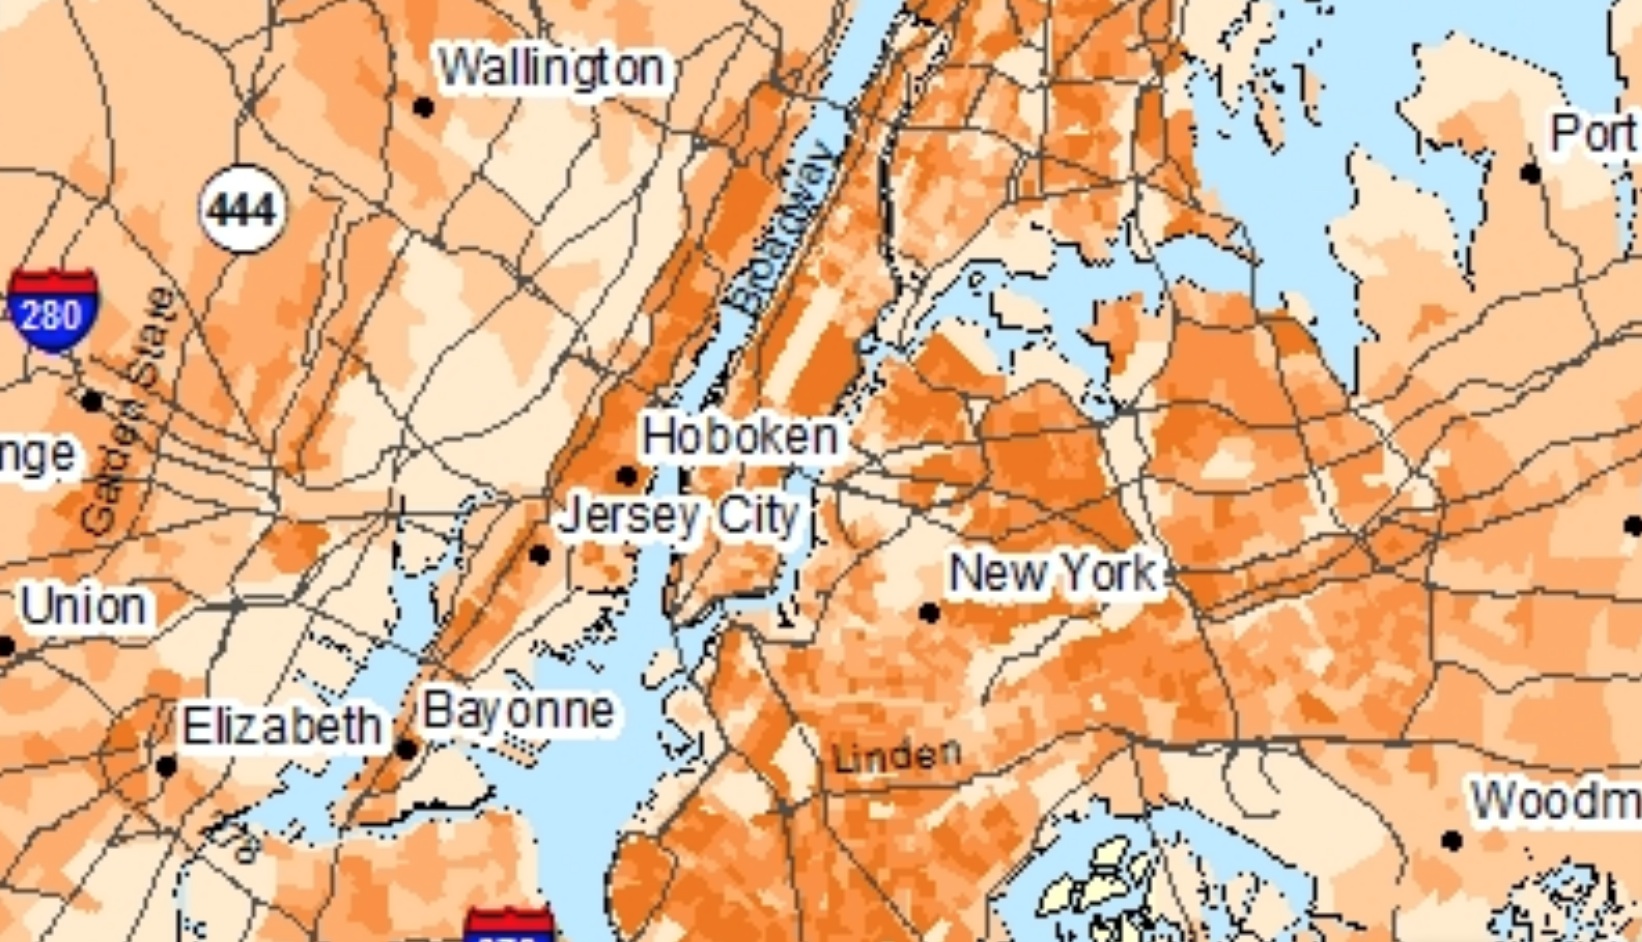
Indeed, many don’t even rely upon cars–despite the incredible density of cars per square mile in the relatively affluent region, according to the data mapped in StreetsBlog LA.
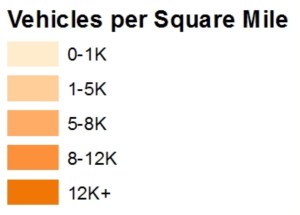
 

Vehicles:Sq Mile NYC   Vehicles:Sq MileStreetsBlog LA

Viewed another way–vehicles/person–New York City seems relatively low-density, indeed, because of the sharp contrast to outlying “suburban” areas or peripheries:   few cars are used for commutes, and multiple car ownership is quite rare.  Reasons for owning vehicles shift in different social topographies.
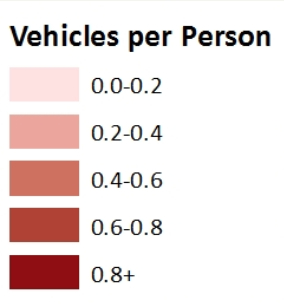
 

Car Ownership in NYC and environs Vehicles:Person StreetsBlog LA

The stark contrast in the regional distribution of statistics of car ownership are striking on the micro-level of Manhattan are indeed evidence of a large commuting culture, where many cars belong to commuters who live in more car-friendly lands outside the five boroughs:
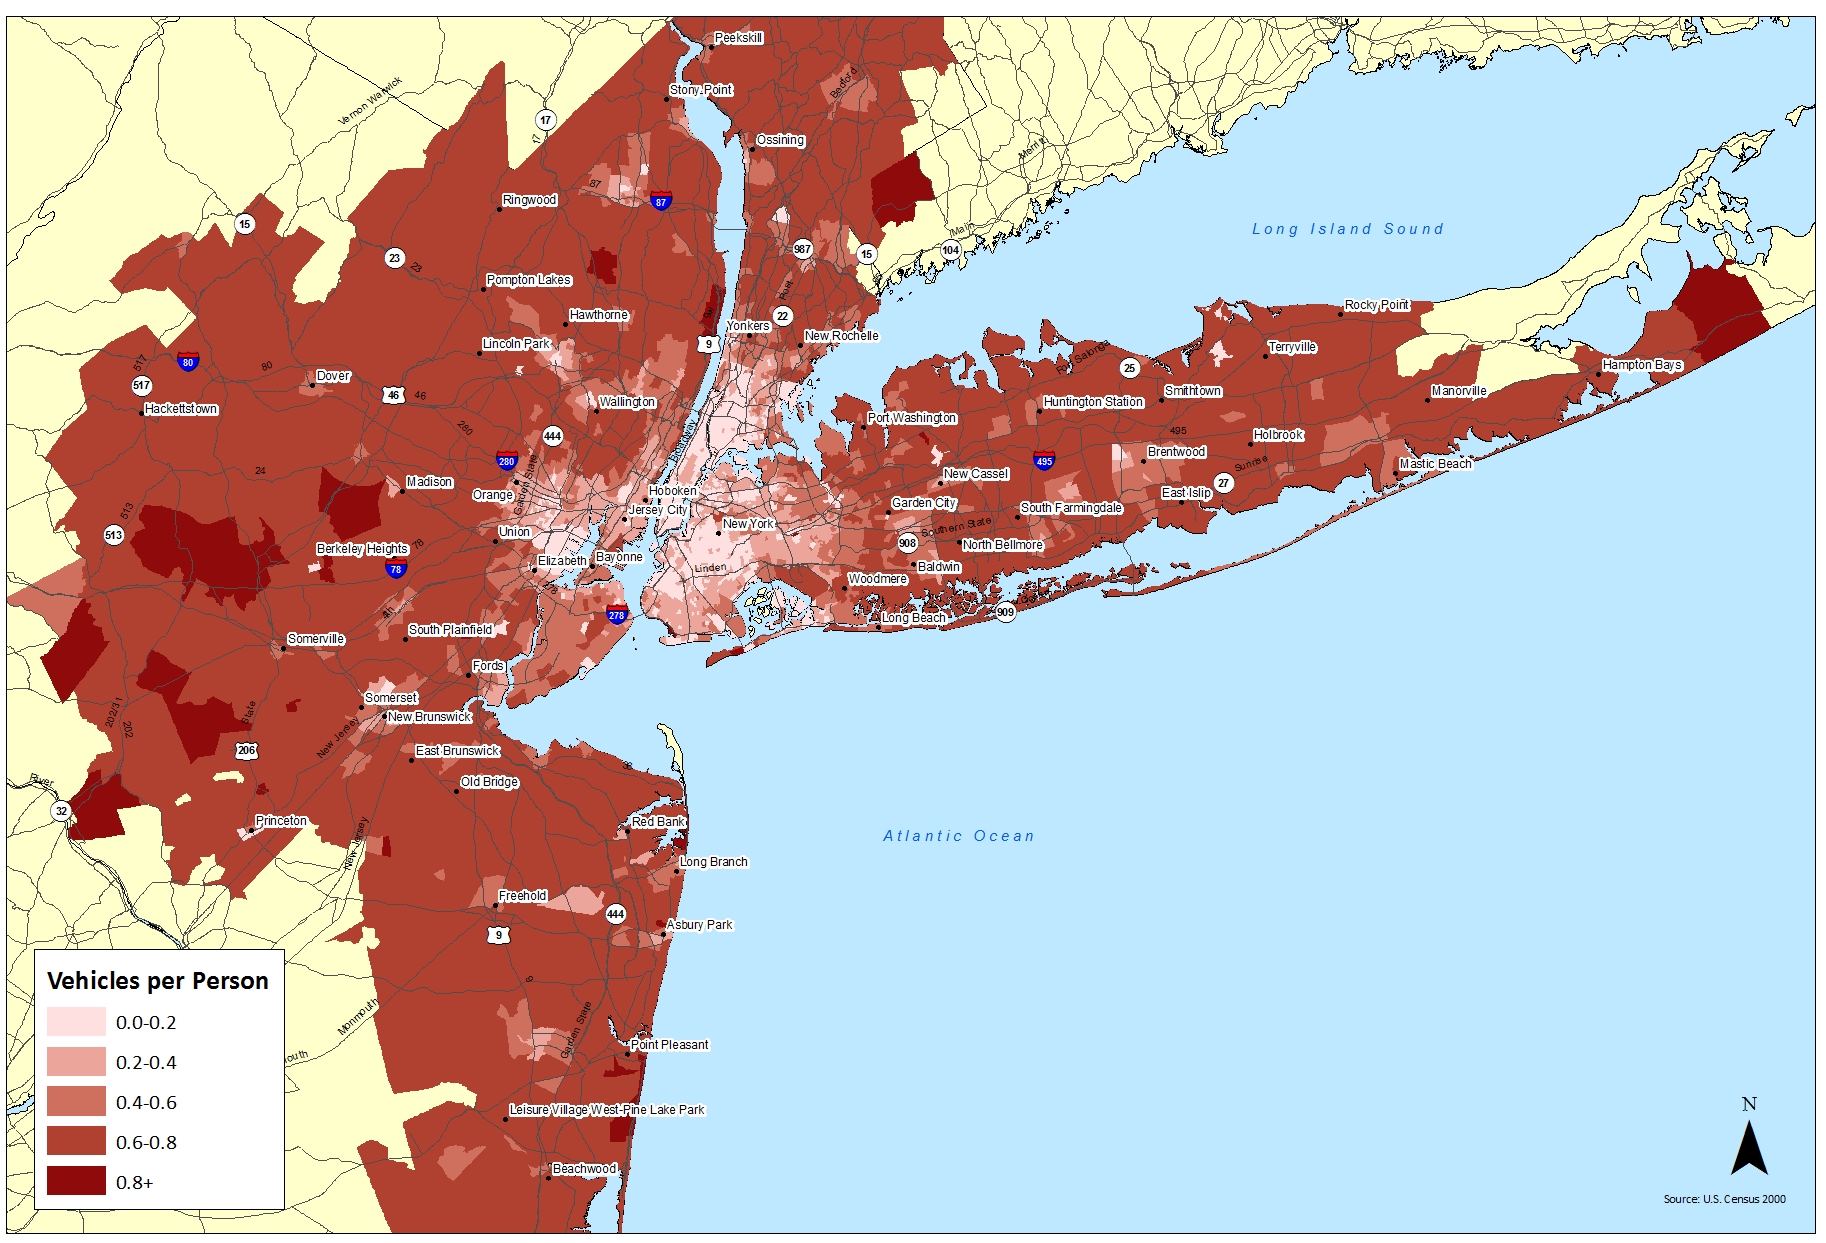
NY-Vehicles-Per-Person   Car Ownership in ManhattanStreetsBlog LA


Although the vast bulk of cab-rides in New York City are based in downtown traffic, where garages are costly and urban street space at a premium, the data visualization reminds us of the continued importance of cab services to negotiate local space.  The relatively subtle tool for moving in a narrow time-window that cabs provide offer an increasingly needed medium to move through and use space that seems unwise to disrupt not only as a way to move the city’s economy, but for the very reason that it is so deeply established of negotiating specific constants of its traffic patterns and laws.  Indeed, the poor ability of GPS or any GIS system to record the shifting pulse and intensities of traffic raises questions of the time which its drivers need to accommodate to actual traffic flows.

If Uber is able to navigate it, best of luck.  Maybe it already has:  but the uncertainty of how markets are currently treating this ride-sharing service suggests that it may have opened the way to far more competitors than it ever foresaw.

Leave a comment

Filed under cabspotting, data visualizations, GPS, GPS devices, mapping city cabs, maps and surveillance, on-demand taxi service, Uber, unwanted surveillance

Data Creep

The relative onslaught of poor data visualizations so plaguing much of the news media may derive from a hope to attract new audiences as budgets shrink and bureaus decline:  by boiling down a “story” by dispensing with those bothersome words, they seek to make immediate impact on an audience by a powerful (and eye-catching) graphic.  Based on the self-reported responses to the “Big Five” personality test questionnaire that was developed in the 1970s, but recently used to aggregate responses via Facebook, which posits “five dimensions of personality” to distinguish personality types, based on the odd belief that, rather than reflecting individual character, one could detect “different regions of the U.S. have different personalities.” The self-reported rankings of attitude (curiosity, energy-level, tenseness, quarrelsomeness, forgiveness), efficiency (reliability, laziness, perseverance, efficiency), and character (shyness, moodiness, distractibility, sociability, rudeness) are values with little possible quantifiable relationship among themselves, which translate into a data-distributions of limited legibility or credibility after they’ve crept into a map.  Projected onto a map the colorful choropleth offers a “mood-ring for the nation” whose choice of hues communicates little intuitively:

state-map-personality-test

Unimaginative data overlays like this  lie somewhere between video games, a MacPaint program, and an adult coloring book approached with Prismacolor markers–more a diagram than a map, they serve to carve the nation into clear blocks as if this would clarify anything about national unity or collective networks:  such visualizations take pride in how they disrupt continuity in a search for a narrative about the national divides that are revealed in our political process, and do so with varying degrees of precision.   Their production seems to be driven creep of data into overlays atop base maps, as if to awkwardly digest the familiarity with data–and make all feel like they have access to truly “big data”–by using an image of the nation to bequeath authority even to miniscule data samplings by treating them as images able to visualize datasets:  this is an insidious format makes us thirsty for more of the same, as we seek to grasp divides and parse divisions with the apparent exactitude of a surgical scalpel.

The recently widely retweeted but fairly facetious map of “America’s Moods”, an interactive graphic mapping emotions titled “America’s Mood Map,” has circulated online with considerable popularity but is able to be blamed on Time magazine’s website.  The data visualization has just the right mixture of declarative insouciance and light-heartedness make it a meme and bane of online journalism, and a typical illustration of this dilemma.  The distribution of data that results deflect scrutiny from the very data that they’re employed to embody.  The interactive blocks of color in what seems a choropleth distribution are a bit compelling, until one asks what state-lines have to do with emotions after all, or if this just was a nifty way of converting data to visual form.

What sort of embodiment of data is going on here, one might well wonder, and question what the mosaic of colors communicate or signify.  Not to mention the map’s confusion of a question of individual psychology and gross geographic regions–especially such abstractly construed categories as the legal boundaries of forty-eight individual states’ authority in our nation’s union.

The interactive ‘map’ demonstrates the recent discovery that responses to the great American greeting, “How you doing?,” differ starkly across state lines in the lower forty-eight:  if in benign fashion, the result proclaims divisions and splintering that trump the continuity of territorial maps, and perhaps map an explanation for all the differences we already know.


America's Mood Map


Why “friendliness” is signified by red, “temperamental and uninhibited” by blue is as problematic as the lack of any continuity among these personality types, and the relative subjectivity of judgment:  it turns out that these are self-classifications, anyway, rather than determined by objective criteria–as if values like these could be objectively assessed.

The lack of material references in such ‘maps’ almost winks to viewers not to take them too seriously.  Yet the relative ease of converting statistics into overlays on base-maps in web-based formats, seems the rationale for their popularity as interactive media in on-line news publications.   Forget the actual map that orients its viewer to the lay of the land:  this is immersion in the map as interactive data environment.

The deepest difficulty of this data visualization may lie in how it confounds the empiricism of a map with pretty relative–and pretty vaguely construed–psychological categories. Although Time magazine science editor Jeffrey Kluger seems to have fun downplaying is meaning at the same time as he promotes it, “America’s Mood Map” is the most popular in the section “Science and Space” among readers of Time this past week, and a success by journalistic standards, is the interactive map of emotions across the United States, across which one can glide one’s cursor to reveal a virtual version (and modernization) of the early modern Carte de Tendre over which you can mouse about to find a place that “matches your personality”:  but rather than visualize material renderings of feelings or emotions, as that topography of amorous practices, the imaginary topography over which we mouse to find the ranks of each state’s inhabitants reveals clear divides rather than a detailed qualitative record.  Data has crept into this map’s bright mosaic of colors can’t help but engage other data-vis maps, with which its full-spectrum color schema stands in such stark contrast.


Moood Map of US

Although the color blocks are arranged in something like a spectrum of friendliness to temperamental, the actual values on which they are based provides something of a map of mental constitutions, as much as emotions, and one can range of neurotic to extroverted, with open-ness thrown into the mix.  The explorer of the map can find themselves, for example, in “agreeable, conscientious and open Tennessee;” we all know a few who fit the description:


Conscientious Tenessee


The ranking of each state surely increased its popularity, as the map becomes yet another tabulation of characteristics after one mouses around a bit on its surface.  California, predictably, is both relaxed and open (#2 nation wide!) and low in neurotics (#43; agreeable Utah lies at the bottom of the heap at #49), and New Yorkers are temperamental but ranked as among the most open (#3).  (Such classifications based on a sampling of 30,000 must conceal the detailed nature of the questionnaire.) Who would have thought that largely rural Wisconsin, a state with one large city, possessed the most extroverted population in the country? Or that Maine stood near the nation-wise apex of neuroticism?  New York gets pretty low marks for “agreeableness,” whatever that means (#48 in the nation), if it is also pretty high in “openness.”

There might be some problems with the data pool.  Perhaps the map’s very lack of materiality makes it difficult take seriously, even if the pleasure of using moods to divide the country seems a relief from dividing the nation by ideological divisions.  (The next step that this map seems to invite is no doubt for carto-data-crunchers or map-readers to map the moods of the nation onto those political divisions:  how better to easily explain the ideological divisions that grip our media on the eve of the Affordable Care Act and the morning after the Government Shutdown?)   Indeed, the interest in the “mood map” among Time‘s readers might been generated in part by hits from all those readers, long subjugated to an onslaught of data visualizations, who want to explore their own states in the mirror of their own states of mind or who want to try to map the now-tacit maps of national division onto the far more innocuous (and un-ideological) question of moods.  Indeed, this stepping out of the recently emerged graphic lexicon of ideological division and splintering is somehow reassuring, as, much as the article announced, maybe its mistake  this country “features the word United in its name,” since “we splinter along fault lines of income, education, religion, race, hyphenated origin, age and politics.”

Maybe it does really all boil down to constitution and emotions, all those earlier data distributions be damned.  The end-product is something of a polemic rebuttal to the authority of earlier data visualizations in the news, to be sure, of a very tongue-in-cheek sort of very, very muted irony.  The text’s injunction to find where you belong in the map–by your mood, not by where you actually are–invites you to glide your mouse over a map with the authority of a spatial distribution of the rainbow colors of a mood ring, in a pretty abstracted state of mind, so unlike the ways in which, say, a detailed topographical map registers the measurement of physical elevations by exquisitely exact orographical detail.

The survey employed was based on a sample of under 30,000 respondents, but passes itself off as a pretext for self-examination or -understanding, complete with the assurance that results won’t be reported or stored by Time is respectful of your privacy (perhaps to marketers of antidepressants?).  Whether it is able to map such stark divisions of “mood”-tendency beyond statistical error is unclear, although the almost spectroscopic division of the nation into stereotypes seems somewhat persuasive:  the center of the country, if not so large a swath as the “red-states” of Bush years, is proudly “conventional and friendly,” unlike the creative types on both coasts:  the mapmakers permit little constitutional overlap among these categories, or multiple combinations of them, so much as render one of the three criteria for each state, and allow little overlap among them; the cartographical “paratext” to the map placed above its panels invite its readers to take a short test so that one might place your personal constitution where it really belongs, and suggests that these three metrics are rigidly exclusive from one another.


Moood Map of US

The result is a new portrait of the dis-united states, several of which are already in widely circulation–and some even so widely internalized as ideological divides that one can’t make associations between this “map” of emotions to more familiar political and social divisions.  The data visualization may be taken as a pretty light-hearted response to our dramatically increased geographical mobility, or our obsession with data-visualization maps.  But Kluger and co-author Chris Wilson use the data of fellow-American Jason Rentfrow, obtained at Cambridge by a multinational think-tank created data by a psychological survey of their own device, and the map is presented in the rubric of the “Science” section of the magazine’s website.  The data that was used to inform the visualization, under the name of science, claims to reflect the salient divisions of what “for a country that features the word United so prominently in its name, the U.S. is a pretty fractious place,” as if it might be a more credible set of criteria to ascertain relative depths of fractiousness and their causes–despite its odd metric for measuring “emotional” divisions.

And its interactive features create at least half of the fun for its readers.  The notion of locating diversity in our moods is a lot more appealing than finding it elsewhere; the mirror of the interactive map is no doubt a partial reason for its popularity.  Indeed the invitation to guide oneself to one’s own and one’s nation’s emotions might be hard to pass up, if it suggests quite a lack of complexity in the terrain revealed by introspection, which seems, here, to be equivalent to the completion of a modular form, rather than offering a topography that might be worthy of future qualitative detail.

There is a more authoritative, and perhaps more familiar, map of which the map dissected above might be called the comic repetition.  The study of state-specific variations in happiness (one emotion–that’s a better concept already) was the result of a study based at UVM of geotagged tweets, published in the online journal PLoS ONE, whose tabulators ranked over 10,000 words on a graduated scale to score some millions of tweets across the country, irrespective of their context, to reveal significant differences in sadness and happiness across the nation, perhaps better translating what might be called a set of emotional divides:


Happiness Score in One Map


Indeed, the clear “sadness belt” marked so appropriately in such sombre black hues, and casting a deep shadow over our southern states which curls up to the economically depressed areas of the midwest, suggest something like a meaningful map, with the noting of neat exceptions of particularly happy cities, Asheville and Green Bay.   The weighing of these cities as exceptions lends a credence to the overall distribution of tweets the researchers collated in their data visualization, and the depth of data on which they relied.  The substantive study collated tweets over several years, even tracing computable variations in daily happiness averages that could be mapped to contemporary events, creating a set of stunning data visualizations in this “hedonometric” visualization from 2008 to the present whose units of days are suitably color-coded for weekday, allowing one to register how daily variations are effected by workdays and weekends.  The “hedonometer” seeks to provide the most accurately parsed chart of “happiness” based on daily counts of the tweeted words of happiness–the most common five words of happiness used each day suddenly appear when the day is hovered over.  The  graph is great fun to investigate, and can be tied to news events that impacted the nation’s overall index, from the Newtown shootings to inauguration days or holidays:  note the nation-wide spike on events like Christmas, which, since we still seem to all celebrate or at least note in some fashion, always reliable produces incalculable tweets.

If the first map from Time is a descendant and comedic successor to the UVM map of happiest states, both seem to rehabilitate the paper map in digital form as something like a response to the need for a “GPS for the soul,” an unfortunate mash-up if there ever was one.  Such maps exist in the big data-visualization echo chamber that has dominated our abilities to envision our country.  This echo chamber has existed ever since we came to believe that the country could be meaningfully cut up in meaningful ways for ready consumption.  If it could lie in the easy access to maps and data visualizations, it seems to respond to an unquenchable the thirst for images explaining regional differences that underly such a dichotomously divided status quo, since the division has roots that cannot be purely ideological in nature.

The single spectre that haunts the rise of even the most banal of data visualizations in media news in recent years may be maps of electoral results, especially from the Bush-Kerry 2004 election, in which that large red expanse of the middle of the country created a contrast to a close electoral contest of 296 to 242, which could have been upset by a single state.

Bush 296 - Kerry 242

The map haunted because it was almost repeated in 2008, with a key variation, only to be beaten back in recent years.

Obama:Biden McCain:Palin

These images seem to be seared into viewers’ minds, or at least into the unconscious of data visualizers.  Data of all sorts has since seeped into the map of the contiguous forty-eight.

Of course, the mother of all data-visualization maps is the most spectral, which still resonates with what some still consider the death-toll of democracy that at least one justice has come to regret:


ElectoralCollege2000


The contrast between that map and the popular vote led to something of a polemic exchange that was based on peering into data visualization maps to parse the vote, we might have forgotten, that familiarized everyone with data distributions:


County by County Bush v. Gore


The mapping of the country’s population has gained increased symbolic currency as a sort of transparent rendering of national opinions, only dreamed of in the early days of NORC’s General Social Survey, and far more easily visualized.  The creeping of data into such visualizations of the nation as “America’s Mood Map” has, after all, lent new authority to a visualization both more colorful and less depressing than the dichotomous division of the nation into “Red” and “Blue” states of almost Manichean terms.

And they are also much, much less depressing than the sort of heavy-handed Google Map divisions of the country into those regions that are ready to relinquish pre-K funding or subsidies, an idea that seems to undermine our national interest, as well as of those states that refuse the expansion of Medicaid, all in the name of undue federal influence.  To start with the first, we can view it two ways in news media, but both ways to illustrate the difficulty of ever arriving at consensus:  the below interactive (and informative) map that explores the educational opportunities in the Southern states of the US illuminates differences in pre-K funding (click on the above to explore funding changes in each state from 2009 to 2011, since the color-scheme is not self-evident).


SATELLITE VIEW-PRE-K FUNDING CITS


Below is a far more austere and stark way to visualize the data on how low many states rank kids less than four years of age, in which depression about care for pre-schools increases for the viewer in inverse relation to darkening of states’ hues.

PRE-K US 2005

In the colors of the data visualization blender, where data undermines map, there seems no consensus at all, and a pronounced fraying of the country’s diverse demographic.

One can always cut up the country in different ways, and the preferred way seems less based on splinters than blocks.  But some of the choropleths are striking and scary, as the refusal to expand health subsidies in the American Care Act, to which we’ll return.  The proliferation of these visualizations of difference may arise from the rise of the mythic “sea of red” in the general election of 2000 election through the Obama victory of 2008 may have left us barraged by the cutting up of the nation into camps.  The rise of new data visualizations seek to address these divides, but often seem to lie in the data visualization echo-chamber–as in the case of the “map of emotions”–as much as

But then there are those who reject either the Common Core standards or Affordable Care Act alike as forms of undue federal interference.


REJECTING COMMON CORE


Rejection of the ACA reveals a similar fragmentation, despite some serious number-crunching that went on to illustrate the high proportion of poor, uninsured and low wage-earning residents in may those very same blocks of states:


legend- Poor and Uninsured Americans

8% poor and uninsured

This is an odd echo, as I’ve elsewhere noted, between the very regions which outright refuse government expansion of Medicare and those with lack of insurance and large numbers of low-wage earners and some of the same states that refused to accept clearance by the Dept. of Justice before they changed voting procedures as an instance of undue federal interference.


Clearance Required


It’s nicer just to think that it all boils down to individual moods, which the scientific status of ““America’s Mood Map” nicely parse along clearly defined state-lines–even if its end results may have the scientific status of a mood-ring.  The chromatic variations are at least attractive, and able to be read easily, removed from political dissensus.  And it’s certainly more fun to imagine that we might be able to find a sense of constitutional differences inherent in the atmosphere of a region, and mirrored in lines of state sovereignty, that somehow miraculously reflect an almost Hippocratic sensibility of the shifting humoral constitutions of residents of different climates, rather than political or sociocultural (and socio-economic) differences.

But it’s hard to make any sense of the visualization, largely since the very values that it depicts do not lie on a continuum in the manner of most polls or degrees of gradual difference, but seem qualitatively distinct, and even, often, judgment calls.  The state-by-state map of personal constitutions hearkens back to an early modern notion of how place and season inform the humors, or regional climates color the mind.

It is perhaps not a far stretch to include a data visualization of a state-by-state map of obesity trends (and no doubt diet)–


OBESITY 2010–although such a map seems to isolate the deep south and its southern neighbors from Texarkana to New Mexico.

A vague overlap of data seems to exist similarly sized region, sadly, is plagued by lack of completing High School–although this has little relation to body-size, and there is little evidence of a relation between them, even if it does speak to the difficulty of valuing educational reforms like Common Core.

The difficulties created by “inadequate education” does seem to divide the country, however, as this choropleth reveals, and not only among those able to complete High School, but even in those who, having completed High School education, were not allowed to be part of the Army corps–a truly shocking statistic that effectively does divide the nation.


GRADUATION OF HS


Perhaps the only visualization that communicates unity is one of  cell-phone coverage, which customers, after all, desire–


Verizon-4G-LTE-Map-e1370794274644-540x327


By way of contrast, and a lightening of humors in how our country sees itself, “America’s Mood Map” shows a diversity around that one red block at its center, oddly located at Iowa–and whose deep red oddly seems to signify conventionality and friendliness–a quality the color does not suggest.

America's Mood Map

Other blocks of states are similarly lumped in oddly generic categories of states of mind–states of mind with limited relation to one another.  Hence, California, following, perhaps, conventional stereotype, is both open (if not that extroverted at all, particularly), and the among the least neurotic of the entire bunch.


Open and Un-neurotic California


In the most charitable reading permitted by the aggregation of data, the map would be an exercise in empathetic understanding of one’s neighbors limitations.   If one can permits an excursus, contrast it to the varied topography in the historic early modern “Carte de Tendre,” whose richly varied landscape suggests dangerous sites of delay or lack of clarity that the unaware and unsuspecting traveler may chance across by means of its locally detailed variations.


Carte de Tendre


These elegant enterprising travelers with cockades are gallant explorers of the outdoors, of course, rather than perched behind their screens.  Both the material and metaphorical nature of the data-visualization map are absent:  for in these cartographical transpositions, the data poses irreconcilable and absolute divides, and blocks any consensus from emerging.

“America’s Mood Map” is an artifact that serves as something of a mirror to make sense of our divided polity.  If one can given it a generous reading as an amusement, however, it may merit being taken seriously.  The eerily radical conceit of the data-visualization is not only that we are not “United” at all, but that one can naturalize states’ rights arguments in the radically different constitutions of their inhabitants, as if separate nations:  hence, conscientious Tennessee lies beside irascible Kentucky; open New York nearby to closed New Hampshire, and far from neurotic Maine; agreeable and conscientious North Carolina beside a Virginia that lags behind in both categories.  The authority that data is conceded in this visualization in fact erases mappable divides between rural and urban differences, socioeconomic distinctions, and patterns of wealth or any qualitative detail, taking the blocks of the electoral college as something like a national phrenological map.  The notion of an absolute difference in constitution as lying in direct relation to those state boundaries creates a particularly insidious illusion of differences that essentializes state lines–rather than following the idea of national character–that echoes one of the deepest presuppositions of what might be called Tea Party doctrine.  For the diversity depicted in data visualizations is always one engraved in hues of essentialization, rooting regions dispositions as fixed in a spectrum as different wavelengths, and empties the map of any continuity or local detail with those flat color blocks of distinctly defined individual “moods.”

How are you feeling?

Leave a comment

Filed under America, America's Mood Map, Care de tendre, choropleth maps, data visualizations, Google Maps, Hippocrates, Hippocratic humors, Jeffrey Kluger, MacPaint, mapping national divides, pre-K funding, Red states v. Blue States, Tea Party, Twitter map

Mapping What We Now Weigh

There is little comfort to be taken in the recent announcement that the United States has been overtaken as the world’s nation with the greatest number of obesely overweight citizens by Mexico.   As Mexico collectively surpassed the symbolic statistical benchmark of the 31.8% obesity of citizens in the United States, this was clearly never meant as a cause for self-congratulation about the reduction of our own waist-lines.  The announcement that almost 1/3 of Mexico’s citizens were obese allowed it to surpass the United States among the world’s most over-weight, and also illustrates the rapid success of a model of mass-produced food consumption in a post-NAFTA world where the popularity of fast-food and sugar-laden drinks has dramatically grown south of the border.

The real story behind the story is the relation of how our habits of food consumption have shifted the total body weight of the nation over the past several decades from the mid-1980s–and the much-noted radical changes in percentages of obesity throughout the entire lower forty-eight since 2000 in this dynamically animated time-stop choropleth map, which seems to constitute something of a watershed that opens the floodgates to weight-gain through 2005, in a preview to the drama of over-consumption of edibles narrated in “Supersize Me!”:


obesity-map-GIF-jh.gif

This animated map, generated by the CDC, provides a scary image of the changes using the government’s standard for obesity at a body mass of 30 or over, might be more disorienting than explanatory, but charts a massive shift in Americans’ eating habits.  In displaying those states with citizens whose body mass exceeds 30 or over–a generous benchmark, given that the World Health Organization marks obesity at a BMI of 25–the map charts the changing waistline of a nation over time.
Their expansive standard of obesity in hand, the CDC defined the goal for reducing obesity to 15%, which no state successfully did–even if Colorado came close until 2004–which reveals the difficulty of turning back the trend.  This is not surprising, given the map of world-wide per capita calorie consumption that the World Food Program devised in 2006, anticipating some of the imaginative cartographies of Dr. Benjamin Hennig, which illustrated the bloated caloric intake of the United States, Australia, Canada, and Saudi Arabia.
World Map-Calorie ConsumptionThere is clearly a culture of overeating waiting to be mapped.  But one cannot say the map has a clear cultural origin–so much is it rooted in food purveyors, and a food network of factory farms, as much as economy.  Obesity was recently mapped in 2010 by the World Health Organization for both men and women, in ways surely reflect the local economy, but also show a resistance to obesity, if we can call it that, in areas as Irish or Frenchmen,  although lack of food in Afghanistan contributed to limit average male BMI in that war-zone.
OBese Men 2010--WHO
Although French women are notably less obese, as those in Estonia, women in the United States are revealed by this metric 75% obese–fully two shades of color greater than their Canadian counterparts:
Overweight Females--WHO
The global shift in the prevalence of obesity is strikingly evident in Europe from 2005 among both sexes, here to note only women, taking special note of Italy and Greenland:
WHO Females 2005
The prevalence of obese males in 2005 is less striking in its difference, although German, Austrian, and Croatian males don’t seem slim.
WHO Men Obese 2005
To scratch beneath the surface of these infographics, it might help to ask how folks got that way, or what might be done to better understand the change–as well as to get beyond the limited chromatic variations of the WHO maps.  At last notice, the CDC found that no state in the nation in 2011 was lower than one-fifth, or 20%, with twelve states–including Alabama, Arkansas, Michigan, Mississippi, Missouri, Texas, and South Carolina–the proportion being almost one-third, mirroring both CDC maps of an inappropriately metaphorized “fat belt” and “stroke belt” discerned in the nation in 2011–neither of which provides enough grain to get us far, but which surely packs a punch and gives a shock to our national health-care system.

%22Fat Belt%22 Map.


Scarier, and mirroring eating trends, is the rising obesity among those college-age, and the alarming concentration of an over-50% rate five years ago in Alabama and Mississippi, for what this tells us about the future picture of the nation, this courtesy Miller-McClune:


Obesity in CHildhood MapThe infographic maps unsurprisingly onto the CDC’s mapping of 2010 obesity trends provides a striking picture of the spatial concentration of the obese.
OBESITY 2010

To start to add finer grain and greater questions of causation to the CDC infographics–and to unpack the information that they provide–we might do well to test the correlation to eating habits and with diet.  For a start, we might look at the clever data visualizations based on aggregates that Stephen von Worley devised to chart fast-food preferences nation-wide to interrogate McDonald’s’ market-share monopoly of the fast-food chains that line the nation’s highways.  Starting from a visualization of the continuous United States that plotted the nearest McDonalds from any point in the nation–that reveals at its brightest spots the near ubiquity of a McDonalds restaurant at certain nodes in the country–the brightest lights signify the points of least travel to the Golden Arches in September of 2009.


mcdonalds_us-520x379


As much as providing a new picture of the question of our nation’s actual continuity, von Worley’s slightly tactless visualization raises interesting questions about the options for food available in specific parts of the country, and the possibility to discern clusters along national interstates, from California’s I-5 to route 95 in Florida, or along specific regions, like Long Island and the Chicago area:


Interstate_Highway_plan_October_1,_1970


After winnowing down the over 36,000 restaurants to the eight largest, but to prevent one from outshining the others, von Worley maps the three most dominant fast-food purveyor among eight contenders in different colors across space–McDonald’s (black), Burger King (red), Wendy’s (yellow), Jack-in-the-Box (magenta), Sonic (the Oklahoma-based America’s Drive-In; periwinkle), Diary Queen (cream), Carl’s Junior (green) and Hardee’s (cyan).  Although devised with the intent was to question the market-dominance of McDonalds, von Worley also elegantly illuminated a dense distribution of burger-consumption as national food swamps, and by weighting stores at a 4:2:1 ratio the limited variety that underlie the illusion of a landscape of uniform food-choice:


Steve Whorley's Fast Food Map


The data distribution unsurprisingly overlaps with those states whose inhabitants share a BMI that tends to be supersized, looking at the final frame from the animated colored choropleths above.


OBESITY 2010

As an expert data visualizer if not an artist, von Worley seems aware of these implications, although his upbeat brightly-colored points gives a pop-art aesthetic to spectacular maps of gluts of fast-food chains that hint at stretches of food swamps (where access to prepared foods or processed food outweighs fresh food) across the nation.  Indeed, von Worley started by mapping the total area controlled by fast-food chains, to compare McDonald’s and its competitors, as if to imagine of local resistance to the evil ‘burger force’ that must be overthrown at all costs in an openly Manichean vision of the world of burgerland:


mcdonalds_vs_competitors-520x371


As suggested, von Worley hoped that the growth of the evil empire Ray Kroc could be reversed should competitors join forces against the Big Mac seems wrong headed–rendering here in utopian pastels–that cast Jack-in-the-Box and Wendy’s as Davids to McDonald’s Goliath as a landscape of dayglo colors, where the black of McDonalds presented something of a plague or blotch infecting, as if a cancer, much of New York, western Massachusetts, Vermont, and Chicago.


mcdonalds_vs_allied-520x371


Von Worley wanted to map the degree to which McDonald’s locations are only dominant in the North-East.  But his data visualization is oddly not so concerned about the lack of variety at these stores, or the sort of dietary habits that the map maps.

His recent dedication to measuring the burgerscape, both by taking into account both the distances likely to be traveled for folks to spend money on food to weight places folks are more likely to travel to indulge, and introducing scalable model of market dominance.   The data visualization maps a glut of burger consumption in specific regions that is striking, placing Mississippi in an expanse from Dallas-Fort Worth (upper left cluster) to the Mississippi Delta, where yellow clusters mark Jacksonville, MI, and ports are dotted with fast-food chains.  The burger density is striking, even if von Worley’s chipper aesthetic sensibility belies the glut of consuming all that factory-farmed meat and animal grease:   for the pied pastels of von Worley’s pointillist mapping of fast food locales transmute eating habits to pop art.


beefspace_tx


If it is less artery clogging, also note the flourishing fast-food ecosystem that flourishes across multiple microclimates stretching from Atlanta, Georgia to Charlotte, North Carolina:


Atlanta GA to Charlotte NC


And the visualization of the dense outcroppings of stores that promise a variety–even without noting In-n-Out, A & W, or Taco Bell–suggest the redefinition of the urban foodscape in a city like Phoenix, even if the food-markets in the city are not so dominated by our friend Mickey Dee:


PHoenix


One of the few historically informed maps in van Worley’s visualization of the colorful beefspace so densely clustered in the Southern United States does not concern the mapping of lived space, but a perspective from the moment when the seeds of a new topography of fast-food eating began, which makes one want to extend the animated choropleth back it time to the veritable big-bang of the very beefspace that led to all those brightly colored food swamps:


Big Bang of Beefspace


But, as with any map, one must move from the local to the global: for the real story underlying the effects of sedentarism or over-eating on salty or sugary pseudo-foods is a global one. The FAO recently found that “For the first time, the number of overweight individuals worldwide rivals those who are underweight,” citing the findings of the Worldwatch Institute that measured both at 1.1 billion worldwide; obesity now emerges as a problem equal to malnutrition in ways rarely anticipated earlier.  An “obesity map” of global scale finds a notable jump in obesity rates of 5% in just three years in China, and the startling growth in numbers of obese across sub-Saharan Africa, Colombia, as well as among north African or Middle Eastern women; it places both problems in the very same national spaces:


Obesity %22Map%22

1 Comment

Filed under data visualization, data visualizations, fast food, fat belt, obesity, overeating in America, overweight populations, stroke belt

Infographics in America

If the nineteenth century America has been often described as an era of geographic integration, perhaps no one more than the ambitious statistician Francis Amasa Walker created a new way of seeing the nation that foregrounded both the local differences that continued to divide the nation, but staked out the challenges for integration that the country faced in geographical terms.  His extremely influential 1874 Statistical Atlas, based on the unprecedented 1870 US Census that he directly supervised and made the case before Congress about the undeniable need for funding, whose maps created an image of the challenges of national unity that remained in the republic in the wake of the Civil War in which he had fought:  the Statistical Atlas extends the enterprise of the expanded Census, validating how statistics present a synoptic picture of the political economy–illustrating relations of the local to the polity across continuous United States as if processing part of a mental effort of consolidation.

Even before the unprecedentedly bitter electoral divide of 1876, Walker advanced maps as providing a new way to embody the polity through the visual records derived from statistical aggregates.  Although Walker’s subsequent tabulation of the data on immigrants in the late nineteenth century led him to fear their arrival as threatening the nation’s productivity, based on his perception of the depth of racial differences to the national polity, and encouraged others to do so, he advanced the embodiment of statistics in geographic maps, in ways no doubt influenced by his close collaboration with his father, the economist Amasa Walker.  In ways that prepared a basis for his use of maps to express the contested electoral results of 1876, Walker treated maps as coherent statements about the nation’s divides otherwise not able to be articulated, as a basis to start debate about the well-being of its political economy.  (His maps were so convincing, indeed, in framing a question of geographical organization, that they may have encouraged a narrative of continental integration only recently challenged by investigations into local and regional geographies.)


Walker's Image of the Nation's PopulationMapping Population Density in the US, 1870 (Francis Amasa Walker)


Susan Schulten has recently advanced the quite compelling argument that Walker’s innovations constituted gave the “invention of the infographic” distinctly American roots.  Her argument spoke appositely to the almost obsessive return in recent elections to infographics that suggested the likely tendencies of voters, and indeed often reframed a narrative of division into “red” and “blue” states–and even designated some “purple”–in ways that revealed an undeniable undercurrent that verged on obsession of questions of national unity and division that were of the very sort that Walker had similarly sought to address when he undertook the reformation of the decennial Census in 1869 at an amazingly young age of twenty-nine–no doubt with insight as to the ability to advance and illustrate the distinct distribution of space that the nation occupied.

Even as a staggering proliferation of maps of electoral zones flooded airwaves, newswires and web during the 2012 election, Schulten traced the invention of the American infographic to the innovative visualizations of data and government statics by an enterprising statistical mapper who after working to organize the 1870 Census, not only drew up a comprehensive reform of the census but treated its findings to create a “statistical survey” that came to  embody the nation’s political and economic unity.  While earlier Censuses were strikingly unscientific, Walker advanced issues of political economy in maps as an extension of his expansion of the decennial census, organizing the tabulation of population, agriculture, mortality and manufacturing data on 39 million Americans, and placing prime importance on geographically orienting statistics as tools to better visualize the nature of social and economic divisions after the Civil War in which he had fought and been grievously injured.

Walker’s maps framed the issue of integration in legible fashion–and produced them to allow the fate of the nation’s unity and division to be processed for a wider audience than would have otherwise confronted them–they did so since they readily processed statistics that went far beyond physical phenomena to chart the racial composite by which the national economy could be understood, moving beyond existing models of its physical geology–which he also included in the Statistical Atlas

walker-map-geologyPrinceton University (from Statistical Atlas, 1874)

–to attempts to embody the composition of its human inhabitants whose aggregates were earlier not clearly understood, in what was indeed the first public census to count African Americans who were former slaves as part of the nation’s fabric.

Colored in Aggregate

Colored Populations in the United States (1874) (Courtesy of Princeton University Library)

Walker’s advocacy of such choreographic statistical maps as snapshots of the political economy led to an invitation to join the editorial board of the New York Times–which he declined, probably since he continued publishing in competitors from Scribners’ Monthly to Harpers’ New Monthly, emerging as a public intellectual of originally progressive bent.  For Walker had convinced the US Congress to adopt a variety of projects that used recent lithographic techniques and statistical correlations to use the results of the 1870 US Census map an coherently compelling image of the nation’s situation for public debate.  If all maps reflect both the character and competency of their makers, Walker’s maps reflect the excitement and tenacity of mining data from the Ninth US Census of 1870 that he had compiled with congressional authority, compiling, correlating, and refining the image of the distribution of wealth, illness, and health to a degree that had not ever been earlier achieved.

He engaged in mapmaking in print as a form of public discourse that elevated the statistical map as a tool for envisioning the nation as an aggregate.  Walker’s early involvement with late nineteenth-century newspapers like the Springfield Republican Newspaper as well, from the late 1860s, at the Atlantic Monthly, in fact no doubt encouraged his trust in the power of such organs of public debate–and the power of printed supplements based on the US Census, several of which he published for Harpers’ New Monthly, as well as in Scribner’s Monthly, The Century and North American Quarterly, in ways that no doubt led to his conviction in the infographic as a way to shape public debate on political economy, population density, home servitude, and the working classes.  Walker’s position as Chief of the Bureau of Statistics and Taxes may have helped him use his position as Superintendent of the fifth US Census at just twenty-nine to present the project of the first Statistical Atlas of the country, a project which he expanded in the 1880 Census, whose unprecedented twenty-two volumes collected an even greater range of information than ever previously collated and greatly refined the unscientific nature of previous decennial censuses.

Francis Amasa Walker saw the U.S. Census not only as a way to view populations of states, but to expand the vision of and the likeness of the nation by the more arduous measure of density per square mile, and to then use that image to chart the distribution of the national population as a demographic tool.  He worked with the census to conceive of the map as a measure for mapping complementary sets of data, by mapping relations between density and select quantifiable variables, mapping population density against wealth distribution, literacy, childbirth rates and disease–but not voting preference–in maps that created a legible record of the country, whose public good he convinced the US Congress to fund Atlases in 1872 and 1873.  By transferring statistical observations into a detailed picture of the nation, he began from a base layer of the contours by which its population was distributed, without focussing on jurisdictional bounds, in ways that effectively augmented the independent authority of maps as media of sociological investigation and public communication to an extent that had never before been the case, but established a central place for detailed choropleths in the American Grain.

Walker's Image of the Nation's Population

The maps are stunning choropleths that exploit lithographic techniques to picture the national population in great detail.  Walker started from the initial map of density, using the census of 1870, of which he was superintendent at the age of 29, and whose possibility for converting into cartographical form he seems to have readily perceived.  The plans led to the publication in 1874 of the Census’ data, in an initial atlas that totaled just fifty-six pages, each map of which has a degree of detail never seen as a visual embodiment of the nation, but emphasized its distribution of population and industry to an extent never realized–and, at least among its readership, posited questions of national coherence that concretize concerns for the country’s political economy:

Mapping Density in US

Density of Population in 1870–including African-Americans as well as Whites

For the first time, they also offer a mode to integrate African-American former slaves within a national economy, and posit a detailed, comprehensive and analytic image of population density across the north and south that suggest the value not only of statistics but of imaging the nation and its divisions in a decennial census.  The embodiment of issues formed as Assistant Secretary of the Treasury placed issues of political economy before the eyes of their readers in especially effective ways.
The fine grain of variations provided a new way to look at the nation, as the compelling lithographic choropleths of Alexander Bache, by using line-engraving to chart the population rather than topography as their concern, or coastlines or hydrography, than the shifts that the 1870 census revealed.  If riverine paths were noted, the South looked distinct when one saw the vast “gaps” or absences of population in much of the rural areas of Kentucky, Tennessee, and Georgia, and indeed the concentration of the population most entirely along rivers where agricultural trade grew.
Population Distribution chloropleth
The image of population density dramatically grew in Ohio, Indiana, and Illinois, in ways that charted the new image of the nation, and must have posed questions of how  population density mapped onto the distribution of wealth, or, an extension of it, childbirth rates, in order to refine and better understand the picture of national population it put forth.
Virginia to Georgia Chloropleth

Things got more complicated and more exciting when Walker mapped the distribution of wealth among these densities of population, in ways that helped reveal the uneven distribution of incomes across the post-war nation, and revealed a conspicuous ongoing divide between northern and southern states that related to industry but also to the extreme impoverishment of much of the population in the southern states that would continue to be a contradiction and difficult conundrum in the nation:

Mapping the Distribution of Wealth

The sort of graduated shaded in maps that Walker created provided something of a counter-map to the symbolic uses of mapping as a way to envision national unity, and pinpointed questions of the intractable nature of differentials of wealth.  If pockets of wealth extended deep West into Iowa and Kansas, and lit up Illinois, Ohio, and Pennsylvania in deep auburn hues, the Mason Dixon line was a divide in how wealth was distributed whose light ochre and pockets of white were rarely interrupted by redoubts of wealth, almost entirely along the coast or select segments of the Mississippi River.  His maps adopted the recent precision of mapping population density against its distribution that had been pioneered by Alexander Bache’s compelling visualization of the records of the 1860 Census with the German emmigre engraver Edwin Hergesheimer

The detailed cross-tabulation of population and wealth seems a bit of an odd ancestor of the modern infographic, although their kinship is clearly recognized.  For the image of Walker demanded the sort of detailed attention as a picture of the nation to which the compacting of information or metadata in the range of infographics generated by GIS programs rarely provide.  If Walker anticipated GIS in a fashion, the rapidity of generating the infographic that synthesized metadata with amazing facility and rapidity rarely demands the sort of attention that Walker’s images command.  In part, the lithographic medium habituated viewers to the parsing of refined distinctions in the economic landscape that variations of shading revealed:  the starkest of our blue/red maps with some pink or light blue question marks are removed from the fine-toothed sort of distinctions drawn in the census, or from a similar statistical subtlety.

But the proliferation of the infographic so readily produced and tabulated provides less of a reference tool than an attempt to hold onto the permanence of a snapshot provides within the rapidly shifting and changing landscape that often seems adrift in the electoral sea.  The questions that Walker asked–distribution of wealth, literacy, disease rates–are rarely raised in the infographics we see most frequently, even excepting Fox News’ proclivity for the infographics that perpetuate stark divisions.  The ‘mediazation’ of the modern infographic as a labor saving device not for observers, but whose construction demanded a more limited investment of detailed attention, has created a new assembly-line production of images of limited refinement, whose authority rests on their mapping substrates, rather than on the measurements they mediate and encode.

The limited subtlety of the infographic suggests not only their ideological points, but a shift in what might be called, with the late Michael Baxandall, a “period eye” to express the tastes of interpreting images from media to the viewing map–the habitual practices by which we look to maps in an age of the rapid-fire production of new infographics each day for broad consumption and, also, ratings appeal–or how infographics snappily  process an argument in a bottom-line nature, rather than approach the social topography whose complexities we’d maybe rather not want to detect or explore at close range:

Affordable-Care-Act-1-C5918

Most items that bear the name of infographics might not be data visualizations, or even use the map as a tool to construct the meaning of its contents, since the map is so often and so readily abstracted from the territory. Maybe a map might even suggest what we might want to keep distance from, rather than to consider up-close:

Top Party Schools

These pilfered objects are a bit extreme, but their divorce from any sense of geographic meaning is somehow telling.  Sure, these are something like visual jokes, but they make the point I want to make about the liabilities and deceptiveness that the using maps to organize contemporary infographics reveal that adopt maps to bolster their suasive abilities as much as frame a problem.  The mock-maps–the second based on an episode of Ira Glass’s “This American Life” by E. J. Fox, from a series he titles “This American Infographic”– illustrate the problem of the need that cartographical infographics fill, of both adopting the authority of the map (without containing much geographic information) and of using it to display the ready access to metadata that most images of GPS presume–or, in the most banal but most common case, the weather maps on the Weather Channel–and that most folks expect.  Data-mining becomes replaced by graphic design tools imported from the world of advertising, and the maps are a blunt instrument to make blunt arguments, or present an image of the status quo:  the big parties happen at big state universities.

Maps are especially powerful tools to process information for viewers.   Some less ridiculous examples of infographics reveal some surprisingly similar attempts at using mapping forms or mapping syntax to preserve an illusion of omniscience and often to illuminate or make a comment about national unity.  But they also often use maps in ways that, unlike the maps  derived from government censuses that Walker examined with considerable care to demographic variables, conceals an absence of  analytically meaningful argument.  They treat the map as a form of metadata that reduces analytic specificity–from a map of the “battleground states” that effectively uses a format of mapping in order to suggest either the limited support for the Democratic party in the nation (by using a shade of yellow closer to red than blue) or indicate the deeply flawed nature of the democratic process to their viewers.

Recall the sort of maps that were all the rage when Schulten described Walker’s innovative practice, if you can bear it.  Rather than resting on numeracy or the tabulation of relative measures of difference by a statistical model, the map foregrounds the indeterminate nature of places where polling was within a margin of error, rooted less in mathematical literacy but in pollsters’ relative ability of prediction.  The mediazation of the map is removed from a mathematics of mapping or an expectation of refinement, for it is almost more of a symbolization of a politics of stasis or an electoral divide:

photo

The greater refinement of other maps that shaded “tending towards” in lighter colors foregrounded the unpredictable nature of voters’ preferences, more than the composition of the electorate, as they seem to table the question of national coherence or cohesiveness as a whole other issue.

2012-swing-state-map

In each of these admittedly varied cases, mapping indicates an aura of accuracy or invests a sense of stability in the face of indeterminate data.  The map is a totem by virtue of its processing of information from varied diverse sources, but the map blunts potentially far more precise tools that seem to divide the polity and focusses on electoral results.   The questions of numeracy that divide the nation are less based in a tabulation of data or statistical familiarity; the block-hues of states mute meaning analysis.

Blocks of red in the map seem possible of being emptied of geographic meaning.  One famous FOX infographic purported to identify a strategy for Republican victory, but undermined the very legitimacy of this potential scenario for the attentive few by mislabeling the states it purported to count with accuracy–as well as deceptively reinterpreting polling trends:

%22Western Path%22

The absence of an expectation of reading measurements beyond numerical addition are evident in a map more reminiscent of the refined criteria of a jigsaw puzzle than in puzzling questions of national unity or ideological difference:

electoral colors map

In part, ideological differences are just not that pronounced, and the maps are oriented to processing polling numbers that were changing like a stock-market ticker-tape, rather than providing a firm basis for a national portrait.  But the father of the infographic would most certainly not be pleased.  The adoption and diffusion of mapping forms in infographics provide metadata constructions perhaps most significant for how they quash related questions or discussions, by ordering a massive amount of data whose impression of preponderance is more likely to take away one’s breath than pose a question, and is almost always likely to conceal an argument.

To some extent, of course, the new elevation of infographics is the creation of the new media economy.  There’s an odd dynamic of devaluing of the analytic power of the map at the same time as elevating its explanatory power.  The map, in an age of reduced news content, seems to substitute for the strength of an analytic news story, as a GPS program produces a snappy infographic that seems both content-heavy and a pleasing amuse-bouche.  The need to process different news sources or on-the-ground informants might be both excused and avoided, where we can come up with a symbolic rendering of what happened, even if we don’t need to look so closely at what its causes or its actual ramifications were.  The absence of analytics in the infographic–which presents, as with the weather, the state of things as they are as an actuality that does not need further analysis or attention to local variation–is perhaps its most pernicious feature as a medium.  They stand at a remove from the maps that the great nineteenth century statistical geographer Francis A. Walker so valuably labored to design.

We develop infographics such as the following by crunching some obtainable numbers–in an image that unsurprisingly perhaps uses the residue of a weather map as its base–to tell a story that collapses multiple different narratives into a single set of information that the viewer can quickly process.  The iconic map that was diffused after the last election was less about fault lines or divisions in the nation, than a cartogram of the new image of alliances in the nation, where the entire midwest stood as a block of blue with the Western states:

Final_2008_electoral_cartogram

That is not to say that infographics can tell a subtler story of similarly chorographic proportions, to describe the image of unemployment in 2003, for example in the country:

choropleth of unemployment in US 2003

But at what cost?  Choropleths such as the below seem to remove individual experience from their comprehensive picture–and provide a “big picture” that is actually difficult if  to comprehend for all the metadata they synthesize.  And they present an intractable image of a social divide whose dark bands of dark blue reveal a density of those out of work that only grew by 2008 in the very same areas:

choropleth of unemployment in US 2008

There was a similar crunching of numbers at a remove from individual experience of tragedy in a map of electric outages suffered as a result of Hurricane Sandy, providing a purview of outages from Augusta to Raleigh.  The map is powerful and striking, but also elided the stories of its destructions or narrative of its meteorology with an easy infographic of a sort of least common denominator to everyone can easily relate of the lights going out.

infographic on power outages from Sandy

These maps erase their inhabitants. So what, then, we might ask, is the territory?

The ghost of Walker, and continued prestige of his aesthetics, have led Nathan Yau of Flowing Data to provide a comparable set of visualizations that embody our national territory, based on the ongoing statistical surveys of the American Community Survey of 2010, to “revive” the project of a Statistical Survey in the footsteps of his august predecessor, noting with some evident pain the absence of any plans by the US government’s Census Bureau to produce one after 2000, perhaps due to the high costs of the Census itself–and the recent Republican-led effort to even claim that the decennial Survey is an unconstitutional invasion of privacy–even though it provides the best basis for the apportionment of government funds, and one of the clearest demographic portraits of the country–that tarred the survey in no uncertain terms as “intrud[ing] on people’s lives, just like the Environmental Protection Agency or the bank regulators,” according to Daniel Webster, an inspiringly named first-term Republican congressman from Florida, who questioned the random nature of the survey as illustrating its “unscientific” value, despite its assessment of over three million American households in considerable demographic detail about their occupations, housing, literacy, languages spoken at home and at work, and levels of education, as well as their approximate computer use.

Perhaps with some premonition of the dangers of resting our democracy on the thin infographics consumed by watchers of television news, the self-published Survey Yau published online imitated the august elegance and clarity of Walker’s maps to point up the absence of needed visualization of the data that the Census compiles.  The images–able to be bought individually as posters–suggest the deep presence of Walker’s idiom of visualization within our current media circus, when the proliferation of news maps from various outlets and Graphics Depts. seem dislodged from the interest of the public good.  Yau’s project was may seem to have obviated need for an impartial assessment of all the data that the Census compiled.  Indeed, while the Times, which once offered Walker a seat on its editorial board, created a brilliantly colored set of interactive visualizations based on data from 2005-9, Yau offered nostalgic images that embodied the images of the nation that the government has puzzlingly withheld, with climatological and agricultural data that provide a similarly detailed atlas of the coterminous United States which, in an age overflowing with data visualizations, remind us of the need to preserve a picture of the nation to ensure we keep the public informed.

Yau

FlowingData

The detail of the maps, set in a sepia background with shadings that somewhat approximate the exacting palette of Hergesheimer’s half-tones, provide a set of gradations of population as revealed in the data of the 2013 ACS,

population-density

FlowingData

Or, to depart from the demographic and verge into the statistics of the environment, the distribution of levels of rainfall,

weather-rain

FlowingData

wetlands
water-landcover-wetlands1FlowingData

or landcover:

landcover-forest1

The data waits to be visualized, and the simple monocular visualizations capture its complexion with quite understated elegance.  While less rooted in concerns of political economy, the visualization hearkens back to a unified choreography that we often seem to lack–even if it only pictures tornadoes–in ways that go beyond the existential qualities of weather maps as records of the present day.

Tornadoes

FlowingData

To be sure, the political economy of the nation has become so fragmented that it is hard to visualize by such clearcut lines or shadings, even though the Times’ visualization of the American Community Survey similarly uses the map as a surface on which to throw the composition of the nation–and the nation’s cities–into relief, here drawing on the Survey to present the complexity of the population of an actually quite segregated New York:

ACS 2005?

from New York Times–“Mapping America: Every City, Every Block

Should such mages serve to whet your appetite for better visualizations that embody an accurate image of the nation, folks based in the Bay Area might want to check out how the students at UC Berkeley’s I-School stack up against Fox News, Huffington Post, the New York Times, and even Francis A. Walker, by looking at the results that are now showcased at http://www.ischool.berkeley.edu/newsandevents/events/finalprojects2013.  (The website promises to present recent graphic charts of Changing BehaviorsEnhancing Information Systems, and Information Organization and Tools that have been refined over the last three years.)

Leave a comment

Filed under data visualizations, GIS, infographics, political economy, statistics