Mapping Armageddon Again?

The rush to make a graphic point by mistakenly overlaying concentric circles atop a Web Mercator projection helps to render increasing fears of the range of North Korea’s powerful ballistic missiles.  As much as suggest the global import of the confrontation about North Korean missiles through their violent potential to target overseas lands, the effect is to abstract the peculiar stand-ff of a divided country that is a remnant disfigured by the Cold War as if it can be isolated from the division of the peninsula, and viewed as a focus of global attention.  But is the isolation of North Korea that they effectively underscore in such cartographically dramatic terms also not a cause for concern?  How can the intentions of the opaque government of Pyongyang even be understood save in a close focus on the local dynamics of the Korean peninsula?  If North Korea is increasingly effectively a proxy of China–cast as an enabler of the North Korean state, together with Russia–the country is shown, isolated, as if the Democratic Peoples’ Republic of Korea, DPRK, were the last remaining  theater for conducting the cold war in a post-Cold War world.  A familiar geography of generals suddenly migrated to the media as the confrontation with North Korea was begun to be processed in maps.

The current migration of this mapping of a global vision of generals to the media presents a problem of the survival of a mental imaginary, able to compromise the pragmatics of a real problem of international relations in dangerous ways.  For by magnifying the isolation and marginality of the DPRK in relation to the globe, the maps urge us to focus on the risks that the development of intercontinental missiles pose to world peace.  To be sure, they also risk reflecting the very barbed rhetoric of triumphalism and destruction of Pyongyang–a regime that has expressed its eagerness to deliver prophesies of “a merciless sledgehammer blow to U.S. imperialists.”   The threats of Kim Jong-un are especially embodied by the creation and possession of his country, for the first time, of Intercontinental Ballistic Missile, and seems to create a narrative less motivated by actual actors, but a drama of atomic, nuclear, or ICBM strikes that is driven by disembodied geopolitical exigencies in a political theater that we don’t know where it will end, but ramps up an all too familiar cartography of fear.

These maps resurrect and resonate with the invocation of previous threats of war during the Cold War–when the fear of atomic attack was widely diffused by the U.S. Government as a basis to justify an arms race.  Indeed, by rehabilitating a Cold War imaginary of impending conflict able to escalate into nuclear war, maps seem to activate a similar mental imaginary of polarity–albeit disproportionate one, between North Korea and the United States–that reflect one of the few areas in the world where that rhetoric is still alive of identifying the role of the state in promoting nuclear war–leading Kim to praise the “thermonuclear weapon with super explosive power” as made entirely “”by our own efforts and technology and designed to exceed the atomic bomb dropped at Hiroshima.  In this context,  the fear of a “global threat” can be rehabilitated as destabilizing global balances of power.

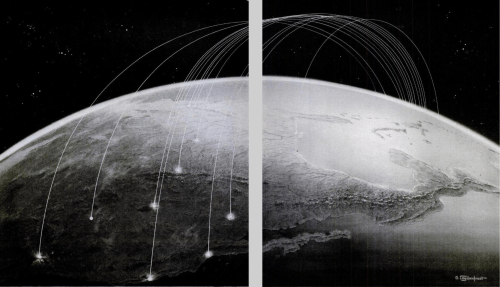
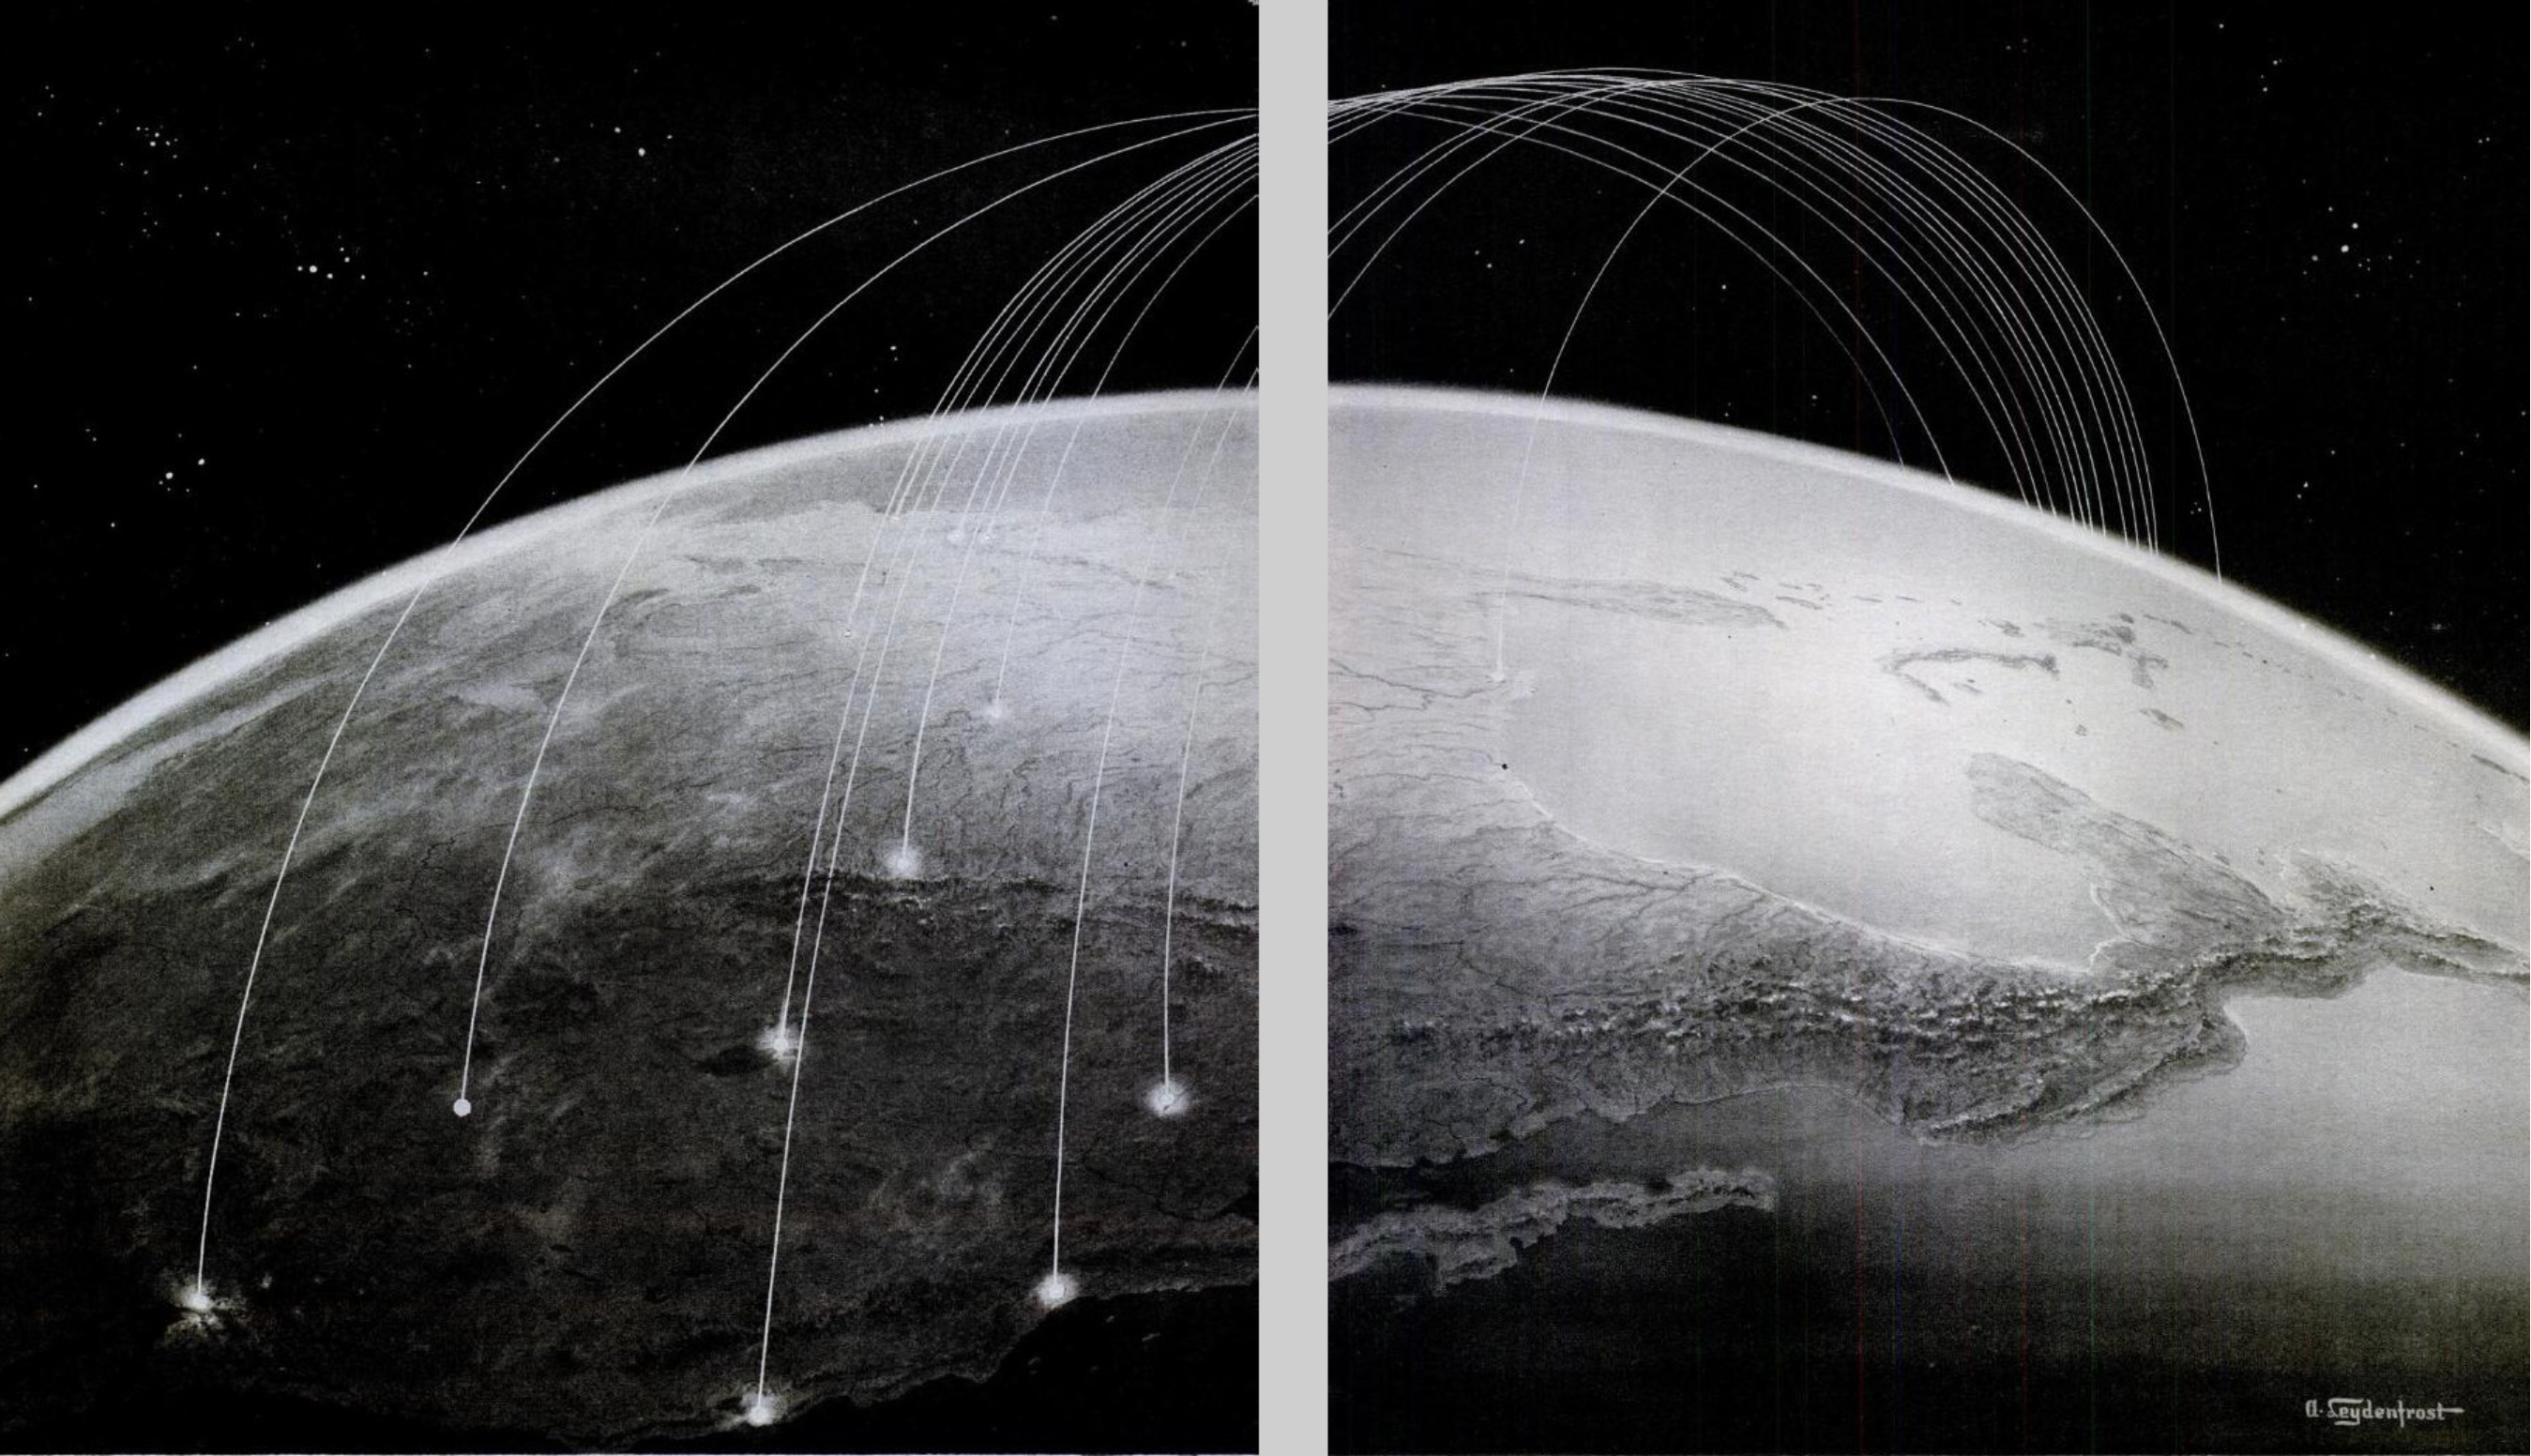
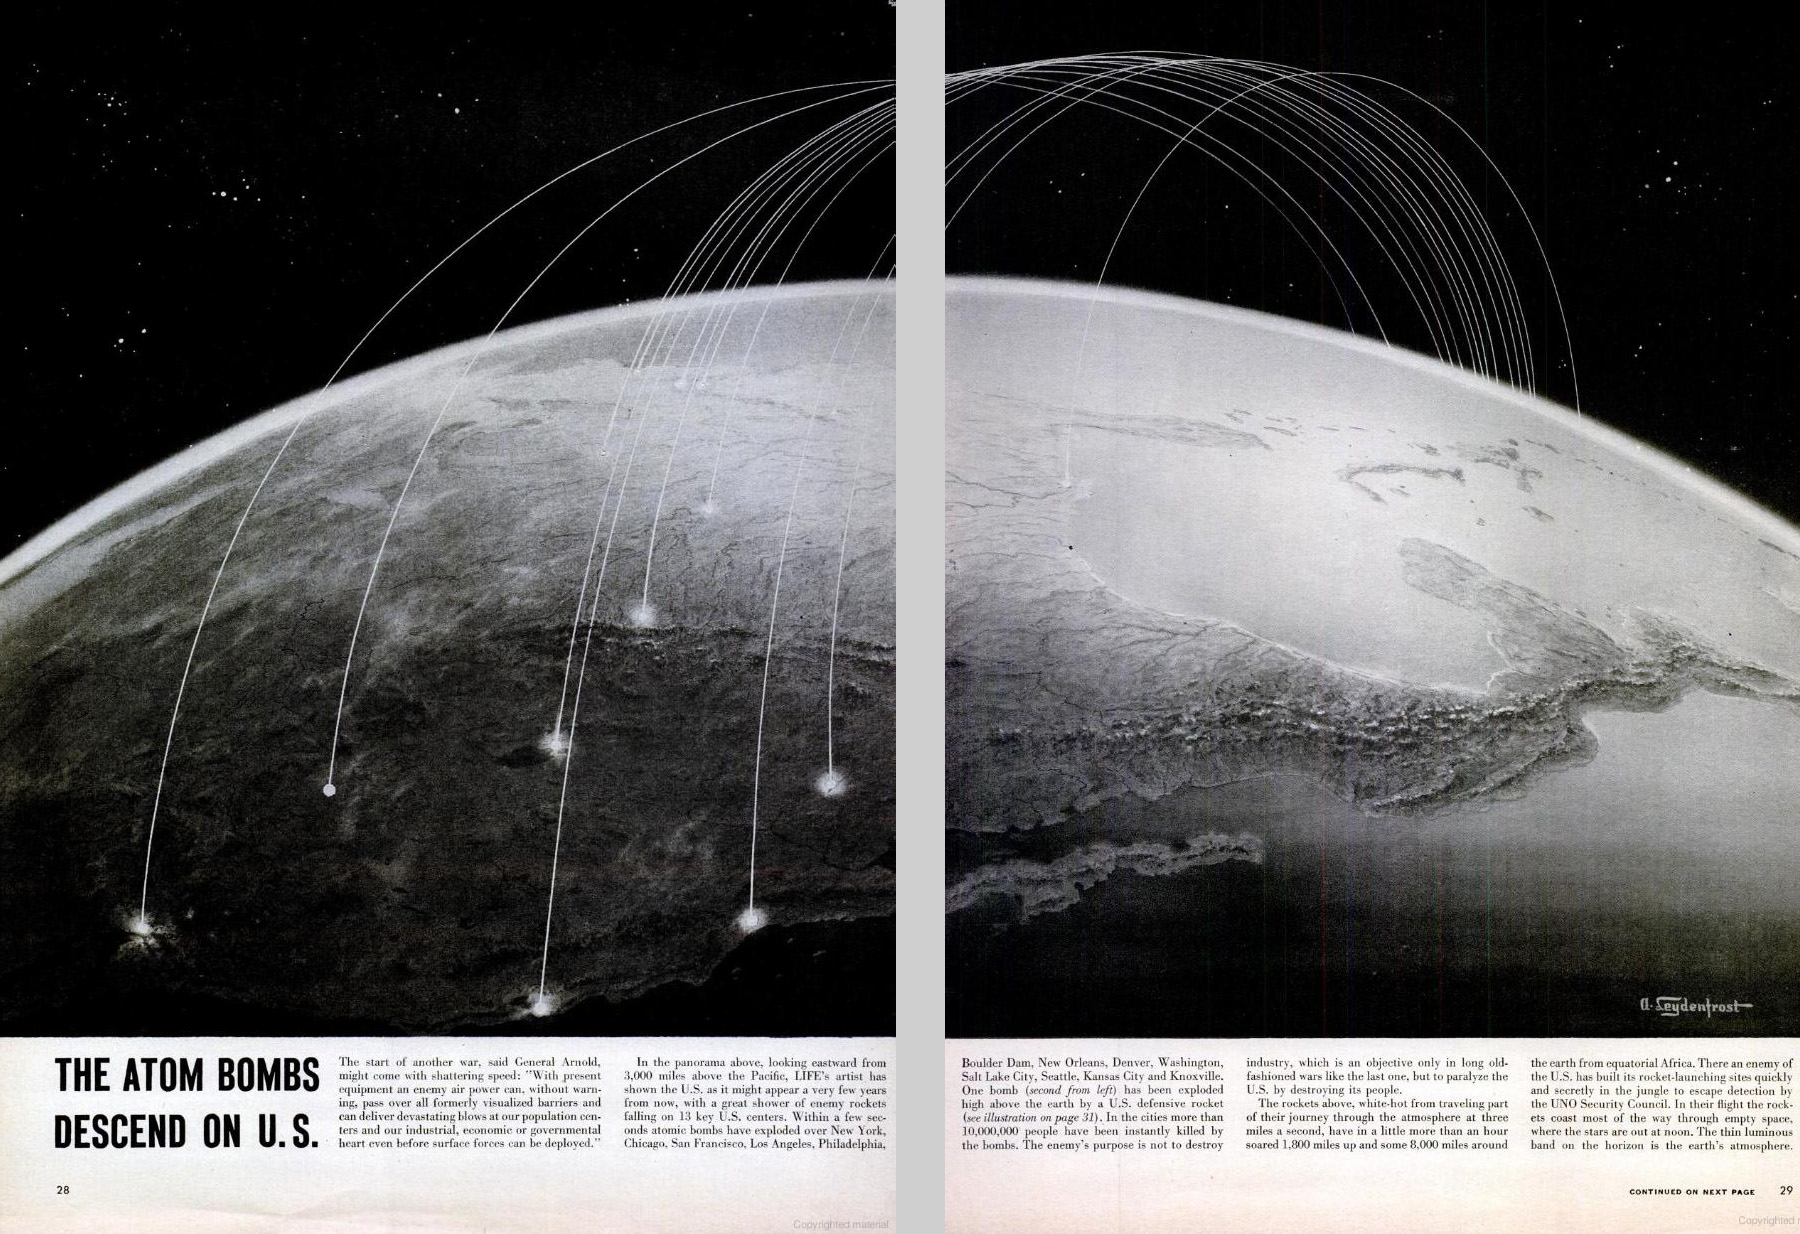
The first scenario of an attack on the United States–cast in fearful and unresolved terms–was diffused in terrifying detail shortly after the bombing of Hiroshima and Nagasaki in 1945, as if in a surge of guilt, by the emigre Hungarian graphic artist Aleksander Leydenfrost, in a bifold spread that appeared in the extremely popular Life magazine, perhaps asking readers to feel a sense of guilt at the destruction caused by dropping two powerful atomic bombs in the Pacific theater of war, that illustrated a memorandum that the commander of the Air Force in the Pacific Theater, Harold “Hap” Arnold, in a “Report to the Army” he wrote in the late summer of 1945.  Arnold cautioned against the next war as an episode that would last but thirty-six hours, and for which the United States military must begin to prepare itself, if not to confront the unprecedented scale of destruction that the United States landscape–which war had of course not touched, thankfully–must now take time to prepare itself to face.  And the sustained campaign of firebombing Japanese cities after the massive destruction of the second atomic bomb, Fat Man, that was roapped on the port city of Nagasaki unleashed a level of violence that had followed the instant incineration in that city alone of 70,000 had created a landscape of destruction that Leydenfrost’s somber image led Americans to imagine as inflicted on the major cities of the United States, not by the delivery of airborne bombs but the arrival of intercontinental ballistic missiles–what we now call ICBM’s–launched without pilots, akin to German V-2 rockets, but able to reach across the Atlantic, in ways that would redefine what we know as a “theater of war” in globalized terms for the first time.  The nightmare of unmanned missiles, viewed from the empyrean heights above the Pacific, seemed to seek o terrify viewers to suggest how quickly and silently an attack could arrive.


Atom Bombs Descend on US LIFE 1945


The resurrection of what might be called a map designed by generals such as Harold “Hap” Arnold filled a new need to map the power of destruction that the atom bomb unleashed, and represented both a sort of spin as well as a notion of the stewardship of public debate.  Arnold wrote in a context where seemingly responsible “scientific men” were entrusted by the US government to explain to the public the scope of the horrific new power that the atomic bomb unleashed, and to rationalize the devastation of the total destruction of a city destroyed to devastating effects unprecedented in their violence as a decision of the nation, men like James Conant or Vannevar Bush, trusted to create consensus about the use of atomic bombs and the pragmatic basis for atomic policy in a postwar world, at the same time as the popular press quickly predicted the conduct of future wars which minimized all human agency, and perhaps responsibility, by pilotless “robot planes” able to span transoceanic distances and increase the vulnerability of all American cities and industry in the very manner of Japan from a “hail of atomic charges” in 1945.

Leydenfrost’s image, designed for a public announcement of Arnold’s letter, captured this anxiety.   It reveals, in a futuristic manner akin to H.G. Wells or recent science fiction, how close to the surface it was as an image of future destruction, able to be harnessed for clear ends as a narrative of imminent fear, even if one that lacked any clear narrative finality as a story which we could ever see as having clear winners.  The  “revolution in warfare” Conant detected after the destruction of Hiroshima and obliteration of many of the buildings of Nagasaki brought strategies of management of threats in a new global imaginary.  Conant quickly acknowledged that there was no real possibility of defense against such a “surprise attack by atomic bombs,” as he dryly put it.  Yet the government tried to reorient attention to the immediate problem of survival of the fearful eventuality of an atomic attack.  “We are living in a very different world since the explosion of the A-bomb,” Conant began, addressing the problem of what could be done in the event “much of our present civilization” was threatened with extinction.   Conant pondered with incredible detachment pondered how “much of our present civilization” was threatened after Hiroshima and Nagasaki, nd to contemplate ways to save the achievements of the United States against such imminent destruction by buried repositories of microfilm,–as if such a parallel responsibility were adequate to the development of the atom bomb.  In contrast, Arnold’s “Report to the Army” emphasized the need of responding to a remote atomic strike in ways that created an image of vulnerability to missile strikes that quickly burned into our collective unconscious.  Its inheritance might well be reexamined in the light of the fears of global threat of strike from North Korea that has emerged in the very first months of the Presidential administration of Donald J. Trump.

The power of the ICBM warheads that North Korea has developed have, rather eerily, just achieved the level of power of the atom bomb dropped on Hiroshima, enabling exactly the sort of scenario Aleksander Leydenfrost, no doubt with editorial help, was able to so concretely map from a position over the Pacific, which oddly renders North America as an island-like target, as if it could echoe the many flights of United States bombers over Japan.  These unmanned rockets, shot from an unspecified country in Africa where the rocket launchers of a nemesis were placed, described the phantasm of the or mental image of the next stage in warfare, rather than an actual map.  But the concreteness of the map allowed readers to envision the proximity of a potential strike in particularly powerful ways.  And they have been triggered again in the azimuthal equidistant projections that project North Korea at their center, and map the ability of powerful missiles to strike the more populated cities of the United States.

Bull's Eye Range

1. Although graphics that render the potentiality of newly powerful missiles developed by Pyongyang  work to grab viewers’ attention, they draw attention to the danger of North Korea as if from a general’s point of view.  The rush to map the striking range of North Korean missiles, as in the header to this post, often were created by overlays so quickly to perpetuate a sense of a flat earth–particularly embarrassing in an age of web-based maps and spatial tracking.  The egregious mis-mapping of a nuclear threat occasioned a volley of objections to the distortions of maps that foreground their danger, and the innocent position of many who are endangered by their missiles, while mismapping their true range.  In order to come to terms with the global  import of Korea’s generation of ballistic missiles’ of ever greater striking range, web Mercator may irresponsibly effectively shrink the distances missiles travel, with geopolitical consequences, but the mapping of the range of missiles privileges a narrative of overweening nuclear ambitions and aggressive acts that runs the risk of magnifying the military threat posed by Pyongyang, and giving an opportunity for Kim Jong-un to magnify his own sense of grandiosity on a global stage, even in ways that seek to justify the need for a pre-emptive military strike against a North Korean threat.  The focus on the hypothetical expansion of missile range and the eagerness to trumpet the new status of North Korean military as able to launch an intercontinental ballistic missile and nuclear strike–long desired by Pyongyang as a sort of metric of global respectability and renown–is a danger but one that repeated exaggerated mipmapping can only magnify.

For in suggesting the blameless nature of other nations before this threat, they direct focus on the aberrant nature of North Korea and its leaders as needing to be contained, and many indeed justify the importance of a “preventive” pre-emptive nuclear strike.  The maps open a possibility of alternative narratives, some particularly deadly and undesirable in the extreme, of an immediate launch of warheads not only at American military stationed in South Korea, Japan (especially in Okinawa) or Guam but at the United States as as never before.  Indeed, the public statements and postures that Kim Jong-un is “begging for war” seems to map the need for a nuclear confrontation, filled with the frustrated saber-rattling that while “war is never something the United States wants” the “outrageous” testing of a hydrogen bomb only tests its “limited” patience, as North Korea vows its ability to perform a “surprise launch of an ICBM in any place and region at any time,” seeking to prove that “the whole US mainland is within the firing range of DPRK missiles,” as the national news agency KCNA has affirmed.

The recent explosion of a bomb with the explosive power of the atomic bomb dropped on Hiroshima by North Korea on the eve its independence celebration provides an illustration of Kim Jong-un’s leadership, even if it is doubted that what seems a thermonuclear device would be able to be attached to a ballistic missile with any reliability.  But the expansion of maps of intercontinental range in the global press seems to magnify the threat of immanent attack or aggression from North Korea, as if in a presence to justify what would be an utterly irresponsible decision to launch a military exercise of any limited sort.  All too widely reproduced images of the growing range of North Korean missile strikes create an all too real cartography of fear that seem to escalate the danger of a threat and the need for an aggressive military response.

As the actions of Pyongyang have been repeatedly cast as a “global threat” by the Trump administration, from Steven Miller to  Rex Tillerson, provoking not so veiled threats of the need to respond with a “precision strike” missiles into nearby waters off the east coast of the peninsula or to strike at the missile test sites, maps of the n this game shifting estimates of the outermost reaches of NK missile strikes by the Democratic People’s Republic of North Korea have provided something of a basis to reveal exactly what the states of that provocation would be and proof of the global threat that North Korea’s missile pose over the unsuspecting and innocent inhabitants of multiple continents.  Although the outermost reach of the radius of missile firing is openly acknowledged in the BBC graphic below to be not operational, the claims to have created an ICBM able of intercontinental strikes would place North Korean arms far closer to the United States citizens–as well as to United sates troops stationed in South Korea or Guam–in ways that have been a long aspiration of North Korean governments.


The new justifications of nuclear attack in the aftermath of the apparent explosion of a hydrogen bomb by Pyongyang–and the unrestrained bullying of the North Koreans that “they only understand one thing!”–have pushed the problem of military confrontation to the front pages, with Trump warning of the possibility of a “massive military response” and suggesting if not indeed mapping a targeted nuclear strike of North Korea’s nuclear and missiles sites, as if their destruction could occur without any harm to the world.  The threat that Kim Jong-un poses is being cast as a potentially aggressive act–needing to be met with immediate and massive force–even without mapping what his intentions or strategy–as the explosion of a fusion bomb of comparable size to that dropped on Hiroshima is increasingly mapped as a potentially aggressive strike on American cities.  The appearance of these charts in the global media no doubt give huge satisfaction to Kim Jong-un, whose dream of seeing his nation as a global power has been realized, as his country suddenly occupies the position of a major threat that the Soviet Union, no less, had occupied in the Cold War.

Indeed, as President Trump responds to questions of his military intentions with North Korea with a shrug intended to be menacing–“We’ll see!”–in a particularly troubling lack of restraint, he seems to be inviting audiences to map the danger signs emanating from North Korea, rather than to establish the security of his own political restraint, by perpetuating myths of the aggressive nature of North Korea.  As headlines such as “North Korea Raises the Stakes” have repeated since early July, if not from the first announcement of improving missile technology to complete the construction of an actual ICBM–intercontinental missile–of the sort it has long sought, as if to escape its isolated status, even as South Korea cautioned a proclivity for overstatement of achievement of re-entry technologies, the tenor of recent claims that North Korea raises the stakes may have shifted the metaphor of this test of wills from over thought moves in a game of chess to a contest of truth or dare or to a global game of Russian roulette.


2.  Although the maps raise red alarms as they show long-range missiles able to strike the United States, the rush to use a tool plagued with distortions on a global scale is bound to create distortions or suggest the persistence to flat-earth thinking, rather than warp the striking range to acknowledge the spatial distortions of the earth’s surface within theMercator projection.  But the readiness to map the ranges of newly tested missiles–and even missiles in development–suggest a rush to affirm a “direct threat to the United States”–as former CIA analyst Bruce Klingner puts it–that threaten to extend the missile range of missiles in development to beyond 13,000 km, which would place the entire United States within its striking range and endanger all who live in the expanded radius.  In facing such often unsourced if impressive figures deriving from Japanese news outlets or South Korea, the interests of the maps that derive from such figures demand critical review; ties alleged between military contractors and agencies that create such maps not only terrify, but trigger a powerful memory theater of rapid strikes of an increasingly broad array of long-range missiles, reminiscent of a cartography of fear tracking missiles’ arrival in United States territory from the  Cold War.

As North Korea continues to profess  commitment to a nuclear deterrent in the face of American bases in South Korea and Guam, charging “persistent moves to launch a nuclear war on the Korean peninsula,” and indeed the precareity of North Korea to American strikes, many visualizations of the growth based on fired missiles public South Korean statements provide a basis to foreground global tensions with an alleged objectivity that invest missiles’ striking range with an unprecedented of accuracy.  They may lack such accuracy–despite their imminent danger–but the cartography of fear that they create surely seems to escalate their threat and the rapidity of their possible arrival–even if they may well exaggerate the likelihood of their striking range, without noting how operational even the most recent Hwasong-12 medium long-range missile is.


4911e8e09afe2d26cf64865bae00f322-2.png

April 26, 2017


3.  But in mapping the extent of such “striking range” to cover most–or indeed almost all–of the United States, such graphics manufacture an all too real danger by cartographic artifice alone, given the range of missile strikes a reality that they may well not be able to achieve in terms of either atmospheric re-entry or precision targeting, although this is an objection which we surely don’t want to have to test to find out.

The implied danger of provoking such a strike–or allowing such a strike not to be defended against–has in fact undoubtedly interested the Heritage Foundation, a conservative educational institution once prominent in setting the agenda for the nation in the Reagan administration, and now eager to bill itself again as an institution able to “transform America” by being at the forefront of conservative thinking, from the curtailing of “excessive” environmental regulations, to the use of tax reform to “grow” the economy, to the end of universal health insurance, to the distribution of military gear to local police.  The interest of increasing the military budget in the Trump years is promoted through the mapping of an impending and immanent nuclear threat from North Korea–


HeritageNorthKorea.pngFebruary 11 and 16, 2016; December 2, 2016


–that is abstracted from the military presence of the United States in the Korean peninsula, or indeed the political dynamics of the peninsula itself and the region, in particularly dangerous and short-sighted ways.  The notions of a nuclear terror that such images accentuate–ignoring the question of whenter such missiles are perpetuate all too familiar  narratives of the victimhood of those whose lives are endangered by the growing reach of bombs are particularly canny in their use of the objective rhetoric of cartography to make an unsubtle point, and suggest a sense of inevitability in the expanding ranges that North Korean missiles are able to target cities.  The sense of such strikes–and the narratives of inevitability and a needed response that they trigger–have a long history, even if they are meant to describe actualities.  For they have worked to help rationalize such a pre-emptive nuclear strike, as FOX experts speculated if “it may be time for a preemptive strike” if America should “risk Los Angeles,” imagining the waves of regret if a missile approaching the United States should a missile interceptors located at US bases not work in the thirty minutes before it arrives, in a landscape we have seen evoked before.

It did not, in fact, take long at all from the dropping of atomic bombs on Hiroshima and Nagasaki for the General leading the American Air Force to imagine the new landscape of mutually assured destruction that defined the landscape of fear of the Cold War.   Even though intercontinental ballistic missiles did not yet exist, save as imagined threats, or on the drawing board, the vision of strike from atom bombs arriving from overseas was presented an immediate fear to Americans, and enlisted as a compelling basis for justifying the expansion of the post-war military budget–and even equipping the nation with underground silos for storing and firing missiles able to respond to impending missile attacks.  Within months after the destruction of Hiroshima and Nagasaki, when the ICBM’s that haunt the current global landscape–Intercontinental Ballistic Missiles–did not actually exist, save as imagined threats, the powerful images of destruction in what was assured to be a coming “Thirty-Six Hour War” begun by atomic bombs descending on the United States engraved a fearsome image of the danger of the first unprovoked first strike of the atomic age.

The mapping of an atomic threat to the United States invited Americans to envision the possibility of attack.  A similar spatial imaginary seems, indeed, resurgent in the nuclear standoff with North Korea, cannot help but recall the imminent arrival of those arcs of already fired atomic warheads or bombs, which smoothly move toward American cities through the night sky to target an unsuspecting population lying in bed at night, even if the projections of missile ranges of the missiles being tested by the North Korean army and their leader, Kim Jong-un, do not arc so elegantly over a landscape.  The same landscape haunts both images.  If the escalation of tensions between North Korea–N.K.–and the U.S. is mapped to process the threat of the increasing power of rockets carrying nuclear warheads, the maps advance threats of a nuclear strike on the United States in the header to this post that mirror those designed to instill panic and escalate defenses shortly after World War II, and are an odd throwback to the Cold War imaginary.  But it seems to have reignited a Cold War imagery of threatened attacks on cities of North America, all too reminiscent of Cold War maps of missile range strikes.


While it is terrifying to not know the intentions of Pyongyang, or the ever-smiling Kim Jong-un, the image of a Cold War spatial imaginary seems to mediate Donald Trump’s geopolitics, and the increased fear that Trump may not disavow a nuclear first strike, not so long ago condemned by Republicans as revealing liberal naiveté on issues of national defense–even if agreement against first-use of nuclear arms has been broad world-wide and recently won broad endorsement as a needed means of controlling nuclear weapons.  It is important to note that the map of impending missile strikes far more conditioned the United States than the North Korean government’s response.  But the spatial imaginary of missile threats has helped enable a rhetoric of confrontation and saber-rattling that Donald Trump has enjoyed effectively conjuring the threat of an immanent nuclear conflict more than Pyongyang, although the sense that an over-sensitive North Korea was only saber rattling may have been overestimated.  The odd symbolic form used for mapping of the range of NK missiles as a target centered on Pyongyang in public media sources, however, keyed o the Nodong, Taepodong-1, Musudan, and Taepodong-2 missiles, suggests the two-fold message of such maps, even more than the maps from Graphiq, which similarly placed Alaska in rapid striking range.

Bull's Eye Range

Although these maps tend to fail to distinguish clearly between missiles that have been observed or are in development–as most of the ICBM’s capable of striking the United States were believed to be–the range of US military bases within striking distance of NK missiles are both increasingly aggressive, and seem almost desperate attempts to come to terms with the rapid growth of their rockets’ power.   Images that hypothesize the expanded ranges of rockets register the shock of North Korea’s creation of intercontinental missiles and process fears of impending missile strikes from its expanded nuclear arsenal.  Such fears were of course foregrounded in North Korean media’s showcasing of Kim Jong-un’s apparent delight in the use of maps to suggest the range of those missiles he has developed at considerable sacrifices for his country–


kim-jong-un-north-korea-missile-nuclear-icbm-planet-satellite
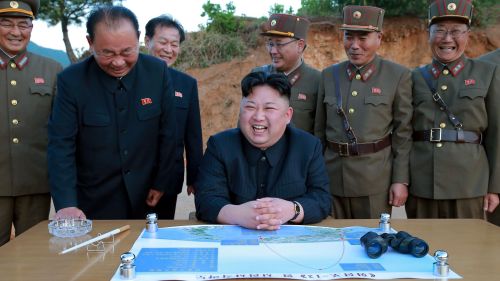
Kim Jong-un studying the flight of the Hwasong-12, which reached an altitude of 1,312 feet Reuters/KCNA  (May 14, 2017)

Continue reading

Leave a comment

Filed under arms control, ballistic missiles, Donald Trump, North Korea, nuclear threat

The Earth of Nvogorod

Nvogorod [is] the village where my grandparents were from in Belarus,” Jared Kushner clarified on the eight page of 11-page of testimony he provided to the U.S. Senate, intending to reference Novgorod, off the Volga, but not following Belarusian geography or Kushner family history.  when he sat down with the head of the Russian state investment bank that had funded many state projects, to “help advance the President’s foreign policy goals” in a half-hour meeting perhaps designed to open the secret back-channel between the incoming Trump administration with the Kremlin many suspected both Trump and Putin had desired. Gorkov is a banker, but had studied in the arm of the intelligence agency of the Soviet Union, like Putin, and was suspected to have been a trusted agent to Putin–as well as to be seeking to address the sanctions that were imposed on the bank since the invasion of Ukraine. Gorkov said meeting with foreign companies–not governments!–was “normal practice” for an officer of Vnesheconombank, without mentioning the Ukraine, but he hoped to talk to Kushner as a businessman, stressing a business angle outside diplomatic contacts between foreign ministers; his ties to security services made him precisely the sort of individual entrusted for delicate tasks of a personalized government, as it had led Putin to appoint him to run a state bank tasked with financially funding many of his own personal pet projects.

The sort of kinship that the donation of earth Gorkov carried to New York seemed a way to forge a human tie to Kushner, and to suggest something like an odd token of fealty–although it does not seem that Kushner got it. But the sense of a tie to the earth akin to the ties that Russia had long claimed to Ukraine, seemed an odd sort of argument about the ties to land the Russian government felt to the area of the Crimea in Ukraine, and the pro-Russian separatist factions in Ukraine that Moscow has supported since 2014, and Putin hoped that Trump would recognize as a part of Russian territory. If Kushner sought to minimize the stakes of the half-hour meeting by describing the exchange of trinkets and tokens like a bag of dirt, the gift symbolized questions of territoriality and Russian rights to Crimea–to personalize a territorial conflict that led the European Union to target Russian energy, defense, and finance sectors, but which insider ties to Kushner–and Trump’s White House–might help smooth.

Tattered Ukraine Flag Planted in Contested Earth

It is no surprise Russia wanted to shift from a topic of international debate to an internal issue of administering domestic affairs, asserting irredentist ties to the region settled by Peter the Great, by securing a personal and confidential contact to Trump’s team before it assumed government power.

So why the dirt from Novgorod on the heels of the 2016 election? It seemed a personal touch, if one that Kushner didn’t get, and that Gorkov seemed to have aimed fairly low as a way to present a token of opening a personal tie to the son-in-law Trump clearly trusted. Perhaps the most amazing aspect of the gift is how openly Kushner didn’t get it–and the land of Crimea that Gorkhov probably wanted to personalize as a part of Russian lands Putin had only sought to restore to his country in a rightful manner might conceal the 1.6 million internally displaced that the aggression into Ukraine had produced, and the conservative estimate of over 10,000 civilian and military casualties, and almost 24,000 injured, as it entered its fourth year.

In concealing the personalization of a major foreign policy initiative, by dismissing the presentation of a “bag of dirt” Kushner may have foregrounded the highly personal nature of the back-channel of foreign policy–the meeting was set up by the Russian Ambassador Sergey Kislyak, who had ties to several members of the Trump administration in waiting. Donald J. Trump administration has continued to pressure Russia over its involvement eastern Ukraine. Although the United States, soon after Trump’s inauguration, in fact imposed new sanctions that Russian called tantamount to a “trade war” on nine companies and twenty-one individuals tied to Russia’s occupation and annexation of Eastern Ukraine, engineered by Rex Tillerson and Kurt Volker, Special Representative for Ukraine Negotiations, and approve sales of anti-tank weapons to Ukraine in 2018, Gorkhov seemed eager to open a personal contact with Kushner between businessmen, parallel to American national interests. Was the bag of earth and art from “Nvogorod”

Might Jared Kushner have mis-remembered his ties to a Russian region where Charles, his father, regularly took the kids–suggesting that it was Novgorod? The bag of dirt might seem a link that Putin or Gorkhov wanted to consolidate, and probably brought from Belarus, but the suggestion of the strength of regional ties to a region in Russia’s sphere of influence, who also hoped to develop close ties to the United States. It arrived beside “a piece of art from Nvogorod, the village where my grandparents were from in Belarus,” although the ideas of this being a tie of affectionate remembrance is contrived. Oddly, displacement, death, and invasions would have been told in the dirt that Gorkhov sought to present to Kushner, could well have evoked the city from which Kushner’s grandparents were in fact refugees, albeit because they had fought as partisans in Belorussia against Nazi invaders–now the nation of Belarus. In describing an ancient Russian city, long part of Lithuania, that was residence for many Jews, Kushner revealed his hazy purchase on a site dear to his father Charles, whose parents had once been members of the city’s large Jewish community from the Pale of Settlement, where Jews were granted permanent residency in a region imagined fenced off and enclosed, as if to be the site where Jews had long lived apart–a point of memory not dear to Kushner, where Jews had made up a large part of the overall population, and had been a large group of partisans, but faced anti-semitism.

But Jared oddly used the term associated with Novgorod Land, near Moscow, where, one suspects, the dirt he had been brought by the Russian banker Sergey Gorkov, personally appointed to run Vnesheconobank (VEB), the foreign bank of the Russian Federation by Vladimir Putin, had derived–a region close to Moscow, where Kushner’s father-in-law had famous ties.

Novgorod Land in Duchy of Moscow (1593)

Kushner’s admission to receiving a ceremonial “bag of dirt” from Gorkov not only played down its ceremonial status quite adroitly–“he gave me two gifts–one was a piece of art from Nvgorod, the village where my grandparents were from in Belarus, and the other was a bag of dirt from that same village”--seemed a token that this grandson of immigrants thought to be innocuous, but in underscoring its incidental nature. But the city in the Pale of Settlement where Kushner’s family hailed was from from the bucolic land of prancing reindeer mapped in 1593, he betrayed his deep sense of ethics in claiming that bag as his own, and may have called attention to the somewhat conspiratorial gesture the head of the VEB, revealing ties of a broader sphere of Russian influence the bank had Combe to embody.

Kushner’s orthodox religion is public record, and a matter of considerable pride.  But Kushner cloaked that ethnic identity and whatever significance his family might have assigned the dirt–and whatever Gorkov thought he was doing carrying the earth to New York City–a bit too smoothly.  The conspiratorial nature of the gift seemed symbolic, but the associations that the earth seemed spiritually impregnated were deprecated in odd ways in Kushner’s haste to play down the meeting’s significance as an exchange of family trinkets. Kushner’s grandparents had fled the walled Litvak ghetto of Nowogródek months after it was established in June, 1941, in Belarus, joining a fierce Jewish partisan resistance in as Nazi troops extended the Jewish genocide into Russian lands. As the Nazis ghettoized Jews and extended policies of extermination in the city near Minsk, the Kushner elders joined a Jewish partisan squad in the Belarus–escaping the ghetto via a tunnel of over two hundred yards dug over weeks by his grandmother Rae, then seventeen, with her brother Chonom, by hand-made instruments, successfully tunneling underneath electric fencing surrounding the ghetto walls, and helping some 350 Jewish men and women fled the ghetto to nearby forests where many lived for a surprising stretch of time, often in underground bunkers: would the groups trained in Zionist Youth Groups in the Pale of Settlement think of themselves as Russian? Or was this the history Gorkov tried to conjure, to forge a tie to Trump’s son-in-law?  

Continue reading

2 Comments

Filed under Belarus, Cold War, geopolitics, Vnesheconombank, World War II

Data Visualization Fake-Out?

Nothing in the world could take us back/ to where we used to be,” as Mariah Carey sings in her 1990 hit, I Don’t Wanna Cry–recorded back in the very year Tim Berners-Lee and CERN collaborators unveiled the World Wide Web, using HTML to share documents across huge networks and URL’s to specify computer targeted and information requested.   The coincidence of the design of such a document system that led TBL to build and design the world’s first web browser on an NeXT computer and Mariah Carey’s cooing soft-pop hit on only emptiness inside came together again in the release the WannaCry malware–malicious self-propagating code, able to exploit back-door vulnerabilities of Windows 7–which revealed a landscape from which nothing in the world can take us back to where reused to be.

Indeed, the boom of Malware by which the world’s information highways have been afflicted may have in general declined since 2017, from when the number of malware variants has dropped considerably, malware attacks, from ransomware to cryptojacking attacks, have risen, and the number of malicious email attachments has ballooned, often by inserting malicious code into a website to allow hackers to view financial information and histories of corporate entities and other institutions. The absence of any guides to ransomware of different varieties have left many increasingly vulnerable, as networks gain the vulnerability akin to “skimmer” able to glean financial histories off of the magnetic strips of credit cards at ATM’s across the world, exposing the global vulnerabilities into an infrastructure allowing global financial transactions. And despite relatively wide consensus that one should not pay ransoms from WannaCry as doing so would neither ensure access to the compromised files and possibly only expose one to further vulnerabilities to future attacks, the current wisdom of disconnecting all devises from Ethernet cables and wireless dongles suggest that disconnection without rebooting the system is in fact the best option for compromised systems, with an installation of Microsoft’s security patch–in addition to windows security updates and a reputable antivirus blocker. But the fear of vulnerability in a world where WannaCry remains a threat that has continued to hit 13,000 plus organizations since 2020 has led to increased concern how to prevent WannaCry attacks.

But the data visualizations we’ve used to describe the lateral progression of the encryption of data files from hard drives around the interlinked world lent a new prominence to the World Wide Web as a conduit for targeting destabilization.  It not only revealed how the world wide web has reshaped what we still call the world, but posed questions of how to map such a change, as even Microsoft employees in Redmond, Washington scrambled to chart the outbreak of malware after hackers exploited vulnerabilities in the unpatched Eternal Blue, in cyber attacks alternately known as WannaCry in 2017, and Non Petya when it later hit Ukraine, together with all companies, including large American ones, who did business with that nation, in an attempt to undermine its economic viability. From command central in what seems a concrete bunker of the future, before large screens, non-state Microsoft workers in Redmond, Washington tried to maintain a sense of security in their systems around the clock, and conduct repairs, in the weeks after the United States Department of Homeland Security urgently warned that out-of-date software was a global crisis and a national vulnerability. The malware just posed problems that local governments, municipalities, and law enforcement institutions could not bear, and which it seemed only Microsoft could be able to have manpower, incentives, and infrastructure to complete.

Kyle Johnson/New York Times

Wanna Cry left many literally crying for the sudden encryption of data, and many without services–and was intended to leave an unimaginable number of people desolate, if not quite with the absence of love that Mariah Carey wistfully evoked.  But the  virulence of its spread should offer a wake-up call to possibilities of global disruption we are still working to be able to track, map or fully comprehend in adequate fashion–but record as a virulent virus blocking systems most densely in nodes of a web-linked world.

the-wannacry-ransomware-attack_535798c2-38bf-11e7-b30b-76e7402dac55
Malware 2:10 pm

New York Times

The very same visualizations indeed obscure, by oddly rendering it as distributed, the agency that underpins such carefully orchestrated cyber attacks of global consequence, by almost naturalizing its spread.  For by moving the sites where data was most encrypted into a geographical frame of reference, the graphic doesn’t help orient us to its spread, so much as overwhelm us with the data-laden content to visualize a paralysis of global systems; it removes it from context or human agency, in order to capture the omnipresence of the self-propagating cyrptoworm as much as tell a story that helps to orient us to its spread.   Perhaps that is what was intended.

The mapping of global disruption is perhaps a nightmarish puzzle for members of the interlinked world, and demands a place on the front burners of data visualization:  the inadequate nature of considering the spread of systems-wide corruptions can be visualized by cases of the compromising of data, we lack the symbolic tools to grasp the rise of a new map of global dangers.   While such data visualizations provide a terrifying premonition of the destabilization that might result from the encryption of data on a broad scale, they obscure the possibilities of specifically targeted attacks on data and visible infrastructure that are now able to be developed, and the nature of targeted threats that we have only begun to imagine.  The redefinition in this new geography of document-sharing Tim Berners-Lee and friends developed has prepared the way for a landscape of interaction between removed places broadly adopted as a protocol for information-sharing– but one that, as Mariah Carey sung, and instigators of the malware hoped, left one only wanting to cry from behind one’s screen, devastated at the scope of the unforeseen swift data loss.

The data visualizations adopted to depict the flare-ups in compromised hard drives that the cryptoworm created in a manner of hours show the particular virulence with which malware crossed national divides in unprecedented ways, displacing relations of spatial proximity, geographical distance, and regional divides.  In crippling databases including Russian and Chinese private and public institutions in but a day, demanding immediate payment for data to be restored, the ransomware raised the curtain on a new age of uncertainty.  But was the threat eclipsed by the scale of the attack by which information was encrypted?  If the spread of malware seemed to grow across computer systems without apparent relations, the distributed agency that was invested in how the malware spread worldwide seemed to obscure the possibility of agency of the attacks, concealing the tracks of any perpetrator by placing a problem of urgency on screens worldwide.

oops.png
Wana_Decrypt0r_screenshot

Websites of news media of record widely adopted animated data visualizations to orient their readers to the proliferating corruption of data on tens of thousands of computers and computer systems on account of the malware caused.   Such elegantly animated maps don’t claim to be comprehensive, and are information-laden to the extent that seek to capture the unprecedented speed and range of the spread of the cyberworm launched Friday, May 12, 2017.  We have trouble even comprehending or grasping the scale or speed with which the virus spread on systems, of course, and speed at which malware was propagated itself across networks and spread laterally across systems, rather than by geographic relations, working without a phishing hook of any sort but exploiting an NSA-developed backdoor vulnerability in the Windows 7 operating system to infect networks across national bounds, as it spread laterally across systems worldwide.

The spread of the encryption of hard drives data across space occurred in apparently haphazard ways, spreading globally in the first thirty minutes of across more advanced web-reliant regions of what we still call the globe.  While their spread “followed” systems whose operating systems had not been fully updated, it is important to remember that rather than spreading laterally along a system of their own accord, their release was planned and released by agents, rather than being a casualty of the World Wide Web; a map of instances of hard-drive vulnerabilities however can offer few diagnostic signs or clues to interpret their spread, but offer only a catalogue of individual instances difficult to process in their entirety, so overwhelming and geographically dispersed was their occurrence to defy easy interpretation or processing–they provide little that might be suggested as forensic evidence about their spread.

ransomeware 0 hr 30 min 0 sec

Red Socks Security: Malicious Threat Detection

If the growth of the virus’s spread across nations made it seemed to progress in ways that lacked a target, we may lack the tools to visualize the attack.  The systems afflicted were not linked on a geographical register, and in some senses didn’t make sense to read in a map–but if they spread on internet traffic, the broad scale of the attack of ransomeware only foregrounded the fears of where it had arrived from or offer any signs to appreciate any agency within its systems-borne spread.  But if the map seemed the best way to the speed of its growth, it was a distraction from the potential targeted threats of the malicious worm–until a lone British researcher, known as “MalwareTech,” saved the compromising of global systems as he serendipitously identified its kill switch to stop its spread:  what dominated the headlines conceals the dangers of losing sight of the specificity of the wide-ranging attacks, even while registering them in real time.

The rest of the world could only sit in silence, as Mariah Carey once sung, and watch the range of attacks unfold in space in real time:  something went wrong in the mode of sharing data across online systems that had to be couldn’t quite be understood.  If Maria Carey’s hit single contemplated the definite break in time, “only emptiness inside us,” the shock of the screens informing users across the world that their data had been definitively compromised made then realize that any notion of data security vanished, and any hope for composure in the face of cryptoworms had disappeared, as Mariah Carey’s softly-sung lyrics described, and as far away as a network-free world, or one where inter-connected users didn’t define the primary routes of its transmission, without considering the dangers of the compromised infrastructure–not only in banking, but in traffic system, airport controlling, water quality monitoring, and even traffic flows.

But we continue to rely on geographic registers, as if we can’t let go of them, and it is what we have to explain the global spread of compromised systems and a collapse of data security.  The cryptoworm successfully obtained advanced user privileges that allowed it to hijack computer systems that allowed hackers to encrypt documents worldwide in one day, reaching such a broad range of hard drives to make it seem the attack was random or haphazard.  The attacks used code to release a self-propagating worm  that didn’t really move spatially, but progressed online, using a vulnerability for which Microsoft had released a patch only two months previous, in March, in devices that share files across local networks.   After the patch arrived, we were still mapping its spread, and contemplating the prospects of the return of a similar virus, so clearly had it asked us to redefine internet traffic.  But was did the broad spread of the worm and broad scope of systems compromises, which was quick to provoke deep fears of the vulnerabilities that exist from ransomware erase the targeted nature of a similar subsequent malware attack?  The spread of thousands of infections in over a hundred–and then over a hundred and fifty countries–across hard drives across the world exploited the failure to update software systems so broadly to obscure the origins or coordination of such malware attacks, whose use of normal language to alert users of encryption made them seem as if it were an isolated standard operating failure, able to be resolved by individual payment–

Wana_Decrypt0r_screenshot
petya-ransomware-how-remove-decrypt-files-new-unlock-computer-windows-dropbox-file.jpg

–even as the malware crippled networks in different countries without having the appearance of any fixed target.  And if masquerading as a form of ransomware, later variants of the cryptoworm suggested a far, far scarier version of the scope of data corruption.

wannacry_03

Kapersky Lab/Ars Technica

We were of course struck by the unprecedented speed with which such worms replicated along these dispersive networks–following paths that are not made evident in the map of compromised hard drives provided by data security firms, which show the progression of a disease that, like a cancer, creeps invasively along a hidden network, suggests a nightmare of the distributed agency of the internet, invaded by a particularly vicious parasite that for a considerable amount of time even experts saw no way to resolve.

We can now watch the spread of internet attacks in real time, looking at the threats of hacking in real-time, in ways that reflect the emergence of the internet and World Wide Web as a real-time battlefield, even if this is only a representative tracking of hacking attempts tracked by Norse.  It doesn’t include the ten millions of daily attempts to hack into the Pentagon, or the similar number of threats that the National Nuclear Security Administration tries to fend off–and the millions of attacks universities daily confront.  But if we are apt to be mesmerized by the range of such attacks, impossible to fully comprehend or track, we’re likely to be overwhelmed by the serious fears of the security vulnerabilities of which they cannot but remind us, although the abstracted sense of a constant barrage of online attacks can remove us from all too real dangers of their infrastructural effects–and the dangers of destabilization of specifically targeted strikes.

m8g8Z1X.gif

Norse

And if we might do well to take stock of the range of attacks by hackers to which the United States is vulnerable, mostly from China and Chinese sources, privileging our country as the target of future strikes–

L2zRKfa.gif

Norse

–we loose sight of their increasingly global nature, now that much of the software to exploit vulnerabilities is available in the Dark Net.  The origins of such attacks aren’t really clearly able to be mapped–hackers are experts at deflecting or rerouting their signals, and bouncing around their traces to make hacks that are located from one site appear to emanate from another from another.  And infrastructural vulnerabilities of infrastructure are increasingly on the table for nations other than the United States, often without the means to monitor such cybersecurity issues or strikes.

In an age when the pathways of internet links may have spawned spontaneous revolutions, uprisings, and unexpected results of elections, non-human communication and propagation of such malicious malware viruses seem an apotheosis of the absence of any agency–a worm that is able to replicate itself within hard drives world wide, removed from any intent.  To be sure, the range of sped-up animated maps to track the progress of the viruses that compromised data across the world produced a sense of wonder at our vulnerability of a sort that has not been widely mapped since the Cold War:  the images generated of internet threats mirrors the map of the danger of missile strikes that emerged in Life magazine back in 1945, at the end of the Second World War–only months after the destruction of Hiroshima and Nagasaki by American atomic bombs, that increasingly stand as a premonition of the new nature of things to come.

Atom Bombs Descend on US LIFE 1945.png

Life Magazine: The Thirty-Six Hour War (November, 1945)

Mutatis mutandi, the image of the visual culture of the early Cold War was adopted by the Russian internet security agency, the Kapersky Labs, as a strategy to image the globally expanding threat of hacking to compromise hard drives and data-based systems.

malicious threats USA scale

Kapersky Labs

In an era that was defined as after or following the thaw of the Cold War, the internet emerged in 1990–just a year after the fall of the Berlin Wall heralded its thaw–as a new battleground to wage global conflict.  To be sure, the cybermaps of phishing schemes and potential email attacks are traced by the Kapersky labs in real time, to monitor for global security on the interlinked world-wide online systems.  But their dynamic images retain the symbolic structure of the arcs of a violation of national airspace to suggest the magnitude of the incursions into cyberspace they monitor and report on round the clock.

We continue to map the global spread of malware as if to wonder at its scale:  the distributed compromising of data as an animated sequence of simultaneous flare-ups of intensity from yellow to burning red across the world, as if to pose the question of its communication in terms of spatial continuity and proximity.  In some of the best data visualizations of the scare of WannaCry and Petya viruses, the brightly burning flare-ups signalled a fire that burned so brightly to become impossible to contain as if a metastisizing online cancer spread across the world’s wealthiest regions.  Despite the power of the animated visualization, we may map it wrongly, as if to imply it can be diagnosed as a spatially transmitted contagion without a target or destination.  In using the data-laden information of cybersecurity firms to map the occurrence of data corruption and systems infection, the political antagonisms and animosities that have fed the growth of malware are cunningly left absent from the map at our own peril.

1:03.png
1:19.png
2:24.png

Although these maps suggest the scope and nature of the self-replicating cryptoworm, they may take the metaphorical value of a computer virus in literal terms, as a disease map, or biological virus whose contagious could be explained,–like the famous Snow Map, created by a founder of modern epidemiology,  Dr. John Snow, to devise a mode to convince readers of the transmission from a water source of the 1854 London cholera outbreak.  Of course, the malware maps do not try to communicate the pathways or mechanics of the virus’ spread.  For rather than showcasing an event that was planned and of human agency, and whose propagation was in some sense designed, they run the risk of naturalizing both the incidence of systems’ compromises and the malicious nature of the very phenomenon that they describe.  While the meaning that each bring pixel cannot even be understood or processed in a global scale–its impact was local–the intensity of the outbreak seemed almost a skin disease on the surface of the world.  The intensity of its transmission surely mirrors the density of online connections or an economy that was web-based, as networks allowed its contagion spread from Indonesia to Europe the United States, raising alarms as it seemed to actualize some of the worst fears of a cyberattack, of the de-empowered nature of a computer system suddenly devouring its own data, but like a faceless god, from 11:00 one Friday morning, so that by 1:20, the spread of the malware had dense sites of infection on five continents.

The local merged with the global, however, in ways difficult to map:  the maps of real-time tracking of the spread of the worm across a grey, global map made it seem totally removed from human actors, in hopes to capture the speed by which the worm managed to rapidly to spread laterally across systems, using an onslaught of randomly generated IP addresses as a way to target an ever-proliferating range of hard drives through multiplying packets sent to remote hosts, whose own hard drives were hijacked, leaving anonymous-sounding messages of no clear provenance to pop-up on users’ screens, in ways that seem to imitate the “normal” logic of an algorithmic process entertaining the possibility of implicating the user in the encryption of their hard drive or the deletion of necessary valuable files.

screen-shot-2017-05-16-at-6-32-06-pm

The communication of the virus–a biomedical metaphor that seemed particularly unable to offer any diagnostic value, suggesting either the banality of the infection or its nasty spread–was not nosologically helpful, but suggested the virulence of its spread.  The natural history metaphor of the worm–or, better yet, the coinage of the cryptoworm–better expressed the lack of clarity as to its provenance or the seriousness of its damage.  Although subsequent investigations found that the first infections appeared, globally, on computers in India, Hong Kong, and the Philippines, according to SophosLabs, the stage was set for a three-pronged global spread–as if in a negative version of the Trans-Pacific Partnership, moving from South-East Asia worldwide–that began from 7:44  UTC with such startling rapidity that it will demand detailed unpacking to understand the target or decipher any of the aims that underlay the attack, or the extent of its destructive scope. The spread of the self-proliferating worm was only stopped by the inadvertent discovery in the code of the ransomware of a kill switch, which allowed a security researcher known only as MalwareTech to register a domain name able to slow the spread of the infection in a compromising manner, effectively halting its viral spread.  Despite the rapid proliferation of visualizations of the unprecedented sale of its virulence, in retrospect, it might make sense to ask whether the undifferentiated global nature of the visualization, while stunning, distracted from the malicious operations of its code, and what better metaphors might exist to describe the spread of something dangerously akin to cyberwar.

We only have a few cartographic metaphors to describe the lateral spread of online compromising of computer data and the infiltration of networks, because of the speed with which it spreads challenge human cognition.  Even if it can be schematized in a format that suggest the density of data compromises or the amount of encrypted files, the visualizations offer a limited basis to orient oneself to the seriousness or the danger of these infections, which once they start offer little possibility of stopping their spread.  The later visualizations of the global impact of the release of Wannacry network worm are usefully foreground the rapidity of its spread, and raise the specter of its unstoppability.  But the visualizations of the rapid flare-ups of malware that infect hard drives and encrypt their data may conceal the targeting of instability.  If the spread malware and ransomware have been primarily linked to extortion, the spread of self-propogating cryptoworms cannot only be seen in numbers of systems compromised:  for they are  released and created in order provoke instability, as much as for Bitcoin revenues.  Although theft of data is usually seen as most valuable to the owner of the dataset, the potential interest in ransomware as a service–and much ransomware is now available on the darknet in different forms, suggests a needed growth in cybersecurity.

If ransomware collectively netted about $1 billion during 2016–and stands to become a growth industry of sorts–the latest Petya virus netted but $10,000, although the benefits of the attack might have been much greater–in the form of the disruptions that it creates, often not so clearly racked or visible in the data visualizations of its spread, whose animated explosions suggest its out of control migration across networks as wildly crossing boundaries of state sovereignty, encrypting data on computer systems across space as it travelled along the spines of the internet as if without any destination, as tens of thousands od systems were entered and compromised via ‘back door’ disrupting hospitals in the UK, universities in China, rail in Germany, or car plants in Japan, in ways that were far more easy to track as a systems collapse by locking its victims out of critical data that allowed their continued operation.  The demand for ransom payments to restore apparently stolen data was a screen for the disruption of invasive attack on companies’ computer networks, whose compromising can only start to suggest the infrastructural disruptions they created as they rapidly globally spread, whose apparently anarchic spread revealed the new globalized nature of system vulnerabilities.

Malware explosion 2:05
Malware explosion 3:15
Ransomware4:46 pm
ransomware 5:55
wannacry-map

While malware is distinguished by the demand to hold hostage the encrypted files of one’s hard drive, the viral spread of worms targeting systems vulnerabilities can disrupt systems and infrastructure in ways particularly difficult to defend against.  Although the attacks depend on failures to update systems and to preserve retrievable back-ups, the vulnerabilities invite disruptions on a scale only so far imagined in futuristic films.  These apocalyptic scenarios are perpetuated by security firms–and by the video games of the global imaginary that require only greyed out background maps to treat data visualizations as having sufficient complexity if they register the intensity of attacks, even if this only gives cover for the malicious actors who perpetuate their spread.  But the assault on systems by the backdoor vulnerability first discovered by the NSA, in its program for targeting and infiltrating select foreign computer networks, but now for sale on the Dark Web, may only raise the curtain on a far more malicious range of malware, able to backdoor systems that are connected to transportation networks, water treatment plants, traffic systems, credit card systems, banking and airport controlling, far beyond cel phone systems, and able to–as the attack, just before WannaCry plagued web-based systems, compromised IDT Corporation–evade security detection systems.  While regular, complete and restorable systems back-ups may be the only response to ransomware, the possibility of already backdoored systems has lead to fears that the Shadow Brokers group who unleashed the Eternal Blue code from the NSA is a group of Russian-backed cybercriminals, and the hackers who released WannaCry who cyber researchers believe have tied to North Korea, may raise the threshold on cyberwarfare of a scale unheard of in previous years.

“Nothing in the world could take us back/to where we used to be.”  Golan Ben-Omi–who views the analytic skills honed in studying Torah as good training cybersecurity in the Chabad-Lubavitcher community–  Chabad-Lubavitch communities are interested in preserving the integrity of their websites from profane pollution, but are attuned to the dangers of data breaches.  The attack that was made on his company, IDT, by means of an NSA tool with the capacity to penetrate computer systems without tripping alarms–named “DoublePulsar”–enters the kernel of computer systems, or its inner core, to trip the connections between hardware and software that would allow hackers to steal systems credentials in order to compromise systems with far greater impact than earlier breaches and infections, appearing as ransomware, but perpetrating far more serious damage on a system.  The sequential flaring of compromised computer hard drives suggests a landscape that Ben-Omi has been studying for over fifteen years–and believes that the analytical skills honed in the study of Torah will allow his students to analyze.

While we lack the tools to start to map disruptions on such broad scale, the  If the attacks on hard drives that occurred in over one hundred and fifty countries on Friday, May 12, 2017 may have been a case of intentional disruption, but the Petya ransomware attack of July, which successfully targeted the same vulnerabilities, exploited similar vulnerabilities in a potentially more targeted weaponized manner.  Although it “is only code,” the lateral spread across the spines of the internet created fears of impending disaster across the most digitally rooted areas of the world, spreading fears of data disruptions, crashes and infrastructure collapse whose potential won’t be able to be so clearly mapped for quite some time.

The terrain of the crypto worm’s spread is better able to be understood, if not quite familiar.  During the most recent space of malware attacks left most untouched places those farthest from the most unreflective internet-dependent, the map only can suggest the real-life inconveniences that can hardly be captured by the burning flares of yellow-red bursting at spots across the globe at unprecedented velocity.

2000px-InternetPenetrationWorldMap.svg

Global Internet Penetration 2012/Jeff Ogden

InternetPopulation2011_HexCartogram_v7-01.png

Oxford Internet Institute (2011) Data on Internet users and population from World Bank 

For while not only communicated–as at first believed–by malicious email attachments, internet links clicked by users whose unreflective response unleash lost data, frozen systems, or looted bank accounts, the spread of ransomware parallels the amazing intensification of net-dependence and systems-based communicative tools, revealed below in the new information ecosystems that have arisen, illustrated in the quite spread of Facebook use over a short amount of time.

FB-World-Map-Comparison.png

The relation between online activity and real-time consequences are difficult to map.

All maps serve to help tell stories, and the intensity of Facebook connections suggest more than a huge time-suck of human lives:  it reveals the increased homogeneity of the systems we use, and the similarity of what we see and read.  But if all maps tell stories, the necessarily partial nature of the dense visualizations of the global disruptiveness of malicious attacks on computer systems seem compromised:  while over-laden to challenge the abilities of viewers to process their content, they only tell the most superficial part of real-time story–the compromising of data–and not the consequences that the widespread collective compromising of hard drives will effect both immediately and in the long run.  And here we get onto thin ice in terms of what can be visualized, and the limits of counting the datasets of the corruptions of computers or systems, and the difficulty of counting beyond the density of compromised hard drives to the real-world implications of systems’ collapse.  One can only start to imagine the implications of such collapse in maps contracting the real-time compromises of computer systems, in ways that reveal the global nature of an infectious spread of malware, but also obscure the different places that might be targets of weaponized malware attacks.

Malware Explosion 12:52

What we can track is the most immediate end-product of the malicious attack, but it offers few clues to interpret the basis for the attack or indeed the different scale of its real-time long-term consequences.

The visualizations track an almost near-inevitable progress of red flares in internet-dependent hubs that appear to overwhelm viewers with their over-laden information in ways that run the risk of obscuring any sense of human agency–or intent–as if to track the spread of a virus across a system that lacks internal logic of its own.  The intensity of attacks on computer networks tracked from the Wannacry ransomware showed the astoundingly rapid spread of the infectious cryptoworm that caused the attacks.  But it presented them as if they were in fact geographically localized, but the disruptions were purged of any explanatory context, geopolitical or other.  For the inevitability of the spread of malware that the images provoke–and the fears of the unstoppability of further crypto worms–may obscure the dangers of their weaponization.  If the launching of cyberthreats is often depicted as a real-time war by cybersecurity firms as Norse–

world wide war.png

–we may be increasingly in need of mapping the intersection of such live attacks on data and their real-life consequences beyond the compromising of datasets.

We  were recently warned how the expansion of malware and ransomware would soon propagate over networks in more virulent ways.  Earlier worms that infected hard drives as Conficker in 2008 and SQL Slammer back in 2003 or SamSam, spotted in 2016, offer but “a harbinger of a new wave of more malicious, tenacious and costly ransomware to come,” of even greater scale, warned Joe Marshall of Cisco Talos, with “bigger payouts.”  Marshall warned of the greater goals of hackers to infect networks, and his warnings might be augmented by suggesting the dangers of hackers working with governments to use malicious code to “cast a wider net” through self-propagating crypto worms able to laterally traverse  huge corporate networks as tools by which to target nations–and national infrastructure–in ways that the fear of network intrusion have only begun to come to terms.  When Marshall and his co-author Craig Williams noted in 2016 that the rise of ransomeware was an “ever-growing problem” that will involve greater payments to restore databases in Ransomware: Past, Present and Future with greater “intrusive capabilities,” with the repurposing of network vulnerabilities, on a massive scale, presumably including the targeting of entire systems.  The maps of data encryptions and corruptions that WannaCry caused worldwide served to capture these fears, and their broadly trans-national consequences; the trans-national nature of such a strike on hard drives may well obscure and conceal the strikes and intentions of other malicious actors.  Although some believe payment the easiest option to retrieve data, as the worms are developed that target vulnerabilities in systems, they will potentially be able to compromise targeted banking, transportation, and emergency infrastructures.

Do visualizations of the immediate fears of the spread of one virus conceal concerns of the weaponization of such internet-born infections on specific targets and nations, despite the seemingly unplanned ubiquity of their spread across interlinked systems?  Despite their shock, such visualizations of the intensity of compromised systems, often echoing hubs of internet service, raise pressing questions about how to map the operations and actors behind them that are far more complicated to process fully–and lie off of the map.

1. Viewing visualizations of such rapidly spreading worms that compromised computers on a global scale, one wants to be able to peel away layers of the visualization, to reveal, as layers of an onion, the networks along which the cryptoworm laterally spread and the extent of disruptions that its spread caused.  For the scale of the disruptions, and the intent of the hackers or those who launched the malicious code, may only be revealed in a more localized map of the sorts of destabilization that cryptoworms might produce.  While leaving us to wonder at the unprecedented scale of their recent spread over a few hours or minutes, the visualizations take geographical space as their primary register, blank background maps bleached of underlying history, may make them all the more misleading and difficult to read, as they are removed from human agency and context, and treated as an artifact of the spread of the reliance of increasing multinationals on internet services and web-based networks.

Differences in online activity are far less lopsided across geographic space than in previous years, as shown by the Oxford Internet Institute by a cartogram warping of global space showing the relative density of online activity by 2013 data, in ways that allow the broader targeting of systems to conceal a malicious attack on a country.

World Online 2013
Percentage online OIL

–which might also  be read as a record of the increased vulnerability of specific areas, and the systems vulnerabilities might offer to compromise local infrastructure, and start to focus on the implications for those places.  Doing so would consider the growing intersections between The Real World and the internet in a complex social continuum, where stability can be disrupted at select nodes more dependent on how worlds of finance, banking, shipping, health, and traffic are increasingly interlinked.  Given the inevitable nature of such vulnerabilities, the frequent backing up and smooth restoration of backups are necessary to erase the growing threats not only of malware or ransomware, but the disruptions of critical infrastructure future attacks might allow.

Continue reading

Leave a comment

Filed under computer viruses, cybersecurity, data visualization, globalization, World Wide Web

The Cognitive Clouding of Global Warming: Paris and Pittsburgh; Creditors and Debtors

The argument of America First seems to have been extended to its logical conclusion as the apparently selected President of the United States has single-handedly subtracted the nation from a map of climate change.  By denying the place of the United States in the Paris Climate Accords, President Trump seems, in the most charitable interpretation, to have acted on his own instincts for what was the benefit that accrued to the country in the very short term, and after looking at the balance books of the United States government for what might have been the first time, decided that America had no real part in the map of the future of a warming world.  Rather than outright denying global warming or climate change, Trump decided that the conventions established to contain it by the world’s nations had no immediate advantage for the United States.  

The result wasn’t really to subtract the United States from the ecumene, but from the phenomenon or at least the collective reaction of the world to climate change, and openly declare the supremacy of his own personal opinion–as if by executive fiat–on the matter. The personal position which he advanced was so personal, perhaps, to be presented in terms of his own clouded thinking on the matter, or at least by seizing it to create what he saw as a wedge between national consistencies, and to use wildly incommensurate forms of data to create the impression of his own expertise on the issue–and to mislead the nation.  For Donald Trump took advantage of his having Presidential podium to diss the Paris Accords by a torrent of alliteration developed by a clever speechwriter as resting on a “cornucopia of dystopian, dishonest and discredited data.”  Even if one wants to admire the mesmerizingly deceptive excess of alliteration, the notion of rooting an initial response to planetary climate change in the perspective of one nation–the United States of America–which produced the lion’s share of greenhouse gasses–is only designed to distort.  

By pretending to unmask the Paris Accords as in fact a bum economic deal for the United States, as if it were solely designed to “handicap” one national economy, set a sad standard for the values of public office.  For as Trump dismissed data on climate change as discredited with mock-rage, and vowed that the entire affair had been designed by foreign groups who had already “collectively cost America trillions of dollars through tough trade practices” and were desiring to continue to inflict similar damage.

But the large future on trade imbalances–which he treated as the bottom line–he staged a spectacle of being aggrieved that seemed to take on the problems of the nation, with little sense of what was at stake.  Trump’s televised live speech was preeminently designed only to distract from the data on which the Accords had been based.  And even as Trump sought to pound his chest by describing the Accord as a “bad deal for Americans,” that in truth “to the exclusive benefit of other countries.”  By turning attention to an America First perspective on global warming, Trump sought to replace the international scope of the challenge–and intent of the much-negotiated Climate Accords–by suggesting that it obscured American interests, even if it only took America’s good will for granted.  As if explaining to his televised audience that the agreement only “disadvantages the United States in relation to other countries,” with the result of “leaving American workers–who [sic] I love–. . . to absorb the cost in terms of lost jobs [and] lower wages,” he concealed the actual economics of withdrawing from the Accords were buried beneath boasts to have secured “350 billion of military and economic development for the US” and to help American businesses, workers, taxpayers, and citizens.  

In continuing to dismiss the data out of hand about the expanded production of greenhouse gasses, Trump seems to seek to overturn the deceptions of data visualizations that have alerted the United States and world about the consequences of unrestrained or unbridled climate change. Trump ridiculed the true target of the nearly universally approved Accords, scoffing at the abilities to reduce global temperatures; instead, he concentrated on broad figures of lost jobs in manufacturing and industries that are in fact small sectors of the national economy, and incommensurable with the dangers of ignoring global warming and climate change, or the exigencies of taking steps to counter its recent growth.

global warming
Increased Likelihood of Temperature Surpassing Previous Records by 2050 and 2080

oceanic-warming
Sea Surface Temperatures against a Historical Baseline of a Century Ago/Climate Central

As if years of accumulated data of earth observation could be dismissed as deceptive out of hand by executive authority, independent of an accurate judgement of its measurement, Trump dismissed expert opinion with the air of a true populist whose heart lay in the defense of the American people and their well-being–as if they could be abstracted and prioritized above the world’s  Trump’s largely rambling if gravely delivered comments in the Rose Garden press conference that painted himself as daily fighting for the country cemented the alliance of populism and a war on science by its odd substitution of bad economic data for good scientific data.  

The switch is one in which his administration has specialized.  His address certainly culminated an outright dismissal of scientific conclusions based on a distorted America First picture of the world, where a stolid declaration that “the United States will withdraw from the Paris Climate Accords” made sense as form of national defense–despite the potential global catastrophe that rising global temperatures and sea surface temperatures threaten. Is the technique of juxtaposing statistics and muddying data an attempt to undermine evidence, or an illustration of his insecurity with giving authority to data, or to scientific authority, the mirrors his concern about concealing “his profound illiteracy,” or his insecurity about illiteracy, that linguist Geoffrey Nunberg argues not only distance his own speech from words, and discredits their currency, but an insecurity of having to rely on language and linguistic skills alone, in ways that might be well seen as analogues to his plentiful use of all caps on social media, as stepping outside of the language of public life to a medium more direct and complicit with his audience, if outside the usage standards of a written language.

The catastrophes were minimized by being argued to be based on “discredited data” in a bizarre flourish designed to dismiss scientific concensus  Trump conspicuously faulted not only the “discredited” but distracting nature of data  in the speech he gave in the Rose Garden on June 1, 2017 that supposedly justified his announcement of withdrawing from the Paris Climate Accords in 2015 to limit heat-trapping emissions of carbon fuels that have been tied to observed climate change.  Rather than foreground the international nature of the accords among agreed upon by almost 200 nations, trump advanced the need to heed local interests, perversely, but even more perversely argued that the Accords resulted from disinformation.  He spoke to the world to chastise their recognition of scientific observations, in so doing destabilizing not only global alliances but undermining a long-negotiated climate policy by pulling the rug out from long accepted consensus not only of climate scientists but a role of national leadership that sought to remedy the failure of the Kyoto Protocol of 1997.  Trump turned his back on the Climate Accords on how to curb greenhouse gas emissions  by proclaiming their unfairness to American interests, and attacking unwanted constraints on American industry, through his own deployment of data that was even more discredited as an excuse to walk away from the prospect of a greener world.

Exiting the Green.png  
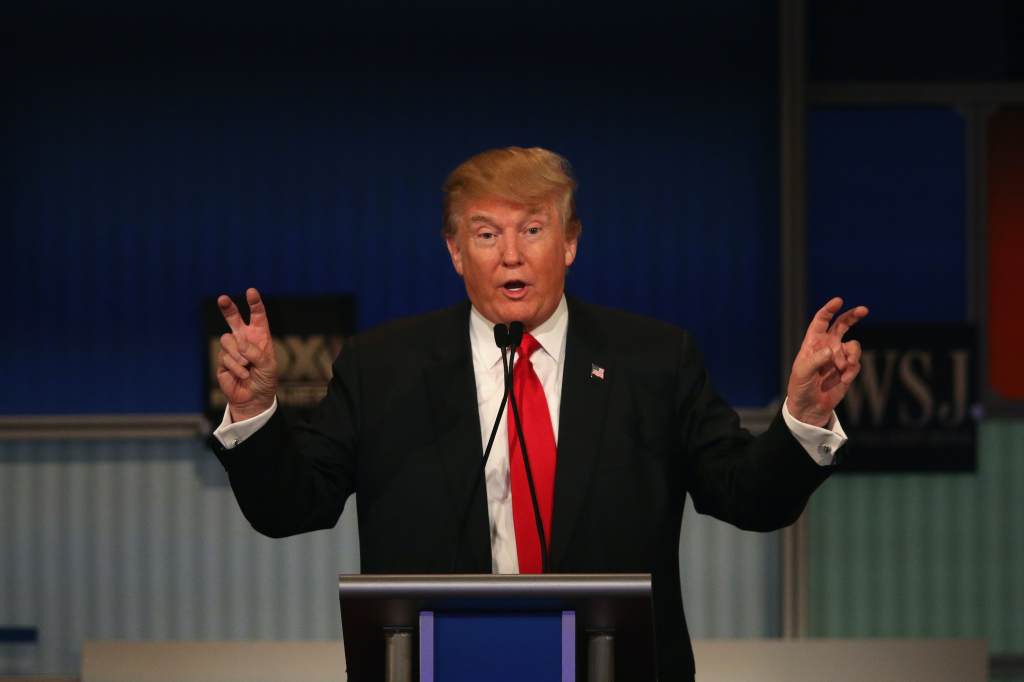
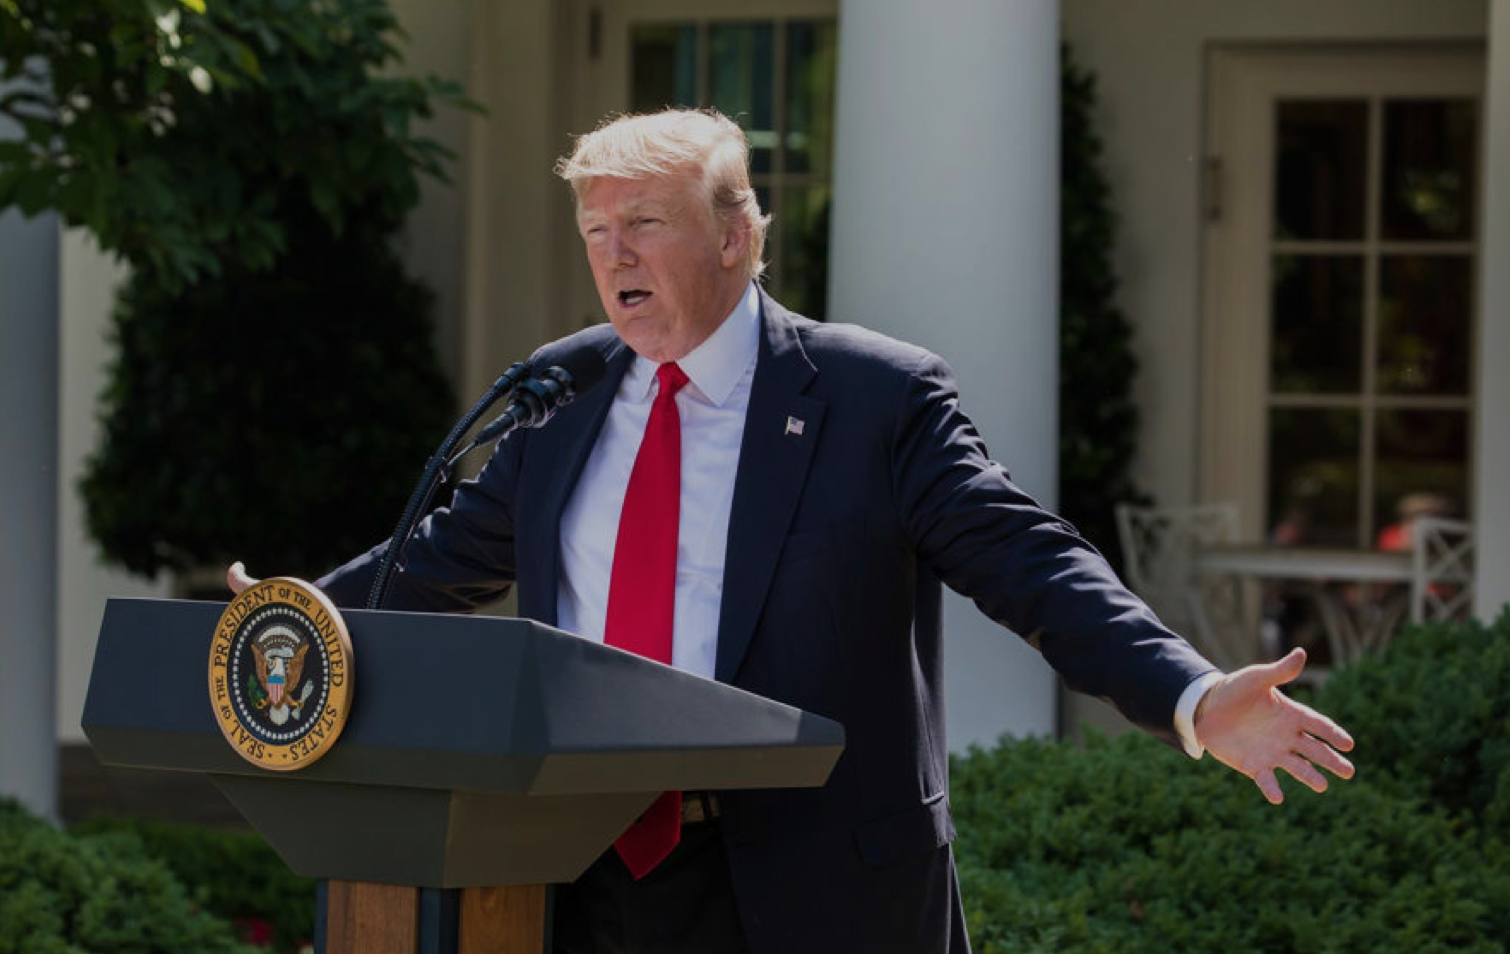
Al Drago/New York Times
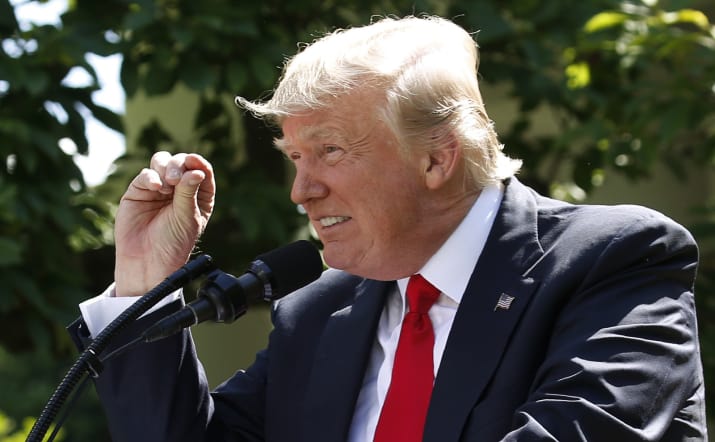
1. If Trump steered the nation away from green energy and into darkness, Vladimir Putin seemed to mock Trump’s rationale for the withdrawal when he mused, jokingly but ever so darkly, that “maybe the current [U.S.] president thinks they are not fully thought-through,” making open fun of Donald Trump’s image of global leadership by wryly noting in ways that echoed the absurdity of Trump’s defense of the local in place of the global.  “We don’t feel here that the temperature is going hotter here, . . . I hear they are saying it snowed in Moscow today and its raining here, very cold,” Putin noted, as if relishing undermining long-established trends in climate data by invoking a populist championing of local knowledge as if it trumped the advantages of earth observation that satellite observation has long provided.   Populism trumped expertise and Putin laughed at the possibility that the Accords might soon fail as a result.

Given the longstanding desire of Moscow to be released from constraints on exploring the billions of tons of Arctic oil on which Russia has chosen to gamble, Trump’s almost purposive blindness to a changing environmental politics of the global economy astounds for its parochialism, and its championing of place to dismiss undeniable effects of climate change that seems closely tied to carbon emissions.  For with a false populism that championed the limited perspective of one place in the world–or one’s own personal experience–Trump dismissed the maps and projections of climate change, on the basis that the “deal” was simply “BAD.”  And as a man who views everything as yet another deal, while he pronounced readiness to “renegotiate” an accord he sought to cast as a failure of President Obama to represent America’s interests, the rebuke fell flatly as the accord was never designed to be renegotiable.

Putin’s remarks were met by scattered laughter of recognition, and some smirks at the decision of the American president to withdraw form a long-negotiated set of accords to the collective dismay of our military and environmental allies, and its implicit endorsement of deniers of climate change.  The potential “axis of mass destruction” France’s climate minister has cautioned against might indeed be one of mass distraction.  For in dismissing and indeed disdaining the historical accords to limit carbon emissions, Trump sought a soundbite sufficient to stoke suspicions the climate treaty.  He sought to cast it as yet another deeply rigged system of which he had taken to compulsively warning Americans.  Such a metaphor of bounty was jarring to reconcile with onerous economic burdens cited as the prime motivations for deciding to reject the Paris Accords on Climate Change.  The jarring cognitive coinage seemed to connote its negative by a disorienting litotes; but perhaps the most striking element of the entire news conference was that Trump offered no data that backed up his own pronouncements and appearance of steadfast or only obstinate personal resolve.

Before the coherence of the embodiment of climate change in maps, Trumps jarringly juxtaposed radically different sorts of statistic to snow the nation–and the world–by disorienting his audience, on which Trump turned to a litany of complaints and perceived offenses striking for providing no data of any sort, save several bits of false data.  As much as Trump betrayed uneven command over the data on climate change, as if embedding discrete numbers in unclear fashion that supported a self-evident argument, as if they addressed one of the most carefully documented changes in the atmosphere of the world.  By juxtaposing a threat that “could cost Americans as much as 2.7 million lost jobs by 2025“–a number described as extreme but decontextualized to exaggerate its effect, framed by the dismissive statement  “Believe me, this is not what we need!“– with a projected small temperature decrease of two tenths of a degree Celsius–“Think of that!  This much”–as if to indicate the minuscule return that the “deal” offered to the United States that would have made it worthy accepting its costs–

sub-buzz-27555-1496436714-1

The gesture seemed designed to juxtapose the honesty of direct communication with the deceit of the experts.   Trump’s notion of direct communication concealed the surreal enjambment of disproportionate numbers more striking by the difference of their scale than their meaning.  Of a piece with his citation of partial statistics that exaggerate his points, from “95 Million not in the U.S. labor force” as if to imply they are all unsuccessfully looking for work, targeting some 8 million immigrants as “illegal aliens”ready for deportation, or how immigrants coast American taxpayers “billions of dollars a year.”   Such large figures deploy discredited data difficult to process to conjure fears by overwhelming audience, distracting from specific problems with large numbers that communicate an illusion of expertise, or even overwhelm their judgment by talking points disseminated in deeply questionable media sources.

If the power of this juxtaposition of unrelated numbers gained their effectiveness because of a lack of numeracy–Trump’s claim of 100 million social media followers lumps his followers on Twitter, Facebook and Instagram, many of whom may be the same people, and other fake persona —the numbers seem to exist for their rhetorical effect alone, as if to awe by their size and dismiss by the miniscule benefits they might provide. The point of contrasting such large and small statistics was to suggest the poor priorities of the previous administration, and dilute form the consensus reached on the modeling of climate change.  To be sure, the Trump administration also barters in fake facts on Fox News Sunday. inflating the number of jobs in coal industries, that show a misleading sense of the government’s relation to the national economy, generating a range of falsehoods that disable fact-checking, obscuring the fact that the global marketplace increasingly gives preference to cleaner energy and clean energy jobs more quickly others sectors of our national economy beyond energy industries.  The ties of Trump’s administration to fossil fuels–from the Secretary of State to the Secretary of Energy to the Secretary of the Interior down–employ the obsfuscating tactics of fossil fuel industries to obscure benefits of low-carbon fuels.  Indeed, the inability to “renegotiate” a deal where each nation set its own levels of energy usage rendered Trump’s promise of the prospect of renegotiation meaningless and unclear, even if it was intended to create the appearance of him sounding reasonable and amiable enough on nightly television news.

Broad hands.png
Cheriss May/Spia via AP

Another point of the citation of false data was to evoke a sense of false populism, by asking how the Accords could ever add up.  In isolating foregrounded statistics great and small, tightly juxtaposed for rhetorical effect, the intent seems consciously to bombard the audience to disorienting effect.  We know Trump has disdain for expertise, and indeed the intersection between a sense of populism with disdain or rejection of science may be endemic:  in formulating responses to a global question like climate change that he has had no familiarity with save in terms of margins of profits and regulations.  Rather than consulting experts, the President has prepared for public statements by consulting sympathetic FOX media figures like Kimberly Guilfoyle who pander by endorsing the notion of a climate conspiracy–not experts, who use data as obscuring foils, suggesting an ecology of information originating from pro-fossil fuel industry groups.

Continue reading

Leave a comment

Filed under data visualization, data visualizations, Donald J. Trump, global warming, statistics

On the Road and Off the Map: Maps for Self-Driving Cars in an Over-Paved World

Self-driving or autonomous cars promise a change in patterns of mobility more radical than any change in transportation.  While depending on maps, the maps made for self-driving cars are perhaps unlike any other:  not made or designed for human eyes. To be sure, we already drive in maps that we see ourselves moving along, in a mapped world as much as a real topography-and the internalized maps on our dashboards offer a basis from which it seems one barely has to move to imagine a machine-readable map of a self-driving vehicle–

–so that even our road signs can be obscured by the options that we have on the maps in our dashboards, and we are almost ready to offload responsibility for following the map onto the voices that provide directions, images that track our presence on the road, and put us in road maps, to permit replacing the landscapes through which we drive.

The increasing eventuality of assembling a machine-readable record of each edge of the road.  At the same time as roads are scanned, integrated with LIDAR imagery of the environment, and augmented with real-time feedback loops would provide a virtual 1:1 map of automative environments, in which cars could navigate autonomously–within parameters of speed limits, weather conditions, and oncoming traffic.  

Yet how intelligent are these “intelligent maps” by which self-driving maps integrate and position themselves in the space networks of roads?  As Shannon Mattern has argued, “With the stakes so high, we need to keep asking critical questions about how machines [are able] to conceptualize and operationalize space” that can recognize the human actors in space, and how the increased role of these networks of mapping serve as actants–shifting the networks of on-road behavior, or how, as Mattern puts it, “artificial intelligences, with their digital sensors and deep learning models” that perpetuate one image of space will “intersect with cartographic intelligences and subjectivities beyond the computational ‘Other'”  How will such maps, put differently, register people who also occupy the sidewalks, and the other cars on the highway (either as drivers or passengers), and how will they be effected by them?

The lack of a clear roadmap for self-driving cars notwithstanding, the eerily ghostly nature of LiDar views of streets, overpasses, and street side scenery seems to point up the absence of a sensory cartography of place. The maps for self-driving cars are not, it is true, for human subjects, and it is perhaps unfair to prejudge them or their selectivity. But despite the trust we are inclined to accord machines to reading space accurately and comprehensively, by synthesizing a total image of street conditions thatch replace the driver’s tacit sense of road conditions, as if they contain a greater precision than paper maps could hope to contain. We share amazement at the possibilities posed by mechanical sensing is, in a sense, pushed to new limits in the promises of self-driving cars, who have quickly gained multiple evangelists.

We already have cars able to signal their approach of the edges of traffic lanes, altering their human drivers of impending danger.  The promises of self-driving cars have generated increasing optimism in the United States and Japan, as the next generation of driving vehicles in a culture ready to embrace the new, perhaps because they promise the very possibility of constant motion in a country of speed.  But by removing routes of human motion and how humans move through road systems from direct intelligence, the maps that are being designed for autonomous vehicles to navigate the roadways of America and beyond suggest a new nature of space, as much as of transportation or transit:  and the maps for self-driving cars, while not designed for human readers, suggest a scary landscape rarely open to surprises and eerily empty of any sign of human habitation.

And what will even guarantee that the self-driving cars will not go off the roads?  The absence of human intelligence from the maps for self-driving cars creates a code-space that seems to depend on its interaction with human intelligence far more than its maps seem to register at first sight.  The simulated scenarios that have been created for such self-driving cars by engineers seem to seek to “provide a view of the world that a driver alone cannot access, seeing in every direction simultaneously, and on wavelengths that go far beyond the human senses,” but by nature depend on the ability to translate real-time scenarios in HD maps–as well as topological models–into the car’s actual course.

Waymo

For in promising to synthesize, compress and make available amazing amounts of spatial information and data sufficient to process the rapid increase of roadways that increasingly clog much of the inhabited world, they are maps for the age of the anthropocene, when ever-increasing spaces are being paved.  And although even after the arrival of promising “autonomous vehicles” from Tesla, which has introduced a new Autopilot feature able to maneuver in well-marked highways, and tests for urban driving by Uber, General Motors, and of course Google, the limited safety of relying only on sensors to navigate space in many areas, where vehicles are forced to integrate LIDAR, mid- and low-range radar, camera-based sensors, and road maps of real-time situations, and have difficulty calibrating road conditions and weather with the efficiency human drivers do.   The absence of a clear road map for their integration, however, is paralleled by the inability to synthesize contingent information in maps, which in their absence of selectivity offer oddly hyper-rich levels of information.

The notion of processing such comprehensive maps was far away when DARPA sent tout a call in 2003 inviting engineers to design self-driving cars that could navigate a one-hundred-and-forty-two-mile-long course in the desert, near Barstow, CA, across the desert to Prima, Nevada, without giving them a sense of its coordinates on a race-course filled with gullies, turns, rocks, switchbacks and obstacles–from train tracks to cacti–hoped to integrate GPS and sensors to create a car able to navigate space in as complete an image of road conditions as was possible.  If the rugged nature of these rigged-out vehicles recalled the first-run of a Mad Max film in their outsized nature paramilitary nature, designed as if to master landscape of any sort, they were so over-fitted with machinery were they with what seemed futuristic sensors that were tantamount to signage–

DARPAGCSa_04.jpg
darpa_cars.jpg
Poster 619x316

–to seem to wrestle with the fundamental problem of mastering spatial information that the new generation of autonomous vehicles have placed front and center.

The top-down attempt of DARPA to stage a race of autonomous vehicles, was intended to keep soldiers out of harm’s way in a military context.  But the attempt to generate a new sort of military vehicles raised compelling questions of integrating a range of spatial signs in their apparatus of machine vision, laser range-finding data, and satellite imagery, but suffered from an inability to take in environmental information–no cars completed the course, as it was staged, and the vehicle traveling the furthest went only seven and a half miles.  Even in a course that was located in the desert–still the preferred site, given the lack of weather conditions and better kept up road surfaces, to test most self-driving cars to minimize unpredicted external influence–the relation of car to world was less easily negotiated than many thought.

While the results of the DARPA grand challenge wasn’t immediately successful, although the basis it set for future collaboration between machine-learning and automotive companies in notions of remote sensing.  It placed front and center the problem remains of how to establish more than a one-dimensional picture of the road ahead of the car to navigate the road ahead most easily.  And by 2007, the Urban Challenge, invited autonomous vehicles to navigate streets of an urban environment in Victorville, Calif., against moving traffic and obstacles and following traffic regulations, in ways that lifted a corner on the mappability of the future of driverless cars, as if to throw pasta against th ewall in the hopes tht some of it would stick.  Although the new starting point of self-driving cars on a network of readable roads, equipped with recognizable signage, remains the most profitable area for development, the machine-readable road maps eerily naturalize the parameters of the roads in their content, and absent humans from their surface.  Despite the recourse to satellite photography and attempts to benefit from aerial views, the notion of a map for the autonomous vehicle was barely conceived.  But in the almost fifteen years since, the maps that are being developed for self-driving cars have grown into an industry of their own, promising to orient cars to machine-readable records of the roadways in real-time.

Continue reading

1 Comment

Filed under 3-D maps, autonomous cars, HD Maps, machine-readable maps, self-driving cars