The announcement in California of the arrival of random power shut-offs this fire season sent everyone scrambling to maps. In order to stop fires spread of fires, the impending public safety power shut-offs crashed websites as folks scrambled to get updates in real time, frustrated by the relative opacity of maps in a hub of high tech mapping and public data, as the impending possibility of power shut-offs wreaked neurological chaos on peoples’ bearings. From mapping fires, we transitioned to the uncertainty of mapping regions where consumers would lose power in an attempt to prevent fires from spreading due to strikes on live wires of broken limbs, branches, or failed transmission structures whose immanent collapse were feared to trigger apocalyptic fires of the scale of those witnessed last fires season, as the largest fire in California history raged for days, destroying property and flattening towns, burning victims who followed GPS lacking real-time information about fires’ spread.
In an eery mirroring of looking to maps to monitor the real-time spread of fires, which we sensed in much of California by smoke’s acrid air, the expectancies to which we had been habituated to consult real-time updates was transferred to the availability of electricity, in a sort of mirror image unsurprising as the outages were intended to stop fires’ spread. The decision to continue public power safety shut-offs as a part of the new landscape of controlling fires’ spread in future years–perhaps needs to be accepted for up to a decade, although this was walked back to but five years in recent years.
Expanded power shut-offs justified by needs for public safety suggest how much climate change has changed the expanded nature of fire risk. But in an era when the vast majority of televised segments that aired on network television– ABC, CBS, and NBC combined–despite an abundance of powerful image and video footage the 243 segments on destructive wildfires raging across northern and southern California, a type of public disinformation seems to have been practiced by most news outlets that served only to disorient viewers from gaining any purchase on the fires, colored by the shifting validity of climate change denial as a position among their viewing public: only eight of the news media mentions of the fires, or 3.3%, mentioned climate change as a factor in the fires’s spread, from October 21 to November 1, as the spread of fires in northern California grew that precipitated public power shut-offs. If new cycles shy away from citing climate change as a factor on the spread of fires, most of the mentions came from specific weather reporters, from NBC’s Al Roker to CBS’ Jeff Berardelli, extending the range of fire seasons and area of burn, the silo-ization of such explanations were rarely digested in mainline reporting. And if FOX ran 179 segments on the fires, more than other cable networks, climate change was mentioned in 1.7%, with most segments mocking the contribution of climate change.
If we are poorly served by the news media in reporting the fires and downplaying climate change–or indeed criticizing California for poorly maintaining its forests’ safety, as President Trump, the eery landscapes provided by PG&E raise questions about the messages they communicate.
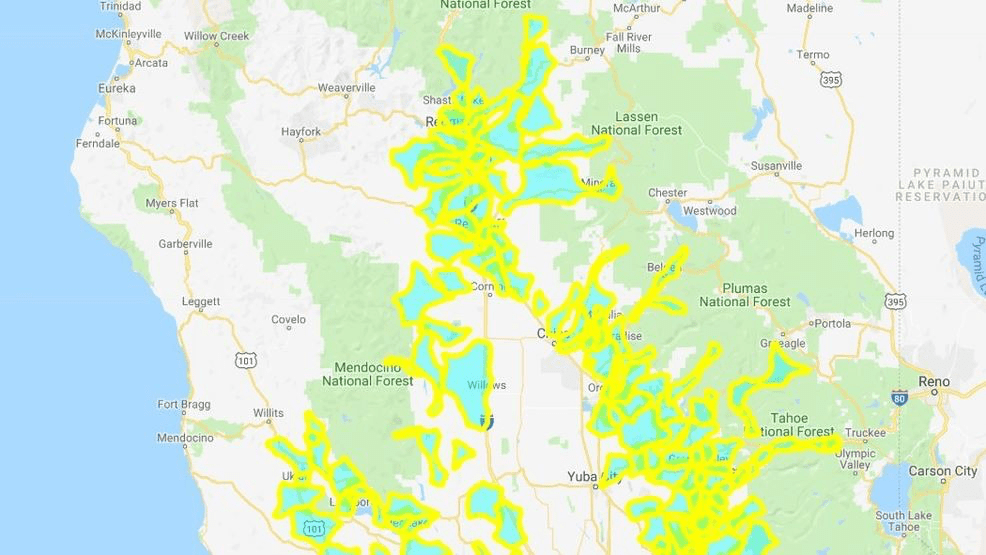
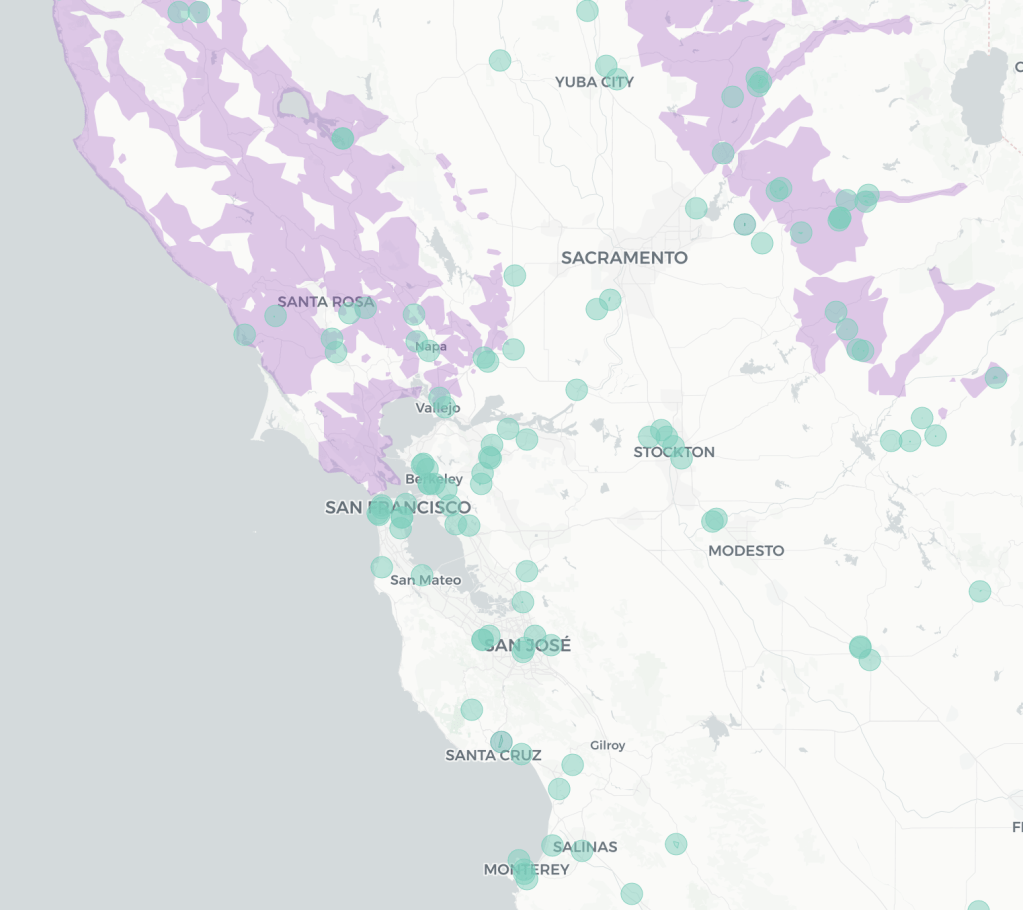
But the electric green maps of a startlingly unnatural aquamarine, yellow, and orange suggested a strange distantiation of the landscape in the age of Climate Change. The electrified hues of the maps, which monitored the possibility of customers loosing electricity in many districts, reveals a level of poor management and lack of any coherent strategy for climate change as much as the huge area that is served by PG&E, and the man-made infrastructure of electricity and transmission towers, which courts have rightly decided the privately-owned power agency that serves state residents is responsible for.
While we follow the news, even among the most die-hard news addicts, the prospect of “public safety” power shut-offs seemed unannounced and irresponsible, and a premonition of a new landscape of risk. For the shut-offs that were announced as impending by PG&E reflect a deep insecurity of fires, climate change and perhaps what we feared was a collective unpreparedness to deal with a new set of implications of climate crisis we have not even been able to acknowledge or even fully recognize, but which seemed spinning out of control–even in the nature of maps that were made of it–and to betray a lack of imagination, creativity, and foresight, abandoning the long-term view.
The sense of emergency electrifies a landscape whose woodland-urban interface is electrified by aging power structures and transmission lines, carrying increased current to extra-urban areas. And there is a fear that the long-term view is lacking, as we continue to turn to maps, even months after the first shut-offs were announced to forestall fears of a raging fire season. As we map the expanding sense of risk to respond to both demand for currently updated real-time maps for fires, and the calamitous images of apocalyptic fires raging that dominate the news cycle and make us fear the near future, or have a sense of living with a deferred sense of emergency at our doorsteps. And so when we received a text message of impending loss of electricity, we turned en masse to maps to learn about outages at risk, alerted to the need to ready ourselves as best we could by our local government-
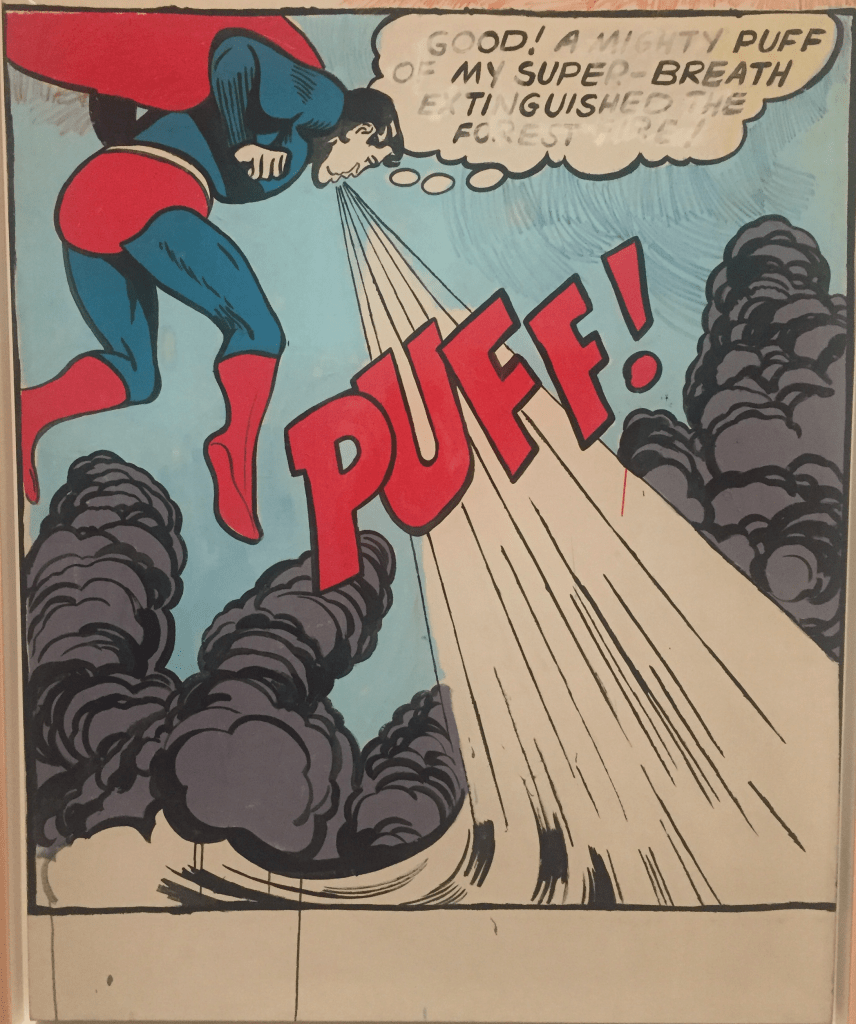
Extreme fire prevention funding, precarious in the Trump Era, stands to be abolished as the Dept. of Interior retreats from federal fire programs: the Wildland Fire Office, funded at $13 million in 2012, if slated to be abolished in the Trump era, in an agenda denying climate change, lacks funding, undermining close scientific examination of a new topography of fires, even as climate change has increased the costliness of fires and the ferocity of their spreads. If the costs of the Camp Fire of 2018 grow beyond $10 billion–or over six times as much as the Oakland Firestorm of 1991–those costs and the cost of insurance liabilities only stand to grow. As we confront poor planning of climate readiness, as we lack real images of extinguishing fires’ spread–and imagine the temporary shut offs can intervene as a deus ex machine to prevent fires’ spreads all we have to forestall the fears of spreading flames and intense firestorms or whirls.
In the Bay Area, where I live, the danger of the new firescape is so pressing, and so impossible to process, that we can only digest it as a danger that is ever-present, akin to living in an active seismic area, but we cannot process in a static or dynamic map.
But this is an area of risk that we are living cheek-by-jowl beside in ways that are truly unfathomable. As the power shut-off zones have been expanded in clearer detail by PG&E in response to the growing gustiness of winds that threaten to compromise the safety of residents as well as the aging electric infrastructure of the state, we are oddly haunted by past promises to maintain or upgrade our national infrastructure–the promise to rebuild national infrastructure was itself an energizing call of the Trump campaign–only to be demoted by being assigned, with improved veteran care, the opioid addiction, workforce retraining, and the Middle East peace to Jared Kushner, in ways tantamount to moving it to the way back burner, soon after being mentioned in the State of the Union as a non-partisan issue in January, 2018.
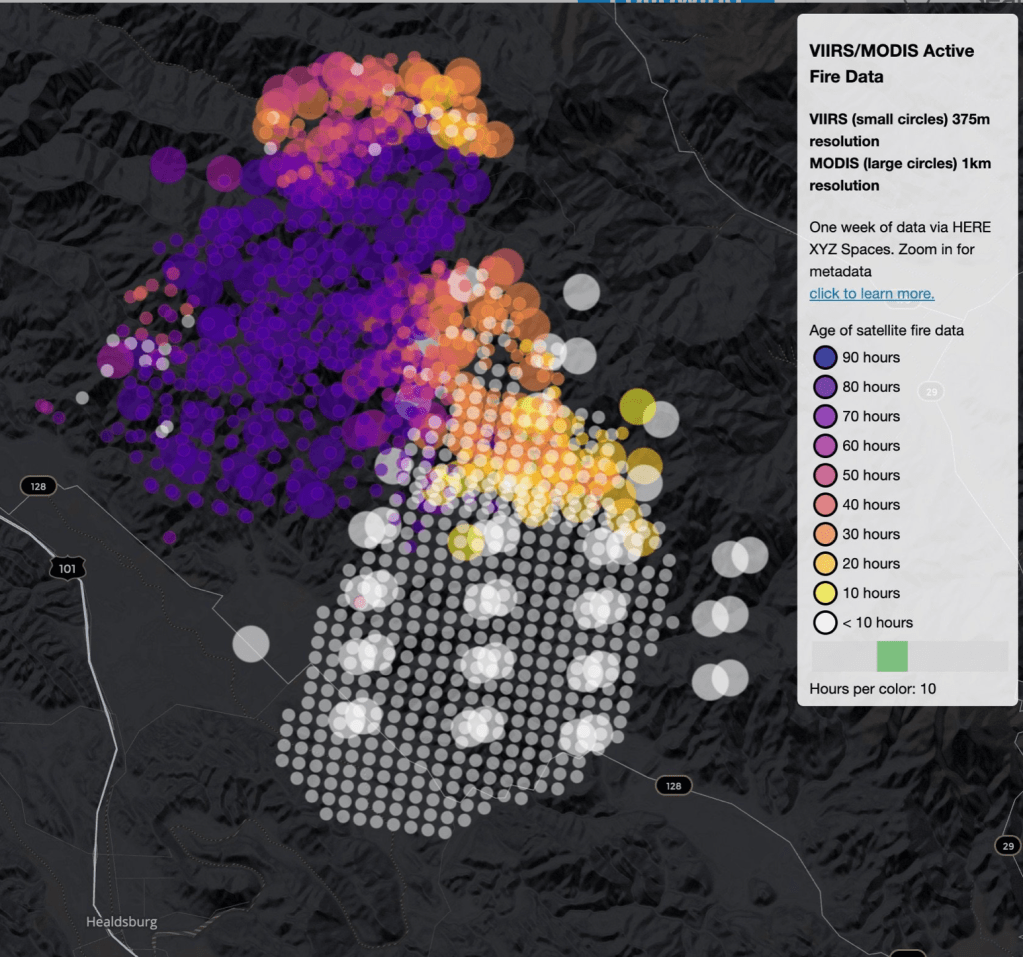
And yet, the spread of fires with increased rapidity, across landscapes that remain highly flammable, has created terrifying imagers of a highly combustible landscapes, where the recent growth of fires–in this case, the Kincade Fire that did began only long after the shut-off policies began–chart the spread of fires across terrain multiple times larger than cities, moving across the landscape rapidly, driven by unprecedentedly strong offshore winds: the passing overhead of satellites charts its expansion, making us fear the expansion of the next pass overhead as realtime images of the durations of fires only grows.
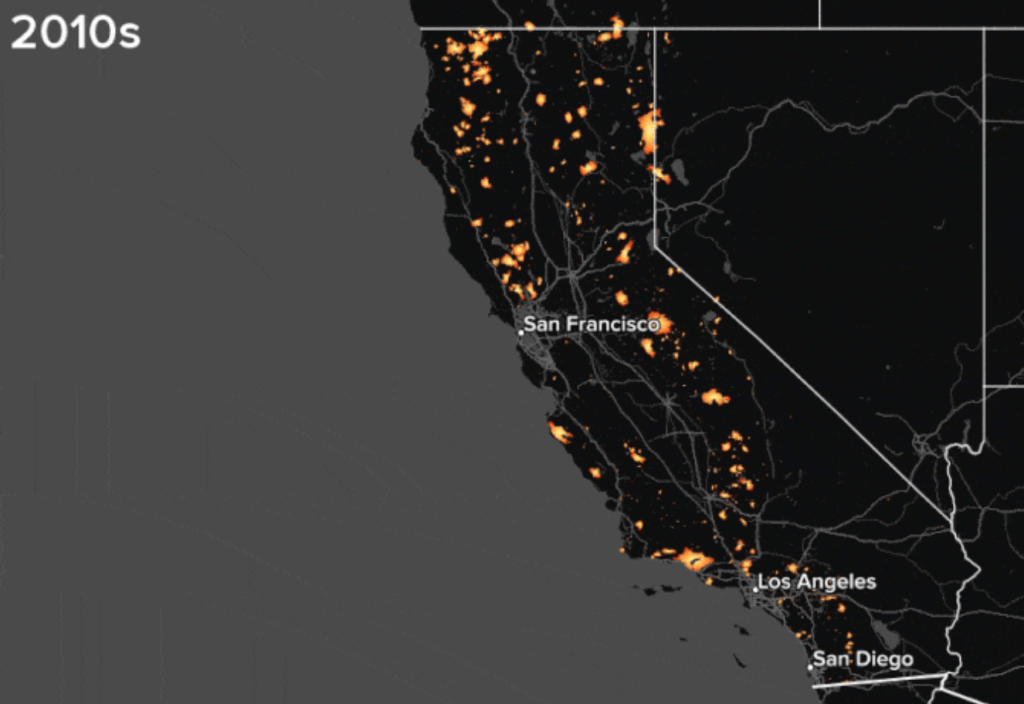
Sure, the current landscape had long seemed to be burning up at a rate we had not begun to adequately acknowledge–as Peter Aldhous promptly reminded any of us who needed reminding in Buzzfeed, providing a GIF of CalFire’s data of areas of California that had burned since the 1950s, decade by decade, in an animation of red bursts of flames atop a black map, that seemed to eerily illuminate the state by the 2000s, and hit much of the north by the 2010s, as they close,–illuminating fires as a state-localized crisis–
Peter Aldhous for Buzzfeed from CalFire and frap.fire.ca.gov
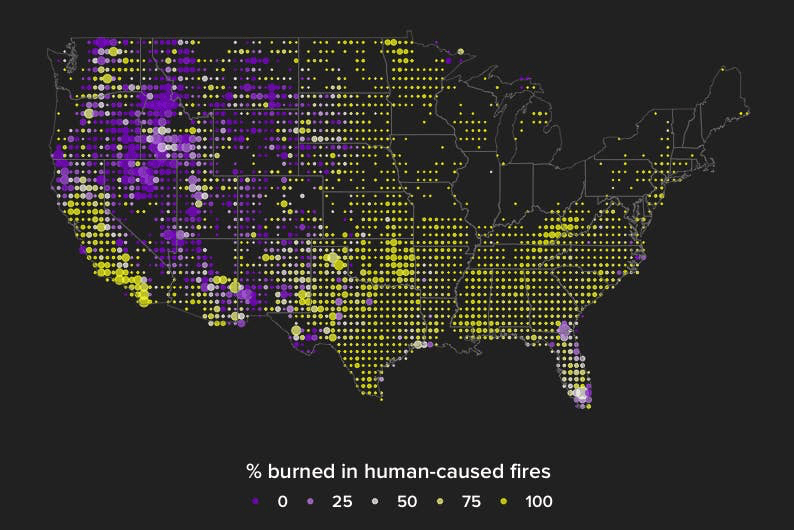
but the scope of human-caused fires that have consumed land, property, and habitat are a truly endemic crisis in California, he showed, in ways that he suggested reflect a parched landscape and the uptick of human-generated fires that are a direct consequence of climate change, especially in a region of increased residential construction. This sense of illumination places a huge onus on PG&E for its corporate responsibility, and the very notion of distributing electricity and power as we once did,–and illuminates the imperative to think about a new form of energy grid.
Indeed, the parsing of “human-caused fires” as a bucket suggests the real need to expand the classification of wildfires. Whereas most earlier fires were caused by lightening strikes in the western states, the expansion of housing and electricity into areas suffering from massive drought–as if in an eery reflection of the spread of “slash fires” across the midwest during the expansion of railroads that caused a rage if firestorms coinciding with World War I–press against the category of fires as wild. The deeper question that these maps provoke–as do the data of Cal Fire–is whether the term wildfires is appropriate to discuss the hugely increased risk of fires that damage or destroy property and land.
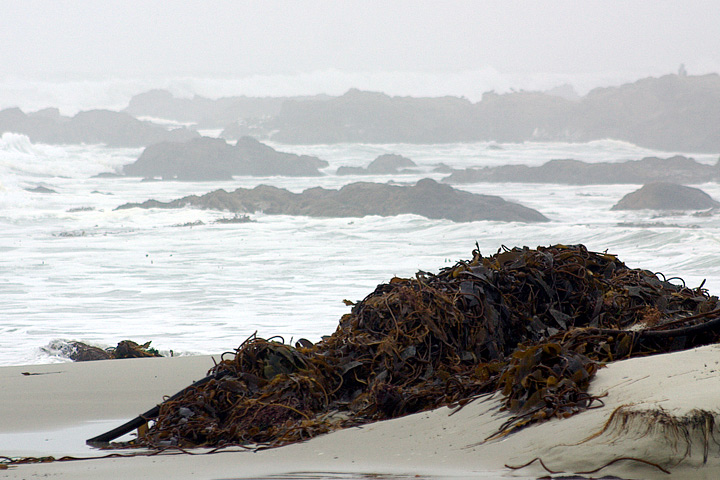
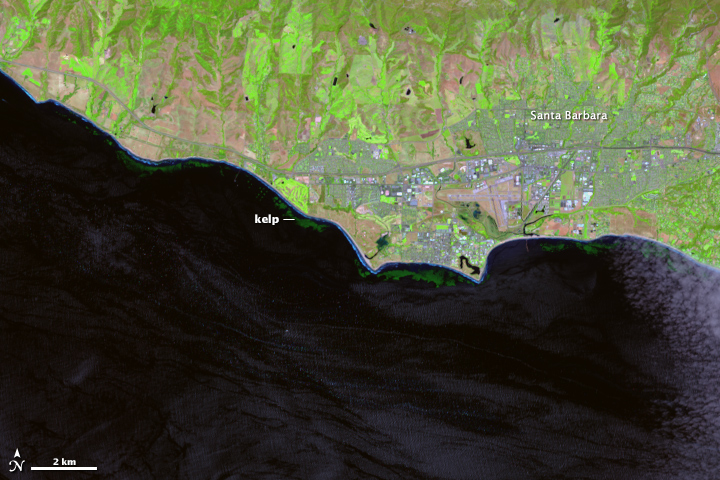
We can all too easily lose sight of the centrality of seaweed plays in coastal habitat–even in Northern California, where seaweed washes up regularly in clumps and beds along the shore. Bull kelp and other marine plants on the sandy beaches of northern California seem otherworldly representatives of a removed marine world, but their proximity is revealed in remote mapping that promises to remap the role of seaweed in coastal ecosystems, and offer a picture of the terrifying prospects of ocean warming and climate change.
The relatively recent contraction of kelp forests across much of the offshore where they long provided such dense habitats may soon start to contract in ways never before experienced. The remapping of kelp forests, and the problems of their contraction of treasured habitat, reveal how much coastal waters demand to be seen not as so separate from the land, but part of a complex ecotone–a region where land and sea interact. Underwater species impact a large ecosystem that provides atmospheric oxygen, integral to coastal biodiversity that imparts a specific character to the California coast, and a sense of where we are–as well as makes it a destination for countless Pacific pelagic, shorebirds, and insects, as well as shellfish and fish. But the decimation of kelp forests, tied to an absence of predators to urchins, but more broadly to the ocean warming of coastal waters, as well as potentially an unprecedented increase in coastal pollution, makes both the mapping of the shrinking of kelp forests and the deciphering of that shrinking pressing problems of mapping, destined to impact a large variety of ocean and land-dwelling species.
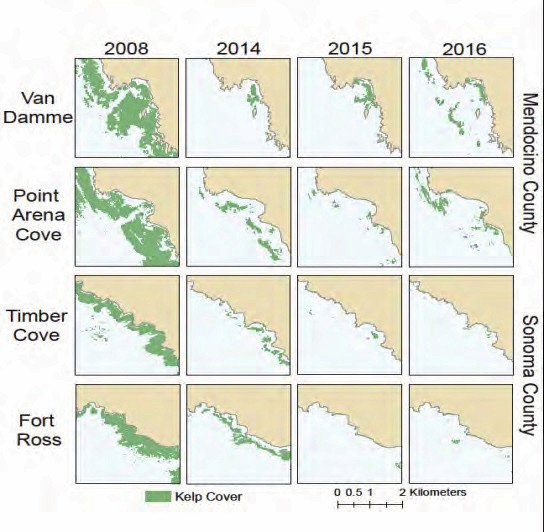
The need for such mapping underscores all of our relation to the vital ecosystem of the shores and coastal ocean–even if we too often bracket it from our daily lives. While beached kelp may be present before our eyes, the problems of mapping of kelp forests with any fixity complicates how we process the disappearance of offshore kelp beds in an amazingly rapid timeframe. And the failure of creating an actual image capture registering the extent of kelp forests poses limits our awareness of their diminution off coastal waters. The observations of the shrinking of coastal spread of bull kelp is based on local aerial surveys, over a relatively small span of time, the accelerated roll-back of a once-vital region of biodiversity is both global, and demands to be placed in a long-term historical perspective of the way we have removed the underwater and undersea from our notion of coastal environments and of a biosphere.
Bull kelp forest coverage at four sites on the North Coast of California,from aerial surveys (California Dept. of Fish and Wildlife)
What was first registered in the plummeting of abalone, and the wasting disease of sea stars, afflicting stars from Baja to Alaska in 2013, suggest a condensation of a radical change in near-coastal environments of global proportions, paralleled by the arrival of warm waters that are not conducive to kelp growth, even before El Nino, and before the the arrival of purple urchins whose levels stars controlled, as if the result of cascading effects of a tipping point atmospheric change.
The quite sudden growth on the ocean floor of “sea urchin barrens,” where the near coastal waters are cleared of seaweeds and kelp, is a global problem. As global oceans absorb warmth of increased global warming, near-shore environments are particularly susceptible to species changes that create large disequilibria–from the bloom of phytoplankton to the rise of purple sea urchins and the dearth of shellfish–that stand to change coastal oceans. Yet the same creatures are often ones that fall of outside of our maps, even if the presence and scale of massive kelp beds and submerged forests are hard to map. And even if we see a shrinking of the large undersea submerged beds of kelp off coastal California, it is hard to have clear metrics of their shrinking over time or past extent–or of intervening in their reduction, which we seem forced to watch as inland spectators.
Indeed, if the presence of coastal seaweed, and the distinctive kelp forest of California’s coastal ocean seems the distinguishing feature of its rich coastal ecology, the holdfasts of kelp forests that are grazed down by sea urchins and other predators are poorly mapped as solely underwater–they are part of the rich set of biological exchanges between the ecotone of where land meets sea, and ocean life is fed by sediment discharge and polluted by coastal communities, as much as they should be mapped as lying offshore, at a remove from the land. Yet the death of beds of kelp that is occurring globally underwater is cause for global alarm.
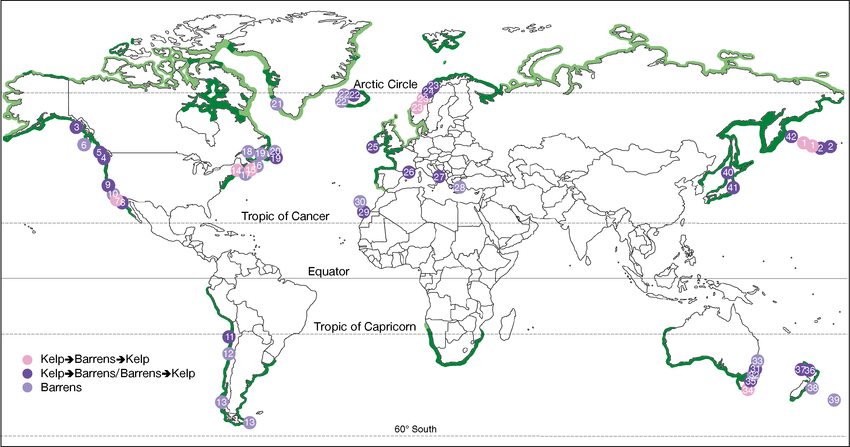
For from Norway to Japan to but the decline of natural predators of urchins in California has made a rapid rise of urchins on the seafloor along the coast have contributed to a shrinking of once-abundant kelp forests that produce so much of our global atmospheric oxygen. And these hidden underwater changes seem destined to rewrite our globe, as much as climate change, and threaten to change its habitability. Even as large clumps of seaweed are removed by powerful waves, that deposit piles of offshore forests ripped from holdfasts on beaches in northern California, the narrative of large coastal kelp deposits, their relation to climate change and coastal environment demands to be better mapped, as the transition of kelp to barrens afflicts so much of the coastal waters of the Atlantic and Pacific, at so many different latitudes and across such a variety of local cold water ecologies.
While the decline of kelp forests seems as radical as the clear-cutting of redwoods, it is both far more rapid and far more environmentally disruptive, if far less visible to the human eye.For in recent decades, increasingly warming waters and out of whack ecosystems have led to a massive decline of seaweed, decimated by a rise in the sea urchin population to by 10,000 percent off the California coast over only last five years, shrinking kelp forests that stand to catapult us to a future for which we have no map. The long-term decline in sea otters and sea stars, natural predators of the urchins, have removed constraints on urchin growth, which warming waters has encouraged, reducing a historical abundance of kelp in the near coastal waters across California.
This has perhaps been difficult to register due to the problems of mapping seaweed, and indeed registering kelp forests’ decline. The advance of sea urchin populations that have created barrens in coastal waters stands to disrupt and overturn some of the most abundant ecological niches in the global oceans. How has this happened under our eyes, so close tho shore and lying just undersea? We have few real maps of seaweed or kelp, lurking underwater, rather than above land, and leave out kelp from most of our maps, which largely privilege land. But the abundance of kelp that produce most of the global oxygen supply live in underwater ecotones–sensitive places between land and sea, in-between areas of shallow water, abundant sunlight, and blending of land and sea–an intersection, properly understood, between biomes, on which different biological communities depend.
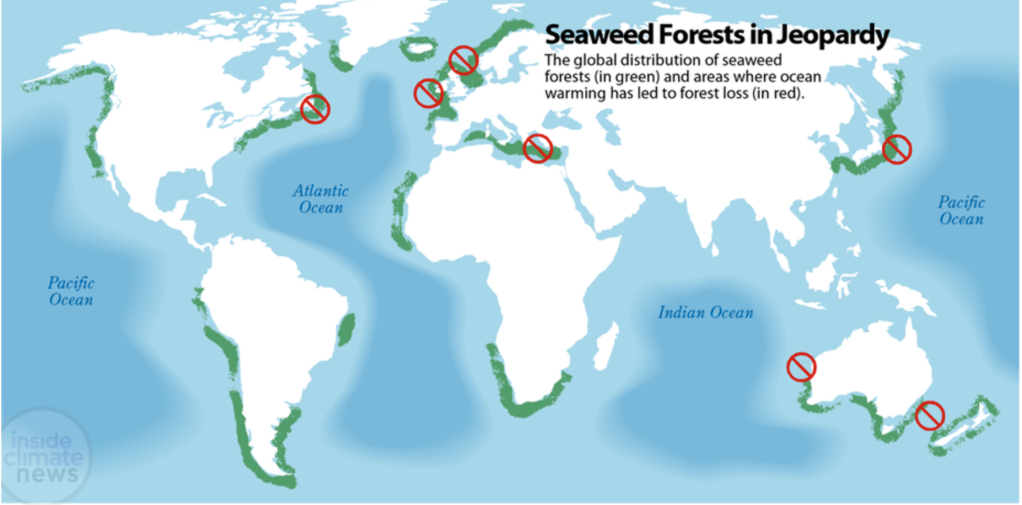
Looking at the offshore seaweed near Santa Cruz, CA, I wondered if the predominantly passive registration of location–onshore registration of sites remotely by satellites, familiar from the harrowing images of the spread of fires, provided a basis to register our states of emergencies that was spectacularly unsuited to the contraction of coastal kelp, despite the huge advances of mapping techniques, and left us without a map to their contraction, or to register the subtle if radical consequences of kelp loss, and the almost as devastatingly rapid progress of their advance as populations of urchins have mowed down underseas kelp beds. For even as we strike alarms for the the decline of global kelp populations and seaweed forests as a result of the warming of offshore temperatures that place the near offshore regions at special risk of atmospheric warming–
Paul Horn, Inside Climate News/Source Wernberg and Staub, Explaining Ocean Warming (IUCN Report, 2016)
–we lack maps of the place of seaweed and kelp beds in their ecotone, and indeed have no adequate maps of seaweed populations under threat.
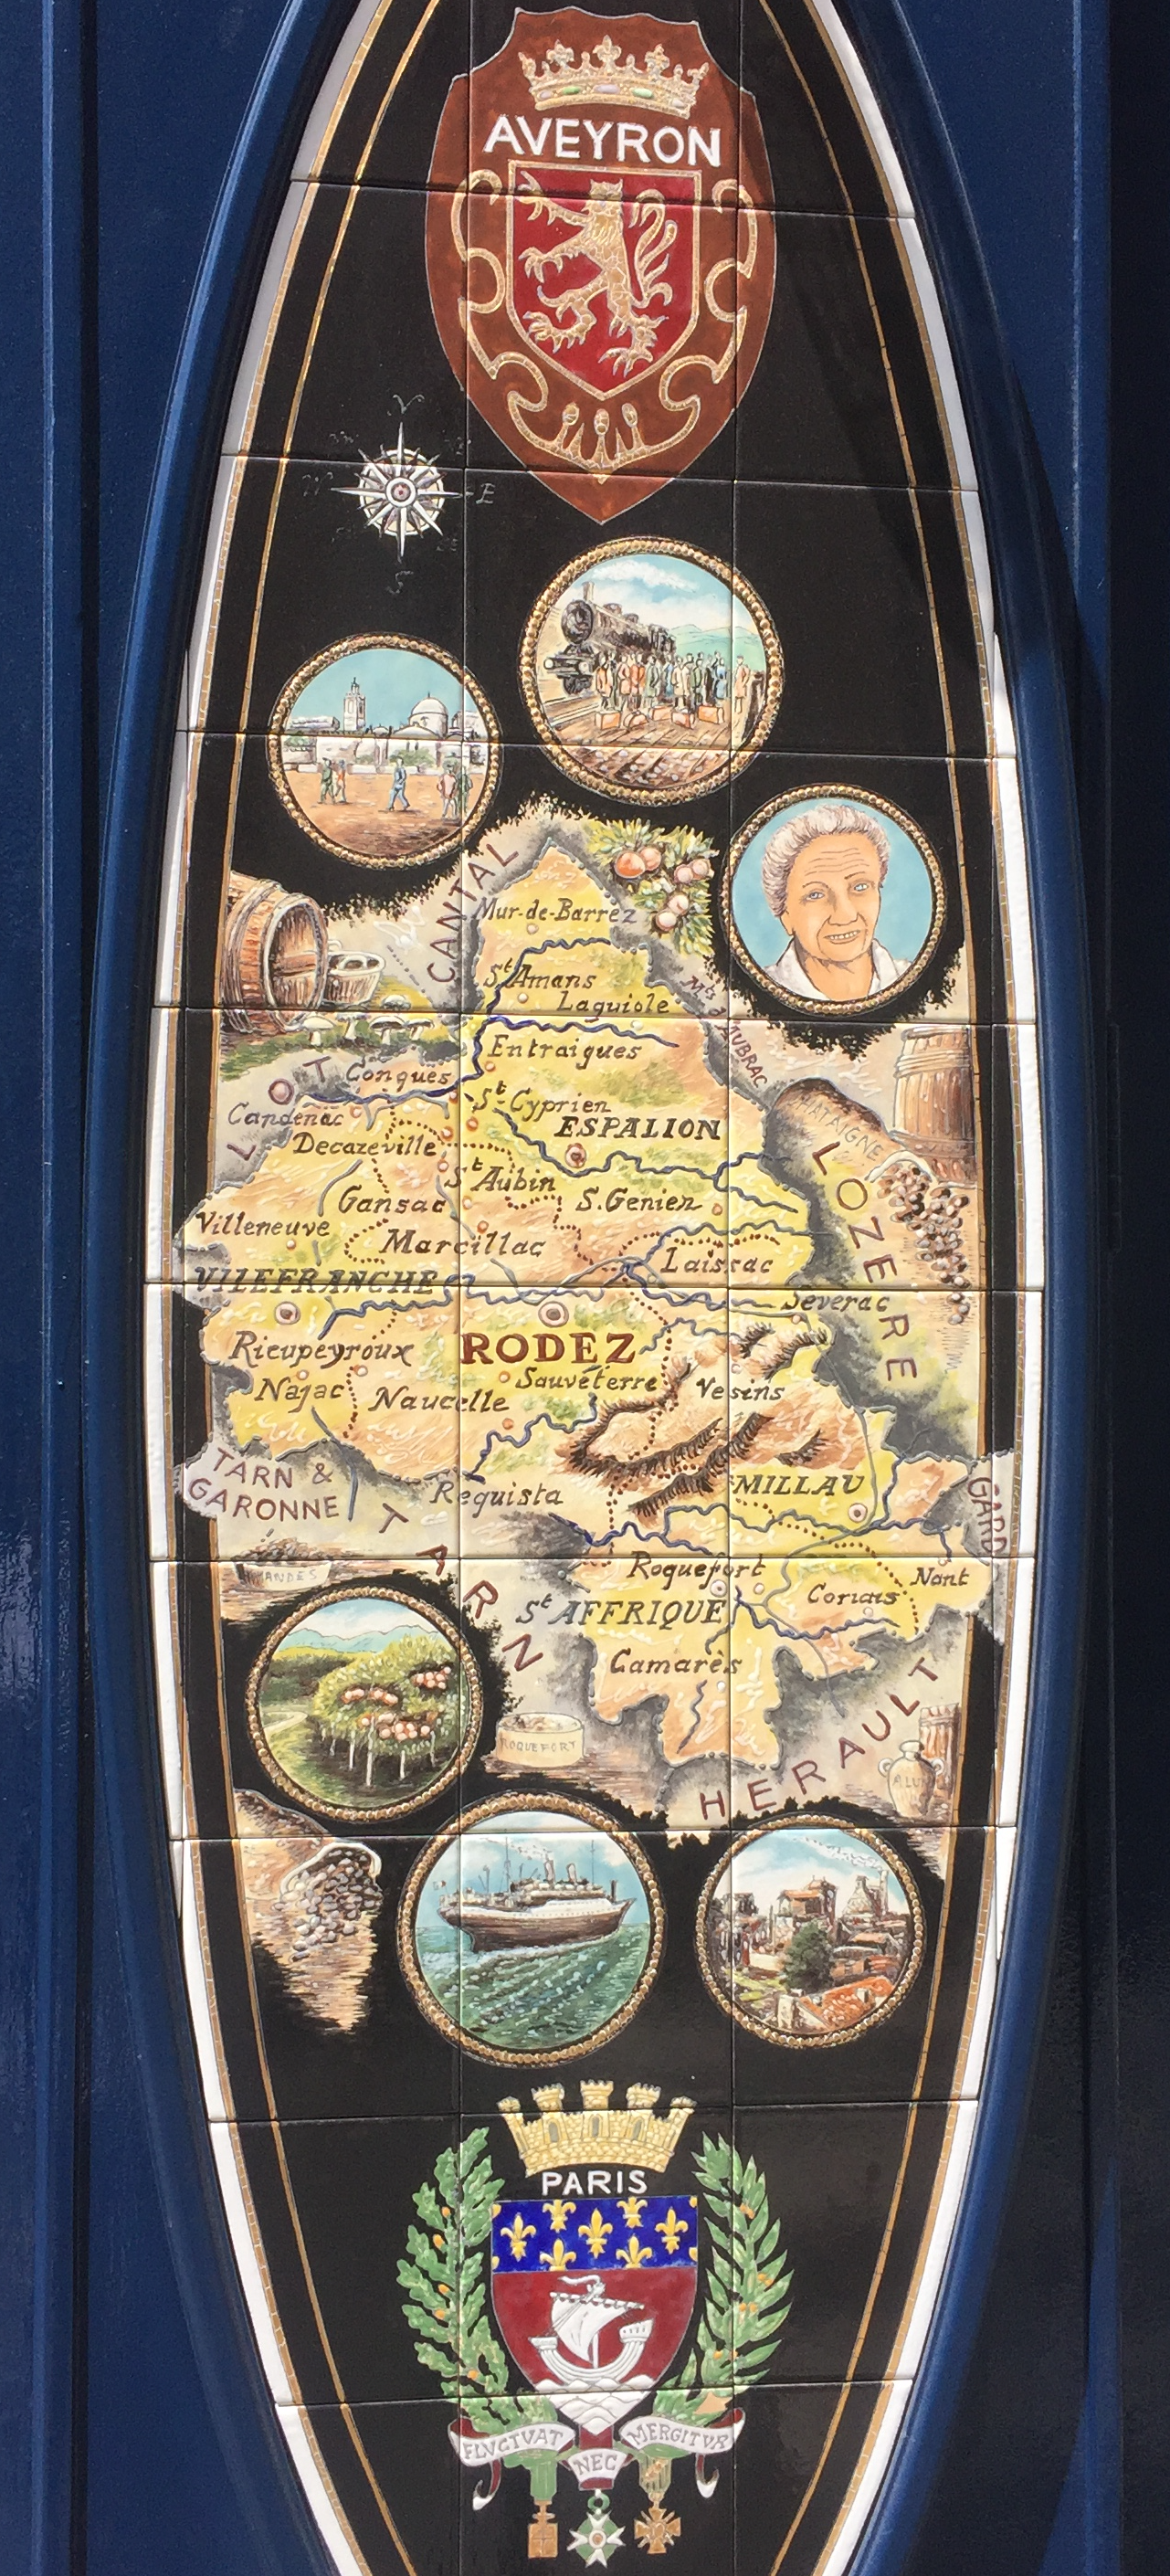
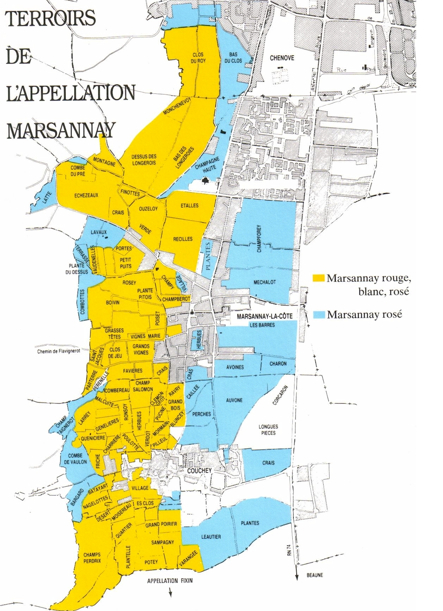
How to spatialize the taste of wine is perhaps less important than the legal grounds of defining who has a right to produce wines of a given name. But the wine map has become a genre in its own right to link the sensory experience of wine-tasting with the geography of place. Especially in an increasingly homogenized spatial landscape, the preservation of place and locality–denominations or appelations–that guarantee the specificity of wine-quality by not only a legally defined and protected classification of geographical indication, but a preserve a sense of the landscape as defined for wine-growing. While the notion of a “terroir” is not exclusively dedicated to wine by any mens in France–one might speak as well of the “quality of the terroir” of cheeses, meats, or other local foods, assimilating them to the earthiness of the map–
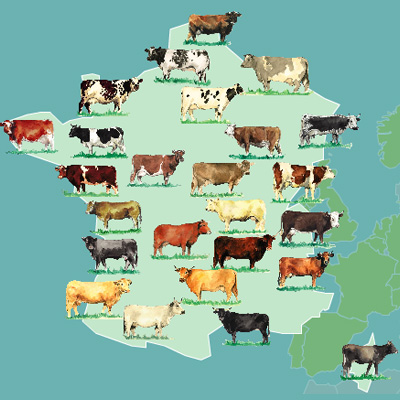
–and indeed of any region, showing the produce as indigenous to the quality of the earth, tied to each region of France, as if the earth had produced the produce of the region without human help–a sense that was enouraged by the individually embodied depiction of each region as the Fons et Origo of its produce, people, and crest.
–the definition of “terroir” has been appropriated and adopted by California wind-growers to define their place within a geography of enological status in recent years. In an age of globalization and web-based maps, the artisanal notions of cartographic authorship are mined to the max in hand-styled maps of the regions of wines, foods, and and cheeses, or of traditional knives, that proliferate in the mapminded culture of France. Even the authoritative maps of the Loire Valley meld their scientificity with the sophistication of the appelations of burgundies, as the name of France is itself almost less legible, or on just too grand a scale, for the readers of the varietals of the Loire Valley, or Val de Loire, a region that assumes primacy as a center of visual attention, exploration, and savoring that seems designed to translate to the palate, as much as eye.
The recent imagery of the California’s wine productions using in barrels and clusters of grapes in an old tourist poster of the state for San Francisco’s Wine Advisory Board in ways that beckoned visitors to rural areas of the state, distanced in their symbology from AAA maps of the region’s roads and even from motor travel, but seemed to transport one to a land of barrel-rolling and wine-sipping that recast the state in predominantly rural terms where wine-growing occurred exclusively in a set bucolic regions removed from urban life. Indeed, the transformation of Napa region to a “wine country” that is removed from the city and industry–even if San Francisco is hardly a City of Industry–
–but rather one of relaxation, an alternative world to discover that lies close at hand, and indeed that beckons. The tacky directional orientations in such pictorial wine maps from regions as the Napa Valley suggest the arrival in a bucolic space, free from cares, where the presence of instrumentation is absent from the natural nature of tools of directional orientation, in a region of the world where the very surface of the map is besotted with grape juice or wine.
While selectively omitting any sense of urban settlement or indeed automotive conveyances, the Wine Advisory Board seems to have been designed to seduce visitors by the cartographical vignettes of relaxing workers and relaxed banjo-playing, in ways that naturalize the wine-growing as part of the landscape in order to boost local wines an era when California reds were often cast as the poorer cousin of fancier French wines. To make the point that the state was so nourished by the year-round sun to be the land of wine-growing, oak barrels are plentiful from Santa Clara up past Mendocino, in an alternate tourist map that suggested how wines themselves transported one to the vineyards of the California countryside. There was a time when the bounty of wine harvests in Northern California led the region to be cast as a site blessed by vineyards and grape harvest, where the light of the sun distinguished the Napa and Solano Valleys or the grapes of Sonoma as winemaking towns in a predominantly rural idiom.
But more than any other impression, one can sense by the map’s vintage that oenology is not, in the American West, at this time a refined science, so much as an almost rustic pursuit, destined for tourists and removed from the pressures of urban life: much as the wines are themselves able to transport one to an idyllic rural setting, removed from race, class, work, and urban congestion, to a landscape in which one might leisurely repose. Little sense of knowledge about wines seems important.
But the times have changed, as they often do, and the rise of the Napa regions are in the course of placing themselves on the map, as if to update the criteria for rustic travel and enological tourism, to respond to how California wines are appearing a global market for wines, and to place the region on the map in a way that it once never was. The precision of classifying terroir has migrated to northern California, and done so to secure California’s place on a global wine market, to authoritatively define its place in relation to the scientific standards of wine that are used world-wide to ensure in vino veritas, or at least identify with security the provenance of the wine as a basis for its quality. The objective authority that maps bestow on products is a novelty in northern California, but the scientificity of mapping, chemical analysis and secure ranking have become terms of economic validation.
1. For in California, the notion of terroir is absent. Indeed, the precision or authority of the claims of individual growing regions of viticulture that has become so important in recent years was long completely absent. The division of such divides reflect–and have common origins with–the proliferation of descriptors that are usually blamed on Robert Parker, who enriched the descriptive language of wine-drinking with terms as acidity, astringency, jamminess, balance, and oakiness who also bequeathed the notion of “intellectually satisfying” wines to underscore the discriminating judgement involved in tasting good wines that so effectively remapped wine-drinking as a learned intellectual experience to bring it out of the rural land in which much California wine-growing was long symbolically enshrined.
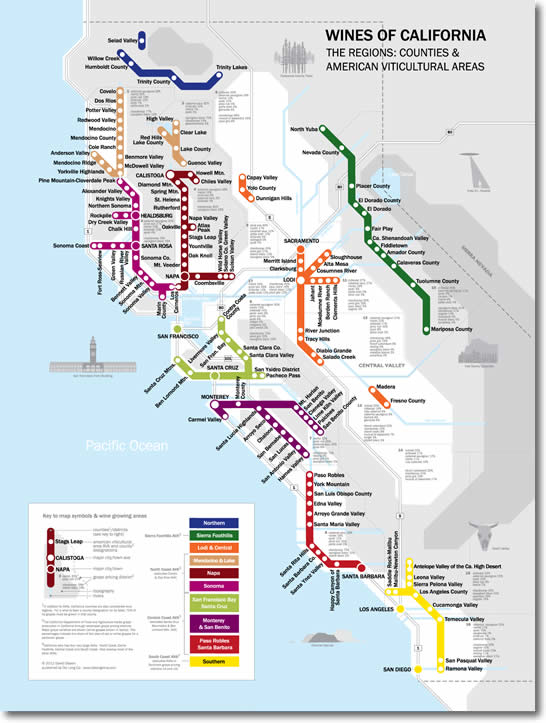
Claiming his place at the avant-garde of bucking this trend in cartographical symbology, northern California-based oenophile David Gijsen recently returned to the mapping of northern California vineyards and varietals in recent years. Gissen followed the recent trends in mapping mass transit when he decided to remap his adventures in wine-tasting to distinguish his adventures in wine-tasting in the region, and cleverly adopted an image familiar from public transit to suggest how California wine-tasting has become a new mass-experience, tied to how we experience the wine-growing regions of the state. Rather than employ the agrarian images of bountiful vineyards, his symbology shifted the metaphorical rooting of a wine’s terroir in a bucolic agrarian setting of the vineyard. And in place of evoking (and romanticizing) bucolic fields of grapes, his map charted vineyards to reflect the dominant destination of wines’ identification for an urban audience who traveled to the nearby Napa Valley to experience its wines at first hand in ways that communicate the crowded weekend highways filled with pleasure-seeking wine-tasters, as much the countryside.
Indeed, the genre of viticulture maps that designate terroir serve to orient customers of wine–and have they long done so–to the basement cellars often located in urban restaurants or wine stores, as if to make them feel invited into the specific regions that they were grown. As much as symbolic declarations of denominations, the maps of wines offer virtual imagined itineraries of tasting the fruits of specific regions. And they offered a basis to distinguish an urban audience’s virtual wine tasting–and indeed to privilege the unique terroirs of an individual region’s viticulture. Gissen’s iconographic punning on Harry Beck’s 1931 design of the London underground as a circuit registers–perhaps unintentionally?–a longstanding English taste for cross-channel eno-tourism and wine tastings in the Loire valley and Bordeaux regions–as well as registering the rich colors of French wines.)
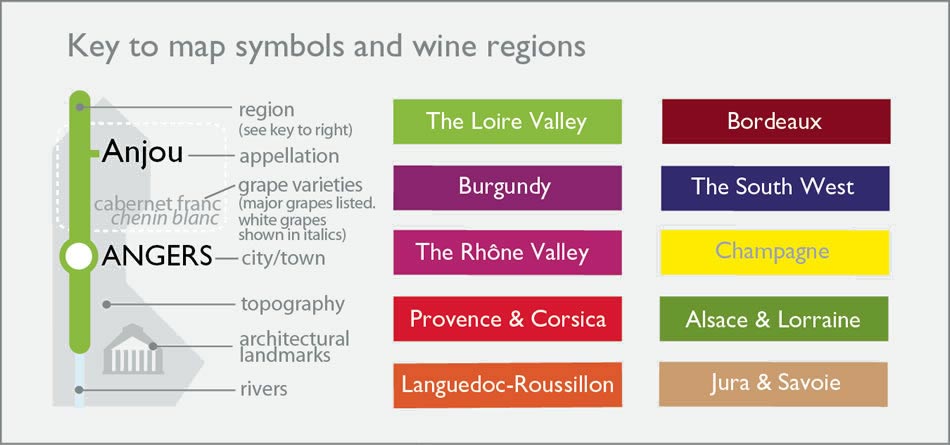
The legend alone is worth the price of this map, available on-line from Amazon.com, links city, town, region and oenological appellation in a handy cheat sheet and endearing tourist guide:
Gisssen made good on his credentials as an architectural theorist in order to map the local California wines with a very welcome sense of humor–a sense of humor all the more welcome given the disproportionate weightiness and serious stakes that is often associated with the mapping terroir. Terroir is, at base, an economic reality for wine producers. But the tourism of wine tasters is increasingly part of the travels to vineyards and tasting houses, and their experience is increasingly reflected in maps of place–they are, indeed, among the most common audiences for these maps. In shifting the demarcation of regions to boost trust in the origins of provenance of a given region’s wines, Gissen reflects an urbanization of most wines’ market and (without stating it too openly) reflects the re-marketing of the terroir map as something of a guide to local wines: yet, as Gissen notes, “the urban sense of wine has yet to receive a visual language” outside of pastoral aesthetics of most terroir, and he seeks to offer one.
2. Maps have long served to perpetuate the mystification of terroir by tying the identifying characteristics of wines to terms easily recognized by an audience of consumers. Of course, the practice mapping regional terroir derives from the French system of Appellation d’Origine Contrôlée (AOC), now widely adopted in other wine-producing countries to precise the geographic location of grape production. The currency as an index of quality (and fetish) that terroir has acquired–and how it has been mapped to other regions as a sort of patent or fair-use standard of appellation–suggests a sort of viticultural zoning and essentialization of provenance.
Charting terroir demands an intense attention of the interaction of vine and environment based on creating a public record of long-cultivated local expertise of agricultural ecosystems–even if this sounds like a contradiction of sorts: the sense of where you can cultivate grapes, or whose land is used for viticulture, reflects a historical messiness that territorial bounding of a set of fields dignified with one wine-type can’t really reflect. The reduction of wine-types to the production of a given region, while intended as a protection for the producer to combat fraud, is often essentialized, leading to the widespread display and currency of terroir maps in wine stores that reflect on the consumers’ interest in selective drinking as a sign of social distinction; in other terms, the concept of terroir, derived from “terre” (and territoriality) confers cultural status to a wine’s taste–and effectively elevates the price one is willing to pay. The notion of appellation is less about contiguity or clear cultural divides, however, than the sorts of soils and climates that serve best to define a wine making practice and taste, even as these are cast in apparently objective terms in a culture that privileged a univocal authoritative cartography.
To be sure, the notion of a transparent mapping of “one wine, one region” seems informed by the administrative mapping of a gastronomic landscape that mirrors the division of France into discrete administrative Départments, which it sub-divides and refines.
One possible ancestor of the mapping of terroirs is the great prototype of statistical mapping of regions which provided Parisians with cuts of meats, which Charles Joseph Minnard charted among other dense representations of data on the spaces for national commerce that included statistical maps measuring how railways created a network commerce and or rivers were used as basis for the fluvial transport of goods. To describe the relations of the provinces to Parisian markets, the bureaucrat Minnard distinguished both the sizes of multiple pie charts and their slices in this 1858 map to parse the meats arriving from different livestock into discrete administrative regions, which similarly tried to reconcile the notion of meat production with the rationality of the départments:
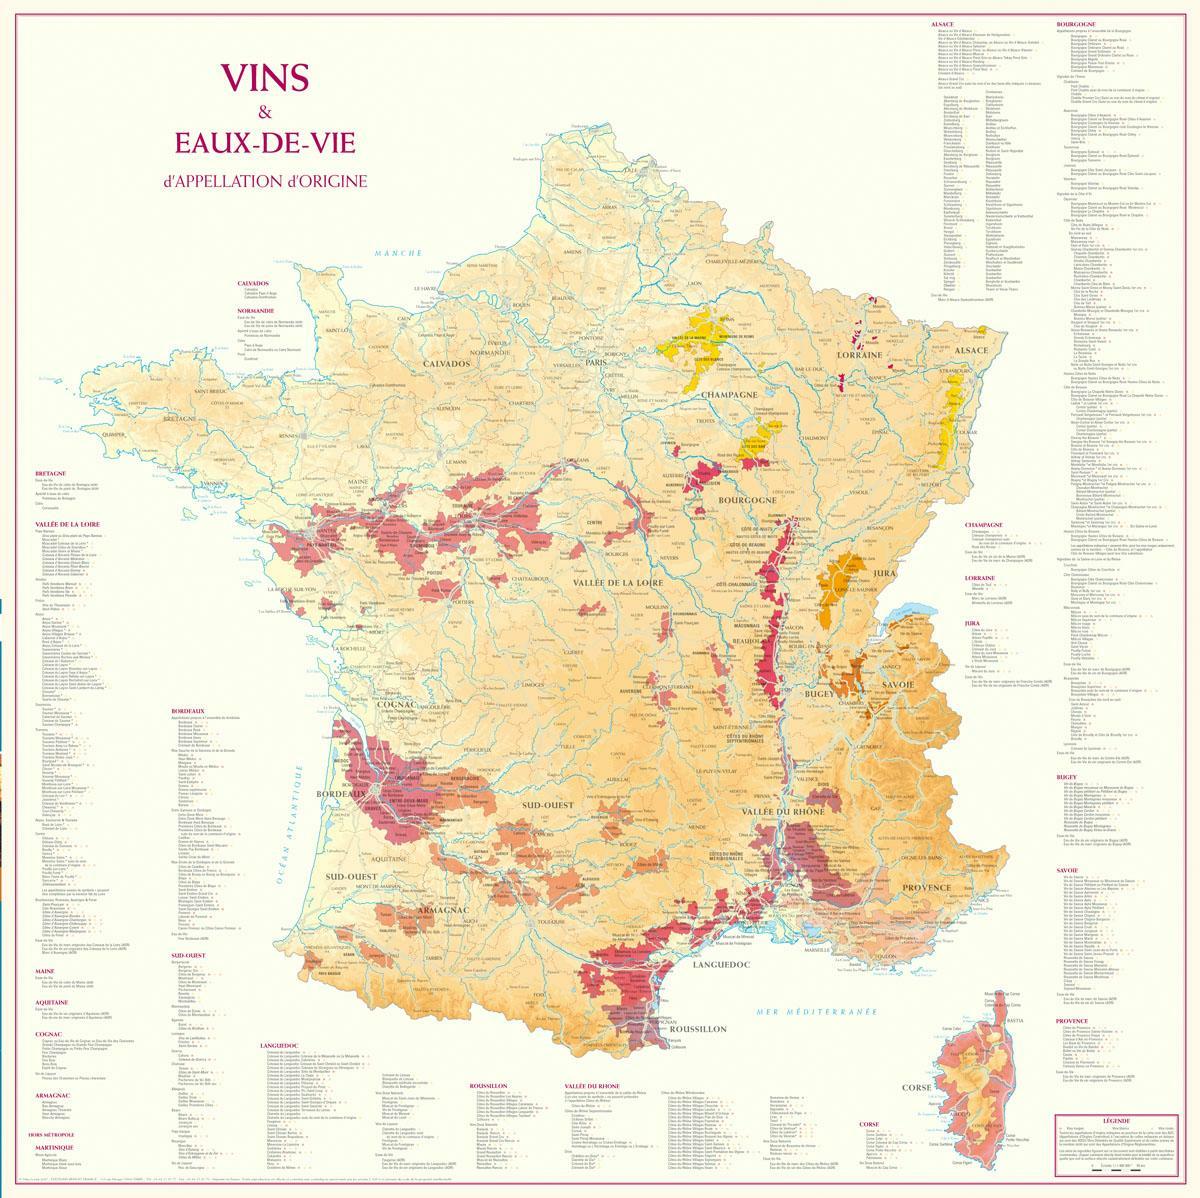
There is a similar mapping of economic exchanges rooted in a combination of microeconomics and taste in terroir maps. But the maps aim to create a social compact for an economic transaction that has yet to occur: the mapping of terroir was conceived in response to expanded consumption, as a cartographically refined register to track the authenticity of production of goods by crafting a graphic compact against fraudulent wines that protected the local vintner, rather than a statistical record of economic exchange. To be sure, the diversity of France was long predominantly cast not in linguistic, but agricultural terms, adding a special significance to the appreciation of terroir as a cultivated taste, and an appreciation of localities, tastes, and privileged access to individual regions, as much as a sense of local boosterism. The agrarian diversity of France was often cast in terms of bounty–the area of the nation that was without farms seems smaller than the regions dominated by cereals, but the areas of deep pink where vineyards grow, are distributed through broad swaths of the nation, if the largest continuous cluster is, famously, in the south–site also of the dominant vegetables of tomatoes and carrots.
–but the terroir of vineyards reflects a geographically specific denomination, leading to a discrimination of the discrete localities by which the most savored wines arrived on a national, and increasingly global, market. But the globalization of terroir antedates its legal formulation in the French nation, and the tenacious grip of what seems a sort of enological copyright on a broad market for champagnes, and the tenaciousness of local growers to brand an increasingly broadly marketed appellation that they felt the need an economic imperative to secure .
The 1908 definition of the terroir of Champagne set a legally binding definition of how the bubbly could be marketed under that name. The definition set something of a benchmark for truth in marketing to fix authenticity of regional wines widely adopted to affirm the usurpation of any name outside the appellation–and reflecting to widespread trust in the objective truth of maps.
The hope for graphically affirming how appellation was wed to territoriality, analogously to the frontier of a state, may reflect a trust in the civil service, as the Minnard map does. But the format of mapping terroirs created lasting and continuing problems in the essentialization of the qualities of a wine’s taste. The mapping of terrors provided an affirmation of difference and distinction, even when such variations as weather, humidity, shifts in soil quality, sunlight and a panoply of ecological factors themselves resisted clear mapping: legislation culminated in the establishment from 1927 of formal recognition of the limits of viticulture, grape-harvesting, and pruning of vines within fixed boundaries that recognized the limits of provenance linked to approximate understandings of atmospheric character, quality of soil, and, in the case of Champagne, chalkiness. The region of Champagne was mapped to define the distinctive region of finer deposits finer and more porous limestone soils, by limiting Champagne vineyards to some 15,000 growers, or just 3.4% of France’s vineyards, and set a standard that is still with us inherited today as an index of champagne legitimacy, and define the monopoly of its “authentic” producers–as well as establish the authenticity of Burgundy, Beaujolais, Bordeaux or Cognac as well as Loire wines: if it is on the map, it authenticated. Yet the notion of such a DOC is distinguished form territorial sovereignty or from recognizable divisions of landscape or space.
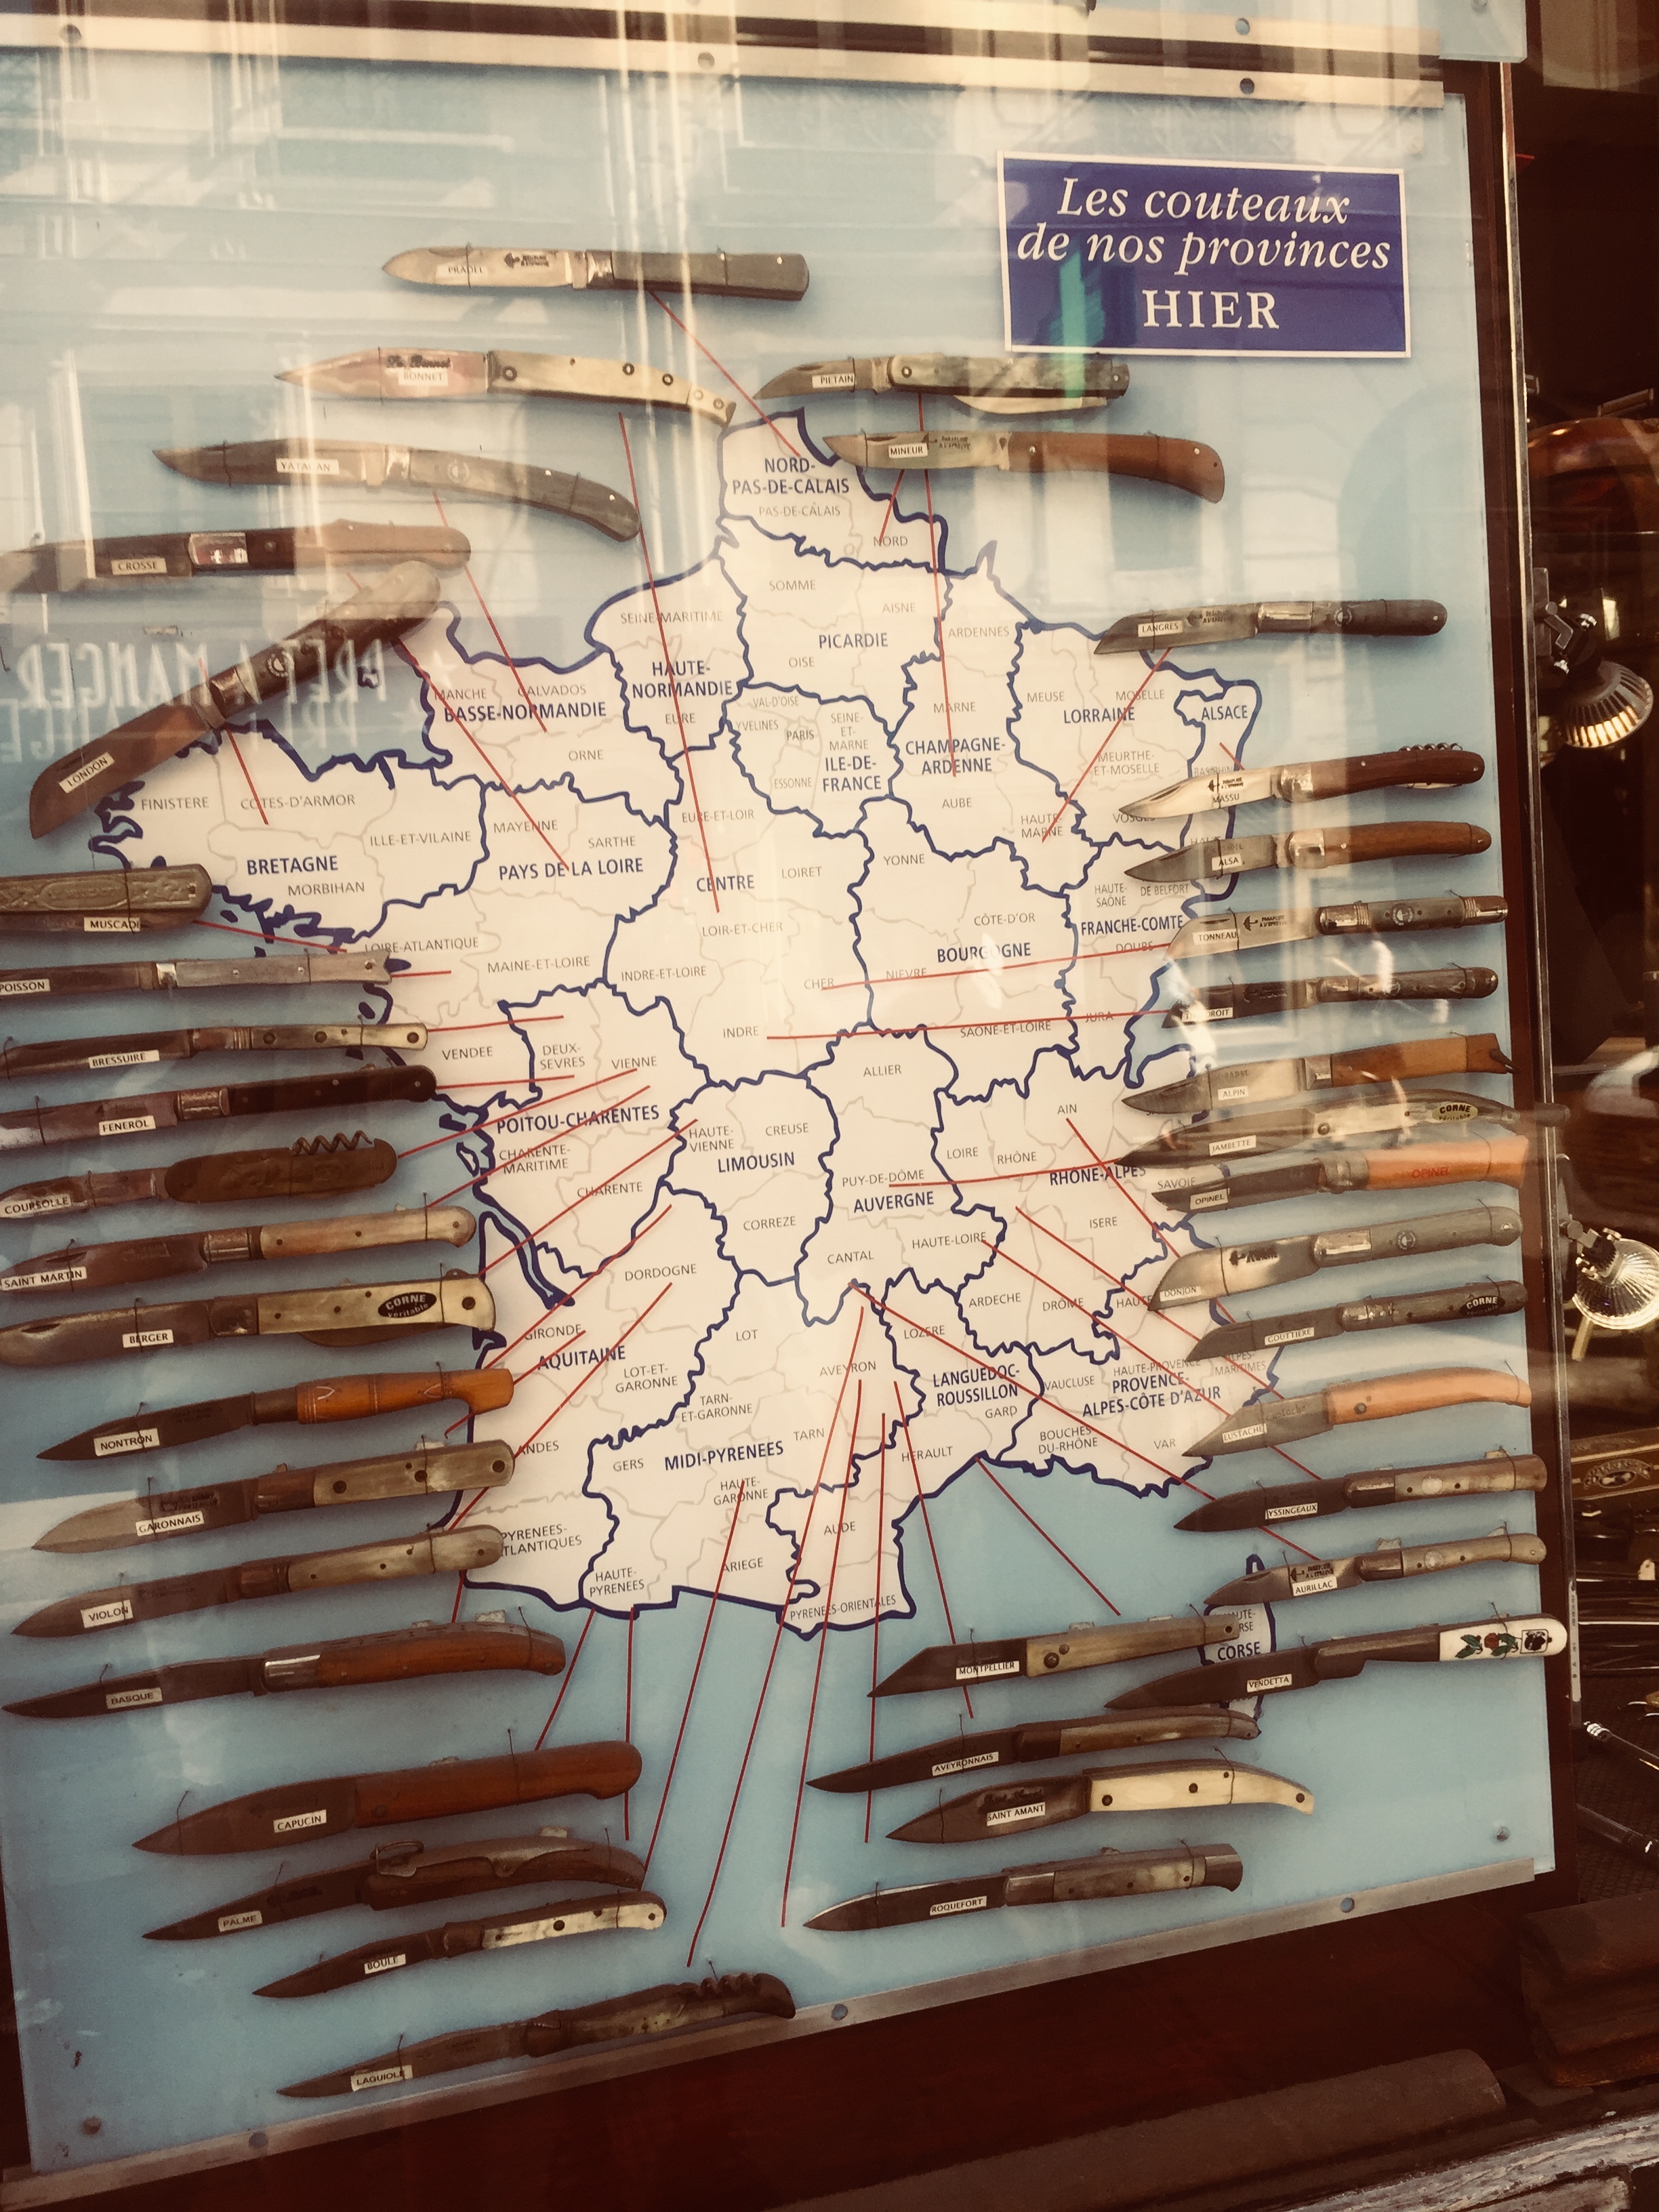
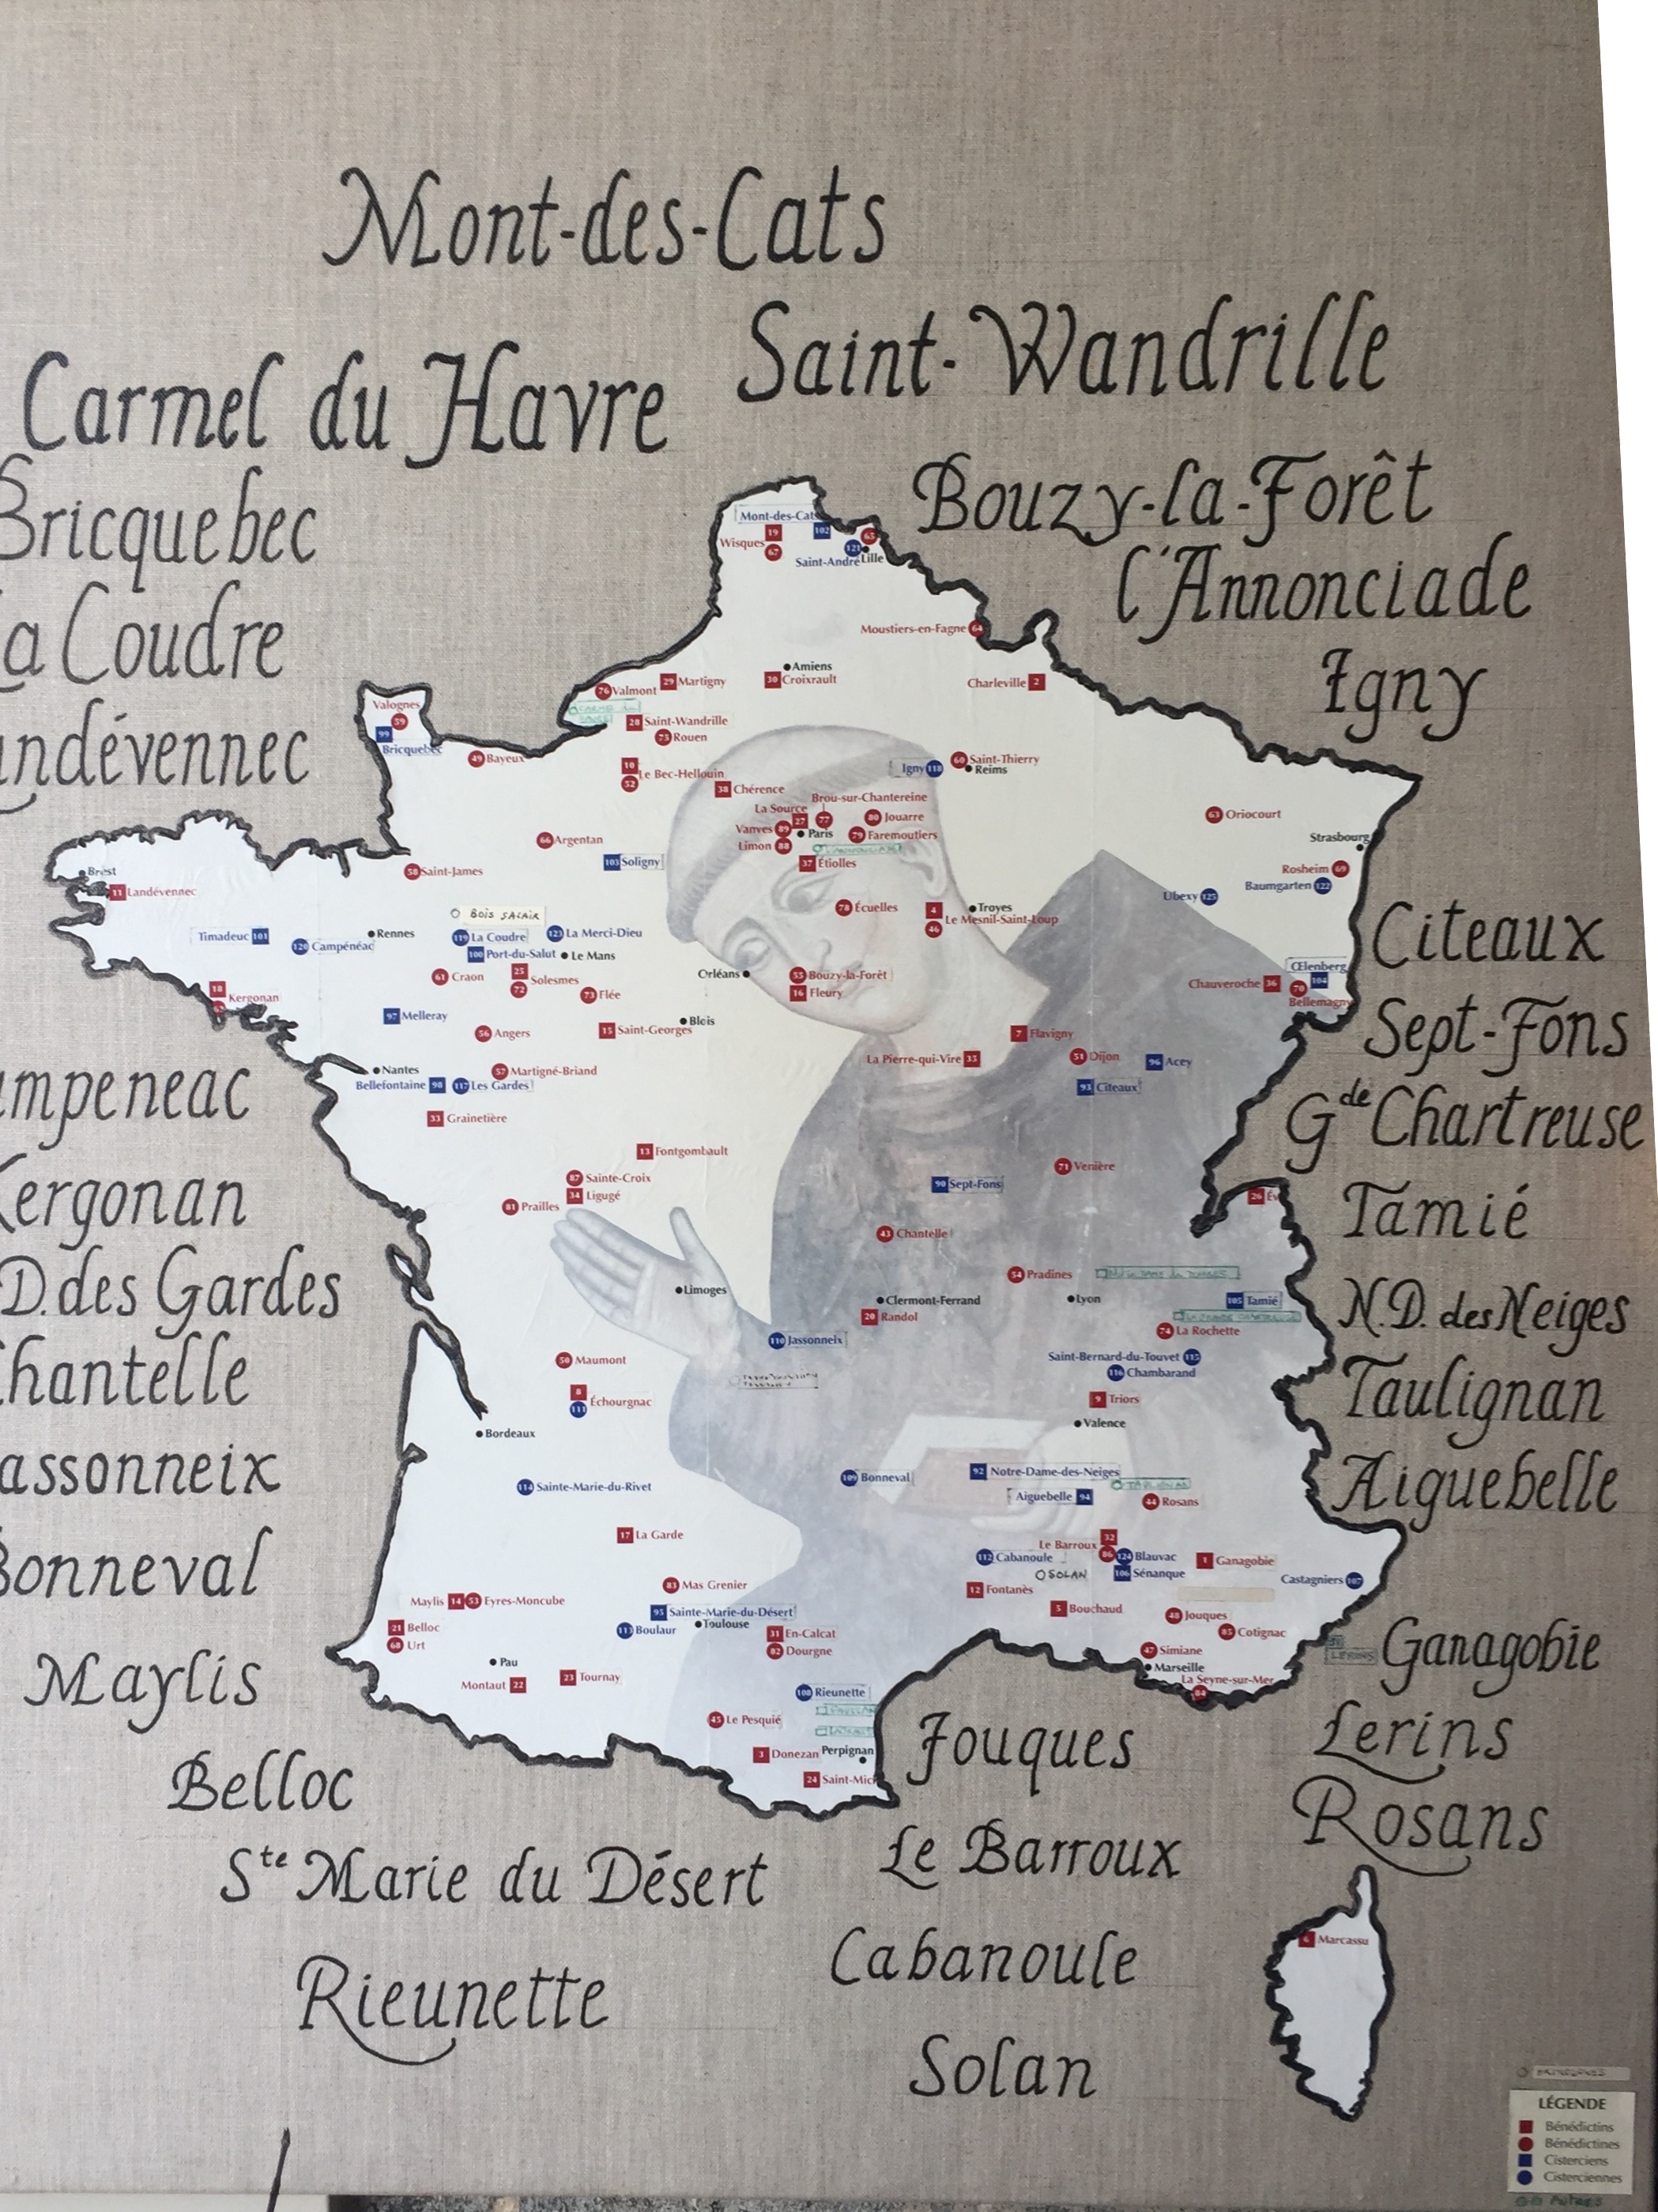
To be sure, in France, the image of a “terroir” is so naturalized within the geographic imaginary, that it can easily depart from the products of the”land” to be a synecdoche of regions, that may extend as a mnemonic of the copiousness of the varied past, as a shorthand for regional differences that extend from local knives–
–to other elements of the past once inherent in the land, such as the old monastic orders–
–more than a mnemonic, the parsing of “terroir” has been scientized, in ways that suggest a purification of regional divisions on the basis of the minerality, air quality, relative moisture, solar exposure and wind patterns, as if the qualities of terroir could be parsed geographically to explain why the water of each region is distinct, and the viticulture the essence of inherent regional differences, whose specificity is to be fetishized on scientific grounds. The varietals of French wines were internalized and standardized on the international markets,
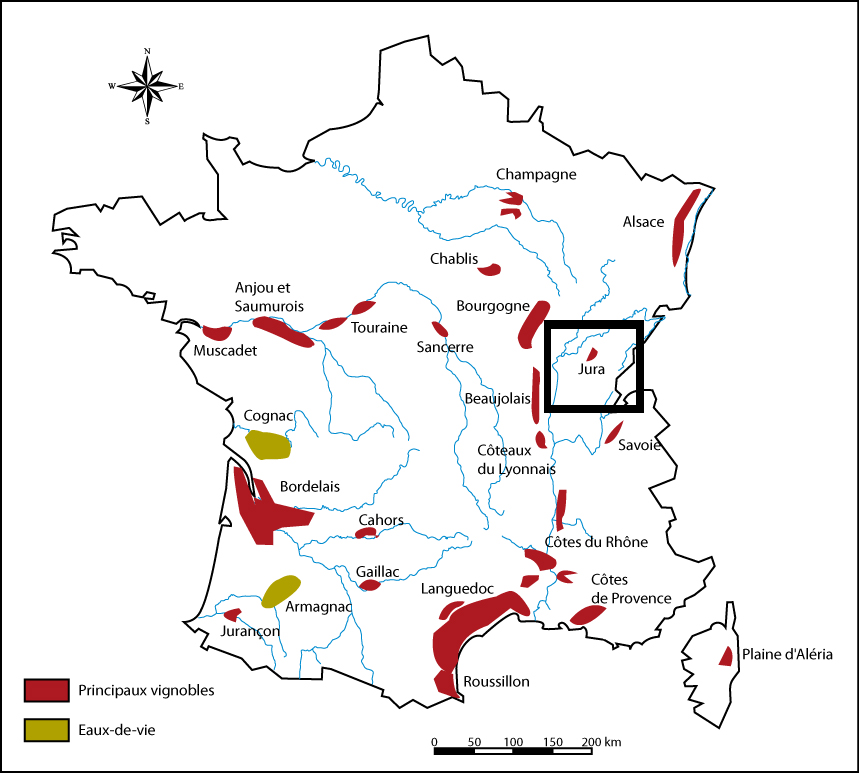
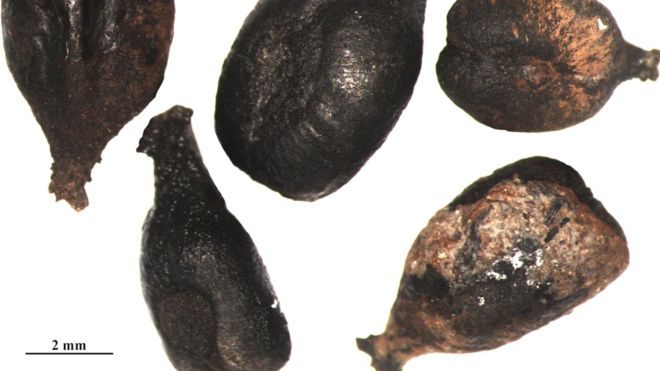
–and increasingly in web maps of wines that allowed customers to click on maps of regional wines to find their specific tastes, and even to read about the DNA links between wines of different regions, to create something like an evolutionary stemma of the relations between regional varietals–Syrah and Pinot Noir, for example, were tied, big surprise, to the same cuttings, and to Savignin Blanc from the Jura region, revealed a genetic database of contemporary grapevines, which also made its way int Central Europe under the name Traminer–suggesting how science may indeed somehow, slightly heretically, trump geography; the research into archeology of wine grapes suggest that the ancient grapes of the Savignin stock arose from domesticated berries, linking twenty eight grape seeds from the Iron Age and Roman era to seeds of wines that were, heresy of heresies, actually imported to the region by the Romans, suggesting the very sort of cross-border mobility and human presence that is often cleansed from the maps of wine varietals that we consult in most shops and wine stores.
But the wine map rooted in myths of regions’ mineralogy, water, sunlight, and climate have produced a parallel resurgence in the intensified regional localism–or localization–of wines, creating a sort of fragmentation of the wine map that absents humans, paradoxically, quite utterly, and privileges the “natural” differences of regions, rather than ties between grape stock, whatever kinship exists between ancient grape seeds that became prized by regions as their own–and as distinguished by the specificities of terroir to make them utterly unique from the wines of their competitors.
In an age when we must look for justification of the unique nature of branding, the demand for cartographical definition of distinction of regions’ wines–and the rights of distinct communities of wine-growers, may trump similarities among the stock of grapes that grow around the region of Reims, for example, from the Vallée de la Marne, Côte des Blancs, and Vallée de l”Ardre. The currant publications of amps may seem a not too bucolic over-abundance of cartographic promotion of localities of wine production and grape-growing regions dividing regions in France from one another to reflect the relative classiness of their profiles of wines, but also are an important way to secure a place in the market for wine producers, and affirm the continued value of the local in the face of globalization.
The objectivity of mapping techniques have come to the rescue to define a sense of territoriality among appellations. Recent advances in statistical mapping and geosciences of course created a far more complex definition of tracing of key qualities in the glasses, which greatly encouraged or facilitated a romance of attachment to local vineyards that was cultivated as much for urban tastes, taken as transparently or accurately translating local knowledge of viticulture to the marketplace in ways that intersected with cartographical practices and skills, even when upsetting usual notions of cartographical continuity.
There has been a huge demand, as a result, to adopt climatological and geomorphological criteria of mapmaking to defend the privileges of being able to use a given name, and invest them with greater objectivity and tangibility–or defend the rights to one’s DOC status, in an age when consumers usually balance limited access to information about vineyards with deep curiosity about identifying the intrinsic qualities of a given wine. Each region has its own geological profile that determined the unique taste and quality of its grapes, full-bodied in the Montagne de Reims plateaux, influenced by limestone topsoil in the Vallée de Marne, whose topsoil is distinguished by chalky layers of Belemnite and Micraster, or Kimmeridgian soil in the Côte des Bar. The definition of such distinctions are increasingly important in a global marketplace for wines, swamped by cheaper if less well-known wines, where the huge range of the scale of prices, often for status conscious audiences, finds many challengers in the growth of low-budget wines.
Clear regional variations of Champagne soils acknowledge the difficulty to essentialize or claim any clear and distinct correlation to minerality or land-type. They balance these, however, with the need to mythologize the practice of restricting practices of viticulture in bounding a regional terroir, in ways that foreground the benefits of the diversity and range of authentic champagne on the basis of regional soils of different geological epochs:
3.. Terroir is of course re-mapped in terms of the experience of of tasting a given wine. A predominance of descriptors are linked to values of minerality in ways that romance the ties of wines to the qualities specific to the earth that nourishes wines. As well as fruits or flora, think of the many descriptive notes that summon the physical characteristic of place that determine individual taste: earthiness; minerality; grassiness; stoniness; crushed rock; chalkiness; crumbliness; gravelliness; paving stones; hints or flavors of slate, schist, or silex–that suggest an un-mediated expression of a region’s geology, as if the taste derived from a geomorphological profile, rather than being judged by the wine-drinker. A simple cross-mapping of viticulture and soil qualities reveals the constructed nature of wine regions, and undermines the terroir map’s naturalization of uniform local geological profile or soil-characteristics: this cross-mapping of viticulture and soil qualities reveals the constructed nature of wine regions, and the constructed nature of any attempt to naturalize regional provenance by a single geological profile.
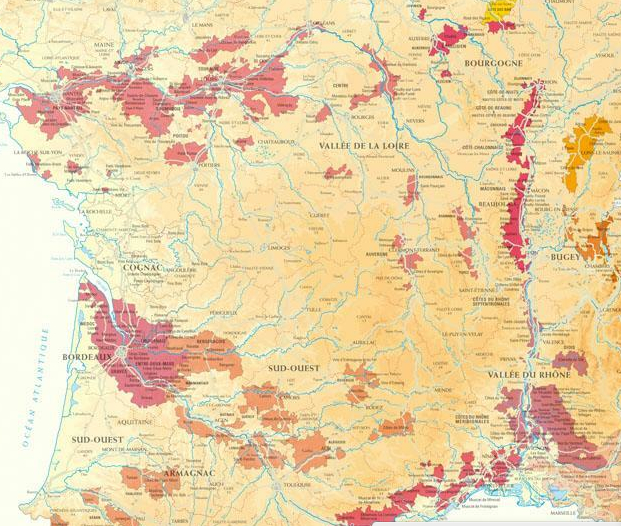
–and the absence of uniformity in the boundaries drawn in maps defining practices of viticulture in such evocative and recognized regions of wine-growing on the banks of the Loire and Rhone:
As in the case of any map, nature is recast as a varieties of expertise. Other factors including wine preparation, grape cultivation, relative humidity, exposure to sun and weather are more determining of taste and quality of the wine than terroir–and those not sold on the identification of wine by terroir alone find cool opportunities in the marketplace for French wines. Terroir is something of an artificial construction on grape-growing on a cluster of fields, that is able to be all too quickly essentialized as an index. Territory is essentialized as an authoritative measure and standard of oenological quality:
Is there a more recent deconstruction or fragmenting of the wine map to the degree to which appears the case, as terroir is affirmed by subdivisions to situate taste in a specific location?
The parsing of terroirs to best express the complex relations of vine and ecological environment has led to a refinement of the simple bounding of a region to a detailed examination of the relationships between soil quality, geomorphology, and the inclination of the slopes of vineyards in the Douro region to better discriminate and region’s DOC criteria, employing a full range of color samples worthy of Kelly-Moore, using a palette of innumerable varietals to distinguish wines’ tastes:
Or of the DO in the Cigalle, the soil map throws into three dimensions an almost plastic record of local geomorphology, here represented at a scale of 1:50,000.
To preserve the complexity of taste-variations within a single terroir, this map discriminates five sub-divisions in a single region’s vineyards:
It is difficult, if not impossible, to effectively rationalize the contributions of different climactic and ecological variants within a region that can be mapped in such transparent ways. And yet the placement of the bottle on the terroir map is a sign of quality, and a reassurance of protection in the marketplace of a substance whose varietals are difficult to substantiate as natural, and whose qualities are impossible to naturalize by provenance; and so we use the map to denote distinction and draw clear differentiation among oenophilic competitors, to draw sharply distinctive origins around riverbanks, across a varied mosaic of geological differences. The mosaic of regional wine differences masks the minimal differences drawn by aromatic descriptors, but surely masks the indeterminate nature of actual data by presenting them as inherent in the region’s micro-climates or micro-ecologies of increasing geographical refinement.
The notion of such protection of local farmers and monopoles on terms are far less rigorously defined, it seems, among the less homogeneous or centrally administered cultures of Italian cities in Tuscany, who have competed against one another to define the propriety of assuming the title of Chianti, albeit by accommodating chianti classico, chianti colli senesi, and chianti from Felsina—
The less official cartographic representation–although this map with an apparent provenance from a wine label seems remarkably detailed.
4. So habitual is the mapping of terroir that the mapping of California wines became a means to invest the grape with a level of distinction and proof that it can hold its own; status is effectively conferred by a recognized coloration of recognized regions of viticulture.
Napa Valley was the first recognized “American Viticultural Area,” in a polemic response to French assertion of terroir by 1981, after years of its popularity and promotion, as if in final response to the denunciation of lack of recognized terroir among California wines. Robert Parker had indeed felt so lambasted by terroirists who “latched onto terroir in the 1970s,” to critique California vintners and wine-promoters for imposing a “bland style” of wines on the world of buttery Chardonnay and bold Cabernet–whose powerful fruits were cast as deracinated without Old World structure. As California wines were cast as the yuppie of global beverages, lacking distinct provenance, the mapping of the state’s wines provided a platform from which to assert their legitimacy. The maps of regions of wine-growing in the Napa Valley had been so widely absorbed an aesthetic of the pastoral by the 1990s as to create a conceptual mapping of the rural vineyard with clear social implications that migrated from tourist maps to popular ephemera.
But the arrival of wine-maps that designate regional appellation afforded an index of taste and a visual charting of tasting that was almost a necessity of marketing in the land of micro-climates. Mapping California terroir spawned a complex variety of mapping a region that, while first confined to Napa and the coasts, rapidly spread over time both into the central valley and far further south than would have been thought possible. Steve and Mark De Long’s “California Wine Map,” sold in its first edition of 2009 as a work of “essential reference” has come to catalogue all the 108 American Viticultural Areas that have been recognized since 1981:
Such maps offer concise arguments for oenological legitimacy–foregrounded above by the inset map of Napa. As aesthetic statements of a wine’s origin, they map nicely onto the recent explosion of taste descriptors–rather than map the local geography in ways that a future vintner would consult–although it is an index to a vineyard’s price: although soil-character is an index for conditions of good viticulture, the vineyard after all precedes the map that places it in a value-system.
The recent explosion of northern California vineyards necessitated re-classification by terroirs–if only to combat the idea that Californian terroir is difficult to establish rigorously, and California wine not equal in authenticity to French, and contain the perfect ecological balance into which to transplant, say, Pinot. In Mendocino, Castle Rock Winery assures us, the wine’s nose is distinguished by “headwaters of the Russian River carve a fertile and rugged landscape” in which the cool springs, crisp falls, and wet winters” for Pinot Noir, made apparent in analogies to the Burgundy region of France where the grapes were first grown. Although multiple factors inflect the taste of the wine as it ages, from the cleaning out of barrels to the quality of the oak or wood, to the spraying of grapes or amount of residue on their skins’ surface, Castle Rock proclaims the source “handcrafted wines from some of the finest appellations on the West Coast: California (Napa Valley, Sonoma County, Carneros, Mendocino County, Monterey County, Paso Robles), Oregon (Willamette Valley) and Washington (Columbia Valley),” linking the wine to the terroir to comply with a code of compact for the consumers benefit by the promise to focus their attention to the selection of regional terroir.
Are the maps of terroir ever of interest to the vintner, or are they as indispensable–and as inevitable–artifacts of the market to the same degree as the combination of 120 florid decriptors in the tasting notes, often designed to manufacture the nose as much as generalize the individual palette?
To be sure, the currency of descriptors of tastes on the market is so confusing that tube-like infographics have gained currency on the market to clarify and open access to the recognized oenological lexicon of aroma descriptors that has been standardized in the food sciences, as if to orient readers to the secret terminology by which to discuss their tastes:
When David Gessen imaginitively transposed tasting routes from a rural setting to an urban iconography for visitors to northern California, he wanted to remind us that he was on his own home turf. He is sure-footed in his visual transposition of wine-tasting routes that attract regional tourism in Northern California and counties around San Francisco to a metro map–the transformation of terroir in California was at first mostly for export, but also increasingly addressed California oenophiles far beyond the francophilic community–and Gissen is on target when he re-charts the major grape varietals of the region in a oenological version of what now appears to be a state-wide BART map, as if to suggest the access to wines Northern California’s many viticultural regions allows. To be sure, the map expanding the service of Bay Area Rapid Transit System to the surrounding region that the actual transit system fails to adequately serve, but blends rural and urban in a range of blends that are designed to be savored:
This is not a wish-fulfillment vision of the expansion of BART tracks to vineyards, however, but a recreation of terroir and a translation into Northern Californian terms. But the map reminds us of the degree to which such maps are about capturing the trust of the consumer, and providing grounds for the common tasting of new wines. The most refreshing aspect of the map is its open-access invocation of public transportation, transposing BART paths to the far more mystifying obscure combinations of regional terroir and aroma descriptors pronounced by the sommelier schooled in such classifications. The map’s detail, exemplified by this section of the Santa Clara Valley, differentiates the proportional percentages of varietals of each region with impressive precision, and casts a progressive wine-tasting on an imaginary sequence of BART stops:
For the map is literally asking us to come along for the ride, inviting us to explore the terroir by well-known paths, lest we lose ourselves in the Napa vineyards along with the busloads of tourists who travel there for wine-tasting every year. The map both mediates and preserves criteria for the elite experience of wine-tasting, and the imagined sacred communion with a select and privileged region that is re-enacted with each glass of wine.
We read more maps than ever before, and rely on maps to process and embody information that seems increasingly intangible by nature. But we define coherence in maps all too readily, without the skepticism that might be offered by an ethics of reading maps that we all to readily consult and devour. Paradoxically, the map, which long established a centering means to understand geographical information, has become regarded uncritically. As we rely on maps to organize our changing relation to space, do we need to be more conscious of how they preset information? While it is meant to be entertaining, this blog examines the construction of map as an argument, and proposition, to explore what the ethics of mapping might be. It's a labor of love; any support readers can offer is appreciated!