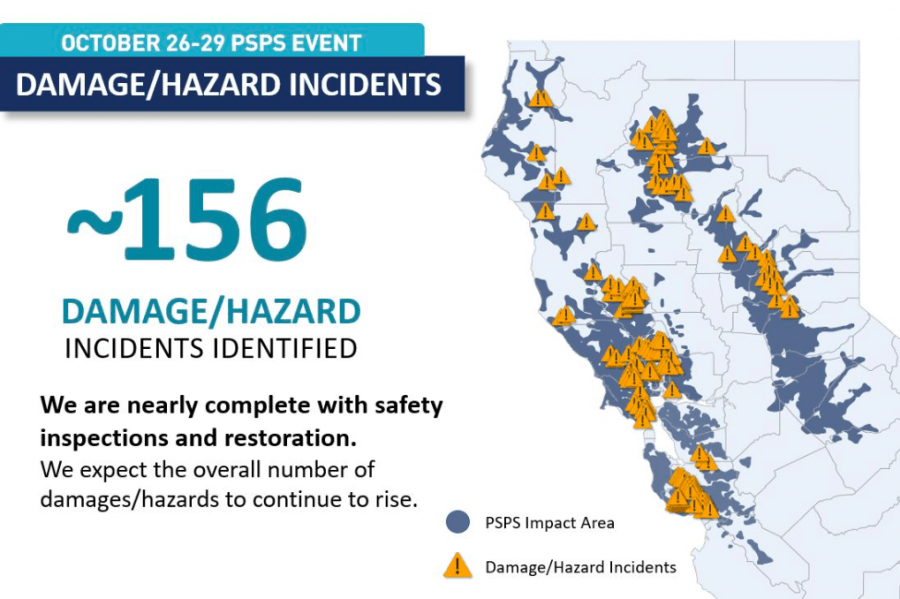
And PG&E provided a map of the fires forestalled by outages, as if to confirm their value for customers after the Public Safety Shut-Offs, that remind us all in the Bay Area how much we are indebted to them in preventing the possible start of fifty six sparking of what they call “wildfires” from the aging infrastructure that they administer.

Indeed, safety inspections after the high winds suggested that the outages had been a sort of controlled experiment for power structures and transmission lines, a stress-test of sort that revealed the clustering of incidents around the very areas that they had mapped, and a density of considerable alarm within the Wildland-Urban Interface on which all eyes have been directed since SILVIS Lab,–much more on them and their visualizations later, although at the end of this lengthy long-brewing post!–had already cautioned that they had identified as an area of risk.
The growing risk of the region of dense housing and inadequate trimming was a region using old wires to send high voltages into new areas of houses often freshly built with poor fire policies. Over in Madison, WI, SILVIS Lab had already cautioned back in 2017 that the huge ecological change of such extra-urban expansion constituted an underappreciated and significant risk, not only for the environment, as it raised problems of forest health and wildlife habitat loss but as its anthropogenic nature posed problems of elevated wildfire risk and indeed of risk without proper escape routes. And when the 2017 fires mapped neatly onto the rise of housing denisty in the Wildland-Urban Interface–WUI–in what was clearly a broad state-wide problem, that a state-wide energy corporation seemed as if it were best to uniformly address, though would be challenged to do so without federal aid if it could retain profitability–and would drain the state of finances if they undertook the mission by making the company public.
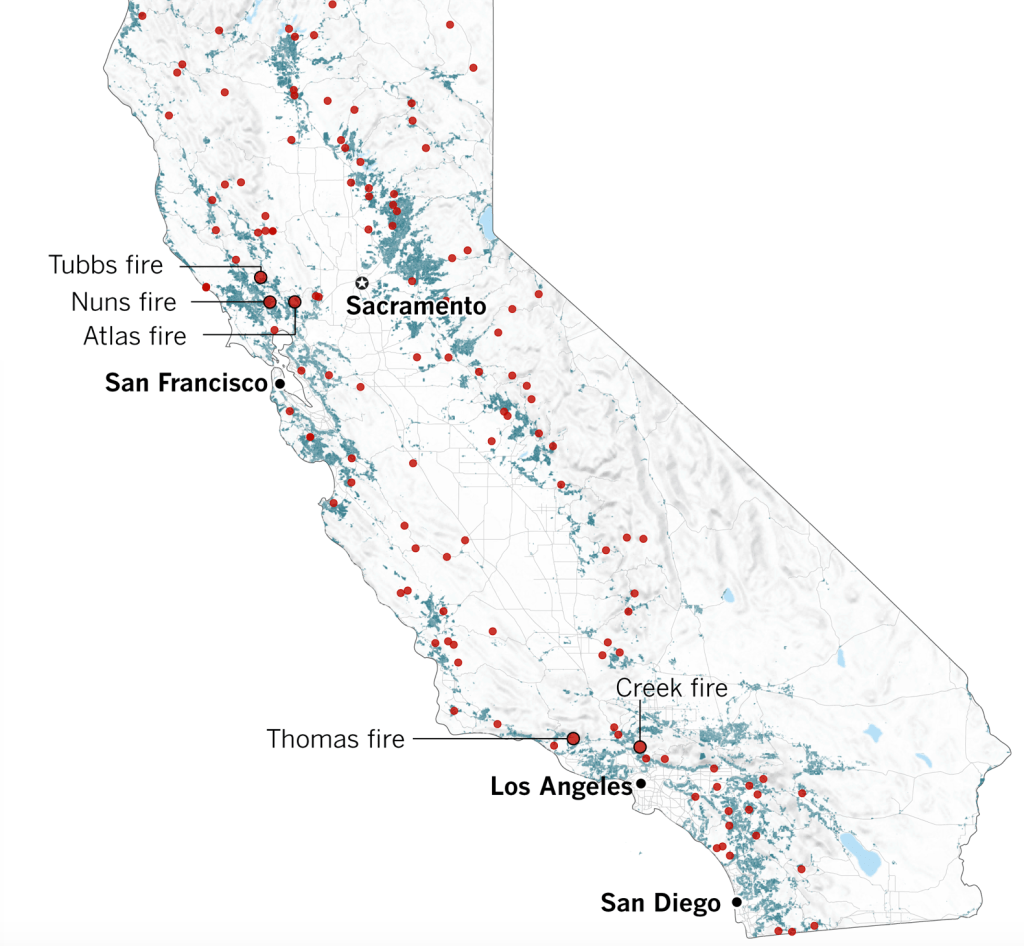
Statewide Fire Distribution as of October 12, 2017

Mapping the spread of fires is usually considered as important for fire fighters, or for home-owners and residents who increasingly have come to expect real-time on-demand fire maps, but the new trigger of electric shut-offs was strikingly, less a transparent or clarifying map than an opaque one, creating such worry that the demand to download maps erased the PG&E servers, even if they were not especially information rich. The sudden demand for new information about maps was frustrated by the lack of clear information in the outage maps, and their lack of easy navigation from our handhelds, or integration with map servers: as PG&E servers crashed, with folks expecting quick answers, cursing the private power agency, and being accustomed to have online responses readily at hand, and maybe less practiced in looking at paper maps as a consequence.


1. It is hard to map the experience of living in an area of high fire risk against the frustrating opacities of outage maps. In the robust but contingent real estate sector of California’s economy, the valuation of land is contingent on fires, a contingency that has been long supressed–or repressed, because the extreme interdependence is not seen as so contingent on global warming and climate change. But as the value of beach-front coastal properties in California may be changed not only by erosion but by sea-level rise, the increasingly great dangers of fire and fire spread expose a delicate pick up sticks construction of the high valuation of houses and land, increasingly closely tied to insurance rates and insurability; the x-ray that the spread of fires created on California’s class society, showing how the wealth, super-wealthy, and rest respond to fires by opting out of public fire-fighting, the fires have exposed uneven nature of home insurance coverage in real estate in fire-prone regions, and even the ability of insurers to close policies and cease to serve areas of the state, as insurers elect to stop covering homeowners in fire zones.
The very regions of wildland-urban interface where Californians have flocked to buy what seemed affordable homes, of lovely scenery, or have been desired areas of habitability, have been removed from fire coverage policies or increased rates in unexpected leaps and bounds that stand to create cascading effects in the economy in areas of significant brush; the rise of “insurer-initiate non=renewals” have created deep scars in the realty market and economy in response to fire severity, leading courts and the State Insurance Commissioner to block their spread to prevent freefall. In ways that have created ongoing fights in the courts about the markets, the low paybacks for destroyed properties and withdrawal of insurance policies stand to create earthquakes that reveal the close tie of the economy to increased dryness and intense groundwater declines–making us more conscious of the need to map our presence in a volatile landscape of extreme climate change as a dramatically uncertain terrain.

The dangers for managing the state’s energy infrastructure far surpass PG&E’s ability to supervise–and that have challenged fire prevention strategies that have been farmed out to state parks, forest services, and national parks, although much of the fires derive from failed transmission lines carrying high voltages from property damages to increasingly populated urban interface.
With dangers ranging from the rapid intensity of fires, the increased number of acres consumed by fire, and possible risks of the airborne dispersal of smoke, and the long-term ecological effects of burnt structures and toxic fumes, or heavy metals leached into soil. The scale of increasing levels of fire risk remain poorly understood, and attributed, so interconnected are they to cascading effects and feedback loops of climate change: intense cuts in groundwater supply due to an absence of rain have changed the landscape of fire management, but in many ways begin from the lack of water in California’s soil, even in greatly wooded areas, that have created drying out landscapes of even greater risk.

MODiS Spectrometry
In such a scenario, the blanketing of regions with energy shut-offs that prevent current running through its electric grid to areas of wildland-urban interface seem the only possible response.
Management of energy infrastructure was became prioritized as threats of high winds this Fire Season sent warnings across the state,–prompting successive alarms of electric shutoffs cascading through the state, sending people to check their addresses on interactive web maps–even if the maps of shut-offs were themselves quite crude–that led PG&E online services to crash, creating even greater panic and uncertainty in the state in what seemed new fault lines where no one knew faults existed.

The new landscape of volatility, or of extra-urban combustibility, is not only a reflection of the drying out terrain of the state or the dry woods, dead leaves, and nearly crisp chaparral, but the real estate maps of extra-urban additions that increasingly jostle next to and beside undeveloped wildland. Pacific Gas & Electric is increasingly creating incursions into these lands, keeping up with the landscape of what seems late capitalism across California. The regular recurrence of “urban interface fires” across California’s fastest-growing communities in extra-urban additions over the past three decades terrifyingly follows a map of real estate extra-urban additions, however–

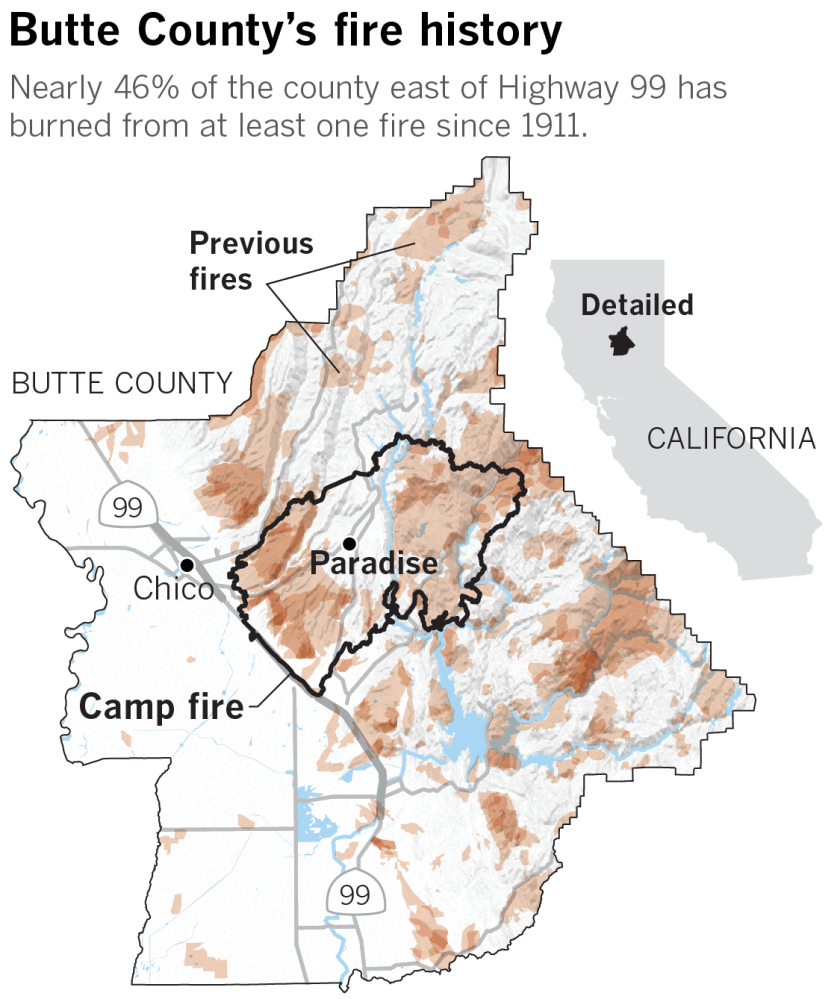
–that has redefined the pyrogreography of the state, and made it into one of the states with the highest probability of burns–three times higher than most other states–and transformed its cities: air quality to among the worst in the nation, radically reframing the question of the habitability of the state–to use an index of medieval geography, as if it were a torrid zone rather than follow familiar geographic indices. There is little way out of it, as the many drivers who sought to flee Paradise, CA, site of the Camp Fire, which became deadliest fire in California history, that continues to haunt the state, both in the real estate, insurance, and energy industry, who, famously, considered shutting off power to the region in a temporary power shut-off, just before the transmission towers that started the fire collapsed under heavy winds peaked just above thirty miles per hour, with gusts above fifty miles per hour.
The results were deadly–but also largely because of how much the maps available to residents mislead. The bulk of the seventy-one people killed as a result of the raging fatalities Camp Fire died as they were directed by GPS maps to drive into the areas of the fire they sought to flee in their cars, by maps that failed to account for fire in indicating drivers the most preferable routes. As transmission towers in the Sierra Foothills fell, as the transmission tower failed at Pulga station near the Poe Dam, and a second, potentially, near Concow Reservoir, both sent sparks into dry brush, but failed to register on traffic maps or GPS, with devastating and deadly results. Can one imagine future lawsuits against poor mapping servers that lead people into burning landscapes in the future?


The fire history of the same region east of Highway 99 is not encouraging, as it bears such tragic traces of increased combustibility.