
Rather than suggest anything like a hi-tech solution, the set of outage maps revealed something like a panicked scribbling over the “wildland-urban interface” where the collapse of live transmission lines were tied to the sparks that began the deadly 2017 North Bay Fires in Sonoma and Napa had destroyed much of Santa Rosa, or the deadlier 2018 Camp Fire, creating a landscape that was still haunted from only last year.
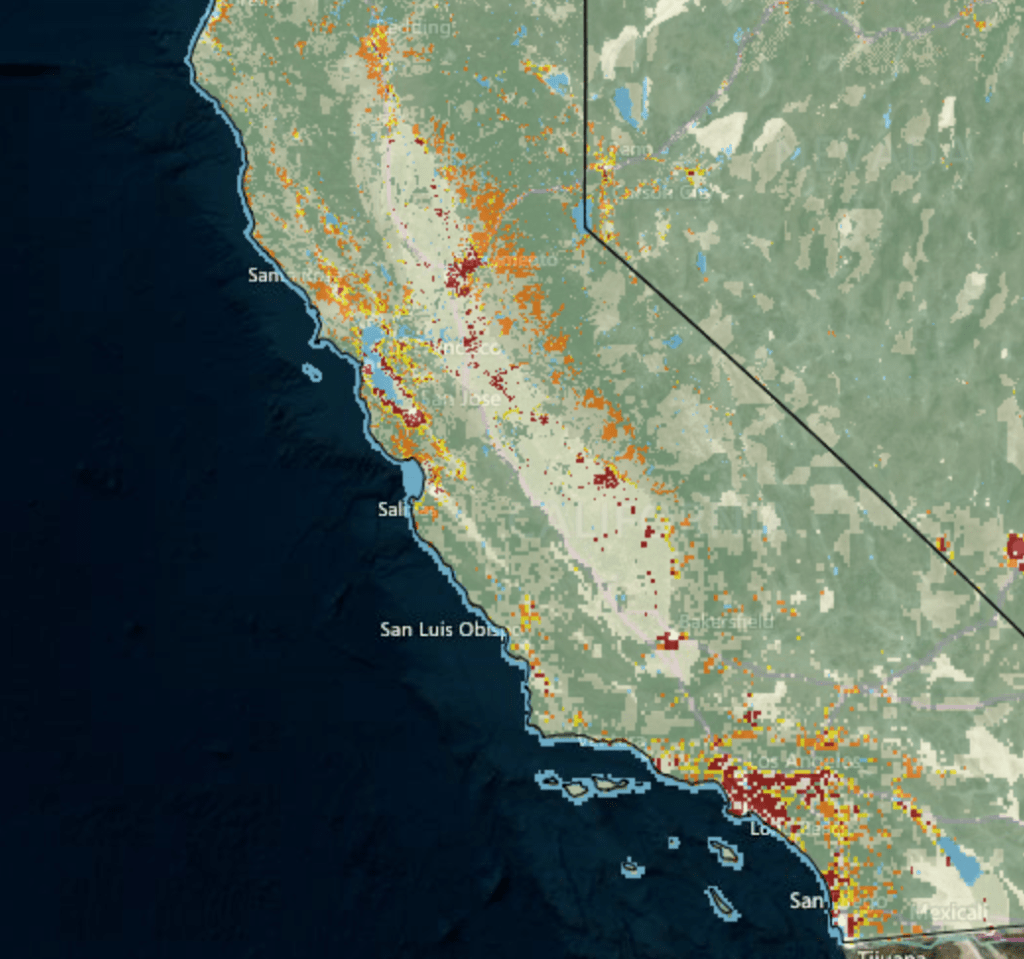
The use of layers and polygons already devised by the University of Wisconsin’s SILVIS Lab, which had already cautioned that the huge ecological change of such extra-urban expansion constituted a significant risk, not only for forest health and wildlife habitat loss but elevated wildfire risk. The rise of risk in California maps onto the 2017 Fire Season with scary precision:

Los Angeles Times/ SILVIS Lab data/Open Street Map
Statewide Fire Distribution as of October 12, 2017
In contrast to the LA Times map that seemed to suggest open source mapping finally coming to the rescue, the images disseminated by PG&E were of a poverty of detail or topographic information that they were hardly able to offer much reassurance to consumers, who only banged on the door of the server with more demands. The maps reflexively triggered, in fact, public protests at the perceived “incompetence” of the local privately-held power company, saddling it with the added charges of corporate “greed,” “over-reach,” and failed stewardship–leading my visiting Canadian cousins to just owner over lox, bagels and coffee why the rational possibility of public ownership wasn’t in the cards. Charges of incompetence led businesses and public institutions to hire or develop their own mapping teams of specialists who might be able to meet their needs, with more understanding of the research projects and government grants on the line–and indeed intellectual capital–that might be disrupted by such sudden power loss.
Could the map provide any reassurances? Or would it only provoke panic? Was its lo-tech appearance an assist to the public trust in the privately held power company, who had done a pretty bad job keeping track of its internal monitoring of gas lines in previous years, and possibly of having gone so far as to falsify its public records of gas line inspection from 2012 to 2017, suggesting that the kooky maps of shut-offs identified as for public safety were to be taken with a grain of salt?

Indeed, the broad expanses of lands that fell between potentially pulled electric outages across the state seemed to trace without much logic the very lines of power that ran along the crests of Wildland-Urban Interface mapped above, as the very transmission lines that served new housing units were targeted for potential electrical shut-offs during high winds.
For the very maps of power shut-offs were, it was clear, a map of the manifold potential routes of fires burning along the Wildland-Urban Interface, where housing density intersects with undeveloped lands, grew rapidly in extra-urban California 1990-2010, a major change in housing patterns that mirror where announced PG&E shut-offs would occur.
SILVIS Lab/University of Wisconsin, Spatial Analysis for Conservation and Stability

If the growth of WUI has emerged across the nation, the sensitivity of WUI as areas of high current was carried above ground in an aging infrastructure of transmission lines and a dry landscape was clear: and the further growth of grasses even as the state drought ended posed terrifying heightened risk of burns.
The growth of WUI meant that, in California, as the risk of fires grew, in ways that meant that even if the numbers of fires in the state was not significantly greater since 1985, the inordinate magnification of financial costs of fires in the last decade, in ways that any one energy corporation could simply never sustain: not only does the building in difficult to access areas on hillsides in extra-urban areas make the sites of fires more difficult to contain, but the rise of building of new housing units in the potential paths of fires makes their outbreak more difficult to contain.

And the terrifying multiplication of fires in Southern California, also managed by PG&E, between Los Angeles and San Diego from 2000-2015, in ways that are clustered on the edges of mega-urban areas, but far outstrip the abilities of local firefighters–
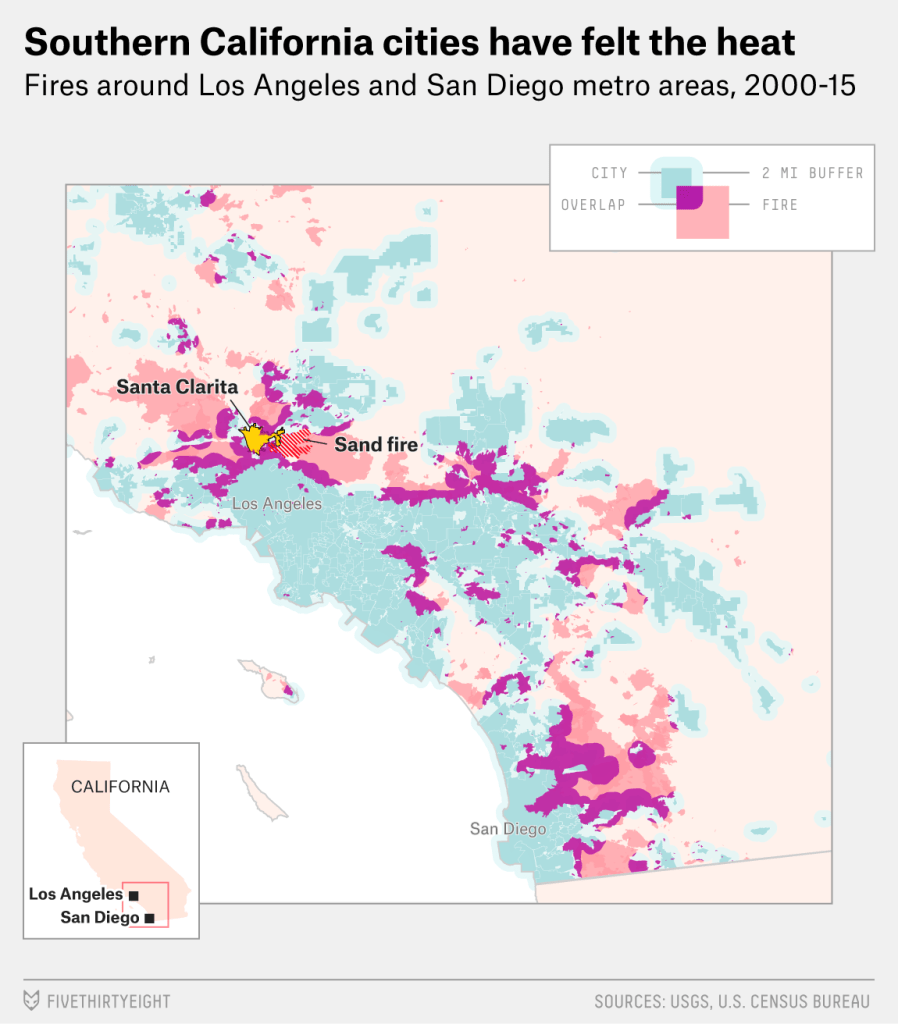
FiveThirtyEight/USGS, U.S. Census Bureau
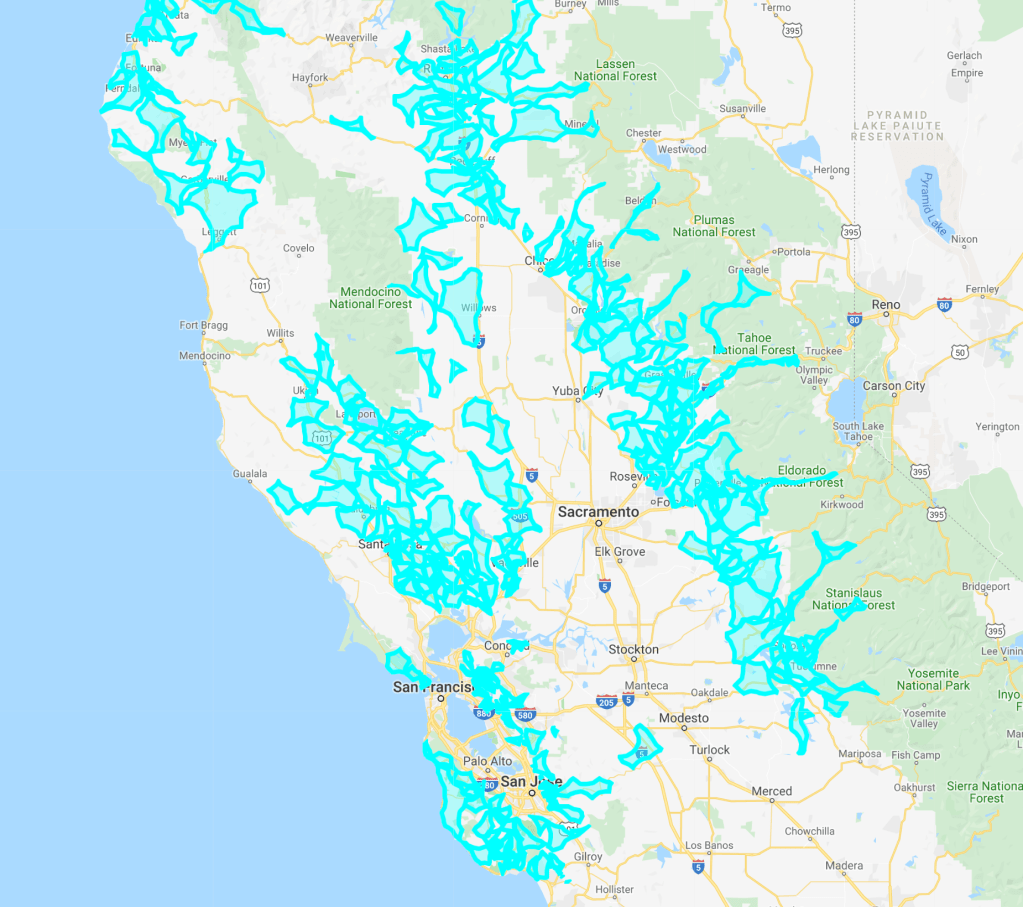
minor the growth of similar fires, nested outside of cities, in Northern California, of even greater ferocity, since 2015, made with Silvis Labs data, to rev eat the terrifying tinderboxes that WUI posed–
Los Angeles Times/ SILVIS Lab data/Open Street Map
Statewide Fire Distribution as of October 12, 2017
The less rarely told story, however, links the fires not to settlement alone, but to the massive rise of tree mortality, created by the California Chaparral Institute, that suggests the deep unsustainability of continuing to crowd housing in extra-urban areas where extremely high levels of tree morality, here measured in dead trees per acre, often ranging as high as forty per acre, created a true tinderbox inappropriate for new housing.

The “official” maps were, oddly, silent on this distribution, which suggested the layers of mismanagement of a public good as a result of broad mortality of trees, overbuilding, and the introduction of electric current in areas where tinder was ready to burn just two years ago, which make so little sense when imposed upon the state as disembodied symbols or polygons, isolated from the overly dry environment of the state.


The huge expanse of potential “Public Safety” interventions masked the frailty of an energy corporation whose debts were so enormous whose actual assets worth less than the liabilities they would face before the spread of a comparable fire, or costs of insurance for the damages of customers at a time when the corporation had already been placed in the corporate equivalent of receivership: the warning issued by judges as part of their bankruptcy settlement mandated responsible control over power lines, cutting of trees whose limbs lay dangerously close to live power lines, and a sense of responsibility that indeed outstripped any corporate ethos Judge William Alsup had decreed after the Camp Fire that PG&E was “the single most culpable entity in the mix” in the current “crisis that California faces on these wildfires,” after having set criminal sentences against PG&E after the San Bruno gaslaines had exploded in 2010, and attempted to conceal its role in the deadly blaze that kllled eight, leading Alsup to chastise the energy corporation he felt failed to prioreitize safety as “your No. 1 thing,” despite the massive energy lines and gas mains it oversaw across the state.

The crisis of climate change had not been addressed since San Bruno, and problems of vegetation management, supervision of transmission lines, power stations, and . Attorneys who brought suit the company for huge damages from the Camp Fire and North Bay Fires eagerly listened, happy that something was being done, and seeming to create a sense of resolution to the huge psychic trauma and tragedy that the winter would somehow bracket. But if the utility company was effectively able to bounce back to the heights of its stock back in 2017, the sense of corporate malfeasance seems to replace the new terrain of wildfires’ spread.
To be sure, the nation-wide expansion of woodland-urban interface on the national front suggests a changing ecological profile, and end of buffers of open space. The radical rethinking of open spaces on the national front, as the conservation scholars at Silvis Lab has suggested–

But the specific dangers that the interface poses in a parched land of many unprotected or aging infrastructure difficult to support increased demand for electric charge. Indeed, the costs of wildfire on national energy reserves suggests a new danger in the spread of fire risk, given their proximity to areas of high fire risk, rarely tallied in the the costs of fires, public health impacts, or unimagined compounded dangers of fire prevention in a state with many natural gas pipelines, and significant oil and gas reservers close to fires’ increasing radiative power.


